DRAFT PREPARED FOR: VDOT ENVIRONMENTAL DIVISON PREPARED BY: MICHAEL BAKER INTERNATIONAL IN ASSOCIATION WITH: SC&A INC. KB ENVIRONMENTAL SCIENCES, INC.
|
|
|
- Herbert Washington
- 6 years ago
- Views:
Transcription


1 DRAFT Transform I-66 Outside the Beltway Tier 2 Environmental Assessment STATE PROJECT NO. : A-297 UPC: PREPARED FOR: VDOT ENVIRONMENTAL DIVISON PREPARED BY: MICHAEL BAKER INTERNATIONAL IN ASSOCIATION WITH: SC&A INC. KB ENVIRONMENTAL SCIENCES, INC.
2 Table of Contents Executive Summary Introduction Project Description Existing Conditions Regulatory Requirements and Guidance National Environmental Policy Act of 1969 (NEPA) Clean Air Act Mobile Source Air Toxics (MSATs) and FHWA Guidance MOVES Carbon Monoxide Analysis Traffic Summary Information CO Receptor Locations: Signalized intersection and Mainline Modeling Inputs Screening Analysis of Major Interchanges Overview of Interchange CO Screening Process Project Opening and Design Years Emission Factors Modeling Scenarios No-Build Scenarios Traffic Volumes for the Modeled Scenarios Dispersion Modeling Inputs Results of CO Interchange Screening Analysis Summary of Worst-Case Assumptions Particulate Matter (PM) PM Regulations & Overview Interagency Consultation Focus of Capacity Increases Trends in Background PM 2.5 Concentrations Associated Transit Emissions Expected Year of Peak Emissions Summary and Final Recommendation by the Virginia Interagency Consultation Group Mobile Source Air Toxics Analysis MSAT Background Motor Vehicle Emissions Simulator (MOVES) MSAT Research Project Quantitative MSAT Analysis : Incomplete or Unavailable Information for Project-Specific MSAT Health Impacts Analysis MSAT Conclusions Construction Emission Analysis Regional Conformity Status of the Project Indirect and Cumulative Effects Conclusions /11/2015 Page i
3 Table of Contents Continued Appendices Appendix A: PM Peak Traffic Volumes Used in CO Analysis Appendix B: Sample MOVES2014 Data Appendix C: Sample CAL3QHC Input/Output Files Appendix D: CAL3i Input/Output for Interchange Analyses Appendix E: Sample CALINE3 Input/Output Generated Using CAL3i Appendix F: Refined Traffic Forecasts for I-66 Mainline Appendix G: Refined Truck Forecasts at I-495 and VA 28 Interchanges Appendix H: Interagency Consultation Meeting Minutes and Presentation Appendix I: List of Assumptions Used in the Air Quality Modeling Appendix J: Memorandum on CO Background Concentration for Project-Level Air Quality Modeling Appendix K: Peak CAL3QHC CO Concentration Estimates All Receptor Locations List of Tables Table 1: National Ambient Air Quality Standards... 8 Table 2: PM Peak Hour Volumes at Intersections Table 3: Inputs to MOVES Table 4: CAL3QHC Worst-Case Inputs Table 5: Maximum Potential CO Concentrations (ppm) Table 6: MOVES Developed CO Emission Rates Table 7: Comparison of Forecast Traffic Volumes and Worst-Case Volumes Applied for CO Screening Analysis Table 8: CAL3QHC/CALINE3 Worst-Case Inputs Table 9: CO Interchange Results Using CAL3i Table 10: Key Decisions on Quantitative Methods and Data for PM Hotspot Analysis Table 11: 2013 Traffic Data Table 12: Project Impacts on Truck Volumes Table 13: Air Quality Monitor Readings in Vicinity of I-66 Corridor Project Table 14: Inputs to MOVES2014 for MSAT Analysis Table 15: Annual MSAT Emissions by Year, Scenario and Pollutant Table 16: Change in Annual MSAT Emissions by Year, Scenario and Pollutant from No-Build and from Existing Emissions /11/2015 Page ii
4 List of Figures Figure 1: I-66: Haymarket to I-495 Capital Beltway Project Location... 4 Figure 2: Typical Cross Sections for Alternatives... 6 Figure 3: Air Quality Modeling Receptors (1) Figure 4: Air Quality Modeling Receptors (2) Figure 5: Air Quality Modeling Receptors (3) Figure 6: Air Quality Modeling Receptors (4) Figure 7: Air Quality Modeling Receptors (5) Figure 8: Air Quality Modeling Receptors (6) Figure 9: Air Quality Modeling Receptors (7) Figure 10: Air Quality Modeling Receptors (8) Figure 11: Air Quality Modeling Receptors (9) Figure 12: Air Quality Modeling Receptors (10) Figure 13: Air Quality Modeling Receptors (11) Figure 14: Air Quality Modeling Receptors (12) Figure 15: General Trends in PM 2.5 Emissions Rates for Heavy Duty Figure 16: MSAT Affected Network - Volume Increase/Decrease Figure 17: MSAT Affected Network - Speed Increase/Decrease Figure 18: MSAT Affected Network Exhibits Exhibit A: National MSAT Emission Trends for Vehicles Operating on Roadways Using EPA's MOVES 2010b Model /11/2015 Page iii
5 Executive Summary The Virginia Department of Transportation (VDOT) and Department of Rail and Public Transportation (VDRPT) are undertaking an effort to transform 25 miles of I-66 into a multimodal facility that moves traffic and people more efficiently, with improvements such as express lanes, rapid bus service and an expanded park-and-ride network, from the Capital Beltway to Haymarket. Two build scenarios are under consideration: Alternative 2A, which has a median reserved for a future transit extensions, Alternative 2B, which has the median reserved in select areas only, and a reduced number of ramps at the I-495 and Route 28 Interchanges. The project is located in Fairfax and Prince William Counties, which have been designated by the US Environmental Protection Agency (EPA) as non-attainment for the eight-hour ozone national ambient air quality standard (NAAQS), maintenance for the annual fine particulate matter (PM 2.5 ) NAAQS, and attainment for the CO NAAQS. Transportation conformity requirements therefore apply for PM 2.5 and ozone, and project-level modeling assessments pursuant to the National Environmental Policy Act (NEPA) apply for carbon monoxide (CO). The proposed improvements were assessed for potential air quality impacts and conformity with applicable air quality regulations and requirements. The assessment indicates that the project would meet all applicable air quality requirements of NEPA and federal and state transportation conformity regulations. As such, the project will not cause or contribute to a new violation, increase the frequency or severity of any violation, or delay timely attainment of the NAAQS established by EPA. For conformity purposes, the project was evaluated for potential fine particulate matter impacts following the latest applicable guidance from EPA. On review of the available information, data and forecasts assembled for the project, and in consultation with FHWA staff, it was proposed that the project be advanced and presented to the Virginia Interagency Consultation Group (VA-ICG) as not being one of local air quality concern for PM 2.5 for several reasons: The project intent is to maximize passenger throughput, and not truck traffic. Minimal increase in truck traffic/emissions are expected as a result of the project. The highest bi-directional diesel truck volumes are much less than the effective total of 10,000 from EPA guidance example for a new highway. Insignificant changes in emissions from diesel transit vehicles are expected. Planned improvements for I-66 Inside the Beltway (where truck prohibitions apply) would have limited effect on diesel truck or bus traffic for this project (Outside the Beltway). Background PM 2.5 concentrations well below the NAAQS & declining. Emission rates for diesel vehicles are declining fleet-wide over time. EPA has proposed to revoke the applicable NAAQS for PM, potentially making PM project level conformity considerations unnecessary in the near future for this region. The VA-ICG met on March 30th, 2015 to review available information for the project. After consideration of the project scope, traffic forecasts, background concentrations, trends in emission rates, and other related data and information as presented above, the VA-ICG concurred with the assessment by the Department that the project is not one of local air quality concern for PM 2.5. A detailed quantitative assessment of potential PM 2.5 impacts is therefore not required for this project. 5/11/2015 Page 1
6 For NEPA: Carbon Monoxide (CO): A quantitative CO hot spot screening analysis was performed for the project following federal guidance for the project opening (2022) and design (2040) years. The modeling was conducted with EPA models for emissions (MOVES2014) and dispersion (CAL3QHC and CALINE3), with the dispersion modeling facilitated in part with the FHWA CAL3i interface model. Modeling was conducted for the I-66 corridor, two interchanges (I-66 with I-495, and I-66 with Route 28), and a highly congested major intersection (Leesburg Pike & Idylwood Road) that was selected following a review of the most congested intersections in the project area. Modeling for each of the two major interchanges was conducted using worstcase assumptions for traffic and facility configurations (with traffic and emissions combined in a single grade separation rather than broadly dispersed over ramps), receptor locations based on the minimum right-of-way distances, and other worst-case inputs. The results for all of the analyses (corridor, intersection and interchanges) show that CO concentrations for all Build scenarios are expected to remain well below the CO NAAQS for all locations modeled throughout the corridor for each year modeled. Based on the modeling results, implementation of the project is not expected to cause or contribute to a violation of the CO NAAQS. Mobile Source Air Toxics (MSATs): Based on FHWA guidance and the forecast total traffic volumes for I-66, this project is categorized as one with high potential effects for MSATs, which include the following: acrolein, benzene, 1,3 butadiene, diesel particulate matter, formaldehyde, naphthalene, and polycyclic organic matter. A detailed quantitative assessment (modeling) following FHWA guidance was therefore conducted for the project to assess the potential impacts for MSATs. The assessment shows that there would be no long-term adverse impacts associated with either Build scenario and that future MSAT emissions across the entire study corridor would be significantly below today s levels, even after accounting for projected VMT growth. More specifically, the modeling results indicate that MSAT emissions are expected to increase slightly from the No Build to the two Build scenarios in both 2022 and 2040, but the increases are small and insignificant in comparison to the long-term downward trend in MSAT emissions over time. Emissions of all MSATs under the 2022 and 2040 Build scenarios are in fact expected to be significantly lower than they are today, primarily as a result of EPA's stringent vehicle emission and fuel regulations that, with fleet turnover, are expected to result in significantly lower fleet-average emission rates for MSATs in the future relative to today. Overall, best available information indicates that, nationwide, regional levels of MSATs are expected to decrease in the future due to fleet turnover and the continued implementation of more stringent emission and fuel quality regulations. Nevertheless, it is possible that some localized areas may show an increase in emissions and ambient levels of these pollutants due to locally increased traffic levels associated with the project. Indirect Effects and Cumulative Impacts: Indirect effects are those effects that would be caused by the project but occur later in time or are removed in distance from the project. Cumulative effects are those effects that result from the incremental impact of the action when added to other past, present and reasonably foreseeable future actions. Cumulative effects include indirect effects. Federal conformity requirements, including specifically 40 CFR and 40 CFR , apply as the area in which the project is located is designated as nonattainment for ozone and maintenance for fine particulate matter. Accordingly, there must be a currently conforming transportation plan and program at the time of project approval, and the project must come from a conforming plan and program (or otherwise meet criteria specified in 40 CFR (b)). The 5/11/2015 Page 2
7 annual conformity analysis conducted by the Transportation Planning Board (MPO for the Washington, D.C. metropolitan nonattainment/maintenance area) represents a cumulative impact assessment for purposes of regional air quality. The existing air quality designations for the region are based, in part, on the accumulated mobile source emissions from past and present actions, and these pollutants serve as a baseline for the current conformity analysis. That conformity analysis quantifies the amount of mobile source emissions for which the area is designated nonattainment/maintenance that will result from the implementation of all reasonably foreseeable (i.e. those proposed for construction funding over the life of the region s transportation plan) regionally significant transportation projects in the region. It is anticipated that the conformity analysis currently being conducted will demonstrate that the incremental impact of the proposed project on mobile source emissions, when added to the emissions from other past, present, and reasonably foreseeable future actions, is in conformance with the SIP and will not cause or contribute to a new violation, increase the frequency or severity of any violation, or delay timely attainment of the NAAQS established by EPA. Therefore, the indirect and cumulative effects of the project are not expected to be significant. Key considerations for project implementation include: Emissions may be produced in the construction of this project from the use of heavy equipment and construction activities themselves may be a source of fugitive particulate matter. Construction emissions and impacts are short term or temporary in nature. In order to mitigate these emissions and impacts, all construction activities will be performed in accordance with VDOT Road and Bridge Specifications 1. Comments from the Virginia DEQ indicate that Fairfax and Prince William Counties are also a volatile organic compounds (VOC) and nitrogen oxides (NO X ) Emissions Control Area. As such, all reasonable precautions should be taken to limit the emissions of VOC, NO X, and particulate matter. In addition, the following VDEQ air pollution regulations must be adhered to during the construction of this project: 9 VAC 5-130, Open Burning restrictions; 9-VAC et seq., Cutback Asphalt restrictions; and 9 VAC 5-50, Article 1, Fugitive Dust precautions. 1 See 5/11/2015 Page 3

8 1.0 Introduction The Virginia Department of Transportation (VDOT) and Department of Rail and Public Transportation (VDRPT) are undertaking an effort to transform 25 miles of I-66 into a multimodal facility that moves traffic and people more efficiently, with improvements such as express lanes, rapid bus service and an expanded park-and-ride network, from the Capital Beltway to Haymarket. The location and extent of the overall project corridor is shown in Figure 1. The purpose of this air quality report is to identify any potential air quality impacts that may result from the proposed project and ensure compliance with all applicable air quality regulations Figure 1: I-66: Haymarket to I-495 Capital Beltway Project Location Source: VDOT Presentation January/February Air quality became a national concern in the 1960s, leading to the passage of the Clean Air Act of This was followed by the Air Quality Act of 1967, the Clean Air Act of 1970, the Clean Air Act Amendments of 1977, and the Clean Air Act Amendments of With the passage of each piece of legislation, requirements for addressing and controlling air pollution became more stringent. Following the passage of the Federal Clean Air Act Amendments of 1990, states were mandated to implement additional steps to reduce airborne pollutants and improve local and regional conditions. Automobile emissions have been identified as a critical element in attaining federal air quality standards for carbon monoxide (CO), course and fine particulate matter (PM 10 and PM 2.5 ), and ozone (O 3 ). For this project compliance is required with both the National Environmental Policy Act (NEPA) and the Clean Air Act (CAA). Highway agencies are required to consider the impacts of transportation improvement projects at both the local and regional level. Regional air quality in non-attainment and maintenance areas is assessed by ensuring that region-wide mobile source emissions fall below the 2 Presentation can be found at: 5/11/2015 Page 4
9 applicable motor vehicle emission budgets identified by the State Implementation Plan (SIP). Where applicable, this assessment is performed by the Virginia Department of Transportation (VDOT) and/or Metropolitan Planning Organizations (MPOs) and documented in a transportation conformity analysis of the region s Transportation Improvement Program (TIP) and Long Range Transportation Plan (LRTP). This project lies within an area designated as non-attainment for the 8-hour ozone standard and maintenance for the 1997 annual fine particulate matter (PM 2.5 ) standard therefore; the project is subject to applicable transportation conformity requirements. Compliance with the CAA will account for air quality impacts at the regional level. NEPA, which generally requires that the impacts of an action on the environment be considered before any final decisions are made, serves as the basis for assessing air quality impacts at the project level. Accordingly, a micro-scale analysis evaluating peak CO concentrations at the project level has been performed. CO is a colorless, odorless, poisonous gas considered to be a serious threat to those who suffer from cardiovascular disease. High concentrations of CO tend to occur in areas of high traffic volumes or areas adjacent to a stationary source of the pollutant. CO emissions are associated with the incomplete combustion of fossil fuels in motor vehicles and are considered to be a good indicator of vehicle-induced air pollution. In addition to CO, EPA also regulates air toxics, which are pollutants known or suspected to cause cancer or other serious health effects. Mobile source air toxics (MSATs) are compounds emitted from highway vehicles and non-road equipment. Although there are no ambient air quality standards or transportation conformity requirements for MSATs, MSATs are within the broader purview of NEPA because they have been shown to contribute to health risks, especially for populations in proximity to major roadways. EPA has identified the following MSATs as having the greatest impact on health: benzene, acrolein, formaldehyde, 1,3-butadiene, diesel exhaust, naphthalene, and polycyclic organic matter. FHWA has issued guidance for considering the impact of MSATs from transportation projects during the NEPA process. This report provides documentation of the air quality assessments that have been performed to determine whether this project meets all NEPA and CAA requirements. 2.0 Project Description The I-66 Outside the Beltway project seeks to transform one of Northern Virginia s major freeways into a multi-modal corridor that moves traffic and people quicker and in a more reliable way. VDOT and VDRPT are actively evaluating improvements that would provide added capacity, and new options with more predictable travel times. Currently along I-66, between I-495 and Route 15 there are up to 3 general purpose travels in each direction. In addition, there is a single HOV lane in each direction that exists in certain sections. Finally during peak hours (eastbound only in the AM, westbound only in the PM) the shoulder, which is currently painted red with overhead lane usage signals, may be used as a travel lane east of Lee Jackson Memorial Highway/US 50. Under the proposed plan, I-66 would be improved to provide: Three regular lanes in each direction These lanes will accommodate all traffic types and will include improvements to interchanges and merge areas throughout the corridor. Two express lanes in each direction These lanes will be available free-of-charge to carpools with 3 or more occupants having the required E-ZPass Flex transponder. Additionally personal vehicles and small (light duty) commercial vehicles will be able to use the lanes by paying a toll that corresponds to the time 5/11/2015 Page 5

10 of day and local conditions. Tolling will be priced to ensure that the lanes remain congestion free. High-frequency bus service with predictable travel times Publicly run and contracted buses will also be accommodated on the express lanes, leading to faster travel times. New bus services are envisioned as being destination oriented, providing service to suburban employment centers not currently well served by transit. Existing transit services operating on I-66 connecting to the Washington METRO system will also use the express lanes. Direct access between the express lanes and new or expanded commuter lots These access points will be for both carpool participants and, at some locations, limited parkand-ride bus services. Two alternatives have been identified and are being progressed through the environmental review process. Each alternative will consist of two express lanes and three general purpose lanes. The express lanes will be tolled similar to other express lanes in the region. The main difference between the alternatives consists of the use of the median. As shown in Figure 2, Alternative 2A has a median reserved for a future transit extensions, while Alternative 2B has the median reserved in select areas only, and a reduced number of ramps at the I-495 and Route 28 Interchanges. Figure 2: Typical Cross Sections for Alternatives 3.0 Existing Conditions The proposed project is located in northern Virginia in Fairfax and Prince William Counties. The area is best categorized as a humid subtropical climate that averages approximately 43 inches of precipitation per year. The average daily high temperature in July is 90 degrees Fahrenheit while the average daily low temperature in January is 22 degrees Fahrenheit. 5/11/2015 Page 6
11 4.0 Regulatory Requirements and Guidance This section provides an overview of regulations and guidance applicable to the project-level air quality analysis to support the environmental review of the project. 4.1 National Environmental Policy Act of 1969 (NEPA) Under NEPA, federal agencies must consider the effects of their decisions on the environment before making any decisions that commit resources to the implementation of those decisions. Changes in air quality, and the effects of such changes on human health and welfare, are among the effects to be considered. A project-level air quality analysis has been performed to assess the air quality impacts of the project, document the findings of the analysis, and make the findings available for review by the public and decision-makers. 4.2 Clean Air Act As implemented by the Clean Air Act, the US Environmental Protection Agency (EPA) is required to set the National Ambient Air Quality Standards (NAAQS) for pollutants considered harmful to public health and welfare. As shown in Table 1, there are currently two types of standards: Primary Standards that are intended to protect public health (including protecting the health of "sensitive" populations such as asthmatics, children and the elderly), and Secondary Standards that are intended to protect the public welfare (e.g., to protect against damage to crops, vegetation, buildings, and animals). Federal actions must not cause or contribute to any new violation of any standard, increase the frequency or severity of any existing violation, or delay timely attainment of any standard or required interim milestone. Geographic regions that do not meet the NAAQS for one or more criteria pollutants are designated by EPA as non-attainment areas. Areas previously designated as non-attainment, but subsequently redesignated to attainment because they no longer violate the NAAQS, are reclassified as maintenance areas subject to maintenance plans to be developed and included in a state s SIP. This project is located in Prince William and Fairfax County, which are currently designated as non-attainment for the 8-hour ozone and maintenance for the 1997 annual PM 2.5 standards. As a result of these designations, the project is subject to transportation conformity requirements under the CAA pertaining to ozone, and PM 2.5. The federal transportation conformity rule (40 CFR Parts 51 and 93) requires air quality conformity determinations for transportation plans, programs, and projects in non-attainment or maintenance areas for transportation-related criteria pollutants for which the area is designated non-attainment or has a maintenance plan (40 CFR (b)). Transportation-related criteria pollutants, as specified in the conformity rule, include ozone (O 3 ), CO, nitrogen dioxide (NO 2 ), PM 10 and PM 2.5. Regional conformity analysis requirements apply for plans and programs; hot-spot analysis requirements of 40 CFR and apply for projects. On March 10, 2006, EPA released a rulemaking titled PM 2.5 and PM 10 Hot-Spot Analyses in Project- Level Transportation Conformity Determinations for the PM 2.5 and PM 10 National Ambient Air Quality Standards (40 CFR Part 93). This rulemaking established the criteria for determining which projects will be required to further analyze particulate emissions. In addition, the rule established the criteria for demonstrating conformity for PM 2.5 standards, and updated the existing criteria for determining conformity for PM 10 areas. Additionally, the Metropolitan Washington Council of Governments is in the process of updating the region s conformity determination (which will include this project), which is expected to be complete in October, /11/2015 Page 7
12 Pollutant [final rule cite] Carbon Monoxide [76 FR 54294, Aug 31, 2011] Lead [73 FR 66964, Nov 12, 2008] Nitrogen Dioxide [75 FR 6474, Feb 9, 2010] [61 FR 52852, Oct 8, 1996] Ozone [73 FR 16436, Mar 27, 2008] Particle Pollution Dec 14, 201 PM 2.5 PM 10 Sulfur Dioxide [75 FR 35520, Jun 22, 2010] [38 FR 25678, Sept 14, 1973] Table 1: National Ambient Air Quality Standards Primary/ Secondary primary primary and secondary Averaging Time 8-hour 1-hour Rolling 3-month average Level 9 ppm 35 ppm primary 1-hour 100 ppb primary and secondary primary and secondary Form Not to be exceeded more than once per year 0.15 μg/m 3 (1) Not to be exceeded Annual 53 ppb (2) Annual Mean 98th percentile of 1-hour daily maximum concentrations, averaged over 3 years 8-hour ppm (3) maximum 8-hr concentration, Annual fourth-highest daily averaged over 3 years primary Annual 12 μg/m 3 Annual mean, averaged over 3 years secondary Annual 15 μg/m 3 annual mean, averaged over 3 years primary and secondary primary and secondary 24-hour 35 μg/m 3 98th percentile, averaged over 3 years Not to be exceeded more than 24-hour 150 μg/m 3 once per year on average over 3 years primary 1-hour 75 ppb (4) maximum concentrations, 99th percentile of 1-hour daily averaged over 3 years secondary 3-hour 0.5 ppm Not to be exceeded more than once per year (1) Final rule signed October 15, The 1978 lead standard (1.5 µg/m3 as a quarterly average) remains in effect until one year after an area is designated for the 2008 standard, except that in areas designated nonattainment for the 1978, the 1978 standard remains in effect until implementation plans to attain or maintain the 2008 standard are approved. (2) The official level of the annual NO2 standard is ppm, equal to 53 ppb, which is shown here for the purpose of clearer comparison to the 1-hour standard. (3) Final rule signed March 12, The 1997 ozone standard (0.08 ppm, annual fourth-highest daily maximum 8-hour concentration, averaged over 3 years) and related implementation rules remain in place. In 1997, EPA revoked the 1-hour ozone standard (0.12 ppm, not to be exceeded more than once per year) in all areas, although some areas have continued obligations under that standard ( antibacksliding ). The 1-hour ozone standard is attained when the expected number of days per calendar year with maximum hourly average concentrations above 0.12 ppm is less than or equal to 1. (4) Final rule signed June 2, The 1971 annual and 24-hour SO2 standards were revoked in that same rulemaking. However, these standards remain in effect until one year after an area is designated for the 2010 standard, except in areas designated nonattainment for the 1971 standards, where the 1971 standards remain in effect until implementation plans to attain or maintain the 2010 standard are approved. Source: Table and footnotes above are excerpted (5/5/2015) from US Environmental Protection Agency website: Mobile Source Air Toxics (MSATs) On December 6, 2012, FHWA issued updated guidance titled Interim Guidance Update on Mobile Source Air Toxic Analysis in NEPA. The purpose of the memorandum was to update the September 2009 interim guidance that advised FHWA Division offices on when and how to analyze MSAT under the NEPA review process for highway projects. Based on FHWA's analysis using MOVES2010b, diesel particulate matter (diesel PM) has become the primary MSAT of concern. Additionally, the updated guidance reflects recent regulatory changes, projects national MSAT emission trends out to 5/11/2015 Page 8
13 2050 using EPA s MOVES2010b model, and summarizes recent research efforts; however, it did not change any project analysis thresholds, recommendations, or guidelines. The MSAT guidance includes specific criteria for determining which projects are to be considered exempt from MSAT analysis requirements and which may require a qualitative or quantitative analysis. In accordance with the guidance, the FHWA developed a tiered approach with three categories for analyzing MSAT in NEPA documents, depending on specific project circumstances. Those categories are listed below: No analysis for projects with no potential for meaningful impacts; Qualitative analysis for projects with low potential MSAT effects; or Quantitative analysis to differentiate alternatives for projects with higher potential MSAT effects. Projects considered exempt under section 40 CFR of the federal conformity rule are also specifically designated as exempt from MSAT analysis requirements. 4.4 MOVES2014 On October 7, 2014, the EPA published a Federal Register Notice of Availability that approved the Motor Vehicle Emissions Simulator (MOVES2014) as the latest EPA tool for estimating emissions of volatile organic compounds (VOCs), nitrogen oxide (NO X ), CO, PM 10, PM 2.5 and other pollutants from motor vehicles. With this release, EPA started a 2-year grace period to phase in the requirement of using MOVES2014 for transportation conformity analyses. In July 2014, EPA issued guidance on the use of MOVES2014 for State Implementation Plan Development, Transportation Conformity, and Other Purposes. This guidance specifies that the same grace period be applied to project-level emissions analyses. At the end of the grace period, i.e., beginning October 7, 2016, project sponsors are required to use MOVES2014 to conduct emissions analysis for both transportation conformity and NEPA purposes. In March 2015, EPA published a new EPA guidance document titled Using MOVES2014 in Project-Level Carbon Monoxide Analyses 3 for completing project-level carbon monoxide analyses using MOVES Carbon Monoxide Analysis An updated memorandum of understanding (MOU) was signed between VDOT and the FHWA Virginia Division Office on February 27, 2009 which outlines when a quantitative or qualitative CO hot-spot analysis is required for NEPA purposes. Based on the signed memorandum and applicable federal requirements, the project requires a quantitative hot-spot analysis for the following reasons: The project adds roadway capacity. The project exceeds the average daily traffic (ADT) thresholds contained in the MOU. In addition, CO hot-spot analyses can be completed as either screening analyses or refined analyses. CO hot-spot screening analyses are performed using worst-case traffic and meteorological inputs to identify the resulting worst-case CO concentrations throughout the project corridor in order to determine if an exceedance of the CO NAAQS could occur as a result of the proposed improvements. CO is a stable gas that disperses in predictable ways in the environment surrounding a project. Therefore, computer modeling can be used to assess both existing and expected future concentrations 3 See: 5/11/2015 Page 9
14 of CO at selected receptor sites in the vicinity of a project. The modeling inputs and procedures were developed in accordance with FHWA a n d EPA guidance, including the Guideline for Modeling Carbon Monoxide from Roadway Intersections and Using MOVES2014 in Project-Level Carbon Monoxide Analyses. 5.1 Traffic Summary Information The project is planned to open to traffic in 2022, however national and local experience shows managed lanes with dynamic pricing take approximately 3 years for driver behavior to adjust and for the lanes to be fully utilized. It is because of this ramp-up period that the traffic analysis team chose 2025 as the year to be analyzed for planning and design purposes. However, as emission rates generally decline over time due to fleet turnover to vehicles manufactured to more stringent emission standards and the associated implementation of more stringent fuel quality standards, the actual project opening year of 2022 would be expected to have higher fleet average emission rates. After consultation and concurrence with FHWA, it was decided that the higher traffic volumes predicted in 2025 would be combined with the higher fleet average emission rates expected for This approach is consistent with a generally conservative or worst-case approach taken for the air quality analyses. Overall traffic forecasts were developed for the project for Existing (2015), Interim/Opening Year No- Build (2025), Interim/Opening Year Build (2025), Design Year No-Build (2040), and Design Year Build (2040) conditions for the project location. These traffic volumes were used in the CO hot-spot analysis and are based on provided traffic volume projections. The project consists of adding express lanes, interchange modifications and limited improvements (including signal timing) to other intersections within the study corridor. For the CO screening analysis, the project team attempted to identify the locations in the project area with the potential for contributing the highest levels of CO. A detailed signalized intersection traffic assessment that was used in identifying the worst-case intersections is shown in Table 2. Based on the judgment of the project team the three worst-case locations selected for the assessment are as follows: The interchange at I-495 The interchange at VA 28 The signalized intersection of Leesburg Pike & Idylwood Rd (VA 695) The locations identified above were selected based on having the highest peak hour traffic volumes, an associated degraded Level of Service, expected queuing conditions, and the desire to include locations of interest throughout the corridor: The magnitude of the traffic volumes through the congested interchange at I-495/I-66 makes this location one of particular interest. Improvements to VA 28 have been incorporated into this environmental document though it was being developed as a separate VDOT project. The proximity and interaction of the projects necessitated consideration of the two as a single improvement, and the combined traffic of both I-66 and VA 28 make this the second greatest congregation of traffic in the corridor (after the interchange with the I-495 Capital Beltway). The signalized intersection at Leesburg Pike & Idylwood Rd., after comparison with other signalized intersections throughout the corridor, was deemed worst-case and selected for the screening analysis. The criteria for selection of this locations for analysis included: o A failing level of service (LOS F) overall and on most approaches o High peak hour volumes, comparable to other problematic intersections considered 5/11/2015 Page 10
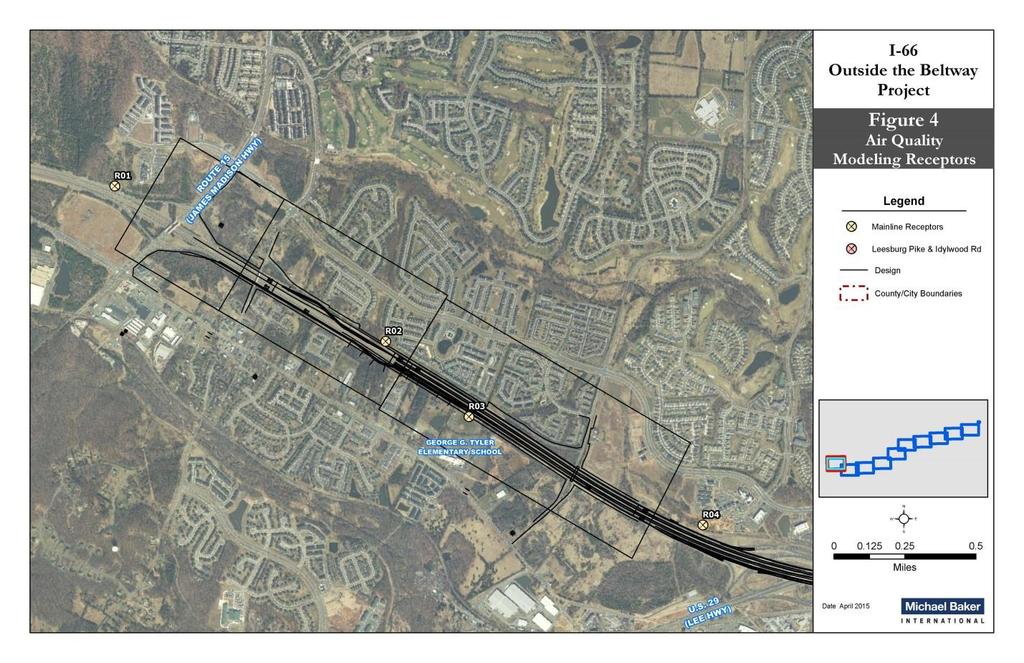
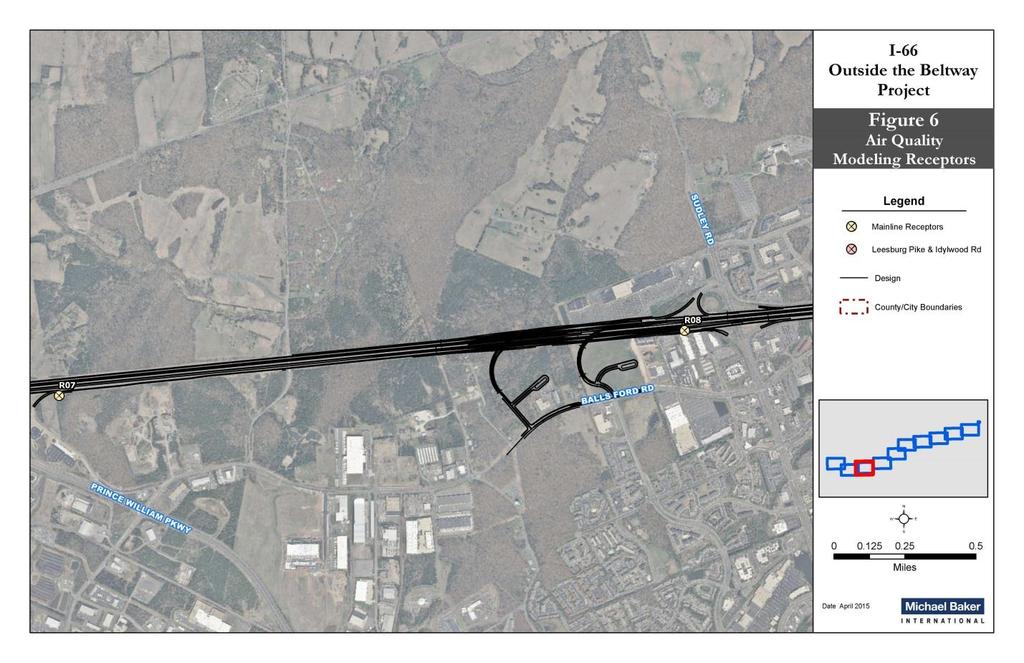
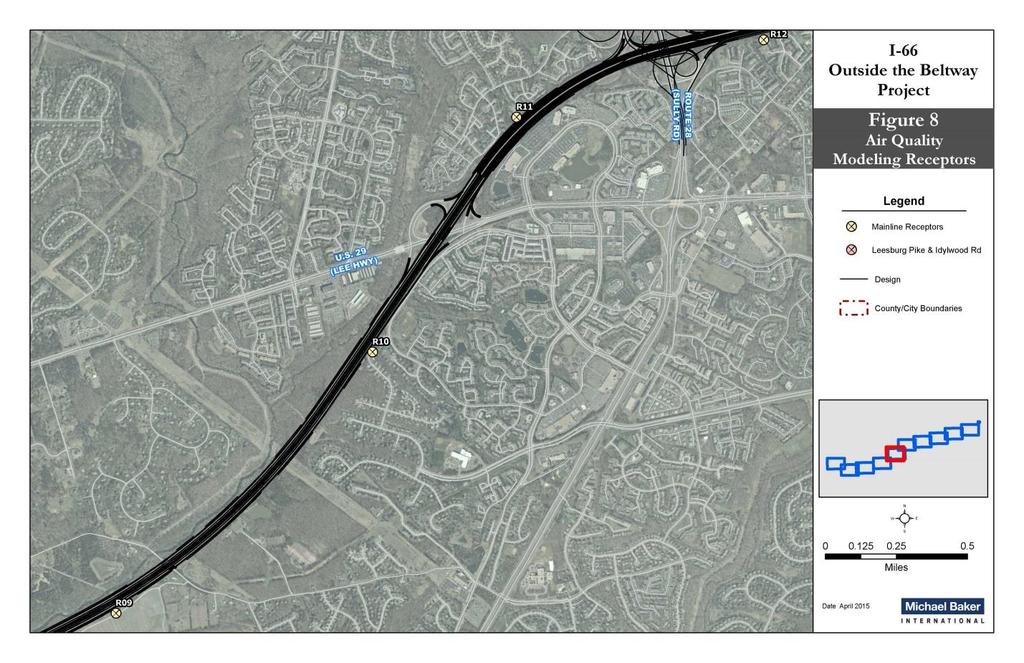
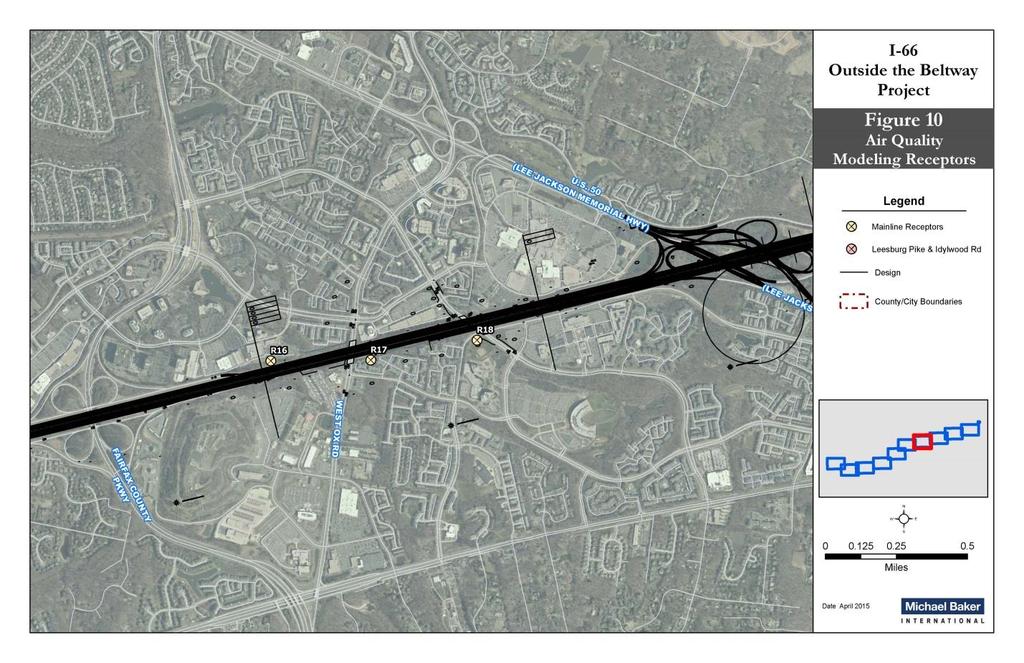
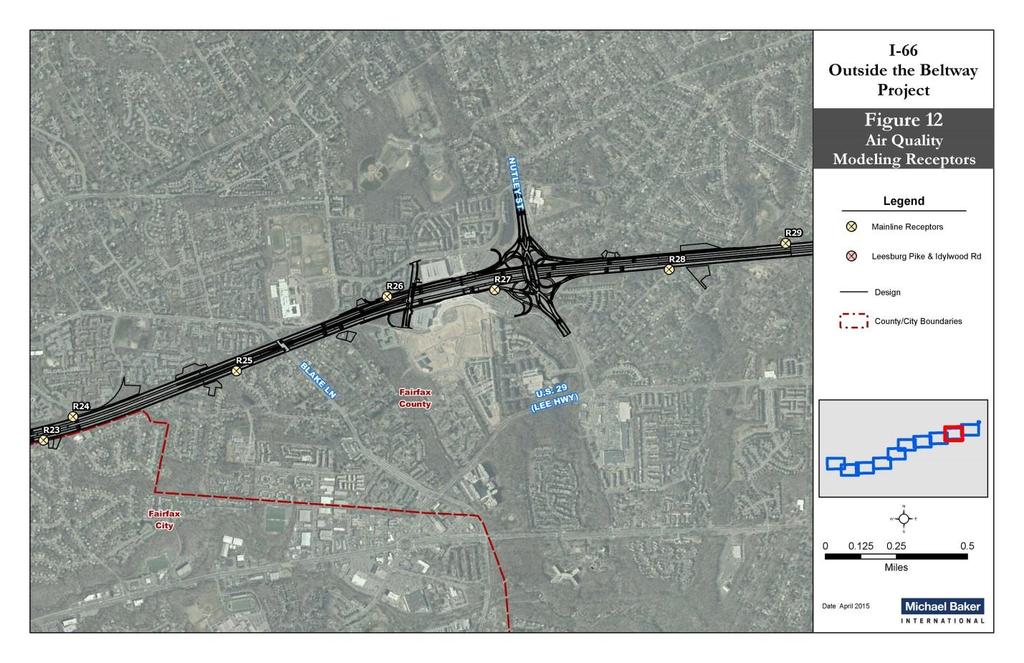
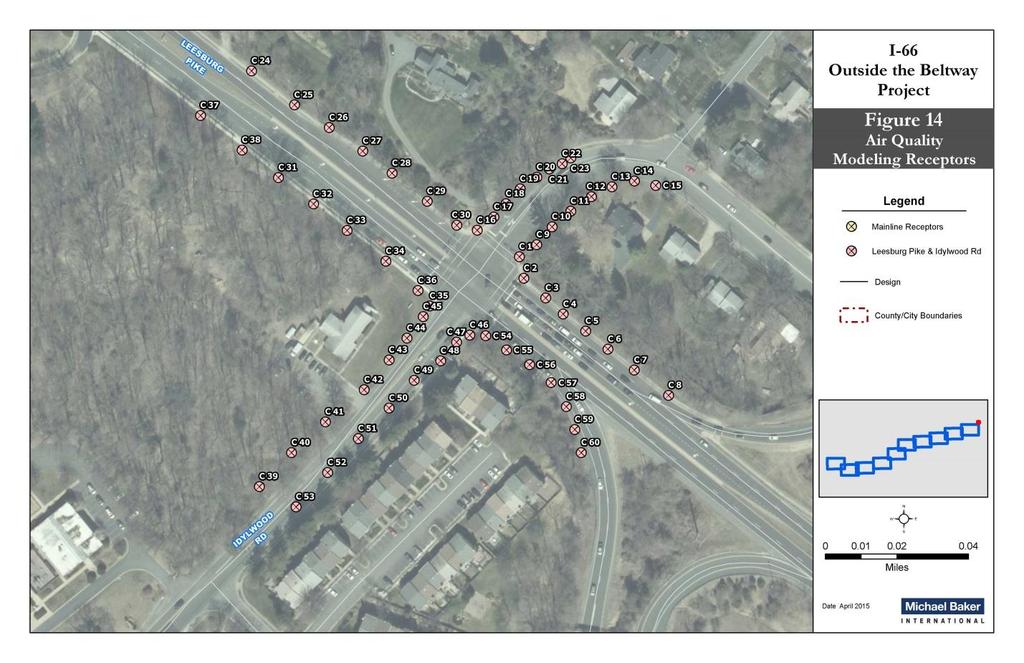
15 o o Adjacent to a residential area and thereby of greater concern due to the presence of sensitive populations than locations adjacent parking lots and transient commercial locations Adjacent sidewalks with the inherent exposure risk for pedestrians The PM peak hour (5pm) was selected for the modeling to represent the worst-case conditions due to the higher traffic volumes throughout the corridor and the worst-case Level of Service for the signalized intersections. The traffic volumes used in the CO hot-spot analysis for the PM peak traffic period are included in Appendix A of this report, showing volumes by intersection, approach, and lane. Note these forecast volumes were applied for the signalized intersection modeling only, as theoretical maximum per lane volumes were used to analyze the two interchanges as a worst-case assumption. For the highway to highway interchanges, a worst-case analysis approach was taken in which the FHWA CAL3i program was applied to develop extremely conservative estimates for CO concentrations. CAL3i provides an interface for the EPA CAL3QHC and CALINE3 models that serves to facilitate and streamline the modeling process, particularly for worst-case analyses. Details on the assumptions used for the worst-case analyses are provided later in this report. 5.2 CO Receptor Locations: Signalized intersection and Mainline Typically, air quality receptor sites are selected based on generalized assessments of where human activity is likely to coincide with where the highest CO concentrations are likely to occur. The selected receptor locations are used to quantify both existing and future maximum CO concentrations throughout the project area and satisfy all EPA and FHWA requirements. If the peak CO concentrations at the worst-case areas selected in the analysis are below the NAAQS for CO, it is assumed that all other locations in the corridor will also remain below the thresholds. As stipulated by EPA s Guideline for Modeling Carbon Monoxide from Roadway Intersections, each receptor represents an area where the public would have continuous access to the immediate vicinity. Receptors were selected along the I-66 project corridor where the highest CO concentrations are likely to occur and near sensitive populations. Potential modeling sites selected for the study include: George G. Tyler Elementary School, Providence Elementary School, Bull Run Special Events Center, multiple tennis courts and ball parks, as well as residential and commercial areas adjacent to I-66 and the worst-case intersections selected for the air study. The manually selected receptors can be seen on Figures 3 through 13. Receptors for the intersection of Leesburg Pike and Idylwood Road are presented in Figure 14. For the freeway to freeway interchanges, the receptors were placed in the worst-case locations for the worst-case configuration using the FHWA CAL3i interface software, i.e., at the edge of the right of way. The screening analysis for the interchanges is detailed below in Section /11/2015 Page 11
16 Intersection 6651: Leesburg Pike & Idylwood Rd (Rt 695) 6254: Lee Hwy & Nutley St 4753: Balls Ford Road & Sudley Rd 5251: Stone Rd. & Lee Hwy (RT. 29) 9052: Stonecroft Blvd. & Westfields Blvd. 6050: Jermantown Rd & Chain Bridge Rd 5751: Lee Jackson Memorial Highway & Waples Mill Road 8451: Leesburg Pike & I-495 NB On- Ramp 8951: Gallows Rd & I-495 Off-Ramp 6652: Leesburg Pike & Haycock Road 2015 Existing 2025 No-Build Table 2: PM Peak Hour Volumes at Intersections 2025 Alternative 2A 2025 Alternative 2B 2040 No-Build 2040 Alternative 2A 2040 Alternative 2B LOS Vol. LOS Vol. LOS Vol. LOS Vol. LOS Vol. LOS Vol. LOS Vol. E 4780 F 6100 F 5930 F 6130 F 6160 F 6165 F 6110 E 4805 F 6120 F 5980 F 6230 F 6180 D 6195 F 6395 D 5920 E 6940 E 6830 F 6600 F 7425 F 7475 F 7395 F 4900 F 5910 E 5070 E 5165 F 6440 F 5565 F 5770 F 4450 F 4370 F 4525 F 4445 F 4880 F 5080 F 5035 F 4425 E 4435 F 3885 E 3760 F 4985 F 4310 F 4425 E 6525 E 6880 E 6270 E 6175 F 7435 E 6965 F 7095 B 5980 B 6355 D 6440 D 6415 B 6820 D 6950 D 6965 F 4695 F 4965 F 4520 F 4490 F 5045 F 4920 F 4880 E 4015 E 4445 E 4260 E 4205 E 4390 E 4425 E 4490
17 5.3 Modeling Inputs Key assumptions for CO modeling included: Emission Modeling: MOVES2014 would be applied, although the grace period provided by EPA is still applicable. CO emission rates will be county-specific, using inputs specific to Fairfax and Prince William Counties, such as county-specific age distributions, where appropriate. Dispersion Modeling: Both CAL3QHC and CALINE3 will be applied. CO background concentration values will be those developed by VDOT based on recent data. Documentation for local background concentrations and associated persistence factors is included in Appendix J. Table 3 summarizes the inputs to MOVES2014 used to estimate worst-case emission rates and the sources of data used as inputs. Parameter Table 3: Inputs to MOVES2014 Data Evaluation Year(s) 2015/2022/2040 Evaluation Month Days Evaluation Hour January Weekdays 5:00 PM Links Link Source Type Hour Fractions Developed by Baker Developed by Baker (as discussed below) Temperature (Fahrenheit) 22 (1) Vehicle Age Distribution I/M Programs Provided by MWCOG Provided by MWCOG Fuel MOVES2014 defaults for the Washington, DC area (1) MOVES modeled emission rates for CO are insensitive to temperature for temperatures below about 60 degrees Fahrenheit (see Figure 4-1, DOT- VNTSC-FHWA-12-05). The value (22) taken by the project team for this analysis represents the minimum average temperature for January (whereas guidance only specifies the average to be applied) but is consistent with the value applied in previous analyses conducted for various projects in northern Virginia using the previous EPA model (MOBILE).. 5/11/2015 Page 13

18 5/11/2015 Page 14

19 5/11/2015 Page 15

20 5/11/2015 Page 16

21 5/11/2015 Page 17

22 5/11/2015 Page 18

23 5/11/2015 Page 19
24 Additionally: The link inputs to MOVES2014 that affect the calculation of CO emission rates include the road type, speed, and road grade. For this analysis, links on I-66 were classified as MOVES road type urban restricted while links on all other roads were classified as urban unrestricted. The speeds modeled for the CO analysis were the posted speeds. Link grades were developed based on elevation data from GIS files and the National Elevation Dataset provided by USGS. The link source type hour fraction data were developed based on the source hours operating for each source type, using the MWCOG conformity analysis runs provided for Fairfax and Prince William Counties updated from MOVES2010a to MOVES2014. An example MOVES input data file applied in the CO analysis is provided in Appendix B. CAL3QHC was used for modeling the CO concentrations along I-66 and at the worst-case signalized intersection noted above. Emission factors derived from MOVES2014, calculated as discussed above, were included as inputs to the CAL3QHC modeling. Worst-case traffic operations and atmospheric conditions were incorporated to predict worst-case CO concentrations. The surface roughness coefficient used in the analysis was taken based on land use in the project area. In addition, a persistence factor of 0.78 was applied to the 1-hour CO concentrations to project the 8-hour CO concentrations as stipulated in EPA guidance. Background concentrations were obtained from VDOT, based on a review of ambient monitoring data for the region; see Appendix J for details. A brief summary of the modeling inputs for CAL3QHC is presented in Table 4. An example CAL3QHC input and output file are provided in Appendix C, and a complete set of modeling files can be made available upon request. Table 4: CAL3QHC Worst-Case Inputs Parameter Surface Roughness Coefficient Background CO Concentrations (ppm) Urban Areas (NOVA) One-hour Eight-hour Wind speed - meters per second Stability Class Mixing Height Receptor Height Data 175 cm mainline 108 cm signalized intersection (1) 1.9 ppm 1.4 ppm 1 m/s Urban - D 1000 meters 5.9 feet Persistence Factor 0.78 (1) 175cm Surface Roughness Coefficient corresponds to Urban Area - Office as per the CALINE3 Users Guide, and was considered indicative of the overall prevailing conditions in the study corridor. At the signalized intersection of Leesburg Pike & Idylwood Rd only, 108cm was used corresponding to single family residential community immediately adjacent this location. Table 5 provides a summary of the worst-case CO concentrations observed at the receptors included in the analysis of the mainline corridor and worst-case intersection. The maximum observed CO concentrations (in ppm) are shown for each year and scenario. The summary table also shows the CO NAAQS for the corresponding averaging period. A summary of the CO contributions estimated in the CAL3QHC analysis for all the receptors identified can be found in Appendix K. 5/11/2015 Page 20
25 Table 5: Maximum Potential CO Concentrations (ppm) Intersection Leesburg Pike & Idylwood Rd (Rt 695) Averaging Period 2015 Existing No- Build Alt 2A Alt2B No- Build Alt 2A Alt 2B NAAQS 1-hour CO hour CO Mainline I-66 1-hour CO hour CO Notes: 1-hour and 8-hour concentrations are shown in parts per million (ppm). 1-hour concentrations were predicted using CAL3QHC computer dispersion model and assume a background concentration of 1.9 ppm. 8-hour concentrations were calculated by applying a persistence factor of 0.78 to the 1-Hour concentration, Background concentration values were provided as noted in the previous section by VDOT. The highest CO concentrations at the signalized intersection of 2.5 ppm (1-hour) and 1.8 (8-hour) are observed in 2015 at receptors C34 and C35. In 2022, the peak CO concentrations of 2.3 ppm (1-hour) and 1.7 ppm (8-hour) occur for the No-Build scenario at receptor C27 and also occur for the build Alternative 2A scenario at receptors C26 through C29 and C55. A peak CO concentration of 2.2 ppm (1-hour) and 1.6 ppm (8-hour) occurs for the build alternative 2B scenario at multiple receptors. In 2040, peak CO concentrations of 2.0 ppm (1-hour) and 1.5 ppm (8-hour) occur for the No-Build and Build Alternative 2B scenarios. Peak CO concentrations of 2.0 ppm (1-hour) and 1.5 ppm (8-hour) occur at C29 for the 2040 build alternative 2A scenario. The maximum potential CO concentrations along the I-66 mainline equal or exceed the corresponding CO concentrations from the signalized intersection. The highest CO concentration along the I-66 mainline is observed in 2025 under the build Alternative 2B scenario with a 1-hour CO concentration of 3.0 ppm and an 8-hour CO concentration of 2.2 ppm. This peak occurs at receptor R13. All of the 2040 maximum potential CO concentrations are below the 2015 and 2022 maximum potential concentrations. All of these maximum potential CO concentrations are well below the CO NAAQS. Thus, these results demonstrate that, under worst-case conditions, the Build scenario will not cause or contribute to a violation of the CO NAAQS along the I-66 mainline and at the worst-case intersection chosen for analysis. 5.4 Screening Analysis at Major Interchanges Overview of Interchange CO Screening Process The corridor contains major freeway/freeway interchanges with very high traffic volumes which are of potential concern from the perspective of CO emissions including the interchanges of I-66 with I- 495/Capital Beltway and VA Route 28. Major improvements to these interchanges will include: Addition of express lanes on the mainline Addition of ramps to directly access the I-66 express toll lanes both from the general purpose lanes and, in the case of the I-495 interchange, ramps facilitating direct connection to the I-495 express lanes. In the case of the VA 28 interchange, the arterial segment to the north of the interchange including the at-grade, signalized intersection with Braddock Road, is to be replaced with a fully grade separated freeway segment. Realignment of existing ramps, and addition of ramps to directly access the express lanes on I- 66. The ramp modifications will be more extensive at the VA 28 interchange, while many of 5/11/2015 Page 21
26 the ramps needed to accommodate movements between I-66 and I-495 have already been constructed in anticipation of this project or are already in construction as part of a separate effort. 4 The interface software package applied for dispersion modeling of the interchanges was CAL3i, an update to the CAL3interface 5,6 initially released by the FHWA in December 2006 and recently updated to be compatible with more modern versions of the Microsoft Window operating system. More information on these models may be obtained from FHWA 7. Project details are outlined in the following sections. Key assumptions as applied in the worst-case modeling are summarized at the end of these sections Project Opening and Design Years The project base, opening and design years are 2015, 2022 and 2040 respectively. As emission rate modeling demonstrates continued decrease in per vehicle CO emissions as stricter fuel standards, vehicle emissions and fuel efficiency standards come into effect 8, the screening analysis focused on 2022 with conservative traffic flows. Note that since past experience has shown that express lanes take 3 years for users to fully utilize the facility, traffic forecasts used are actually for 2025 and include 3 years of background growth in traffic in addition to the full impact of the project. Using these 2025 traffic forecasts with 2022 emission rates yields conservative results Emission Factors Emission factors were developed using MOVES2014 with similar setups and the same base assumptions and data which were discussed earlier for the intersection analysis. Emission rates are direct inputs into CAL3i and are meant to represent conservative but reasonable values. Several factors and inputs: Assuming an average speed of 55 MPH, the posted speed on all roadways considered, is a conservative value as forecasts indicate that average speeds would be lower which in turn would yield lower CO emission rates. Modeling was done for freeway links in an urban area type. Emission rates were developed for freeway links with grades of +3% and +6% in both Fairfax and Prince William Counties. I-66 crests at both I-495 and VA 28 as part of the grade separation, leading to the +3% inclines on the mainline. Preliminary design files indicate a maximum climbing grade of 6% on the ramps. A 6% grade leading towards the interchanges and -3% leading away from the interchanges was therefore selected when developing the emission rates as being representative of worst-case conditions. The emission factors used are summarized in Table 6 below. 4 Environmental review of the I-495/I-66 interchange improvements were incorporated into the Capital Beltway Study Final Environmental Impact Statement Section 4(f) Evaluation, April M.Claggett (FHWA), CAL3Interface A Graphical User Interface for the CALINE3 and CAL3QHC Highway Air Quality Models, ca M.Claggett (FHWA), Update of FHWA s CAL3Interface A Graphical User Interface for the CALINE3 and CAL3QHC Highway Air Quality Models, ca See Models may be downloaded from: airqualitytst?launcher=false&disclaimer-consent=true 8 Brian C. McDonald, Drew R. Gentner, Allen H. Goldstein, and Robert A. Harley. Long-Term Trends in Motor Vehicle Emissions in U.S. Urban Areas. Environmental Science and Technology of American Chemical Society, August 5, /11/2015 Page 22
27 County Table 6: MOVES Developed CO Emission Rates Analysis Year CO Emission Rates (grams/vehicle mile of travel) Freeways 55MPH Grades: -3%/3% Grades: -6%/6% Prince William County (VA 28) / / / / / /2.72 Fairfax County (I-495) / / / / / / Modeling Scenarios In analyzing the interchanges at both I-495 and at VA 28, a number of simplifying assumptions were applied, which together serve to overestimate the project impacts on CO emissions and therefore result in conservative or worst-case results from the air quality/dispersion modeling. Since worst-case traffic volumes assumed for the CO analyses at the interchanges was set to the theoretical per lane maximum, the same volumes would apply for 2040 as for The worst-case analysis for 2022 would therefore have higher concentrations than one for 2040, as 2022 would have the same worst-case traffic but higher emission factors (as shown in Table 6). The screening analysis for 2022 therefore effectively covers both the 2022 and 2040 Build scenarios No-Build Scenarios Modeling of No-Build scenarios for the project-level air quality analysis for CO is not required for this analysis in keeping with the FHWA-VDOT 2009 Agreement for No-Build Analyses. Per that Agreement, modeling of a No-Build scenario is not required for projects that qualify for an Environmental Assessment (EA). A base year analysis was completed using 2015 emission rates, the number of lanes indicative of the No-Build scenario, and the same assumptions as indicated for the build scenario below Traffic Volumes for the Modeled Scenarios As part of the parallel traffic analysis undertaken for this project, a coarse estimate of theoretical per lane capacity was undertaken 9. The worst-case volumes are intended to reflect over-capacity operating conditions, which is taken as level of service (LOS) E. The mainline freeway theoretical operating capacity was estimated at 2350 vehicles per hour per lane (vphpl), compared to the 2200 vphpl default value in CAL3i. For simplicity and for an additional margin of safety, a value of 2400 vphpl was used for this screening analysis. Typically the assumed federal worst-case traffic volumes tend to be significantly higher than the design (and opening) year modeled volumes. Table 7 below summarizes the refined traffic estimates developed by the project team on I-66, showing the per lane volume to be substantively lower in both the opening year (2025) and design year (2040) scenarios. In addition, ramp lanes tend to accommodate fewer vehicles per hour, but again the conservative approach assumes full utilization at a capacity of a 9 See project traffic analysis report. 5/11/2015 Page 23
28 mainline travel lane (2400 vphpl.) Finally the express lanes will be managed in order to ensure a relative congestion free operation at all times. By definition these lanes will accommodate traffic volumes well below the LOS E capacity, but for the screening analysis the volume on the managed lanes will be held at 2400 vphpl. Overall the traffic volumes assumed are well over twice those forecasted for the corridor Dispersion Modeling Inputs Table 8 summarizes key input data as applied in the worst-case dispersion modeling for this project using CAL3QHC/CALINE3 via the CAL3i software supplied by FHWA. EPA and FHWA defaults as incorporated into the CAL3i software were generally applied unless otherwise indicated in the table below. CAL3i also determines receptor locations, placing them at the points of highest likely concentrations. Copies of the CAL3i input screens and output report for all scenarios modeled are provided in Appendix D, while a sample CALINE3 input file generated by CAL3i is provided in Appendix E Results of CO Interchange Screening Analysis A total of four scenarios were run: years 2015 and 2022 at both I-495 and VA 28. CAL3i was run without including background CO concentrations, so background CO values were added to the air quality modeling results to show peak CO concentrations at each receptor. The worst-case CO concentrations at the I-66/I-495 interchange of 10.8 ppm (1-hour) and 8.3 (8-hour) are observed in 2015 at receptor 13. In 2022, the worst-case CO concentrations of 10.0 ppm (1-hour) and 7.7 ppm (8-hour) are observed at receptor 5. The worst-case CO concentrations at the I-66/VA 28 interchange of 9.2 ppm (1-hour) and 7.1 (8-hour) are observed in 2015 at receptor 1. In 2022, the worst-case CO concentrations of 9.1 ppm (1-hour) and 7.0 ppm (8-hour) are observed at receptor 5. All of these maximum potential CO concentrations are below the CO NAAQS. Thus, these results demonstrate that, under worst-case conditions, the Build scenario will not cause or contribute to a violation of the CO NAAQS at both of the worst-case interchanges in the project corridor. All input and output data is provided for all the CAL3i analysis in Appendix D. Table 7: Comparison of Forecasted Traffic Volumes and worst-case Volumes assumed for CO Screening Analysis Interchange I-66 /I-495 I-66/VA 28 Direction CO Screening Values % 2A 2B 2A Volume % Difference Difference NB 8,620 8,810 9,900 9,995 21, % % SB 11,475 11,400 13,265 13,170 21, % % EB 8,185 7,750 8,735 8,325 19, % % WB 1,155 1,380 1,250 1,595 19, % % Total 29,435 29,340 33,150 33,085 81, % % NB 2,915 2, , % % SB 6,900 7, , % % EB 5,635 5,500 6,600 6,540 21, % % WB 9,665 8,295 10,470 9,275 21, % % Total 25,115 23, , % % 5/11/2015 Page 24
29 Table 8: CAL3QHC/CALINE3 Worst-Case Inputs Parameter Input* Background CO Concentration, ppm** - One-hour - Eight-Hour Surface Roughness Coefficient, cm 175 Wind Speed, meters per second 1.0 Wind Direction Increments, degrees (multipliers) 10 ( 1 through 36) Stability Class 4 (D Neutral) Mixing Height, meters 1000 Settling Velocity, cm/s 0 Deposition Velocity, cm/s 0 Wake Distance, ft. 9.8 Median Width, ft. 0 Source Height, ft. 0 Receptor Height, ft. 5.9 Persistence Factor 0.78*** * Defaults unless otherwise specified. ** Recommended values for projects in northern Virginia (VDOT 2015; See Appendix J) *** Recommended value for projects in northern Virginia (VDOT 2015; See Appendix J). Note this is a more conservative value than the EPA default of 0.7. Table 9: CO Interchange Results Using CAL3i CO Concentrations (ppm) Location Averaging Year Highest Reception Identifier Highest Receptor Concentration Background Concentrations Total NAAQS I-66/I-495 Interchange 1-Hour 8-Hour I-66/VA 28 Interchange 1-Hour 8-Hour Summary of Worst-Case Assumptions Worst-case assumptions applied in this CO interchange analysis include: For dispersion modeling: Worst-case traffic volumes assumed for CO modeling exceeded the design year forecasts 2400 vphpl, even on ramps, far exceeding the theoretical capacity on any one approach Traffic volumes in the screening analysis were from 163% to over 1,500% higher than those currently forecasted for the project (See Table 7). Ramps are modeled as through lanes, physically immediately adjacent through lanes Receptor locations on the edge of the roadway right-of-way, following federal guidance for worst-case analyses. 5/11/2015 Page 25
30 Zero median widths (concentrating traffic, emissions and concentrations to the greatest extent possible). Zero vertical separation for the I-66 & I-495 grade separation. Other federal default input data for most model inputs included in CAL3i Right of way of 20 feet assumed (distance from edge of roadway to edge of right-of-way). The actual right of way exceeds this. A 1-hour to 8-hour persistence factor of 0.78 was selected based on data for the Northern Virginia region (see memorandum Appendix J). This is greater than the CAL3i default of 0.7 For emission factor modeling (developed using MOVES2014 the most recent release of the EPA approved emissions rate model) worst-case inputs (tending to increase modeled emission factors), included: The assumption of conservatively high emission factors by selecting the posted speed (55 mph) for all links. The grade was assumed to be 6% on approach and -3% on the departure lane representing the grades that would result in the highest possible emissions based on the current preliminary design files. 6.0 Particulate Matter The I-66 Outside the Beltway project is located in Prince William and Fairfax County, areas designated as maintenance for the 1997 annual PM 2.5 NAAQS, and as such requires a project-level conformity determination. An evaluation was undertaken in consultation with FHWA regional and headquarters office staff to assess whether the expected traffic changes resulting from this project, combined with the current and expected background PM 2.5 concentrations in the regional, could potentially result in an exceedance of the NAAQS for PM PM Regulations & Overview Quantitative PM 2.5 considerations are a requirement under the Transportation Conformity Requirements of the Clean Air Act (CAA). CAA section 176(c)(1) is the statutory requirement that must be met by all projects in nonattainment and maintenance areas that are subject to transportation conformity. Section 176(c)(1)(B) states that federally-supported transportation projects must not cause or contribute to any new violation of any standard [NAAQS] in any area; increase the frequency or severity of any existing violation of any standard in any area; or delay timely attainment of any standard or any required interim emission reductions or other milestones in any area. Section (b)(1) of the conformity rule defines the projects that require a PM 2.5 or PM 10 hot-spot analysis as: (i) New highway projects that have a significant number of diesel vehicles, and expanded highway projects that have a significant increase in the number of diesel vehicles; (ii) Projects affecting intersections that are at Level-of-Service D, E, or F with a significant number of diesel vehicles, or those that will change to Level-of Service D, E, or F because of increased traffic volumes from a significant number of diesel vehicles related to the project; (iii) New bus and rail terminals and transfer points that have a significant number of diesel vehicles congregating at a single location; (iv) Expanded bus and rail terminals and transfer points that significantly increase the number of diesel vehicles congregating at a single location; and 5/11/2015 Page 26
31 (v) Projects in or affecting locations, areas, or categories of sites which are identified in the PM 2.5 or PM 10 applicable implementation plan or implementation plan submission, as appropriate, as sites of violation or possible violation. Some examples of projects of local air quality concern that would be covered by 40 CFR (b)(1)(i) and (ii) are: A project on a new highway or expressway that serves a significant volume of diesel truck traffic, such as facilities with greater than 125,000 annual average daily traffic (AADT) and 8% or more of such AADT is diesel truck traffic; New exit ramps and other highway facility improvements to connect a highway or expressway to a major freight, bus, or intermodal terminal; Expansion of an existing highway or other facility that affects a congested intersection (operated at Level-of-Service D, E, or F) that has a significant increase in the number of diesel trucks; and, Similar highway projects that involve a significant increase in the number of diesel transit busses and/or diesel trucks. Some examples of projects of local air quality concern that would be covered by 40 CFR (b)(1)(iii) and (iv) are: A major new bus or intermodal terminal that is considered to be a regionally significant project under 40 CFR ; and, An existing bus or intermodal terminal that has a large vehicle fleet where the number of diesel buses increases by 50% or more, as measured by bus arrivals. It should be noted that the region currently attains the 2006 and 2012 PM 2.5 NAAQS based on monitoring data. 10 With the implementation of the 2012 PM 2.5 NAAQS, USEPA has proposed the 1997 primary annual standard be revoked, which should eventually eliminate the associated conformity requirements Interagency Consultation The conformity rule requires that federal, state and local transportation and air quality agencies establish formal procedures for interagency coordination on matters related to air quality conformity. The Virginia Interagency Consultation Group (VA-ICG) consists of the following agencies in the consultation process for the PM 2.5 analysis, all of whom were invited to participate: FHWA Virginia Division and Resource Center Virginia Department of Environmental Quality Virginia Department of Transportation Virginia Department of Rail and Public Transit Metropolitan Washington Council of Governments EPA Region 3 FTA local and regional offices Fairfax County Prince William County The City of Fairfax 10 Attainment status for any region of the county for all NAAQS can be found on the USEPA Greenbook Website: 11 See EPA s March 23, 2015 Notice of Proposed Rulemaking (80 FR ) 5/11/2015 Page 27
32 Interagency consultation provides an opportunity to generate support for key assumptions to be used in conformity analyses, strategies to reduce mobile source emissions, specific impacts of major projects, and issues associated with travel demand and emissions modeling for hot-spot analyses. 40 CFR (c)(1) (i) requires interagency consultation to evaluate and choose models and associated methods and assumptions. Per Section 2.3 of EPA s hot-spot guidance, for many aspects of PM hotspot analyses, the general requirement of interagency consultation can be satisfied without consulting separately on each and every specific decision that arises. In general, as long as the consultation requirements are met, agencies have discretion as to how they consult on hot-spot analyses. Table 10 provides a summary of key decisions when performing a PM project level analysis. The sections that follow highlight some of the key discussion items reviewed by VDOT in preparation for the consultation process. Table 10: Key Decisions on Quantitative Methods and Data for PM Hotspot Analysis Topic Considerations/Options for Review Determining the need for a Quantitative Analysis Analysis Approach Study Area Analysis Years Type of PM Emissions Analyzed Emission and Air Quality Models Background Concentrations Is this a project of air quality concern? Is the nature of a project such that it cannot be readily or intuitively determined that no new or worsening exceedance of the NAAQS will occur? Recommend that this is not a project of air quality concern. Compare results of the Build analyses to the NAAQS. If NAAQS are exceeded then a comparison of the build to the no-build conditions will be undertaken. Consider limiting analysis area to encompass locations directly impacted by the project and where pollutant levels are anticipated to be the highest. Recommended: The areas surrounding the interchanges with I-495 and SR 28. A conservative approach would be taken: 2025 traffic projections with 2022 emission rates addresses 3-year ramp up period for the managed lane project (discussion below) design year addressed by systemic rate decline as seen in MOVES. Direct PM2.5 mobile source running emissions (exhaust, crankcase, brake/tire wear). Construction emissions are not considered (< 5 years in duration). No major non-road sources near the project location. Road dust is not considered a significant source. MOVES2010a, MOVES2010b or MOVES2014: MOVE 2014 recommended AERMOD or CAL3QHCR: TBD Preliminary values developed See discussion below Receptor Locations Placed according to EPA guidance Other Input Parameters Focus of Capacity Increases MOVES inputs should be consistent with SIP/Conformity analysis by MWCOG Recommendations from hot-spot training Meteorology Additional vehicle fuel distributions Information required if MOVES2014 is used suggest incorporation of MOVES2014 default data for any missing data. The primary goals of the I-66 Corridor Improvement Project are to improve traffic flow and safety, accommodate enhanced transit services with express bus on shared right of way, and increase connectivity to the High Occupancy Toll lanes on the Capital Beltway. The proposed improvements focus primarily on the addition of dual managed lanes in the center of the right-of-way, with utilization limited to light-duty vehicles using electronic toll collection and limited express bus service. The project also includes the lengthening of merge lanes to make them contiguous between interchanges 5/11/2015 Page 28
33 improving operations on the general purpose lanes. Restrictions on I-66 apply inside the Beltway with vehicles having more than 4-tires not permitted. As such the truck traffic is diverted at the I-495 interchange. Overall the project results in no increase in general purpose capacity and is intended to encourage more efficient, high occupancy modes of travel. Initial findings from the Tier 1 study indicated significant latent demand for the general purpose lanes on I-66 and it is anticipated the parallel facilities will see some reduction in overall congestion with the project improvements. Results of refined traffic analyses suggest limited improvement to the prevailing traffic conditions on the I-66 general purpose lanes as latent demand for the facility will take full advantage of any additional capacity. Various geometric and safety projects will improve operations at individual locations and address minor chokepoints in the corridor. Additional improvements will be located at the VA 28 interchange. This includes conversion of over one mile of arterial roadway and two signalized intersections to a limited access facility and a complete reconfiguration of the fly-over ramp complex. The resulting improvements will make VA 28 limited access for the entire length from I-66 north to the Dulles Toll Road. The I-66 corridor represents one of the most traveled and congested roadways in the Commonwealth. Table 11 summarizes current traffic volumes and truck percentages at the locations of greatest concern in the project corridor. Location I-66 West of I-495/Capital Beltway I-495/Capital Beltway South of I-166 Table 11: 2013 Traffic Data Two-Way AADT Volume Approximate Truck Percentage Approximate Truck AADT Volume 159, % 4,770 6, , % 5,880 7,840 VA 28 North of I , % 2,000-3,000 I-66 East of VA , % 4,830-6,440 Source: Traffic forecasts developed for this project continue to be refined as the final build alternative is defined. This work was undertaken as a separate effort with input from the air quality modeling team. It is felt that at this time the traffic, and in particular the estimates of truck volumes, are sufficient for supporting the discussion whether this is a project of air quality concern for PM 2.5. Appendix F provides forecasts of traffic along I-66 for the entire project corridor. Traffic volumes are generally highest in the area immediately adjacent to the interchange with the beltway. The second area of concern is the interchange with VA 28 which has traffic volumes well in excess of 100,000 one-way AADT on I-66. The cumulative traffic on at these locations, including the traffic on the intersecting facility, are the highest in the corridor. These locations will continue to experience congestion even with improvements and as such represent the locations of greatest concern and highest likelihood of creating a localized area not meeting the PM 2.5 NAAQS. Recognizing this, the evaluation on whether this is a project of air quality concern has focused on these locations and the assumption is that if at these locations the project does not appear to be an issue, then that finding can be extrapolated to the entire corridor. For a project on an existing roadway to be one of air quality concern, the regulation and guidance clearly state that a significant increase in diesel vehicle traffic, and in particular truck traffic, must be 5/11/2015 Page 29
34 projected between the no-build and the build traffic forecasts. As this is pivotal information and an important item for discussion by the interagency group members, the traffic team developed a process to generate estimates of truck volumes with a high degree of confidence. As noted above the corridor does not currently have a high percentage of trucks, and the absence of a significant increase in general purpose capacity which trucks can utilize, means truck volumes are unlikely to change significantly due to this the project. Appendix G contains plots showing the 2025 total truck volumes forecasts for the no-build and the two alternatives being forwarded at the VA 28 and I-495 interchanges. Truck volumes remain relatively low, and truck volumes are not expected to change substantively as result of the project, a fact that can be attributed to a number of specific factors: Capacity increases are predominately on the express lanes where trucks are not permitted. Truck percentages in the existing conditions are already low, less than 4% in all cases. This is likely due to trucks avoiding congested conditions. There is evidence that a significant proportion of the truck volume is in the overnight period where travel is already not hampered and will not benefit from the project. There are no new generators of truck trips expected as a result of the project. Table 12 below summarizes the relative impact of the proposed alternatives on truck volumes at the key locations in the study area. Minimal increase in truck traffic/emissions are expected as a result of the project, with the highest bi-directional truck volumes well below the 10,000 truck volumes derived from the EPA example (for a project to be of concern) for a new highway. The absence of a significant increase in truck traffic as a result of this project was a key factor supporting the claim that this is not a project of air quality concern. Table 12: Project Impacts on Truck Volumes Parameter Alternative 2A Alternative 2B Highest Forecasted absolute increase in Truck Volumes +120 (Between Sudley Rd and US 29) +170 (Between Sudley Rd and US 29) Highest Forecasted Percent increase in Truck Volumes 2025 Build Alt 2A = 2% increase (Between Nutley St and I-495) 2025 Build Alt 2B = 3% increase (I-66 west of US 15) Highest Forecasted Truck Volume 2025 Build Trucks Alt 2A = 7,140 (I-495 North of I-66) 2025 Build Trucks Alt 2B = 7,190 (I-495 North of I-66) Highest Forecasted Truck % of AADT 2025 Build Alt 2A = 6.3% (I-66 EB west of US 15) 2025 Build Alt 2B = 6.3% (I-66 EB west of US 15) Trends in Background PM 2.5 Concentrations Included in the materials for Appendix J is a review of PM 2.5 monitoring data in the study area. This data is summarized in Table 13 and indicates current background pollutant levels at 8.9 µg/m 3. Given the general downward trend in monitoring data, it is unlikely that the current annual NAAQS for PM 2.5 of 12 µg/m 3 within the study area would be exceeded absent an increase in diesel traffic to an extent that is not expected for this project. 5/11/2015 Page 30
35 Table 13: Air Quality Monitor Readings in Vicinity of I-66 Corridor Project Site ID County Three Year Average for PM 2.5 (μg/m 3 ) Fairfax Loudoun 8.9 Maximum (Conservative) Associated Transit Emissions Transit services as currently envisioned in the corridor are limited to increased numbers of express and commuter buses on the managed lanes, as well as the addition of park and ride facilities to capture some of the trips in the corridor. No excessive increase in diesel powered buses is expected, as there are no new transfer locations that would attract a significant congregation of idling diesel vehicles. VDOT, the county and operators in the corridor have committed to a low-emission fleet specific to the corridor including modern clean diesel, hybrids and alternative fuel buses. The lack of a substantive increase in diesel transit in the corridor, combined with commitment towards a cleaner fleet, ensures that transit operations in the corridor will not significantly contribute to PM 2.5 vehicle emissions Expected Year of Peak Emissions The traffic forecasts developed for this project focus on the opening year and design year, 2025 and 2040 respectively, as previously defined by the team undertaking the traffic modeling and simulation effort. Two Alternative build scenarios are being forwarded at this time. The differences between these alternatives focus on the ramps interconnecting the general purpose and managed lanes, as well as direct access to park-and-ride facilities from the managed lanes. The project is planned to open to traffic in 2022, however national and local experience shows managed lanes with dynamic pricing take approximately three years for driver behavior to adjust and for the lanes to be fully utilized. It is because of this ramp-up period that the traffic analysis team chose 2025 as the year to be analyzed for planning and design purposes. However, as emission rates generally decline over time due to fleet turnover to vehicles constructed to more stringent emission standards and the associated implementation of more stringent fuel quality standards, the actual project opening year of 2022 would be expected to have higher fleet average emission rates. After consultation and concurrence with FHWA, it was decided that the higher traffic volumes predicted in 2025 would be combined with the higher fleet average emission rates expected for This approach is consistent with a generally conservative or worst-case approach taken for the air quality analyses. The impact of increasingly stringent standards for vehicle emissions, fuel economy and fuel composition/formulation results in a significant drop in the average emission rates of all pollutants including PM 2.5 from heavy duty vehicles. To demonstrate this, Figure 15 below is a comparison of the emission rates for a combination of truck categories and for buses. This shows that 2040 emission rates for PM 2.5 for these categories of vehicles is less than half of those forecast for This means traffic would effectively need to double between the opening and the design year for the design year emissions to exceed those in 2022, which is not the case. Finally, no projects were identified between 2022 and 2040 that would substantively change the traffic in the corridor, eliminating the need to consider additional analysis years. Because of these factors attention was focused on 2022, analyzed as described above, as the pivotal year for consideration. 5/11/2015 Page 31

36 Figure 15: General Trends in PM 2.5 Emissions Rates for Heavy Duty Vehicles by Year 6.3 Summary and Final Recommendation by the Virginia Interagency Consultation Group On review of the available information, data and forecasting assembled for the I-66 Outside the Beltway project, and in consultation with FHWA staff, it was proposed that the project be advanced and presented to the VA-ICG as not being one of local air quality concern for PM 2.5 for several reasons: The project intent is to maximize passenger, not truck, throughput. Minimal increase in truck traffic/emissions are expected as a result of the project. The highest bi-directional truck volumes are much less than 10,000 truck volumes from EPA Guidance example for a new highway. Insignificant changes in emissions from diesel transit vehicles are expected. Background PM 2.5 concentrations well below the NAAQS & declining. Emission rates for diesel vehicles are declining fleet-wide over time. EPA has proposed to revoke the applicable NAAQS for PM, potentially making PM project level conformity considerations unnecessary in the near future for this region. The VA-ICG met on March 30 th, 2015 and discussed whether the project was one of air quality concern for PM 2.5. After consideration of the project scope, traffic forecasts, background concentrations, trends in emission rates, and other related data and information as presented above, the VA-ICG concurred with the assessment by the Department that the project is not one of local air quality concern for PM 2.5. For additional reference, the VA-ICG meeting minutes and presentation slides are included in Appendix H of this document. 5/11/2015 Page 32
37 7.0 Mobile Source Air Toxics Analysis In December of 2012, the FHWA issued an interim guidance update regarding the evaluation of MSAT in NEPA analyses and included projections utilizing the EPA MOVES emission model and updated research on air toxic emissions from mobile sources. The guidance establishes three categories and criteria for analyzing project-level MSATs in NEPA documents: 1. No meaningful MSAT effects, 2. Low potential MSAT effects, and 3. High potential MSAT effects. A qualitative analysis is required for projects which meet the low potential MSAT effects criteria while a quantitative analysis is required for projects meeting the high potential MSAT effects criteria. Projects with Low Potential MSAT Effects are described as: Those that serve to improve operations of highway, transit, freight without adding substantial new capacity or without creating a facility that is likely to significantly increase emissions. This category covers a broad range of project types including minor widening projects and new interchanges, such as those that replace a signalized intersection on a surface street or where design year traffic is not projected to meet the 140,000 to 150,000 AADT criteria. Projects with High Potential MSAT Effects must: Create or significantly alter a major intermodal freight facility that has the potential to concentrate high levels of diesel particulate matter in a single location; Create new or add significant capacity to urban highways such as interstates, urban arterials, or urban collector-distributor routes with traffic volumes where the AADT is projected to be in the range of 140,000 to 150,000 or greater by the design year; and Proposed to be located in proximity to populated areas. In accordance with the MSAT guidance, the study area is best characterized as a project with higher potential MSAT effects since projected design year traffic is expected to exceed the 140,000 to 150,000 AADT thresholds. Specifically, the 2040 Build scenario is expected to have AADT volumes on I-66 reach 313,000 AADT, and this traffic is also in proximity to populated areas. The quantitative assessment of MSATs is discussed Section MSAT Background Controlling air toxic emissions became a national priority with the passage of the Clean Air Act Amendments (CAAA) of 1990, when Congress mandated that the EPA regulate 188 air toxics, also known as hazardous air pollutants (HAPs). The EPA assessed this expansive list in their 2007 rule on the Control of Hazardous Air Pollutants from Mobile Sources and identified a group of 93 compounds emitted from mobile sources that are listed in their Integrated Risk Information System (IRIS). In addition, EPA identified seven compounds with significant contributions from mobile sources that are among the national and regional-scale cancer risk drivers from their 1999 National Air Toxics Assessment (NATA). The seven compounds identified were: 1. acrolein; 2. benzene; 3. 1,3 butadiene; 4. diesel particulate matter; 5. formaldehyde; 5/11/2015 Page 33
38 6. naphthalene; and 7. polycyclic organic matter. While FHWA considers these the priority mobile source air toxics, the list is subject to change and may be adjusted in consideration of future EPA rules. The 2007 EPA rule mentioned above requires controls that will dramatically decrease MSAT emissions through cleaner fuels and cleaner engines. 7.2 Motor Vehicle Emissions Simulator (MOVES) According to EPA, MOVES improves upon the previous MOBILE model in several key aspects. MOVES is based on a vast amount of in-use vehicle data collected and analyzed since the latest release of MOBILE, including millions of emissions measurements from light-duty vehicles. Analysis of this data enhanced EPA s understanding of how mobile sources contribute to emission inventories and the relative effectiveness of various control strategies. In addition, MOVES accounts for the significant effects that vehicle speed and temperature have on PM emission estimates, whereas MOBILE did not. MOVES2010b includes all air toxic pollutants in NATA that are emitted by mobile sources. EPA has incorporated more recent data into MOVES2010b to update and enhance the quality of MSAT emission estimates. These data reflect advanced emission control technology and modern fuels, plus additional data for older technology vehicles. Based on an FHWA analysis using EPA s MOVES2010b model, even if vehicle-miles traveled (VMT) increases by 102 percent as assumed from 2010 to 2050, a combined reduction of 83 percent in the total annual emissions for the priority MSAT is projected for the same time period (see Exhibit A). It should be noted that MOVES2010b does not reflect the impacts of some of the more recent heavy duty vehicle fuel economy standards or fuel standards intended to further reduce emissions. Because of this, application of MOVE2014 (which does include these impacts) would forecast even more dramatic declines. The implications of MOVES on MSAT emissions estimates compared to MOBILE are lower estimates of total MSAT emissions, significantly lower benzene emissions, and significantly higher diesel PM emissions, especially for lower speeds. This reflects the combined impact of more recent vehicle fuel economy standards, vehicle emission standards and fuel formulation not taken into account in MOBILE but fully integrated into MOVES. As a result, diesel PM is projected to be the dominant component of the emissions total. 7.3 MSAT Research Air toxics analysis is a continuing area of research. While much work has been done to assess the overall health risk of air toxics, many questions remain unanswered. In particular, the tools and techniques for assessing project-specific health outcomes as a result of lifetime MSAT exposure remain limited. These limitations impede the ability to evaluate how potential public health risks posed by MSAT exposure should be factored into project-level decision-making within the context of NEPA. Nonetheless, air toxics concerns continue to be raised on highway projects during the NEPA process. Even as the science emerges, we are duly expected by the public and other agencies to address MSAT impacts in our environmental documents. The FHWA, EPA, the Health Effects Institute, and others have funded and conducted research studies to try to more clearly define potential risks from MSAT emissions associated with highway projects. The FHWA continues to monitor the developing research in this field. 5/11/2015 Page 34
39 Exhibit A.: National MSAT Emission Trends for Vehicles Operating on Roadways Using EPA's MOVES 2010b Model Source: EPA MOVES2010b model runs conducted during May-June 2012 by FHWA. Note: Trends for specific locations may be different, depending on locally derived information representing vehicle-miles travelled, vehicle speeds, vehicle mix, fuels, emission control programs, meteorology, and other factors. 5/11/2015 Page 35
40 7.4 Project Quantitative MSAT Analysis A quantitative MSAT analysis was conducted consistent with the latest guidance developed by FHWA. These include the Interim Guidance Update mentioned earlier, and the FHWA preliminary guidance for addressing a quantitative MSAT analysis using MOVES titled Quick-start Guide for Using MOVES for a NEPA Analysis. Based on traffic projections for the analysis years, the segments directly associated with the project and those roadways in the affected network where the AADT is expected to change +/- 5% and greater than 50 vehicles for the Build alternative compared to the No-Build alternative were identified. This portion of the affected network can be seen in Figure 16. In addition, the roadway segments where the speed is expected to change +/- 2.5 mph for the Build alternative compared to the No-Build alternative were also included, as speed is being used as an appropriate surrogate for travel time. This portion of the affected network can be seen in Figure 17. The full affected network which includes the links affected by both the volume and speed changes can be seen in Figure 18. The traffic analysis team reviewed the affected network and found it to be consistent with the overall understanding of the wider travel impacts of the project. The following describes the approach and methodology used for conducting the quantitative MSAT analysis: Use of the following information: AADT s, peak hour volumes and diurnal traffic distribution for I-66 and other roadways in the affected network. Estimated network speeds for congested periods and for free-flow conditions. Emissions were estimated based on calendar year 2022 emission factors from MOVES2014 along with 2025 VMT representing the expected stabilized travel volumes from the managed lanes. Speed distributions were based on the congested speeds provided in the Travel Demand Model (TDM) output. The time periods provided are AM peak, midday, PM peak and nighttime. The AM peak period covers a three hour period (6 am to 9 am) the PM peak period includes four hours (3 pm to 7 pm), the midday covers 9 am to 3 pm, and nighttime covers the remaining hours. The distributions are specific for each evaluation year and scenario. The fractions of vehicle hours of travel within each speed bin were estimated from the vehicle hours of travel and vehicle speeds contained in the regional traffic demand model output for each link included in the affected network and were apportioned using the MOVES AvgSpeedBin Table of bins (i.e., 1 through 16) for each road type and county. The calculated speed distribution representing each time period was then applied to each hour in the time period. The roadtype distributions were based on the functional class of the roadways. Interstates were assigned to MOVES roadtype category 4, while other roads were assigned to MOVES roadtype category 5. The MWCOG distributions of VMT by source type on each of these two road types were used along with the total VMT by roadtype from the TDM network output files were used to develop evaluation year and scenario-specific roadtype distribution files for each county. The MOVES2014 model was run with local parameters for the four quarters of each analysis year (using January, April, July, and October meteorological data as surrogates for each quarter). Annual MSAT emissions were then calculated by multiplying the seasonal day emissions by the number of days in the season and summing the resulting 5/11/2015 Page 36
41 emissions from the four seasons. The resulting, existing, interim, and design year emissions for the no-build and build conditions were compared. A brief summary of the modeling inputs for MOVES is presented in Table 14. Inputs such as fuel, I/M, age distribution, etc., are the same as listed in Table 3 for the CO analysis. The analysis reflects only running exhaust and crankcase running exhaust, while diesel PM exhaust consists of PM 10 emissions from diesel vehicles only. The polycyclic organic matter was summarized consistent with the pollutants listed in the FHWA guidance for POM. The results of the quantitative MSAT analysis are presented in Table 15. Table 16 shows the change in emissions between the Build and No-Build scenarios and between the Build and Existing scenarios. These tables show that all of the MSAT emissions are expected to increase slightly for both Build scenario conditions when compared to the corresponding No-Build conditions in both 2022 and However, when compared to the 2015 Existing conditions, emissions of all pollutants in both Build scenarios and years show significant decreases. These reductions occur despite projected increases in VMT from 2015 to the 2022 and 2040 Build scenarios of 24 to 37 percent. The increased emissions from the No-Build to the Build scenarios are generally consistent with the increased VMT from the No- Build to the Build scenarios. In addition, in both 2022 and 2040, Alternative 2A VMT is slightly greater than the Alternative 2B VMT, and the emissions of all pollutants follow this same trend with all of the Alternative 2A emissions either slightly higher than or the same as the corresponding Alternative 2B MSAT emissions. In all cases, the magnitude of the MSAT emissions is small in the projection years and significantly lower than exists today. In 2022, emissions of diesel PM are the highest of all the pollutants at 40 tons per year (tpy) in the Build Alternative 2A scenario, but significantly down from 112 tpy in the 2015 Existing scenario. Diesel PM emissions decrease further to 13 tpy in all scenarios in Emissions of formaldehyde are the second greatest of all the MSAT pollutants in all scenarios, with emissions of 20 tpy in the 2015 Existing scenario, decreasing to 10 tpy in all 2022 scenarios, and further decreasing to 6 tpy by The differences between the No-Build scenario and the two Build scenarios in 2022 is 0.5 tpy or less for all pollutants, and in 2040, the maximum difference between the No-Build and Build scenarios is 0.4 tpy. Due to the small magnitude of projected MSAT emissions, the increases observed in 2022 and 2040 from the No-Build to the Build scenario are not considered significant, especially when considering that emissions from all MSAT are expected to be significantly lower in future years than exist today. Overall, the results of the MSAT analysis are consistent with the national MSAT emission trends predicted by MOVES and indicate that no meaningful increases in MSATs have been identified and are not expected to cause an adverse effect on human health as a result of either of the I-66 Build scenarios in future years. 5/11/2015 Page 37

42 5/11/2015 Page 38

43 5/11/2015 Page 39

44 5/11/2015 Page 40
PREPARED FOR: VDOT ENVIRONMENTAL DIVISON PREPARED BY: MICHAEL BAKER INTERNATIONAL IN ASSOCIATION WITH: SC&A INC.
 Transform I-66 Inside the Beltway Investing in Multi-Modal Solutions Project Level Air Quality Analysis in Support of a Categorical Exclusion STATE PROJECT NO. : 0066-96A-358 UPC: 107371 PREPARED FOR:
INTERSTATE 395 EXPRESS LANES NORTHERN EXTENSION AIR QUALITY ANALYSIS TECHNICAL REPORT SEPTEMBER 2016
 INTERSTATE 395 EXPRESS LANES NORTHERN EXTENSION AIR QUALITY ANALYSIS TECHNICAL REPORT SEPTEMBER 2016 INTERSTATE 395 EXPRESS LANES NORTHERN EXTENSION Air Quality Analysis Technical Report City of Alexandria,
Air Report. Project Information PPTA/LAP. Traffic Data I-495 NORTHERN SECTION SHOULDER USE. Project Number: , C501, P101 UPC:
 Air Report Project Information Project Name: I-495 NORTHERN SECTION SHOULDER USE Project Number: 0495-029-123, C501, P101 UPC: 105130 Route Number: 495 Project Limit - From: South of Old Dominion Drive
Transportation Conformity Guidance for Qualitative Hot-spot Analyses in PM 2.5 and PM 10 Nonattainment and Maintenance Areas
 Transportation Conformity Guidance for Qualitative Hot-spot Analyses in PM 2.5 and PM 10 Nonattainment and Maintenance Areas United States Environmental Protection Agency Federal Highway Administration
Robin Rhinesmith and Crystal Geiger, Florida Department of Transportation (FDOT) Lindsay Baumaister, KB Environmental Sciences, Inc.
 Lindsay Baumaister, KB Environmental Sciences, Inc.") -MEMO- Date: February 21, 2019 To: From: CC: Robin Rhinesmith and Crystal Geiger, Florida Department of Transportation (FDOT) Lindsay Baumaister, KB Environmental Sciences, Inc. Steve Gordillo, WSP Subject:
-MEMO- Date: February 21, 2019 To: From: CC: Robin Rhinesmith and Crystal Geiger, Florida Department of Transportation (FDOT) Lindsay Baumaister, KB Environmental Sciences, Inc. Steve Gordillo, WSP Subject:
5.3 Air Quality and Greenhouse Gas Emissions
 5. NEPA 5.3 Air Quality and Greenhouse Gas Emissions For a comprehensive discussion of the Project s affected environment and cumulative impacts as it relates to air quality and greenhouse gas (GHG) emissions,
18 June 2017 PRACTITIONER S HANDBOOK AASHTO ADDRESSING AIR QUALITY ISSUES IN THE NEPA PROCESS FOR HIGHWAY PROJECTS
 AASHTO PRACTITIONER S HANDBOOK 18 June 2017 ADDRESSING AIR QUALITY ISSUES IN THE NEPA PROCESS FOR HIGHWAY PROJECTS This handbook is intended to assist practitioners in addressing air quality issues, including
I-70 East ROD 1: Phase 1 (Central 70 Project) Air Quality Conformity Technical Report
 Air Quality Conformity Technical Report") I-70 East ROD 1: Air Quality Conformity Technical Report January 2017 I-70 East ROD 1: Air Quality Conformity Technical Report TABLE OF CONTENTS Chapter Page 1 PURPOSE OF THIS REPORT... 1 2 PROJECT DESCRIPTION...
I-70 East ROD 1: Air Quality Conformity Technical Report January 2017 I-70 East ROD 1: Air Quality Conformity Technical Report TABLE OF CONTENTS Chapter Page 1 PURPOSE OF THIS REPORT... 1 2 PROJECT DESCRIPTION...
Air Quality Technical Report PM2.5 Quantitative Hot spot Analysis. A. Introduction. B. Interagency Consultation
 Air Quality Technical Report PM2.5 Quantitative Hot spot Analysis I 65, SR44 to Southport Road (Segmented from SR44 to Main Street and Main Street to Southport Road) A. Introduction This technical report
Draft Air Quality Analysis Protocol. Detroit River International Crossing Environmental Impact Statement
 Draft Air Quality Analysis Protocol Detroit River International Crossing Environmental Impact Statement May 31, 2007 1. Introduction Under the National Environmental Policy Act (NEPA), federal agencies
AIR QUALITY ANALYSIS. I-77/I- 81 Overlap Improvements , P100 (UPC 51441) Prepared by:
 Prepared by:") AIR QUALITY ANALYSIS I-77/I- 81 Overlap Improvements 0077-098-104, P100 (UPC 51441) Prepared by: Environmental Division Virginia Department of Transportation September 2009 TABLE OF CONTENTS Summary...
AIR QUALITY ANALYSIS I-77/I- 81 Overlap Improvements 0077-098-104, P100 (UPC 51441) Prepared by: Environmental Division Virginia Department of Transportation September 2009 TABLE OF CONTENTS Summary...
4.2 Air Quality and Greenhouse Gas
 4.2 Air Quality and Greenhouse Gas Federal agencies are required under the Clean Air Act (CAA) to ensure that projects they fund (such as the Center City Connector) are in compliance with existing federal
Pollutant Averaging Time Primary Standard. Sulfur Dioxide 24 hours 0.14 ppm Ozone. 8 hour 0.08 ppm 1 hour 0.12 ppm Particulate Matter <10 µm
 4.4 AIR QUALITY The Clean Air Act (CAA) and its amendments led to the establishment by the U.S. Environmental Protection Agency (EPA) of National Ambient Air Quality Standards (NAAQS) for six criteria
Air Quality Technical Report Prepared in Support of the Supplemental Environmental Impact Statement
 Air Quality Technical Report Prepared in Support of the Supplemental Environmental Impact Statement VDOT Virginia Department of Transportation U.S. Department of Transportation Federal Highway Administration
FHWA s Interim Guidance on Mobile Source Air Toxics Analysis in NEPA Documents
 FHWA s Interim Guidance on Mobile Source Air Toxics Analysis in NEPA Documents Karen Perritt, M.S. Air Quality Specialist FHWA Office of Natural Environment Mobile Source Air Toxics for Transportation
11-1 INTRODUCTION 11-2 REGULATORY CONTEXT
 Chapter 11: Air Quality 11-1 INTRODUCTION In this chapter, the effect of the project s operation on air quality is analyzed. The regulatory context, methods of analysis, existing air quality, and the future
Air Quality Technical Report
 Air Quality Technical Report Loop 336 South From IH 45 to FM 1314 Montgomery County CSJ: 0338-11-056 July 2017 The environmental review, consultation, and other actions required by applicable Federal environmental
A. INTRODUCTION AND METHODOLOGY
 Chapter 10: Air Quality A. INTRODUCTION AND METHODOLOGY The different alternatives being evaluated as part of the Manhattan East Side Transit Alternatives Study have the potential to result in air quality
DRAFT AIR QUALITY TECHNICAL MEMORANDUM
 AIR QUALITY TECHNICAL MEMORANDUM PROJECT DEVELOPMENT AND ENVIRONMENT STUDY STATE ROAD 60 GRADE SEPARATION OVER CSX RAILROAD Polk County, Florida Financial Project ID: 436559-1-22-01 Prepared for: Florida
11-1 INTRODUCTION 11-2 REGULATORY CONTEXT
 Chapter 11: Air Quality 11-1 INTRODUCTION In this chapter, the effect of the project s operation on air quality is analyzed and includes a description of the regulatory context, methods of analysis, existing
Categorical Exclusion (CE)
") Categorical Exclusion (CE) Project Information Project Name: Federal Project#: Project Number: 0029-002-135, D624, P101 Project Type: Construction UPC: 77383 Charge Number: Route Number: 29 Route Type:
Categorical Exclusion (CE) Project Information Project Name: Federal Project#: Project Number: 0029-002-135, D624, P101 Project Type: Construction UPC: 77383 Charge Number: Route Number: 29 Route Type:
ITEM 9 Action October 18, 2017
 ITEM 9 Action October 18, 2017 Approval of the Air Quality Conformity Analysis of the VDOT and MDOT Off-Cycle Amendment to the 2016 CLRP and Approval of the 2016 Off-Cycle Amendment Staff Recommendation:
CONSULTANT S GUIDE AIR QUALITY PROJECT LEVEL ANALYSIS. Prepared by: Douglas Landwehr Air Quality Meteorologist. And. Amy Costello Air Quality Manager
 CONSULTANT S GUIDE AIR QUALITY PROJECT LEVEL ANALYSIS Prepared by: Douglas Landwehr Air Quality Meteorologist And Amy Costello Air Quality Manager The Air, Noise and Energy Section, Environmental Division
10.0 Air Quality Introduction Current Use of Adjoining Properties Pollutants and Regulatory Setting
 10.0 Air Quality 10.1 Introduction An air quality assessment was conducted to identify the potential for impacts associated with the proposed Columbia Pike Transit Initiative project. The air quality assessment
INTERCHANGE IMPROVEMENTS S T A T E P R O J E C T : , P ; U P C
 V I R G I N I A D E P A R T M E N T O F T R A N S P O R T A T I O N F A I R F A X C O U N T Y P A R K W A Y INTERCHANGE IMPROVEMENTS S T A T E P R O J E C T : 0 0 9 5-0 2 9-8 9 0, P 1 0 1 ; U P C 9 6 2
Categorical Exclusion (CE)
") Categorical Exclusion (CE) Project Information Project Name: I-66 ITB West Falls Church Metro Garage Access Federal Project#: NHPP-066-1(356) Project Number: 0066-96A-493, B686, C501, P101 Project Type:
Categorical Exclusion (CE) Project Information Project Name: I-66 ITB West Falls Church Metro Garage Access Federal Project#: NHPP-066-1(356) Project Number: 0066-96A-493, B686, C501, P101 Project Type:
AIR QUALITY TECHNICAL MEMORANDUM
 AIR QUALITY TECHNICAL MEMORANDUM AIR QUALITY TECHNICAL MEMORANDUM GOLDEN GLADES INTERCHANGE PD&E STUDY Miami-Dade County, Florida Financial Management Number: 428358-1-22-01 Efficient Transportation Decision
Appendix E. Air Quality Conformity Analysis
 Appendix E Air Quality Conformity Analysis AIR QUALITY CONFORMITY ANALYSIS FOR THE 2017-2020 REGIONAL TRANSPORTATION IMPROVEMENT PROGRAM Table of Contents INTRODUCTION... 1 AIR QUALITY STATUS... 1 Figure
Presentation Overview
 Assessing Near Roadway Emissions Impact and Hot-spot Modeling Matt Laurita U.S. EPA Region 2 MARAMA Transportation & Air Quality Workshop February 27, 2013 1 Presentation Overview Near roadway public health
5.0 AIR QUALITY. 5.1 Introduction
 5.0 AIR QUALITY 5.1 Introduction This chapter provides a summary of the detailed information in DSEIS Appendix B: Air Quality Written Reevaluation/Technical Report. The microscale carbon monoxide, regional
A. INTRODUCTION B. POLLUTANTS FOR ANALYSIS
 Chapter 2, Section F: Air Quality A. INTRODUCTION This section examines the potential for air quality impacts due to the proposed operational and geometric changes in traffic conditions along Fulton Street
Final Air Quality Report
 Florida Department of Transportation - District VII County Line Road (C.R. 578) Project Development and Environment Study From U.S. 19 (S.R. 55) to U.S. 41 (S.R. 45) Work Program Item Segment Number: 257298
6.1 INTRODUCTION 6.2 REGULATORY FRAMEWORK NATIONAL AMBIENT AIR QUALITY STANDARDS COMPLIANCE STATUS TRANSPORTATION CONFORMITY
 Chapter 6 Air Quality 6.1 INTRODUCTION This chapter presents a project-level analysis of the potential for air quality impacts that could result from mobile and stationary sources of air emissions generated
Air Quality Analysis Report. Appendix H. Air Quality Analysis Report
 Air Quality Analysis Report Appendix H Air Quality Analysis Report I-35W North Corridor Project EA Minnesota Department of Transportation MEMORANDUM To: From: Brett Danner SRF Consulting Group, Inc. John
Mobile Source Air Toxics Analysis for FHWA Projects
 Mobile Source Air Toxics Analysis for FHWA Projects Jeff Houk FHWA Resource Center March 29, 2007 Overview Background on mobile source air toxics How MSATs became an issue for highway projects FHWA MSAT
AIR QUALITY CONFORMITY ANALYSIS of the 2015 CLRP Amendment and the FY TIP
 TPB Item #8 AIR QUALITY CONFORMITY ANALYSIS of the 2015 CLRP Amendment and the FY2015-2020 TIP Presentation to the Transportation Planning Board September 16, 2015 Pollutants Volatile Organic Compounds
Chapter 6 CO, PM 10, and Other Pollutant Air Quality Impacts and Mitigation For Project Operation
 Chapter 6 CO, PM 10, and Other Pollutant Air Quality Impacts and Mitigation For Project Operation 6.1 Introduction This Chapter addresses the recommended techniques for quantifying emissions of carbon
Florida Department of Transportation, District Three
 MEMORANDUM To: From: Florida Department of Transportation, District Three Bryant Brantley, Atkins Re: Air Quality Analysis for Gulf Coast Parkway, Gulf and Bay County Financial Project ID: 410981-2-28-01
Route 7 Connector Ramp MODIF IE D I N T ER C H A N G E M OD IFICATIO N R E PO RT TRA N S F O R M I : I N S ID E THE BE LTWAY
 STATE PROJECT NUMBER: 0066-96A-493,P101, C501, B686; UPC: 110629 FEDERAL PROJECT NUMBER: NHPP-066-1(356) FAIRFAX COUNTY, VIRGINIA TRA N S F O R M I - 6 6 : I N S ID E THE BE LTWAY Route 7 Connector Ramp
Qualitative Hot Spot Analysis for PM2.5 February 4, 2008
 Technical Guidance for TG-POL-01-08 Qualitative Hot Spot Analysis for PM2.5 February 4, 2008 This technical guidance provides general guidelines for performance of a qualitative hot spot analysis for particulate
Highlights from the 2012 FHWA EPA Northern Transportation and Air Quality Summit
 em summit highlights Highlights from the 2012 FHWA EPA Northern Transportation and Air Quality Summit by Kevin Black, Martin Kotsch, Michael Roberts, Greg Becoat, Melanie Zeman, Joseph Rich, Mark Glaze,
DRAFT 2015 OZONE CONFORMITY ANALYSIS FOR THE 2019 FEDERAL TRANSPORTATION IMPROVEMENT PROGRAM AND THE 2018 REGIONAL TRANSPORTATION PLAN
 DRAFT 2015 OZONE CONFORMITY ANALYSIS FOR THE 2019 FEDERAL TRANSPORTATION IMPROVEMENT PROGRAM AND THE 2018 REGIONAL TRANSPORTATION PLAN JANUARY 9, 2019 KINGS COUNTY ASSOCIATION OF GOVERNMENTS This report
YORK TOLL PLAZA MAINE TURNPIKE AUTHORITY AIR QUALITY REPORT. September 28, 2016 NOISE ANALYSIS REPORT MAINETURNPIKE AUTHORI TY
 NOISE ANALYSIS REPORT MAINETURNPIKE AUTHORI TY YORK TOLL PLAZA MAINE TURNPIKE AUTHORITY AIR QUALITY REPORT September 28, 2016 (Cover photograph provided by MTA) TABLE OF CONTENTS 1.0 EXECUTIVE SUMMARY...
6.0 CONGESTION HOT SPOT PROBLEM AND IMPROVEMENT TRAVEL DEMAND MODEL ANALYSIS
 6.0 CONGESTION HOT SPOT PROBLEM AND IMPROVEMENT TRAVEL DEMAND MODEL ANALYSIS 6.1 MODEL RUN SUMMARY NOTEBOOK The Model Run Summary Notebook (under separate cover) provides documentation of the multiple
Appendix U Air Quality Technical Memorandum DRAFT ENVIRONMENTAL IMPACT STATEMENT
 Appendix U Air Quality Technical Memorandum DRAFT ENVIRONMENTAL IMPACT STATEMENT Chicago Red Line Extension Project Air Quality Technical Memorandum June 21, 2013 Updated July 27, 2015 Prepared for: Chicago
AIR QUALITY CONFORMITY ANALYSIS: VISUALIZE 2045 SCOPE OF WORK
 December 14, 2017 AIR QUALITY CONFORMITY ANALYSIS: VISUALIZE 2045 SCOPE OF WORK I. INTRODUCTION Projects solicited for the quadrennial update of the region s transportation plan, Visualize 2045, and the
TRANSFORM66: OUTSIDE THE BELTWAY
 TRANSFORM66: OUTSIDE THE BELTWAY Concession Fee Project Eligibility *Required Entry PARTI GENERAL INFORMATION 1.1 Applicant Information Please indicate the jurisdiction or agency that is submitting this
PM 2.5 Conformity Hot-spot Analysis for Fairbanks, Alaska
 PM 2.5 Conformity Hot-spot Analysis for Fairbanks, Alaska November 24, 2010 Practical Overview While a process is needed to meet the PM 2.5 project-level requirements after December 14, 2010, it is unlikely
APPENDIX VIII AIR QUALITY CONFORMITY ANALYSIS
 2018 Kings County Regional Transportation Plan APPENDIX VIII AIR QUALITY CONFORMITY ANALYSIS H:\RTPA\2018 RTP Update\Final RTP\APPENDIX VIII - Air Quality Conformity Title Page.docx Appendix VIII CONFORMITY
ATTACHMENT A. Detailed Study Scope. I-66 (Inside) Multi-modal Study Scope
 Multi-modal Study Scope") ATTACHMENT A Detailed Study Scope I-66 (Inside) Multi-modal Study Scope EXECUTIVE SUMMARY The Virginia Department of Transportation (VDOT) seeks consultant assistance in identifying and evaluating a range
ATTACHMENT A Detailed Study Scope I-66 (Inside) Multi-modal Study Scope EXECUTIVE SUMMARY The Virginia Department of Transportation (VDOT) seeks consultant assistance in identifying and evaluating a range
Fredericksburg, Virginia Eight-Hour Ozone Maintenance Area. Transportation Conformity Analysis
 Fredericksburg, Virginia Eight-Hour Ozone Maintenance Area Transportation Conformity Analysis FY 18-21 Transportation Improvement Program and 2045 Long Range Transportation Plan FINAL REPORT Prepared by:
Appendix E. Air Quality Conformity Analysis
 Appendix E Air Quality Conformity Analysis AIR QUALITY CONFORMITY ANALYSIS FOR THE DRAFT 2019-2022 REGIONAL TRANSPORTATION IMPROVEMENT PROGRAM INTRODUCTION This paper documents the positive air quality
Air Quality Technical Report
 Air Quality Technical Report January 2016 I-70 East Final Environmental Impact Statement This page intentionally left blank. I-70 East Final EIS Air Quality Technical Report TABLE OF CONTENTS Chapter Page
Appendix C: GHG Emissions Model
 Appendix C: GHG Emissions Model 1 METHOD OVERVIEW The Maryland Statewide Transportation Model (MSTM) Emissions Model (EM) is a CUBE-based model that uses emission rates calculated by the MOVES2010 EPA
Commonwealth Transportation Board I-66 Corridor Briefing Outside the Beltway Route 15 to I-495
 Commonwealth Transportation Board I-66 Corridor Briefing Outside the Beltway Route 15 to I-495 January 13, 2015 1 Project Status Update Transit P3 Procurement I-66 Corridor Briefing Overview Major Project
CHAPTER 7. AIR QUALITY
 CHAPTER 7. AIR QUALITY 7.1 INTRODUCTION This chapter describes the potential environmental consequences associated with implementation of the alternatives within the four regions of influence (ROI) North,
Traffic Data Collection Programs for PM 2.5 Non-Attainment Areas
 Traffic Data Collection Programs for PM 2.5 Non-Attainment Areas Jack Stickel Alaska Department of Transportation and Public Facilities NATMEC 23 June, 2010 Traffic Data to Address Air Quality and Climate
Vista Canyon Transit Center - Air Quality Technical Memorandum
 803 Camarillo Springs Road, Suite C Camarillo, California 93012 (805) 437-1900 FAX (805) 437 1901 www.impactsciences.com MEMORANDUM To: Kris Markarian, City of Santa Clarita Job No. 1046.003 From: Susan
IMPLICATIONS OF BEING DESIGNATED NONATTAINMENT
 IMPLICATIONS OF BEING DESIGNATED NONATTAINMENT WTS San Antonio/SWITE Professional Development Seminar Jenny Narvaez, Principal Air Quality Planner North Central Texas Council of Governments August 4, 2017
NEPA and Design Public Hearings
 NEPA and Design Public Hearings Monday, December 5, 2016 Washington-Lee High School 1301 N. Stafford Street Arlington, VA 22201 Thursday, December 8, 2016 Mary Ellen Henderson Middle School 7130 Leesburg
Purpose of the Public Hearing
 www.virginiadot.org Public Hearings Interstate 66 - Outside the Beltway Tier 1 Draft Environmental Impact Statement From U.S. Route 15 To I-495 Prince William and Fairfax Counties Wednesday, March 13,
Wood-Washington-Wirt Interstate Planning Commission (WWW-IPC) PM 2.5 Air Quality Conformity Determination Report [2005]
![Wood-Washington-Wirt Interstate Planning Commission (WWW-IPC) PM 2.5 Air Quality Conformity Determination Report [2005]](/thumbs/94/120791542.jpg "Wood-Washington-Wirt Interstate Planning Commission (WWW-IPC) PM 2.5 Air Quality Conformity Determination Report [2005]") Wood-Washington-Wirt Interstate Planning Commission (WWW-IPC) PM 2.5 Air Quality Conformity Determination Report [2005] [Technical Report-Summary] Prepared by Sreevatsa Nippani, Transportation Specialist,
Wood-Washington-Wirt Interstate Planning Commission (WWW-IPC) PM 2.5 Air Quality Conformity Determination Report [2005] [Technical Report-Summary] Prepared by Sreevatsa Nippani, Transportation Specialist,
Air Quality Technical Memorandum
 Southeast Extension Project Lincoln Station to RidgeGate Parkway Prepared for: Federal Transit Administration Prepared by: Denver Regional Transportation District May 2014 Table of Contents Page No. Chapter
AIR QUALITY IMPACT ANALYSIS
 FEDERAL BOULEVARD (5 TH AVENUE TO HOWARD PLACE) PLANNING ENVIRONMENTAL LINKAGE STUDY AIR QUALITY IMPACT ANALYSIS Prepared for: City and County of Denver 201 West Colfax Avenue, Department 509 Denver, CO
Air Quality Analysis Technical Memorandum
 Air Quality Analysis Technical Memorandum Segment 2: State Road 400 (SR 400) / Interstate 4 (I-4) from West of SR 528 (Beachline Expressway) to West of SR 435 (Kirkman Road) Orange County (75280), Florida
Dispersion Modeling for Mobile Source Applications
 Dispersion Modeling for Mobile Source Applications Chad Bailey EPA Office of Transportation and Air Quality Regional, State, and Local Air Modelers Workshop Philadelphia, PA May 14, 2009 1 Overview Upcoming
NCHRP Task 78. Programmatic Agreements for Project-Level Air Quality Analyses
 NCHRP 25-25 Task 78 Programmatic Agreements for Project-Level Air Quality Analyses Prepared for: American Association of State Highway and Transportation Officials Standing Committee on Environment Prepared
A. INTRODUCTION AND METHODOLOGY
 Chapter 11: Air Quality A. INTRODUCTION AND METHODOLOGY This chapter and its accompanying appendix (Appendix I) present a project-level analysis of the potential local and regional air quality impacts
The No-Build Alternative would not result in any project-related construction and would therefore not directly impact energy consumption.
 3.3 ENERGY Methodology Consideration of energy consumption and conservation potential of alternatives and mitigation measures in Environmental Impact Statement (EIS) documents is required by Council of
Categorical Exclusion (CE)
") Categorical Exclusion (CE) Project Information Project Name: Rte 130 Bridge Replacement over Pedlar River Federal Project#: BR-005-3(116) Project Number: 0130-005-643, B650, C501, P101, R201 Project Type:
Categorical Exclusion (CE) Project Information Project Name: Rte 130 Bridge Replacement over Pedlar River Federal Project#: BR-005-3(116) Project Number: 0130-005-643, B650, C501, P101, R201 Project Type:
CHAPTER 11. Air Quality and the Transportation Plan
 Chapter 11. Air Quality and the Transportation Plan 159 CHAPTER 11. Air Quality and the Transportation Plan Background Air quality in Anchorage is subject to national ambient air quality standards established
OKI S CONFORMITY PROCESS
 AIR QUALITY CONFORMITY DETERMINATION FOR THE OKI 2040 METROPOLITAN TRANSPORTATION PLAN AND THE AMENDED OKI FY 2018 FY2021 TRANSPORTATION IMPROVEMENT PROGRAM (AMENDMENT 9C) FOR THE KENTUCKY PORTION OF THE
APPENDIX E EMISSIONS ESTIMATE FOR GENERAL CONFORMITY
 APPENDIX E EMISSIONS ESTIMATE FOR GENERAL CONFORMITY Environmental and Planning Consultants 440 Park Avenue South, 7th Floor New York, New York 10016 tel: 212-696-0670 fax: 212-213-3191 www.akrf.com Memorandum
NO2, SO2, PM2.5, Oh my!?! Information Session EPA R/S/L Modelers Workshop May 10, 2010
 NO2, SO2, PM2.5, Oh my!?! Information Session EPA R/S/L Modelers Workshop May 10, 2010 Purpose & Outline Provide background and updates on permit modeling processes and technical aspects related to new
Appendix K. Detroit River International Crossing Study Air Quality Impact Analysis Technical Report Addendum
 Appendix K Detroit River International Crossing Study Air Quality Impact Analysis Technical Report Addendum Detroit International River Crossing Air Quality Impact Analysis Technical Report Addendum November
Final Air Quality Analysis
 Prepared For: Bow Concord I-93 Improvements Project Bow and Concord, NH Final Air Quality Analysis Prepared By: NHDOT Project No. 13742 53 Regional Drive Concord, NH 03301 June, 2018 CONTENTS 1 Introduction...
AIR QUALITY WRITTEN REEVALUATION/TECHNICAL REPORT
 APPENDIX B AIR QUALITY WRITTEN REEVALUATION/TECHNICAL REPORT TABLE OF CONTENTS 1.0 INTRODUCTION... 1 1.1 Purpose... 1 1.2 Methodology and Approach... 1 2.0... 3 2.1 2004 Analysis Methods & Prevailing Regulations/Guidelines...
COMMONWEALTH OF VIRGINIA STATE AIR POLLUTION CONTROL BOARD REGULATIONS FOR THE CONTROL AND ABATEMENT OF AIR POLLUTION
 COMMONWEALTH OF VIRGINIA STATE AIR POLLUTION CONTROL BOARD REGULATIONS FOR THE CONTROL AND ABATEMENT OF AIR POLLUTION 9VAC5 CHAPTER 30. AMBIENT AIR QUALITY STANDARDS. 9VAC5-30-10. General. 9VAC5-30-15.
Amendment 4 - OKI 2040 REGIONAL TRANSPORTATION PLAN
 Amendment 4 - OKI 2040 REGIONAL TRANSPORTATION PLAN October, 2018 Prepared by the Ohio-Kentucky-Indiana Regional Council of Governments Acknowledgments Title Amendment 4 - OKI 2040 Regional Transportation
Appendix D. Tier 2 Final Environmental Assessment I-66 Transportation Technical Report
 Tier 2 Final Environmental Assessment I-66 Transportation Technical Report Appendix D Travel Demand Model & Post Processing Methodology & Assumptions Technical Memorandum FINAL AUGUST 2016 TECHNICAL MEMORANDUM
Eastside Transit Corridor Phase 2 Draft Environmental Impact Statement/ Environmental Impact Report APPENDIX R
 Eastside Transit Corridor Phase 2 Draft Environmental Impact Statement/ Environmental Impact Report APPENDIX R AIR QUALITY IMPACTS AND HEALTH RISK ASSESSMENT TECHNICAL MEMORANDUM State Clearinghouse Number:
Air Q ualit y Con formity Det er minat ion a n d Document at io n 8 -Hour Ozone & P M 2.5
 AQ Air Q ualit y Con formity Det er minat ion a n d Document at io n 8 -Hour Ozone & P M 2.5 2022 Transportation t Program and related amendments t o Connected2045, t h e transportation plan for the region.
Air Q ualit y Con formity Det er minat ion a n d Document at io n 8 -Hour Ozone & P M 2.5
 AQ Air Q ualit y Con formity Det er minat ion a n d Document at io n 8 -Hour Ozone & P M 2.5 2022 Transportation t Program and related amendments t o Connected2045, t h e transportation plan for the St.
2007 Chugiak-Eagle River Long-Range Transportation Plan and Transportation Improvement Program. PM-10 Air Quality Conformity Determination
 2007 Chugiak-Eagle River Long-Range Transportation Plan and 2006-2008 Transportation Improvement Program PM-10 Air Quality Conformity Determination Prepared By: Municipality of Anchorage Traffic Department
AIR QUALITY AND CLIMATE CHANGE EVALUATION GUIDANCE
 AIR QUALITY AND CLIMATE CHANGE EVALUATION GUIDANCE The following guidance provides additional details regarding the process followed by PSRC to evaluate projects for potential air quality benefits. As
Environmental Consequences and Mitigation
 Chapter 4 Environmental Consequences and Mitigation 4.1 Introduction This chapter provides a detailed description of the impacts (and indirect impacts where applicable) associated with the alternatives
VTrans2040 Multimodal Transportation Plan Corridors of Statewide Significance Needs Assessment North-South Corridor
 VTrans2040 Multimodal Transportation Plan Corridors of Statewide Significance Needs Assessment North-South Corridor Table of Contents I. Corridor Overview Demographics and Economic Trends Corridor Travel
MONITORING IMPLEMENTATION AND PERFORMANCE
 12 MONITORING IMPLEMENTATION AND PERFORMANCE The FAST Act continues the legislation authorized under MAP-21, which created a data-driven, performance-based multimodal program to address the many challenges
Pima Association of Government s Air Quality Forum June 23, 2015
 Pima Association of Government s Air Quality Forum June 23, 2015 Proposed new 8-hour ozone standard Background Proposed NAAQS Final NAAQS National and Regional Maps Planning or Implementation Requirements
Interstate-290 Carbon Monoxide Build vs No-build Analysis For Individual Intersection Locations in Oak Park
 Interstate-290 Carbon Monoxide Build vs No-build Analysis For Individual Intersection Locations in Oak Park Description Carbon monoxide (CO) is an odorless, colorless gas that is somewhat lighter than
Air Quality Memorandum - DRAFT
 Air Quality Memorandum - DRAFT REPORT NO. 39 DATE February 15, 2019 SUBJECT CONFORMITY ANALYSIS FOR THE WFRC 2019-2050 REGIONAL TRANSPORTATION PLAN. ABSTRACT The FAST Act and the Clean Air Act Amendments
Appendix 6-1 CO Screening Memorandum
 Appendix 6-1 CO Screening Memorandum 550 Kearny Street Suite 800 San Francisco, CA 94108 415.896.5900 phone 415.896.0332 fax www.esassoc.com memorandum date December 23, 2016 to cc from subject Wade Wietgrefe,
4.4 Air Quality Regulatory Setting. Federal
 station designs will complement the areas in which they are located. Executing these mitigation measures will not result in any impacts after mitigation. The opening of the LPA as a single phase under
I 95 EXPRESS LANES SOUTHERN TERMINUS EXTENSION TRAFFIC OPERATIONS AND SAFETY ANALYSIS REPORT
 I 95 EXPRESS LANES SOUTHERN TERMINUS EXTENSION TRAFFIC OPERATIONS AND SAFETY ANALYSIS REPORT February 2016 INTERSTATE 95 EXPRESS LANES SOUTHERN TERMINUS EXTENSION PROJECT Commonwealth of Virginia Virginia
A. INTRODUCTION B. POLLUTANTS FOR ANALYSIS
 Chapter 18: Air Quality A. INTRODUCTION The potential for air quality impacts from the proposed project is examined in this chapter. Air quality impacts can be either direct or indirect. Direct impacts
A. INTRODUCTION B. POLLUTANTS FOR ANALYSIS
 Chapter 18: Air Quality A. INTRODUCTION The potential for air quality impacts from the proposed project is examined in this chapter. Air quality impacts can be either direct or indirect. Direct impacts
Richmond, Virginia 8-Hour Ozone Maintenance Area. Transportation Conformity Analysis
 , Virginia 8-Hour Ozone Maintenance Area Transportation Conformity Analysis 2035 Long Range Transportation Plan and FY 12-15 Transportation Improvement Program Draft Report Prepared by: Virginia Department
MD State Highway Administration PM 2.5 Hotspot Analysis Lessons Learned
 MD State Highway Administration PM 2.5 Hotspot Analysis Lessons Learned AASHTO Air Quality Peer Exchange Presentation May 6, 2014 Purpose of Presentation Describe Types of Projects Analyzed Review Analysis
The Regional Transportation Plan Appendix D. Regional Air Quality Conformity Analysis. Puget Sound Regional Council.
 The 2018 Appendix D Regional Air Quality Conformity Analysis May 2018 Puget Sound Regional Council May 2018 Funding for this document provided in part by member jurisdictions, grants from U.S. Department
Richmond, Virginia Former 8-Hour Ozone Maintenance Area. Transportation Conformity Analysis
 Richmond, Virginia Former 8-Hour Ozone Maintenance Area Transportation Conformity Analysis FY 18-21 Transportation Improvement Program and 2040 Long Range Transportation Plan Draft Report Prepared by: