Preface. Riparian Wetland Restoration Site Selection Using GIS
|
|
|
- Todd O’Neal’
- 6 years ago
- Views:
Transcription
1
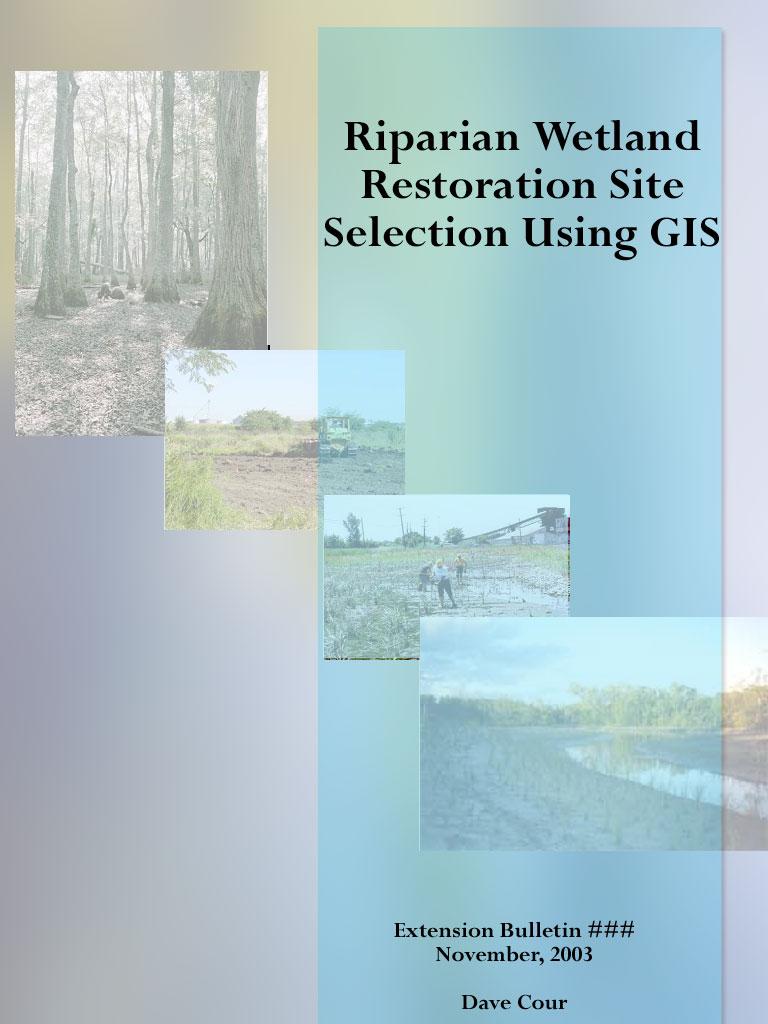
2 Riparian Wetland Restoration Site Selection Using GIS i Preface This bulletin is intended as a guide for managers, planners, and policy-makers involved in wetland restoration projects. This step-by-step process is meant to be a first step in site selection and will not replace necessary fieldwork to determine if a particular site is suitable for a specific project. While this method is designed for restoration site selection of riparian wetlands, with some slight modifications the process can be applied to other wetland types as well. This is not intended as a tutorial for using GIS software. A basic understanding of ArcGIS 8.3, including menu item options, projections and formatting is a prerequisite for completing these analyses.
3 Riparian Wetland Restoration Site Selection Using GIS ii Contents Introduction...1 Materials...2 Identifying Suitable Restoration Areas...3 Advanced Processes...11 Conclusions...14 References...15
4 Riparian Wetland Restoration Site Selection Using GIS 1 Introduction Recognition of wetland values has stimulated interest in protecting these ecosystems from further losses. These ecosystems provide services including flood abatement, improving water quality, supporting biodiversity and recharging aquifers (Zedler, 2003). In addition to protecting our remaining wetlands, it has become evident that further steps are necessary to enhance our wetland resources. Beginning in the early 1990's, the U. S. Fish and Wildlife Service and the U. S. Department of Agriculture s Natural Resources Conservation Service began an effort to reverse the tide of wetland losses by establishing wetland restoration programs. These programs, and others like them at the state and local level, are an increasingly popular strategy for stemming the loss of wetland functions as land is developed or converted for agricultural uses. Choosing the right wetland mitigation site is important because the conditions needed to form wetlands are quite complex, and failure to meet wetland conditions is common. Project failures may result in low-quality wetlands and high reconstruction costs. Site selection can be a long and tedious process. Candidate sites are evaluated by examining the hydrology, landscape setting, soil, and plant types (Mitsch, 2000). To try and minimize the time and expense required for selecting candidate sites, geographic information systems (GIS) can be used to help select and prioritize candidate restoration sites. There are many different kinds of wetlands and many functions that wetlands perform. The processes described in this bulletin are specific to riparian wetlands that are being restored to minimize the impact of nutrient loading in the watershed. The case study used as an example is in the lower Neuse River watershed in eastern North Carolina. The Neuse River is classified as a nutrient sensitive watershed by the Water Quality Committee of the state Environmental Management Commission. As part of this classification, wetland regulations are strictly enforced and actions taken to improve water quality are strongly encouraged (NC DENR-DWQ, 2001).
5 Riparian Wetland Restoration Site Selection Using GIS 2 Materials The following data layers are needed to complete the process. 1. Soils data: This dataset should contain the hydric status of the soils. An A indicates primary hydric classification by the NRCS while a B denotes secondary hydric status. CGIA: Soils, Detailed County Surveys - North Carolina Center for Geographic Information & Analysis. Var dates. 2. Hydrography: Riparian areas require a nearby channel. CGIA: Hydrography (1:24,000) - North Carolina Center for Geographic Information & Analysis Hydrologic Units: We will need to delineate the watershed we are interested in. For maximum flexibility, this dataset should include watershed delineations at HUC-8, HUC-11 and HUC-14 levels. CGIA: Hydrologic Units: Subbasins - North Carolina Center for Geographic Information & Analysis Land use/ Landcover (LULC): Restoration projects take place on impacted landscapes. We will identify potential project areas by looking at how land is utilized within the watershed. EPA BASINS: Landuse/Landcover Spatial Data of CONUS - U.S. Environmental Protection Agency

6 Riparian Wetland Restoration Site Selection Using GIS 3 Identifying Suitable Restoration Areas Follow these steps to determine the possible restoration sites in your study area: 1. Select Area To begin with, you need to know the area in which your search will be confined. In this instance, we will start at a large scale in the lower Neuse watershed and get more specific as the process continues (Figure 1). If you know the specific catchment in which you plan to restore a wetland, it may be easier to begin at that level. 2. Clip Layers to Area If the GIS data layers you start with are larger than your study area, you should clip your data to the extent of your study area. You do not need to waste time performing analyses outside your area of interest. Clip these layers to the borders of your study area in ArcMap by selecting the Geoprocessing Wizard from the Tools menu (Figure 2). Your input layer is the soils, hydrography or LULC layer you want to clip and the clip layer is boundary of your study area from step 1. Add your clipped hydrography shapefile to your active map display (Figure 3).

7 Riparian Wetland Restoration Site Selection Using GIS 4 3. Create Buffer Create a 200 foot buffer around the clipped hydrography layer in ArcMap by selecting the Buffer Wizard from the Tools menu. Depending on the extent of hydrology and size of your project area, this process may take some time.
8 Riparian Wetland Restoration Site Selection Using GIS 5 4. Create Hydric Soils Layer In ArcCatalog, make two copies of your soils dataset. Name one pri_hyd.shp and one sec_hyd.shp. Add both of these to your active map display. In ArcMap choose Select By Attributes from the Selection menu (Figure 4). Choose pri_hyd.shp from the layer pulldown menu and choose Hydric from the list of fields. Click the equal sign and then select from the unique fields dialog. Click the OR button and then choose the Hydric field and click the equal sign again. Now choose the B from the unique fields dialog box. Your selection statement should read: "HYDRIC" = ' ' OR "HYDRIC" = 'B'. Click the Apply button. After the areas are selected, close the Select By Attributes window and choose Editor, Start Editing (Figure 5). Select the soil layers and choose the Modify Features task with pri_hyd selected as the target. Right click on the selection in the Display window and choose Delete. Save your edits. The pri_hyd layer now only has soils with A as the hydric status. Repeat the above steps for sec_hyd, choosing the soils with B as the hydric status. 5. Create Impacted Land Use Layer Using the same methods described in the previous step, create a shapefile from the original LULC shapefile that includes only impacted (agriculture, urban, etc.) land uses. 6. Select LULC that Intersect Buffer In ArcMap choose Select By Location from the Selection menu. Select features from the impacted LULC layer created in the previous step that intersect features in the 200 foot buffer created in step 3 (Figure 6). Once these features are selected, right-click on the impacted LULC layer and select Open Attribute Table (Figure 7a). Click the Options button at the bottom of the new window and select Switch Selection (Figure 7b). Choose Start Editing from the Editor menu and select the impacted LULC layer as your target. Delete the selected items (impacted land use areas that do not have a connection within 200 feet of a channel). Save your edits and stop editing.

9 Riparian Wetland Restoration Site Selection Using GIS 6 7. Convert Shapefiles to Rasterfiles Now we need to combine the impacted LULC layer with the each of the hydric soils layers. The easiest way to do this is with the Spatial Analyst tool. The files we are currently using are not compatible with this type of analysis, so first we will need to convert our features to raster data. From the Spatial Analyst menu, select Convert Features to Raster (Figure 8a). For the soils layers, make sure that the Field is indicating the Hydric field and change the output cell size to 10. For the LULC layer the field should be pointing to the field that indicated the LULC code and the cell size should also be 10 (Figure 8b).


10 Riparian Wetland Restoration Site Selection Using GIS 7 8. Classify Data Layers For our calculations we will want all of the files to have either a one or a zero at every point. The soils layers should be classified this way now, but the LULC layer will have multiple values. To change all of these values to ones, select Reclasify from the Spatial Analyst menu. Click on each of the new values and change each of them to one. Enter an output file and click OK. 9. Combine Layers To combine the LULC layer with the soil layers, choose Raster

11 Riparian Wetland Restoration Site Selection Using GIS 8 Calcualtor from the Spatial Analyst menu. Choose the LULC layer, click on the * and then choose one of the soil layers (Figure 9). Click the Evaluate button. This will select locations where there are both impacted LULC with a connection to a channel and hydric soils. This will return a calculation layer. Right-click on the calculation layer and select Make Permanent. Add the permanent file to your map and delete the calculation layer. Repeat this step for the other soil layer. 10. Convert Rasterfiles Back to Shapefiles From the Spatial Analyst menu, select Convert Raster to Features. Select one of the input raster files, make sure that the Output geometry type pulldown is pointed to Polygon and save your output.

![Check Advanced (Figure 10). Type the following VBA statement in the first text box: Dim dblarea as double Dim parea as IArea Set parea = [shape] dblarea = parea.](/docs-images/75/71962634/images/12-1.jpg "area Type the variable dblarea in the text box directly under the area field name. Click OK. 12. Convert to Acres Right-click on the combined LULC/ hydric soil layer and select Open Attribute Table.")
12 Riparian Wetland Restoration Site Selection Using GIS Calculate Area Right-click on one of the combined LULC/ hydric soil layers and select Open Attribute Table. Click the Options button at the bottom of the new window and select Add Field. Name the new field Area and select Float as the Type. Right-click the field heading for Area. Click Calculate Values. Check Advanced (Figure 10). Type the following VBA statement in the first text box: Dim dblarea as double Dim parea as IArea Set parea = [shape] dblarea = parea.area Type the variable dblarea in the text box directly under the area field name. Click OK. 12. Convert to Acres Right-click on the combined LULC/ hydric soil layer and select Open Attribute Table. Click the Options button at the bottom of the new window and select Add Field. Name the new field Acres and select Float as the Type. Right-click the field heading for Acres. Click Calculate Values. Double-click on Area
. Click OK. 13.")
13 Riparian Wetland Restoration Site Selection Using GIS 10 and then type / in the text box to convert square meters to acres (if your projection is not in square meters, calculate the correct conversion factor). Click OK. 13. Delete Areas Less Than 10 Acres Right-click on the combined LULC/ hydric soil layer and select Open Attribute Table. Right-click the field heading for Acres and choose Sort Ascending. Select all the rows that have less than ten acres. Choose Start Editing from the Editor menu and select the combined LULC/ hydric soil layer as your target. Delete the selected items (combined LULC/ hydric soils less than 10 acres). Save your edits and stop editing. Repeat steps 11, 12 and 13 for the other combined LULC/ hydric soil layer. You now have potential restoration locations that are ten or more acres. You can look at these at a higher resolution at the HUC-14 level (Figure 11).
14 Riparian Wetland Restoration Site Selection Using GIS 11 Advanced Processes The above processes can help you quickly and easily identify potential restoration sites, by locating areas that have a hydrologic connection to a channel and a high likelihood for having hydric soils. What if that is not enough? With the LULC layers we already have and a model developed to predict nutrient loading in small watersheds we can predict how wetland restoration will affect nutrient levels and select the sites that have the most impact. The Simple Method was developed for the Center for Watershed Protection by Thomas Schueler to evaluate nutrient loading in a subcatchment. The calculation of annual pollutant loads (pounds/acres per time interval) uses the following formula: L = (R)(C)(2.72) or L = [(P)(Pj)(Rv)/12](C)(2.72)A Where: Rv = Mean runoff coefficient, expressing the fraction of rainfall converted into runoff Rv = (I) I = Percent of site imperviousness R = Runoff (acre-feet per time interval) R = [(P)(Pj)(Rv)/12](A) P = Rainfall depth over desired time interval (inches) Pj = Fraction of rainfall events that produce runoff (0.9 default value for this study) A = Area of the site (acres) L = Urban runoff load (pounds/acres per time interval) C = Flow-weighted mean concentration of the pollutant in urban runoff (mg/l or ppm) 12 = Conversion factor (inches/foot) 2.72 = Conversion factor (pounds/acre-foot-ppm) For the purposes of this study, where water quality data is not available for each subcatchment, the Simple Method provides a mechanism to differentiate between subcatchments using LULC data. The additional necessary inputs- precipitation, pollution concentration by land use type, and area are all available data, so that estimates of pollutant loading by subcatchment can be made based on land use types. The intent is to uniformly estimate pollutant loading across each subcatchment and use those estimates to compare and rank the subcatchments in a relative way.
, we can look at which areas of the watershed have the worst nutrient problems and then examine which candidate sites might have")
15 Riparian Wetland Restoration Site Selection Using GIS 12 This nutrient model requires small land areas to be effective. By breaking up one of the HUC-14 units into subcatchments (Figure 12), we can look at which areas of the watershed have the worst nutrient problems and then examine which candidate sites might have the most impact in reducing nutrient loads. We have the LULC data that we started with at the beginning of these exercises. We can select the land uses in each of the subcatchments to calculate the total area in each land use in a given subcatchment. These values can be entered into spreadsheets developed for use with the Simple Method to calculate the nutrient level in each of the subcatchments (Figure 13)*. Once nutrient loads are calculated, land use values can be changed to alleviate pressures in the most heavily impacted subcatchments (Fig 14).

16 Riparian Wetland Restoration Site Selection Using GIS 13 * - The other coefficients such as precipitation and runoff coefficients are all available and their calculations are beyond the scope of this report.
17 Riparian Wetland Restoration Site Selection Using GIS 14 Conclusions Restoration is a complex process that requires planning, implementation, monitoring, and management. Site selection is a vital step in the early planning process. While the process outlined above does not eliminate the need for field data collection, it could greatly reduce the amount of time needed to complete these tasks, creating valuable savings in the planning process and saving project funds for the implementation and monitoring phases. While other more complex selection strategies take factors such as hill slope and elevation into account, this method provides the means for completing the analyses quickly and succinctly. The major limitation affecting the results will be the resolution of the data.
18 Riparian Wetland Restoration Site Selection Using GIS 15 References Mitsch, W.J. and J.G. Gosselink Wetlands: Third Edition. John Wiley and Sons, Inc. New YorK, NY. North Carolina Department of Environment & Natural Resources, Division of Water Quality Neuse River Basin Basinwide Assessment Report. Raleigh, NC. Zedler, J. B Wetlands at your service: Reducing impacts of agriculture at the watershed scale. Frontiers in Ecology and Environment.
Laura Zanolli Geography Major/GIS/Geology/Water Resources Portland State University
 Laura Zanolli Geography Major/GIS/Geology/Water Resources Portland State University The canopy is one part of a system of shade and cover that promotes bank stability and along with vegetation helps to
Learn how to design inlet grates, detention basins, channels, and riprap using the FHWA Hydraulic Toolbox and WMS
 v. 11.0 WMS 11.0 Tutorial Learn how to design inlet grates, detention basins, channels, and riprap using the FHWA Hydraulic Toolbox and WMS Objectives Learn how to use several Hydraulic Toolbox calculators
UTILIZING GEOGRAPHIC INFORMATION SYSTEMS TO IDENTIFY AND MONITOR CONCENTRATED ANIMAL FEEDING OPERATIONS IN DUPLIN COUNTY, NC
 UTILIZING GEOGRAPHIC INFORMATION SYSTEMS TO IDENTIFY AND MONITOR CONCENTRATED ANIMAL FEEDING OPERATIONS IN DUPLIN COUNTY, NC Sean Burke Graduate Student Department of Geography and Geology University of
TAC CHARRETTE WORKBOOK Ecosystem Management and Sustainable Forestry Practices
 For Discussion Purposes TAC CHARRETTE WORKBOOK Ecosystem Management and Sustainable Forestry Practices NEW JERSEY HIGHLANDS COUNCIL March 28, 2006 1 Overview of RMP Goals and Structure NEW JERSEY HIGHLANDS
West Fork White River Watershed Conservation Map Summaries. Prepared for the Beaver Watershed Alliance. By the Watershed Conservation Resource Center
 West Fork White River Watershed Conservation Map Summaries Prepared for the Beaver Watershed Alliance By the Watershed Conservation Resource Center November 2014 The Watershed Conservation Resource Center
Evaluating Wetland Function Using Geographic Information Systems:
 Evaluating Wetland Function Using Geographic Information Systems: A Method for Land-Use Planning by Benjamin Owen Bearden A Master s Project submitted to the faculty of the University of North Carolina
TARGETING WATERSHEDS FOR RESTORATION ACTIVITIES IN THE CHESAPEAKE BAY WATERSHED. Technical Documentation October 4, 2002
 TARGETING WATERSHEDS FOR RESTORATION ACTIVITIES IN THE CHESAPEAKE BAY WATERSHED Technical Documentation October 4, 2002 Acknowledgements and Disclaimer This project was funded by the Chesapeake Bay Foundation,
BASINS EXERCISE. 2) Select the Locate your Watershed webpage (located at:
 Select the Locate your Watershed webpage (located at:") BASINS EXERCISE Overview This exercise was created for the Fox-Wolf Watershed Alliance - Stormwater 2003 Conference. Funding was provided by the University of Wisconsin Sea Grant Institute and UW Land
BASINS EXERCISE Overview This exercise was created for the Fox-Wolf Watershed Alliance - Stormwater 2003 Conference. Funding was provided by the University of Wisconsin Sea Grant Institute and UW Land
WMS Tools For Computing Hydrologic Modeling Parameters
 WMS Tools For Computing Hydrologic Modeling Parameters Lesson 9 9-1 Objectives Use the drainage coverage as a basis for geometric parameters as well as overlaying coverages to compute important hydrologic
Using GIS for Prioritization in Subwatershed Restoration
 Using GIS for Prioritization in Subwatershed Restoration Elena Horvath Advisor: Joseph Bishop, PhD November 10, 2011 The Pennsylvania State University Master in Geographic Information Systems www.gis.psu.edu
CONTINUOUS RAINFALL-RUN OFF SIMULATION USING SMA ALGORITHM
 CONTINUOUS RAINFALL-RUN OFF SIMULATION USING SMA ALGORITHM INTRODUCTION Dr. R N Sankhua Director, NWA, CWC, Pune In this continuous rainfall-runoff simulation, we will perform a continuous or long-term
New Jersey Forest Stewardship Program Spatial Analysis Project Map Products And Data Layers Descriptions
 New Jersey Forest Stewardship Program Spatial Analysis Project 2007 Map Products And Data Layers Descriptions 01/07 NJ Forest Stewardship Program (FSP) Spatial Analysis Project (SAP) Methodology Project
Bronx River Pollutant Loading Model Summary
 Bronx River Pollutant Loading Model Summary Section of River Located in Bronx County Table of Contents Drainage Areas...2 Data Sets Used for Analysis...2 Land Use Statistics...3 Model Calculations...3
Lab 5: Watershed hydrology
 Lab 5: Watershed hydrology Objectives In this lab, you will learn the fundamentals of flow routing and channel network extraction, and analyze precipitation and discharge data to explore the control of
RECHARGE MAPPING: A GIS based tool for identifying areas of land with significant groundwater recharge
 RECHARGE MAPPING: A GIS based tool for identifying areas of land with significant groundwater recharge September 2009 Prepared in collaboration by: Carol Haskins, Pomperaug River Watershed Coalition Glenda
Training Course Brochure Building Capacity in Rural & Urban Water Management
 Training Course Brochure 2015 Building Capacity in Rural & Urban Water Management Introduction The WastePro Academy seeks to encourage the use of desktop software applications in the water and environmental
DANE COUNTY COMPREHENSIVE PLAN 5-YEAR UPDATE. Comprehensive Plan Steering Committee 10/10/2013 Chapter 8: Land Use
 DANE COUNTY COMPREHENSIVE PLAN 5-YEAR UPDATE Comprehensive Plan Steering Committee 10/10/2013 Chapter 8: Land Use Policy-Neutral Changes to Land Use Chapter Remove references to specific recommended ordinance
A Spatial and Temporal Analysis of Groundwater Elevation in the Colorado. River Delta in Response to the Minute 319 Pulse-Flow.
 A Spatial and Temporal Analysis of Groundwater Elevation in the Colorado River Delta in Response to the Minute 319 Pulse-Flow by Stephanie Arnold GIS term project Dr. David Maidment Energy and Earth Resources
A STATEWIDE APPROACH FOR IDENTIFYING POTENTIAL AREAS FOR WETLAND RESTORATION AND MITIGATION BANKING IN GEORGIA: AN ECOSYSTEM FUNCTION APPROACH
 A STATEWIDE APPROACH FOR IDENTIFYING POTENTIAL AREAS FOR WETLAND RESTORATION AND MITIGATION BANKING IN GEORGIA: AN ECOSYSTEM FUNCTION APPROACH Elizabeth A. Kramer and Steven Carpenedo AUTHORS: University
Great Lakes Riparian Opportunity Assessment Methodology New York Natural Heritage Program September 25, 2015
 Great Lakes Riparian Opportunity Assessment Methodology New York Natural Heritage Program September 25, 2015 OBJECTIVES The goal of this analysis is to assemble a suite of riparian habitat quality indicators
WASA Quiz Review. Chapter 2
 WASA Quiz Review Chapter 2 Question#1 What is surface runoff? part of the water cycle that flows over land as surface water instead of being absorbed into groundwater or evaporating Question #2 What are
Urban Growth and Water Quality: Applying GIS to identify vulnerable areas in the Sandhills region of NC. Tatyana Soroko
 Urban Growth and Water Quality: Applying GIS to identify vulnerable areas in the Sandhills region of NC By Tatyana Soroko Date: Approved: Dr. Robert Healy, Advisor Masters project submitted in partial
A GEOGRAPHIC INFORMATION SYSTEM BASED CONCEPTUAL MODEL FOR EVALUATING WETLAND SIGNIFICANCE
 Coasts at the Millennium Proceedings of the 17th International Conference of The Coastal Society, Portland, OR USA A GEOGRAPHIC INFORMATION SYSTEM BASED CONCEPTUAL MODEL FOR EVALUATING WETLAND SIGNIFICANCE
West Virginia Watershed Assessment Pilot Project Outline & Assessment Methodology March 2012
 Introduction The West Virginia Watershed Assessment Pilot Project was developed to define the methodology and identify the information and tools necessary to meet the project objectives stated below. The
L-THIA GIS Manual. (Long-Term Hydrologic Impact Assessment) By Youn Shik Park, Kyoung Jae Lim, Larry Theller, Bernie A. Engel
 By Youn Shik Park, Kyoung Jae Lim, Larry Theller, Bernie A. Engel") L-THIA GIS Manual (Long-Term Hydrologic Impact Assessment) By Youn Shik Park, Kyoung Jae Lim, Larry Theller, Bernie A. Engel Manual version: May 6 th 2013 Department of Agricultural and Biological Engineering
L-THIA GIS Manual (Long-Term Hydrologic Impact Assessment) By Youn Shik Park, Kyoung Jae Lim, Larry Theller, Bernie A. Engel Manual version: May 6 th 2013 Department of Agricultural and Biological Engineering
Background. Literature Review
 Ms. Joanna Helms Economic Development Director Town of Apex 73 Hunter Street P.O. Box 250 Apex, North Carolina 27502 October 23, 2015 Reference: Report of Wetland Determination Cash Perkins Site ECS Project
Aqueduct 2.0 Project Water Indicators
 Aqueduct 2.0 Project Water Indicators The Aqueduct 2.0 is a project of the World Resources Institute, which was the source of the indicators presented here (Gassert et al., 2013). Sustainability Goals:
A Visualization of Water Resources in Montgomery County, Texas By James Bronikowski
 A Visualization of Water Resources in Montgomery County, Texas By James Bronikowski Introduction: Groundwater has been a cheap reliable source of water since people first began settling the upper gulf
Section 303(d) of the 1972 Federal Clean Water Act and EPA regulation 40 CFR 130.7
 of the 1972 Federal Clean Water Act and EPA regulation 40 CFR 130.7") Modeling bacteria flow from wildlife in the Leon basin, TX Sonny Kwon I. Background Section 303(d) of the 1972 Federal Clean Water Act and EPA regulation 40 CFR 130.7 require states to identify water bodies
Modeling bacteria flow from wildlife in the Leon basin, TX Sonny Kwon I. Background Section 303(d) of the 1972 Federal Clean Water Act and EPA regulation 40 CFR 130.7 require states to identify water bodies
Land Use Scenarios to Assess Global Change Impacts on Water
 Land Use Scenarios to Assess Global Change Impacts on Water Resources and Ecosystems Phil Morefield Britta Bierwagen National Center for Environmental Assessment Office of Research and Development U.S.
DRAFT FOR CONSIDERATION AT THE APRIL 27, 2006 MEETING OF NATURAL RESOURCES COMMITTEE OF THE HIGHLANDS COUNCIL
 RMP Component: Resource Assessment / Ecosystem Assessment Technical Report: Forest Integrity Council Committee: Natural Resource Committee Memorandum Title: Technical Approach to Define Highlands Forest
Introduction. What is a River Basin Restoration Priority? Criteria for Selecting a Targeted Local Watershed (TLW) Savannah River Basin Overview
 Savannah River Basin Overview") Savannah River Basin Restoration Priorities 2008 2 TABLE OF CONTENTS Introduction 1 What is a River Basin Restoration Priority? 1 Criteria for Selecting a Targeted Local Watershed (TLW) 2 Savannah River
Savannah River Basin Restoration Priorities 2008 2 TABLE OF CONTENTS Introduction 1 What is a River Basin Restoration Priority? 1 Criteria for Selecting a Targeted Local Watershed (TLW) 2 Savannah River
Measuring watershed alteration with land cover data
 Measuring watershed alteration with land cover data Using land cover and other data to compare levels of anthropogenic alteration across space and time in eight watersheds in North Carolina Katie Lutton
Applying ArcGIS in Water Resources Engineering
 Applying ArcGIS in Water Resources Engineering At this point the reader should have a feel for how ArcGIS technology may be applied in various real world examples, from business applications to science
Deriving Harvestable Area in Arcata Community Forest
 Deriving Harvestable Area in Arcata Community Forest By: Abstract Kittens with Mittens Corey Humphrey and Taylor Jensen The Arcata Community Forest (ACF), along with education and recreation, is used for
GreenPlan Modeling Tool User Guidance
 GreenPlan Modeling Tool User Guidance Prepared by SAN FRANCISCO ESTUARY INSTITUTE 4911 Central Avenue, Richmond, CA 94804 Phone: 510-746-7334 (SFEI) Fax: 510-746-7300 www.sfei.org Table of Contents 1.
APPENDIX B. If the GRANIT Data Mapper gets stuck during an operation, use the refresh button in your browser.
 APPENDIX B ANSWERING QUESTIONS THAT REQUIRE THE GRANIT DATA MAPPER ONLINE TOOLS AND PRINTED MAPS (Remaining questions are answered during field checking) Each of the questions in the table on the following
Wetlands. DuPage County Stormwater Ordinance Update- Wetlands and Buffers. Is a Stormwater Permit Required? 7/13/2012
 DuPage County Stormwater Ordinance Update- Wetlands and Buffers PRESENTED BY: MARY BETH FALSEY WETLAND SPECIALIST Wetlands Section 15-18.A.1.a: If a Stormwater Administrator has the expertise, he/she can
DWQ Credit Yield Subcommittee Meeting May 4, 2009 EEP Headquarters, Raleigh, NC
 DWQ Credit Yield Subcommittee Meeting May 4, 2009 EEP Headquarters, Raleigh, NC Attendance Jim Stanfill, NC Ecosystem Enhancement Program Barrett Jenkins, Restoration Systems, Inc Lin Xu, NC Ecosystem
Hydrology and Flooding
 Hydrology and Flooding Background The 1996 flood Between February 4, 1996 and February 9, 1996 the Nehalem reporting station received 28.9 inches of rain. Approximately 14 inches fell in one 48 hour period.
APPENDIX IV. APPROVED METHODS FOR QUANTIFYING HYDROLOGIC CONDITIONS OF CONCERN (NORTH ORANGE COUNTY)
") APPENDIX IV. APPROVED METHODS FOR QUANTIFYING HYDROLOGIC CONDITIONS OF CONCERN (NORTH ORANGE COUNTY) Hydromodification design criteria for the North Orange County permit area are based on the 2- yr, 24-hr
APPENDIX IV. APPROVED METHODS FOR QUANTIFYING HYDROLOGIC CONDITIONS OF CONCERN (NORTH ORANGE COUNTY) Hydromodification design criteria for the North Orange County permit area are based on the 2- yr, 24-hr
A NEW GIS APPROACH TO WATERSHED ASSESSMENT MODELING
 A NEW GIS APPROACH TO WATERSHED ASSESSMENT MODELING Del Bottcher, Ph.D., P.E Soil and Water Engineering Technology, Inc. 3448 NW 12th Ave, Gainesville, FL 32605 and Jeffrey G. Hiscock, P.E. Mock, Roos
Assessing Long-term Hydrological Impacts of Climate Change Across Wisconsin
 ENVIRONMENTAL AND ECONOMIC RESEARCH AND DEVELOPMENT PROGRAM Assessing Long-term Hydrological Impacts of Climate Change Across Wisconsin Executive Summary August 2012 PREPARED BY: ADAM C. MEDNICK; THERESA
Groundwater Flow Evaluation and Spatial Geochemical Analysis of the Queen City Aquifer, Texas
 Groundwater Flow Evaluation and Spatial Geochemical Analysis of the Queen City Aquifer, Texas Abstract The Queen City Aquifer is a saturated sandstone unit in the coastal plain of East Texas. The goals
Appendix I. Potential Adverse Change to Wetland Function Methodology and Results
 Appendix I Potential Adverse Change to Wetland Function Methodology and Results Technical Memorandum North Florida Regional Water Supply Plan Potential Adverse Change to Wetland Function January 3, 2017
ILF Instrument Development and Execution. The North Carolina Experience September 15, 2010
 ILF Instrument Development and Execution The North Carolina Experience September 15, 2010 Presentation Overview EEP Background Instrument Development Process Content of Agreement Q&A (but feel free to
Creating a Value-Added Wetlands Layer: Enhancing the Utility of Wetland Mapping in Montana Karen Newlon Montana Natural Heritage Program Helena, MT
 Creating a Value-Added Wetlands Layer: Enhancing the Utility of Wetland Mapping in Montana Karen Newlon Montana Natural Heritage Program Helena, MT Wetlands & Riparian Mapping Wetland and riparian digital
Calculating a Pollution Potential Index for Storm Water Runoff at the Watershed Scale Ranking watersheds for potential non-point pollution
 Calculating a Pollution Potential Index for Storm Water Runoff at the Watershed Scale Ranking watersheds for potential non-point pollution Philip Dougherty GISC 6387 7-27-2006 Introduction Non-point source
Alix Scarborough, Project Manager. Melissa Keen, GIS Analyst. Matthew Leach, GIS Analyst. Chad Sydow, GIS Analyst
 Alix Scarborough, Project Manager Melissa Keen, GIS Analyst Matthew Leach, GIS Analyst Chad Sydow, GIS Analyst Watershed and Tree Canopy Association in Austin, TX Project Proposal Prepared by Trees in
A Hydrologic Study of the. Ryerson Creek Watershed
 A Hydrologic Study of the Ryerson Creek Watershed Dave Fongers Hydrologic Studies Unit Land and Water Management Division Michigan Department of Environmental Quality May 8, 2002 Table of Contents Summary...2
Reservoir age, increasing human population,
 B-6249 02/12 Eagle Mountain Watershed Management Brent Clayton, Justin Mechell, David Waidler and Clint Wolfe* Reservoir age, increasing human population, and changing land uses have prompted the development
Chapter 5 Design and Use of GIS-based Water Resources Database Models
 Chapter 5 Design and Use of GIS-based Water Resources Database Models Abstract This chapter is about water resource database models for urban and regional environmental concerns. GIS database analysts
Quantification of Forest Cover Change in the Pawcatuck River Watershed: A Multi-Method Analysis
 Quantification of Forest Cover Change in the Pawcatuck River Watershed: A Multi-Method Analysis Rebecca Trueman December 2013 NRS533 Class Project Introduction: The detailed study of landscape pattern
Proximity Exercise: A Risk Assessment for Nuclear Power Plants in Southern New England
 Proximity Exercise: A Risk Assessment for Nuclear Power Plants in Southern New England Written by Barbara Parmenter. Revised 10/18/2018 INTRODUCTION... 1 DATA SETS AND SOURCES... 1 ACCESSING AND PREPARING
Integrating Water Quality and Natural Filters into Maryland s Marine Spatial Planning Efforts
 Integrating Water Quality and Natural Filters into Maryland s Marine Spatial Planning Efforts Nicole Carlozo NOAA Coastal Management Fellow July 31, 2014 Watershed-scale restoration targeting helps direct
Pennichuck Brook Watershed Buildout Analysis December 2003
 INTRODUCTION The Pennichuck Brook watershed (Figure 1) includes approximately 17,700 acres within the communities of Amherst, Hollis, Merrimack, Milford and Nashua and is the primary drinking water supply
GRACE: Tracking Water from Space. Groundwater Storage Changes in California s Central Valley Data Analysis Protocol for Excel: PC
 Groundwater Storage Changes in California s Central Valley Data Analysis Protocol for Excel: PC 2007-10 Before GRACE it was very difficult to estimate how the total volumes of groundwater are changing.
Appendix A. Compliance Calculator Guidance
 Compliance Calculator Guidance Appendix A Appendix A. Compliance Calculator Guidance A.1 Introduction The Center for Watershed Protection created the compliance calculator spreadsheet to allow a designer
Sufficiency of publicly-available data to monitor Central Texas groundwater salamanders
 Katie Lyons CE 394K.3 GIS in Water Resources Term Project Sufficiency of publicly-available data to monitor Central Texas groundwater salamanders Central Texas is home to a group of endemic salamander
Meeting the Chesapeake Bay TMDL
 Meeting the Chesapeake Bay TMDL Local Stormwater Perspective Presented by Rob Hopper, PE Developed with Mike Morgan, PE September 14, 2015 Chesapeake Bay TMDL Local Stormwater Perspective Virginia Stormwater
Upper Cape Fear River Basin Conservation and Restoration Analysis and Strategy
 2012 Upper Cape Fear River Basin Conservation and Restoration Analysis and Strategy Photo from Haw River Assembly Triangle J Council of Governments Piedmont Triad Regional Council September 2012 This page
A Report on Existing and Possible Tree Canopy in the City of Charlotte and Mecklenburg County, NC
 A Report on Existing and Possible Tree Canopy in the City of Charlotte and Mecklenburg County, NC Why is Tree Canopy Important? Tree canopy (TC) is the layer of leaves, branches, and stems of trees that
Wetland Sensitivity to Potential Reductions in Surface Water Flow in the St. Johns River
 Wetland Sensitivity to Potential Reductions in Surface Water Flow in the St. Johns River Palmer Kinser Sandra Fox Environmental Assessment Section St. Johns River Water Management District Outline: Background
SECTION 3 NATURAL RESOURCES
 SECTION 3 NATURAL RESOURCES The natural environment plays a large role in planning for future development. Environmental conditions, such as topography, wetlands, floodplains, and water bodies, can often
BMP 5.4.2: Protect /Conserve/Enhance Riparian Areas
 BMP 5.4.2: Protect /Conserve/Enhance Riparian Areas The Executive Council of the Chesapeake Bay Program defines a Riparian Forest Buffer as "an area of trees, usually accompanied by shrubs and other vegetation,
Understanding Washington, DC s Urban Forest through GIS Holli Howard, Casey Trees May, 2007
 Understanding Washington, DC s Urban Forest through GIS Holli Howard, Casey Trees May, 2007 With a mission to restore, enhance and protect the tree canopy of Washington, DC, Casey Trees has a set of ambitious
The Bear River. Utah s Last Untapped Water Source. Trevor Datwyler
 The Bear River Utah s Last Untapped Water Source Trevor Datwyler CEE 6440 December 2012 Introduction and Background The Bear River has often been called Utah s last untapped water source. The reasons behind
Free Bridge Congestion Relief Project: Using FHWA s Eco-Logical Process
 Free Bridge Congestion Relief Project: Using FHWA s Eco-Logical Process An Ecosystem Approach to Developing Infrastructure Projects June 27, 2014 Charlottesville Albemarle Metropolitan Planning Organization
GIS DECISION SUPPORT TOOLS FOR WATERSHED WATER QUALITY PLANNING
 GIS DECISION SUPPORT TOOLS FOR WATERSHED WATER QUALITY PLANNING Jim Griffin, Ph.D., Environmental Scientist Southwest Florida Water Management District 2379 Broad Street, Brooksville Florida 34609 David
WWHM4 MODELING USING NATIONAL MAP
 WWHM4 MODELING USING NATIONAL MAP Clear Creek Solutions, Inc., 2010 How to create a project that uses national data. WWHM4 is one of the most powerful continuous simulation hydrologic models available.
Wetland and Watershed Management Planning FAQ
 Wetland and Watershed Management Planning FAQ Jon Kusler, Ph.D., Esq., Jennifer Brady-Connor, Nan Stolzenburg Association of State Wetland Managers 2001 This summary was prepared for the Institute for
CUHP 2005 USER MANUAL
 CUHP 2005 USER MANUAL Version 1.4.1 September 3, 2013 URBAN DRAIANGE AND FLOOD CONTROL DISTRICT 2480 WEST 26 TH AVENUE SUITE 156-B DENVER, COLORADO 80211 TELEPHONE: (303) 455-6277 FAX: (303) 455-7880 E-MAIL:
GIS Analysis of Groundwater Transport of Septic Tank Phosphorous in Lake Nebagamon, Wis.
 GIS Analysis of Groundwater Transport of Septic Tank Phosphorous in Lake Nebagamon, Wis. Andrew Austin-Petersen GIS in Water Resources Falls 2016 Introduction Lakes in Wisconsin have long been a source
Main Projects, ESPM5295
 Main Projects, ESPM5295 We have a semester- long project that will help structure our learning. We seek to analyze rainfall- runoff on the St. Paul Campus. A surprising amount of money and effort is spent
WEAP. Water Evaluation And Planning System. Tutorial. A collection of stand-alone modules to aid in learning the WEAP software
 WEAP Water Evaluation And Planning System Tutorial A collection of stand-alone modules to aid in learning the WEAP software WEAP Water Evaluation And Planning System Tutorial Modules Tutorial Overview...
MN CREP CP23 and CP23A
 MN CREP CP23 and CP23A Environmental Benefits Scoring Sheet Instructions 4/14/17 Scoring is a primary means of comparing the environmental benefits of each submitted application for MN CREP. To properly
SECONDARY WETLAND IMPACTS ANALYSIS
 SECONDARY WETLAND IMPACTS ANALYSIS USACE File. SWG-2012-00153 During the development of the Grand Parkway (State Highway 99) Segments H and I-1 from United States Highway 59/Interstate Highway 69 N to
FEMA s Mitigation Support for Resiliency: Innovative Drought and Flood Mitigation Projects
 FEMA s Mitigation Support for Resiliency: Innovative Drought and Flood Mitigation Projects Jordan Williams, CFM Eric Kenney, PE, CFM May 4, 2017 2 Hazard Mitigation Purpose: Research climate resilient
Raritan River Basin. How to protect quality & quantity of water resources? Land Protection and Management to Protect Water Resources
 Land Protection and Management to Protect Water Resources New Jersey Water Supply Authority: Kathy Hale, Principal Watershed Protection Specialist (908) 685-0315 x228 khale@raritanbasin.org Jen Zhang,
A Preliminary Assessment of Ten Watersheds Intersecting Albemarle County, Virginia
 A Preliminary Assessment of Ten Watersheds Intersecting Albemarle County, Virginia Graduate Comprehensive Exam Land Use and Hydrology/ Water Resources Focus Noah D Antonio January 17, 2008 Revised. January
The prioritization list along with the estimated probable construction cost and future cost index is shown in Table 1.
 EXECUTIVE SUMMARY To address flooding concerns and assess costs of potential capital improvement projects associated with flooding in the downtown Town Center Area Plan (TCAP), the Town of Cary commissioned
Modeling the Hydrologic Impacts of Control Structures Utilizing LiDAR, ICPR, and GIS Technologies
 Modeling the Hydrologic Impacts of Control Structures Utilizing LiDAR, ICPR, and GIS Technologies Keanan Bell NorthStar June 12, 2015 Project began in 2010 as a Hydrology Assessment and Conceptual Restoration
San Antonio Water System Mitchell Lake Constructed Wetlands Below the Dam Preliminary Hydrologic Analysis
 San Antonio Water System enhancement. This recommendation was based on limited water quality data provided by SAWS and using a free-water surface constructed wetland with approximately 112 acres of wetted
Development of a GIS Tool for Rainfall-Runoff Estimation
 Development of a GIS Tool for Rainfall-Runoff Estimation Ashraf M. Elmoustafa * M. E. Shalaby Ahmed A. Hassan A.H. El-Nahry Irrigation and Hydraulics Department, Ain Shams University, Egypt NARSS, Egypt
Prioritizing Land Conservation to Protect Water Quality in North Carolina s Triangle Region
 Prioritizing Land Conservation to Protect Water Quality in North Carolina s Triangle Region By Emily Chapin Dr. Dean Urban, Advisor May 2015 Final Draft Masters project submitted in partial fulfillment
Presentation Outline
 Approximation of Discharge Volumes During Precipitation Events for a Portland, Oregon Stormwater System Class Project Presentation Van McKay, James Manzione PSU Geography 592 March 16, 2009 Presentation
Resources: Computers with Internet access and Google Earth standard installed.
 Lesson Plan Political and Watershed Boundaries Project Description: This project is a look into how political boundaries influence watershed protection and management. Goals: Students will understand the
GROUNDWATER RECHARGE. Clear Creek Solutions, Inc., 2010
 GROUNDWATER RECHARGE Clear Creek Solutions, Inc., 2010 Groundwater provides the base flow to streams and wetlands during dry periods. Groundwater also recharges aquifers and provides water for residential,
FieldDoc.org User Guide For 2017 NFWF Chesapeake Bay Stewardship Fund Applicants. Background 2. Step 1: Register for a FieldDoc account 3
 FieldDoc.org User Guide For 2017 NFWF Chesapeake Bay Stewardship Fund Applicants Table of Contents (click to go to page) Background 2 Step 1: Register for a FieldDoc account 3 Step 2: Create the Project
Parcel Prioritization for Drinking Water Protection. in the Upper Neuse River Basin, North Carolina. Anna R. Treadway
 Parcel Prioritization for Drinking Water Protection in the Upper Neuse River Basin, North Carolina by Anna R. Treadway Date: Approved: Dr. Carol Mansfield, Advisor Masters project submitted in partial
Comparison of Streamflow and Precipitation in the Upper Provo River Watershed
 Comparison of Streamflow and Precipitation in the Upper Provo River Watershed By: Steven McKee CEE 6440 GIS in Water Resources Final Project 12/6/2012 0 Table of Contents Introduction... 2 Methods to Determine
From My Backyard to Our Bay It s the 911 for the Chesapeake Bay
 From My Backyard to Our Bay Reporting Problems on Our Bay, Rivers, and Streams We can all be the eyes and ears of our local waterways. Maryland has established the Chesapeake Bay Safety and Environmental
WV WATERSHED ASSESSMENT PILOT PROJECT. Gauley River Kent Mason
 WV WATERSHED ASSESSMENT PILOT PROJECT Gauley River Kent Mason Expert Workshop #2, Round 2 Capitol Conference Center, Charleston. January 8 & 9, 2013 Workshop Outline Day 1 Project Background & Methodology
West Virginia Statewide Forest Resource Assessment 2010
 Issue 4: Water Quality Description: The geospatial goal of priority area delineation for Issue 4 Water Quality was to establish priority rankings by 12 digit Hydrologic Unit Codes (HUC-12) sub-watersheds.
Sustainable STEM Series
 W 338-C Sustainable STEM Series Science, Technology, Engineering and Mathematics for a Sustainable Future All over the media are reports that the United States is falling behind other countries in the
Appendix D: MULTI-AGENCY COMPENSATORY MITIGATION PLAN CHECKLIST 1
 Appendix D: MULTI-AGENCY COMPENSATORY MITIGATION PLAN CHECKLIST 1 Mitigation Goals and Objectives o Describe functions lost at impact site o Describe functions to be gained at mitigation site o Describe
Learning Lab Learning About Tree Benefits Using i-tree Canopy
 P2 / ORGANIZATION Learn about the supplies, P3/ INSTRUCTIONAL PROCESS This section provides an P4 / TREE CANOPY In this section, discover the P5 / DATA PROCESSING This section provides resources and learning
Relationship to E Flows
 Relationship to E Flows Riparian Areas Influences groundwater/surface water relationships Provides filters to improve water quality Provides habitat for diverse flora and fauna Relationship to E Flows
Protecting Open Space & Ourselves
 Protecting Open Space & Ourselves Reducing Flood Risk in the Gulf of Mexico Through Strategic Land Conservation NATURE.ORG/GULF PROTECTING OPEN SPACE & OURSELVES: REDUCING FLOOD RISK IN THE GULF OF MEXICO
Watershed Characteristics and Sediment PAH Contribution from Coal-Tar Sealant EVAN DART CE 394K UNIVERSITY OF TEXAS AT AUSTIN
 2014 Watershed Characteristics and Sediment PAH Contribution from Coal-Tar Sealant EVAN DART CE 394K UNIVERSITY OF TEXAS AT AUSTIN I. Introduction The increase in urbanization in the United States has