Chehalis Basin Strategy Causes of Extreme Flooding. October 11, 2016 Policy Workshop
|
|
|
- Eugene Bailey
- 6 years ago
- Views:
Transcription
1 Chehalis Basin Strategy Causes of Extreme Flooding October 11, 2016 Policy Workshop
2 Agenda Hydrology o Precipitation o Flow Climate Change Effects Land Use o Channel straightening and incision o Riparian zone clearing o Forest practices o Urban runoff (increased impervious surface) 2
3 Precipitation and Flow 3
 79% rain-dominated (light green) Source: Perry et")
4 Chehalis Basin Hydrometeorologic Zones 3.5% Snow-dominated headwaters (dark blue) 17.5% rain-snow transitional (light blue) 79% rain-dominated (light green) Source: Perry et al. 2016

5 Source: United States Average Annual Precipitation, , published in 2012 by PRISM Climate Group, Oregon State University
6 Average Annual Precipitation 80 inches average over the entire basin (approximately 1% in the form of snow) Range from 46 to 50 inches in low-lying valley areas near Centralia and Chehalis To more than 140 inches in the Willapa Hills and 200 inches at some locations in the Olympics 6
7 Atmospheric Rivers Atmospheric Rivers are almost always the cause of major flood events (Nieman et al. 2011) Between 1980 and 2009 Atmospheric Rivers accounted for o 46 of the 48 peak flow events studied in Western Washington o All 12 of the flood events studied in the Satsop River o All peak daily flows that exceeded a 5-year return Heavy precipitation results when moisture source (atmospheric river) interacts with topography 7

8 100-year Precipitation Map (24 hour totals) Source: WSDOT (data analysis by Oregon Climate Service) 8
9 Estimated Peak Flows at Grand Mound Gage Percent Chance Exceedence Return Interval Flow (cfs) , , , , , , , ,600 9
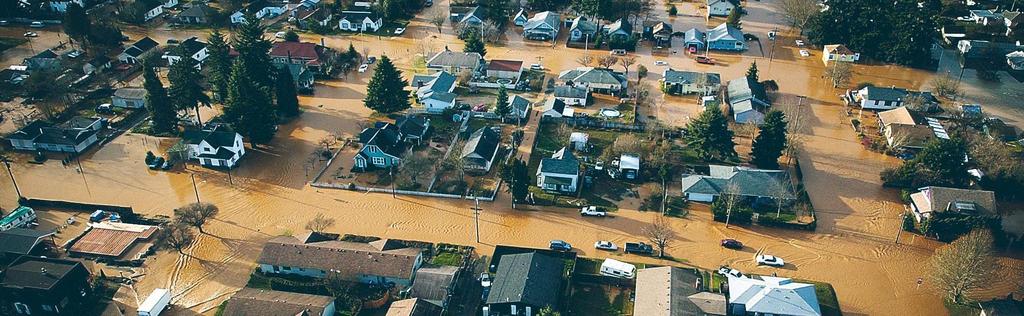
10 Recent Historical Flood Events February 1996 broadly distributed rainfall and widespread flooding. Peak Flow at Grand Mound = 74,700 cfs December 2007 focused in Upper Chehalis and Olympics, Skookumchuck flow reduced by dam. Peak Flow at Grand Mound = 79,100 cfs January 2009 focused in Cascade tributaries and lower Chehalis Basin, still had large contribution from upper Chehalis Basin. Peak flow at Grand Mound = 50,700 cfs 10
11 Recent Historical Flood Events Relative Contributions from Upper Chehalis and Cascade Tributaries for Top 10 Historical Floods 1 Upper Chehalis Contribution Average: 66% Range: 58% to 85% Cascade Tributaries Contribution Average: 34% Range: 15% to 42% 1 Based on USGS historical peaks and mean daily flows 11
12 Relative Contribution of Flooding Water Year Gage Name CHEHALIS RIVER NEAR GRAND MOUND, WA (100-year peak = 75,000 cfs) CHEHALIS RIVER NEAR DOTY, WA (100-year peak = 35,000 cfs) SOUTH FORK CHEHALIS RIVER AT BOISTFORT, WA (100-year peak = 15,200 cfs) NEWAUKUM RIVER NEAR CHEHALIS, WA (100-year peak = 14,400 cfs) SKOOKUMCHUCK RIVER NEAR BUCODA, WA (100-year peak = 12,900 cfs) Date Peak flow (cfs) Peak flow (cfs) Peak flow (cfs) Peak flow (cfs) Peak flow (cfs) Dec-07 79,100 52,600 20,713 12,900 3, Feb-96 74,800 28,900 9,542 13,300 11, Jan-90 68,700 27,500 10,400 8, Nov-86 51,600 17,900 10,700 3, Jan-09 50,700 20,100 11,664 13,000 10, Jan-72 49,200 22,800 6,540 9,770 8, Dec-37 48, Nov-90 48,000 20,600 10,300 8, Dec-33 45, Dec-75 44,800 17,400 6,593 8,020 6, Jan-71 40,800 9,612 3,526 8,390 6,630 12
13 Relative Contribution of Flooding Water Year Date Peak flow at Grand Mound Gage (cfs) From Upper Chehalis DA = 437 mi 2 From Cascade Tribs DA = 400 mi Dec-07 79,100 85% 15% Feb-96 74,800 67% 33% Jan-90 68,700 72% 28% Nov-86 51,600 69% 31% Jan-09 50,700 63% 37% Jan-72 49,200 68% 32% Dec-37 48, Nov-90 48,000 66% 34% Dec-33 45, Dec-75 44,800 69% 31% Jan-71 40,800 53% 47% 13
14 Climate Change and the Chehalis River Guillaume Mauger, Se-Yeun Lee, Christina Bandaragoda, Yolande Serra, and Jason Won
15 Summary of CIG Study Storm dynamics (e.g., wind speeds) are not projected to change, but ocean warming will bring heavier precipitation Flooding is projected to increase Low flows are projected to decrease Models suggest drier conditions in summer New methods have led to improved streamflow estimates, but there remains a large spread among models 15
16 Flooding: Uncertainty Is Larger than Differences Among Tributaries Projected Change in 100-year FLOOD for all Bias-Corrected Chehalis streamflow sites 2050s: Average for all sites and all MACA models: rawwrf, SRES A1B bcwrf, SRES A1B bcmaca, RCP 4.5 bcmaca, RCP 8.5 DHSVM VIC DHSVM VIC DHSVM VIC DHSVM VIC min max min max min max min max avg min max avg min max avg min max avg min max ChehalisR-atPorter year = +66% ChehalisR-nrDoty ChehalisR-nrGrandMound year = +35% NewaukumR-nrChehalis SatsopR-nrSatsop SkookumchuckR-blwBldyRunCr year = +16% SkookumchuckR-nrBucoda SkookumchuckR-nrVail WynoocheeR-abvBlackCr WynoocheeR-abvSaveCr WynoocheeR-nrGrisdale Projected change for 25 a high greenhouse gas -9 scenario Average: All sites Average: Key sites (*) (RCP 8.5), for 2040 to 2099 relative to 1951 to 2005 KEY: +50%: wetter 0: no change 50%: drier 2080s: rawwrf, SRES A1B bcwrf, SRES A1B bcmaca, RCP 4.5 bcmaca, RCP 8.5 DHSVM VIC DHSVM VIC DHSVM VIC DHSVM VIC min max min max min max min max avg min max avg min max avg min max avg min max ChehalisR-atPorter ChehalisR-nrDoty ChehalisR-nrGrandMound

17 Low Flows: Projected to Decrease; Smaller Range Projected Change in 10-year LOW FLOW for all Bias-Corrected Chehalis streamflow sites 2050s: Average for all sites and all MACA models: rawwrf, SRES A1B bcwrf, SRES A1B bcmaca, RCP 4.5 bcmaca, RCP 8.5 DHSVM VIC DHSVM VIC DHSVM VIC DHSVM VIC min max min max min max min max avg min max avg min max avg min max avg min max ChehalisR-atPorter* ChehalisR-nrDoty* year = -7-6% ChehalisR-nrGrandMound* NewaukumR-nrChehalis* year = -14% SatsopR-nrSatsop* SkookumchuckR-blwBldyRunCr SkookumchuckR-nrBucoda* SkookumchuckR-nrVail WynoocheeR-abvBlackCr* Projected change 1-56 for -24 a -18 high 4 greenhouse gas -32 scenario WynoocheeR-abvSaveCr WynoocheeR-nrGrisdale (RCP ), for to relative to to Average: All sites Average: Key sites (*) KEY: +50%: wetter 0: no change 50%: drier 2080s: rawwrf, SRES A1B bcwrf, SRES A1B bcmaca, RCP 4.5 bcmaca, RCP 8.5 DHSVM VIC DHSVM VIC DHSVM VIC DHSVM VIC min max min max min max min max avg min max avg min max avg min max avg min max ChehalisR-atPorter* ChehalisR-nrDoty*
18 Climate Change Effects on 100-year Maximum Daily Flow For worst-case conditions, 100-year flow on upper Chehalis River (near Doty) is estimated to increase by 84% compared to historical flows (from 22,400 cfs to 40,400 cfs) 100-year flow on Newaukum River is estimated to increase by 94% (from 12,400 cfs to 23,900 cfs) While percent increase is slightly higher on the Newaukum, the magnitude of flow increase is greater on the Chehalis River 18
19 Land Use 19
20 Changes in Land Use that Affect Hydrology and Hydraulics Channel straightening and incision Riparian zone clearing Forest practices Land use activities such as increased impervious surfaces, loss of vegetation, and development in the floodplain

21 Floodplain storage The Chehalis watershed has lost much of its natural flood storage
22 Otter Creek (during Hurricane Irene) Time Delay 22

23 Peak Flow Reductions Newaukum Time Delay Peak Reduction Example from North Fork Newaukum River, just downriver from the confluence of South Fork and North Fork Newaukum Rivers, or where North Fork Road meets Jackson Highway 23
24 Land Use: Forest Practices

25 PRISM annual average precipitation in the Chehalis Basin Heavily managed forest Increasing precipitation with increasing elevation Source: Perry et al
 common Source: Perry et al.")
26 Percent tree canopy cover in the Chehalis Basin Heavily managed forests Clearcuts on order of 1 square kilometers (240 acres) common Source: Perry et al

27 Hydrologic Processes with Snow Source: Perry et al Greater accumulation in the open snow lasts longer in the open Longer lasting snow increased chance for rain-on-snow events Rain-on-snow events: forest cover reduces snowmelt contributions 27
28 Hydrologic Processes without Snow Source: Perry et al Less evapotranspiration and interception in the open greater soil moisture in the open Road effects: subsurface flow interception routes runoff more efficiently to stream Road Maintenance and Abandonment Plans created to mitigate this 28
29 Literature Review Key Findings Peak Flows o Channel forming flows increase (statistically significant) o High flows (5-10 year return period) and extreme event flows likely increase, but with unknown statistical significance o Increase lasts 20 or more years Low Flows o Low flows increase, and this lasts about 5 years Source: Perry et al

30 Land Use: Increased Impervious Surfaces and Development
31 Development/Impervious Surface Impervious surfaces are generally confined to developed lands and transportation corridors Total developed area in the Chehalis Basin is 7% (residential homes, shopping centers, industrial facilities) Total impervious area in the Chehalis Basin in 2011 was approximately 1.49% (USGS 2011) o 2001: 1.44% (USGS 2001) o 2006: 1.47% (USGS 2006) 31


32 Twin Cities and Newaukum River Area 32
33 Conclusions In the upper Chehalis, Newaukum, and Skookumchuck River basins: o Land cover is dominated by forestlands and contains lowdensity rural and agricultural development in river valleys o These areas have much less impervious surface than the Chehalis-Centralia area Extreme floods on the Chehalis River, such as those experienced in 2007 and 2009, are the result of atmospheric rivers that deliver high rates of rainfall in the upper Chehalis Basin above the Chehalis-Centralia area However, land uses and floodplain conditions also influence downstream flood timing and extents 33
34 Questions
Rock Creek Floodplain Analysis
 Rock Creek Floodplain Analysis www.co.washington.or.us By Jon Franczyk 1996 Flood, www.co.washington.or.us 1996 Flood, www.co.washington.or.us Project Outline Project Goals Introduction Background Study
Climate Change Impacts on Hydrology of the Western Cascades
 Climate Change Impacts on Hydrology of the Western Cascades Marketa M. Elsner UW Climate Impacts Group Mt Baker - Snoqualmie National Forest Climate Change Workshop April 28, 2011 We care about climate
Planning for Climate Change in the Puget Sound Region. Lara Whitely Binder University of Washington Climate Impacts Group
 Planning for Climate Change in the Puget Sound Region Lara Whitely Binder University of Washington Climate Impacts Group TOOLBOX Peer Networking Series - Climate Adaptation: From Policies to Action March
Climate Change Impacts in the Puget Sound Region Lara Whitely Binder
 Climate Change Impacts in the Puget Sound Region Lara Whitely Binder Climate Impacts Group College of the Environment University of Washington Thurston Climate Adaptation Plan Community Forum April 17,
Climate Impacts Projections: Where the numbers come from and how to put them in context
 Climate Impacts Projections: Where the numbers come from and how to put them in context Guillaume Mauger Climate Impacts Group University of Washington Climate Science in the Public Interest Long-term
Lecture 15: Flood Mitigation and Forecast Modeling
 Lecture 15: Flood Mitigation and Forecast Modeling Key Questions 1. What is a 100-year flood inundation map? 2. What is a levee and a setback levee? 3. How are land acquisition, insurance, emergency response
HYDROLOGY, WATER USE, AND INFRASTRUCTURE
 HYDROLOGY, WATER USE, AND INFRASTRUCTURE Water resources in the Blue Mountains are valued for fisheries and other aquatic biota, recreation, municipal and residential use, vegetation, agriculture, and
Hydrologic Calibration:
 Hydrologic Calibration: UPDATE OF EFFECTIVE HYDROLOGY FOR MARYS CREEK October 2010 Agenda Background Hydrologic model Calibrated rainfall Hydrologic calibration 100 year discharges, Existing Conditions
SECTION IV WATERSHED TECHNICAL ANALYSIS
 A. Watershed Modeling SECTION IV WATERSHED TECHNICAL ANALYSIS An initial step in the preparation of this stormwater management plan was the selection of a stormwater simulation model to be utilized. It
Climate Change Impacts on Water in NW Washington
 Climate Change Impacts on Water in NW Washington Roger Fuller Western Washington University www.skagitclimatescience.org Climate Change: Quick refresher on the mechanism Greenhouse gases in the atmosphere
1 THE USGS MODULAR MODELING SYSTEM MODEL OF THE UPPER COSUMNES RIVER
 1 THE USGS MODULAR MODELING SYSTEM MODEL OF THE UPPER COSUMNES RIVER 1.1 Introduction The Hydrologic Model of the Upper Cosumnes River Basin (HMCRB) under the USGS Modular Modeling System (MMS) uses a
Hydrology. Section C. Introduction
 Section C Hydrology Introduction This section provides the available hydrologic data for the and some analysis of the bed mobility in response reaches of the WAU. The does not receive any significant snow
Lecture 19: Down-Stream Floods and the 100-Year Flood
 Lecture 19: Down-Stream Floods and the 100-Year Flood Key Questions 1. What is a downstream flood? 2. What were the setup conditions that caused the Nov, 1990 Nooksack flood? 3. What is a 100-year flood?
Central America Climate Change: Implications for the Rio Lempa
 Central America Climate Change: Implications for the Rio Lempa Ed Maurer Civil Engineering Department Santa Clara University Santa Clara, CA, USA Andrew Wood Civil and Environmental Engineering Dept. University
Hydrologic Implications of Climate Change for the Western U.S., Pacific Northwest, and Washington State
 Hydrologic Implications of Climate Change for the Western U.S., Pacific Northwest, and Washington State Alan F. Hamlet JISAO/CSES Climate Impacts Group Dept. of Civil and Environmental Engineering University
A Hydrologic Study of the. Ryerson Creek Watershed
 A Hydrologic Study of the Ryerson Creek Watershed Dave Fongers Hydrologic Studies Unit Land and Water Management Division Michigan Department of Environmental Quality May 8, 2002 Table of Contents Summary...2
Cokato Lake (86-263) Wright County. Hydrologic Investigation
 Wright County. Hydrologic Investigation") Cokato Lake (86-263) Wright County Hydrologic Investigation April 14, 2005 Cokato Lake (86-263) Wright County Hydrologic Investigation April 14, 2005 Problem Statement In recent years, heavy rainfall has
Cokato Lake (86-263) Wright County Hydrologic Investigation April 14, 2005 Cokato Lake (86-263) Wright County Hydrologic Investigation April 14, 2005 Problem Statement In recent years, heavy rainfall has
Climate Change Impacts in Washington State
 Climate Change Impacts in Washington State Lara Whitely Binder Climate Impacts Group College of the Environment University of Washington Evergreen College January 13, 2016 Climate Science in the Public
ICELANDIC RIVER / WASHOW BAY CREEK INTEGRATED WATERSHED MANAGEMENT PLAN STATE OF THE WATERSHED REPORT CONTRIBUTION SURFACE WATER HYDROLOGY REPORT
 ICELANDIC RIVER / WASHOW BAY CREEK INTEGRATED WATERSHED MANAGEMENT PLAN STATE OF THE WATERSHED REPORT CONTRIBUTION SURFACE WATER HYDROLOGY REPORT Disclaimer: The hydrologic conditions presented in this
Uncertainty in hydrologic impacts of climate change: A California case study
 Uncertainty in hydrologic impacts of climate change: A California case study Ed Maurer Civil Engineering Dept. Santa Clara University Photos from USGS Motivating Questions What are potential impacts of
Climate Change Impacts in Washington State Lara Whitely Binder
 Climate Change Impacts in Washington State Lara Whitely Binder Climate Impacts Group College of the Environment University of Washington Thurston Regional Planning Council June 3, 2016 The UW Climate Impacts
SECTION III: WATERSHED TECHNICAL ANALYSIS
 Trout Creek Watershed Stormwater Management Plan SECTION III: WATERSHED TECHNICAL ANALYSIS A. Watershed Modeling An initial step this study of the Trout Creek watershed was the selection of a stormwater
Climate Change and its Impacts on Water Resources and Extreme Events in Washington State
 February 2015 Climate Change and its Impacts on Water Resources and Extreme Events in Washington State Regional Historical Trends Climate Change Projections 1920-2012 Temperature Trends Squares aren
2
 1 2 3 4 5 Context Our basin has diverse landscapes from the forested Cascade Mountains, the agricultural Willamette Valley, to the densely populated cities of Eugene, Salem, and Portland. Water flows through
Forests and Water in the Sierra Nevada. Roger Bales, Sierra Nevada Research Institute, UC Merced
 Forests and Water in the Sierra Nevada Roger Bales, Sierra Nevada Research Institute, UC Merced Some motivating points Water is the highest-value ecosystem service associated with Sierra Nevada conifer
Effect of forest management on water yields & other ecosystem services in Sierra Nevada forests UCB/UC Merced/UCANR project
 Effect of forest management on water yields & other ecosystem services in Sierra Nevada forests UCB/UC Merced/UCANR project Some motivating points Water is the highest-value ecosystem service associated
M.L. Kavvas, Z. Q. Chen, M. Anderson, L. Liang, N. Ohara Hydrologic Research Laboratory, Civil and Environmental Engineering, UC Davis
 Assessment of the Restoration Activities on Water Balance and Water Quality at Last Chance Creek Watershed Using Watershed Environmental Hydrology (WEHY) Model M.L. Kavvas, Z. Q. Chen, M. Anderson, L.
Outline. Regional Overview Mine Study Area. Transportation Corridor Study Area. Streamflow Low Flow Peak Flow Snow Small Pools.
 Environmental Baseline Document Surface Water Hydrology Agency Meetings, January 31 to February 3, 2012 Anchorage, Alaska Jaime Cathcart, P.Eng., Ph.D. Outline 2 Regional Overview Mine Study Area Streamflow
M.L. Kavvas, Z. Q. Chen, M. Anderson, L. Liang, N. Ohara Hydrologic Research Laboratory, Civil and Environmental Engineering, UC Davis
 Assessment of the Restoration Activities on Water Balance and Water Quality at Last Chance Creek Watershed Using Watershed Environmental Hydrology (WEHY) Model M.L. Kavvas, Z. Q. Chen, M. Anderson, L.
Portland Water System & PUMA. Lorna Stickel & David Evonuk Resource Protection & Engineering Work Groups
 Portland Water System & PUMA Lorna Stickel & David Evonuk Resource Protection & Engineering Work Groups Presentation Overview 1. Background on Portland System 2. Hydrologic tools used to model our water
Chehalis Basin Strategy Programmatic SEPA Draft EIS
 Chehalis Basin Strategy Programmatic SEPA Draft EIS History of Flooding I-5 closed in 1990, 1996, 2007, 2009 Five largest flood events occurred since 1986 2 History of Habitat Degradation Harvest has been
5.4 Alternative 2: Structural Flood Protection Without Flood Retention Facility
 5.4 Alternative 2: Structural Flood Protection Without Flood Retention Facility Structural Flood Protection Without Flood Retention Facility (Alternative 2) would reduce flood damage during a major flood
Managing Forests for Snowpack Storage & Water Yield
 Managing Forests for Snowpack Storage & Water Yield Roger Bales Professor & Director Sierra Nevada Research Institute UC Merced NASA-MODIS satellite image NASA-MODIS satellite image Outline of talk Mountain
4. Present Activities and Roles
 4. Present Activities and Roles The present missions, authorities, activities and roles of the various agencies involved with flood protection, floodplain management and flood-damage reduction are identified
Trends in Illinois River Streamflow and Flooding
 Trends in Illinois River Streamflow and Flooding H. Vernon Knapp, Interim Director Center for Watershed Science Illinois State Water Survey Institute of Natural Resource Sustainability University of Illinois
Management of Natural and Environmental Resources for Sustainable Agricultural Development. Regional Diversity & Change over the Pacific Northwest
 Management of Natural and Environmental Resources for Sustainable Agricultural Development Regional Diversity & Change over the Pacific Northwest (Maritime, Rangeland, Riparian, Desert, and Forest) By
SNAMP water research. Topics covered
 SNAMP water research SNAMP water team UC Merced Topics covered Objectives, goals & overview What & why the water component of SNAMP Pre-treatment Observations Water Quality Water Quantity Modeling & Scenarios:
The Impacts of Climate Change on Portland s Water Supply
 The Impacts of Climate Change on Portland s Water Supply Richard Palmer and Margaret Hahn University of Washington Department of Civil and Environmental Engineering Joe Dvorak, Dennis Kessler, Azad Mohammadi
Water Supply Board Briefing. Water Operations Department March 22, 2016
 Water Supply Board Briefing Water Operations Department March 22, 2016 Water Supply Briefing California Water Supply District Water Supply Water Supply Projections Water Supply Schedule 2 California Water
Stormwater Management in Your Backyard: Stormwater 101
 Stormwater Management in Your Backyard: Stormwater 101 Gregory Rusciano Program Associate, Water Resources Rutgers Cooperative Extension New Jersey Sea Grant Extension Program How much water do we have?
Sea Level Rise and Recurrent Flooding Update
 Sea Level Rise and Recurrent Flooding Update Informational Briefing City Council Meeting September 18, 2018 Thomas M. Leahy, Deputy City Manager The Sea, Inland Waters, & Groundwater are Rising Projected
Norman Maclean Snowmelt Flow rate Storm flows fs (c flow m a tre S
 Eventually, all things merge into one, and a river runs through it. Norman Maclean Understanding Streamflow ADEQ SW Short Course June 13, 213 Phoenix, AZ Hydrographs Discharge (Q) USGS flow data & plots
Technical Memorandum No Basis of Comparison
 Pajaro River Watershed Study in association with Technical Memorandum No. 1.2.1 Basis of Comparison Task: Basis of Comparison To: PRWFPA Staff Working Group Prepared by: J. Schaaf Reviewed by: R. Raines
Climate Change and Fish in the Pacific Northwest: Case Study of the Snoqualmie River Basin
 Climate Change and Fish in the Pacific Northwest: Case Study of the Snoqualmie River Basin Pete Bisson USDA Forest Service PNW Research Station Olympia, WA U.S. Forest Service Water Strategy 2009-2019
Distribution Restriction Statement Approved for public release; distribution is unlimited.
 CECW-EH-Y Regulation No. 1110-2-1464 Department of the Army U.S. Army Corps of Engineers Washington, DC 20314-1000 Engineering and Design HYDROLOGIC ANALYSIS OF WATERSHED RUNOFF Distribution Restriction
SEWRPC Staff Memorandum
 SEWRPC Staff Memorandum EVALUATION OF PROPOSED STORMWATER QUANTITY MANAGEMENT FOR THE DES PLAINES RIVER WATERSHED PORTION OF THE PROPOSED FOXCONN DEVELOPMENT IN THE VILLAGE OF MOUNT PLEASANT June, 2018
DEVELOPMENT OF A HYDRO-GEOMORPHIC MODEL FOR THE LAGUNA CREEK WATERSHED
 DEVELOPMENT OF A HYDRO-GEOMORPHIC MODEL FOR THE LAGUNA CREEK WATERSHED Agenda Background Hydro-Geomorphic Modeling Methodology HEC-HMS Modeling How is the Model Used Background Proposition 50 Grant Funding
MUD CREEK WATERSHED STUDY PUBLIC MEETING NOVEMBER 7, 2013
 MUD CREEK WATERSHED STUDY PUBLIC MEETING NOVEMBER 7, 2013 AGENDA Purpose of Study Hydrology Hydraulics Floodplain Mapping Floodplain Management Options PURPOSE OF STUDY Upstream Development Near I-80 Bondurant
MINING in a CHANGING CLIMATE Vulnerability, Impacts & Adaptation
 MINING in a CHANGING CLIMATE Vulnerability, Impacts & Adaptation Sudbury 2007 Mining and the Environment Tina Neale Adaptation & Impacts Research Division October 22, 2007 Presentation Outline How is the
California s water cycle: climate, snowpack & forest management
 California s water cycle: climate, snowpack & forest management Roger Bales Professor & Director Sierra Nevada Research Institute UC Merced UC Merced NASA-MODIS satellite image SNRI mission Foster interdisciplinary
IPCC WG II Chapter 3 Freshwater Resources and Their Management
 IPCC WG II Chapter 3 Freshwater Resources and Their Management Impacts increasingly harmful & more costly to adapt as global temperature increases May imperil sustainable development goals Semi-arid /
Changing Climate and Ocean Conditions
 Changing Climate and Ocean Conditions 1 Outline Greenhouse gas emissions - carbon dioxide and other greenhouse gases Impacts of the rapid growth in fossil fuel burning and land use changes Mitigation reducing
San Luis Obispo Creek Watershed Hydrologic Model Inputs
 Jeff Werst San Luis Obispo County Department of Public Works 1050 Monterey Street San Luis Obispo CA 93408 December 14, 2007 Subject: San Luis Obispo Creek Watershed Hydrology and Hydraulic Model Dear
Effects of projected climate change on energy supply and demand in the Pacific Northwest and Washington State
 Effects of projected climate change on energy supply and demand in the Pacific Northwest and Washington State Alan F. Hamlet Se-Yeun Lee Kristian Mickelson Marketa McGuire Elsner JISAO/CSES Climate Impacts
SAN BERNARD RIVER WATER QUALITY MODEL UPDATE. August 18, 2011
 SAN BERNARD RIVER WATER QUALITY MODEL UPDATE August 18, 2011 Agenda Model Set-up Watershed model Watershed delineations Generate model input files & establish coefficients Receiving Water model Establish
Uncertainty in Hydrologic Modelling for PMF Estimation
 Uncertainty in Hydrologic Modelling for PMF Estimation Introduction Estimation of the Probable Maximum Flood (PMF) has become a core component of the hydrotechnical design of dam structures 1. There is
DRAINAGE MASTER PLAN FOR THE TOWN OF BLOOMING GROVE AND VILLAGES OF WASHINGTONVILLE AND SOUTH BLOOMING GROVE
 DRAINAGE MASTER PLAN FOR THE TOWN OF BLOOMING GROVE AND VILLAGES OF WASHINGTONVILLE AND SOUTH BLOOMING GROVE PUBLIC MEETING March 8, 2017 LOGISTICS Meeting Agenda: Presentation (7:15 7:45 pm) [Auditorium]
Uncertainty in projected impacts of climate change on water
 1928 2000 Uncertainty in projected impacts of climate change on water Ed Maurer Civil Engineering Cambio Climático y Políticas Públicas Centro de Cambio Global Universidad Católica de Chile 23 abril 2009
Impacts of Permit-Exempt Wells
 Impacts of Permit-Exempt Wells Dave Nazy, LHG August 24, 2018 1 Impacts of Permit-Exempt Wells Introduction ESSB 6091 Example Impacts Calculation Basin Estimate & 20-year Projections Offsetting Impacts
Hydrology and Water Management. Dr. Mujahid Khan, UET Peshawar
 Hydrology and Water Management Dr. Mujahid Khan, UET Peshawar Course Outline Hydrologic Cycle and its Processes Water Balance Approach Estimation and Analysis of Precipitation Data Infiltration and Runoff
Climate Change and Water Resources: A Primer for Municipal Water Providers
 Climate Change and Water Resources: A Primer for Municipal Water Providers David Yates & Kathleen Miller National Center for Atmospheric Research 1. Introduction A recent collaboration between the AWWA
Black River Watershed Management Plan Plan
 Black River Watershed Management Plan Plan Final Report Part II: Appendices May 2010 This watershed management plan was prepared for the New York State Department of State Division of Coastal Resources
THE EFFECTS OF URBANIZATION ON THE MINGO CREEK WATERSHED
 THE EFFECTS OF URBANIZATION ON THE MINGO CREEK WATERSHED by Tim Marshall (presented at the Sixth Conference on Hydrometeorology in Indianapolis, IN, 1984) 1. INTRODUCTION Urbanization of flood plains presents
Overview of the Surface Hydrology of Hawai i Watersheds. Ali Fares Associate Professor of Hydrology NREM-CTAHR
 Overview of the Surface Hydrology of Hawai i Watersheds Ali Fares Associate Professor of Hydrology NREM-CTAHR 5/23/2008 Watershed Hydrology Lab 1 What is Hydrology? Hydrology is the water science that
Hydrologic Modeling with the Distributed-Hydrology- Soils- Vegetation Model (DHSVM)
") Hydrologic Modeling with the Distributed-Hydrology- Soils- Vegetation Model (DHSVM) DHSVM was developed by researchers at the University of Washington and the Pacific Northwest National Lab 200 Simulated
Hydrologic Modeling with the Distributed-Hydrology- Soils- Vegetation Model (DHSVM) DHSVM was developed by researchers at the University of Washington and the Pacific Northwest National Lab 200 Simulated
HYDROLOGY REPORT HEACOCK & CACTUS CHANNELS MORENO VALLEY, CALIFORNIA NOVEMBER 2005 REVISED APRIL 2006 REVISED AUGUST 2006
 HYDROLOGY REPORT HEACOCK & CACTUS CHANNELS MORENO VALLEY, CALIFORNIA NOVEMBER 2005 REVISED APRIL 2006 REVISED AUGUST 2006 RIVERSIDE COUNTY FLOOD CONTROL AND WATER CONSERVATION DISTRICT TABLE OF CONTENTS
CHAPTER 1 INTRODUCTION. Stream processes are strongly related to the physical conditions of the
 1 CHAPTER 1 INTRODUCTION Stream processes are strongly related to the physical conditions of the watershed from which they flow. Alterations to physical conditions of a watershed manifest themselves through
Impacts of 2015 Drought on Streamflow in the Columbia River Basin
 Impacts of 2015 Drought on Streamflow in the Columbia River Basin Chris Konrad US Geological Survey Tacoma, WA May 11, 2016 1 Overview of USGS Investigation Western US had low snowpack, warm temperatures,
WASA Quiz Review. Chapter 2
 WASA Quiz Review Chapter 2 Question#1 What is surface runoff? part of the water cycle that flows over land as surface water instead of being absorbed into groundwater or evaporating Question #2 What are
Working with the Water Balance
 Working with the Water Balance Forest Hydrology and Land Use Change Paul K. Barten, Ph.D. Professor of Forestry and Hydrology Department of Environmental Conservation www.forest-to-faucet.org The Living
Increasing Flood Mitigation Through the Use of Bonus Capacity of Drinking Water Reservoirs
 Increasing Flood Mitigation Through the Use of Bonus Capacity of Drinking Water Reservoirs Matthew M. Del Ciello Josh Galster Montclair State University 2016 Passaic River Symposium Factors Affecting Flooding:
CENTRAL ASSINIBOINE INTEGRATED WATERSHED MANAGEMENT PLAN SURFACE WATER HYDROLOGY REPORT
 CENTRAL ASSINIBOINE INTEGRATED WATERSHED MANAGEMENT PLAN SURFACE WATER HYDROLOGY REPORT Planning Area Boundary: The Central Assiniboine planning area covers the reach of the Assiniboine River from just
Climate and Land Use Consequences to 100-Year Flooding
 Climate and Land Use Consequences to 100-Year Flooding Robert Roseen D.WRE, PE, PhD, Ann Scholz, PE, CPSWQ, Thomas Ballestero, PhD, PE, PH, UNH Stormwater Center Nebraska Post- Construction Stormwater
Climate Change in the. Pacific Northwest. Impacts, Choices, and Change
 Climate Change in the UW Climate Impacts Group Pacific Northwest Impacts, Choices, and Change UW Climate Impacts Group http://www.yakima.net/ Philip Mote, Lara Whitely Binder Climate Impacts Group Center
Technical Memorandum. Hydraulic Analysis Smith House Flood Stages. 1.0 Introduction
 Technical Memorandum Hydraulic Analysis Smith House Flood Stages 1.0 Introduction Pacific International Engineering (PIE) performed a hydraulic analysis to estimate the water surface elevations of the
Climate Change Water Implications for Michigan Communities, Landsystems and Agriculture
 Climate Change Water Implications for Michigan Communities, Landsystems and Agriculture Distinguished Senior Research Specialist Department of Geography Institute of Water Research Climate Change Summary
Water Budget III: Stream Flow P = Q + ET + G + ΔS
 Water Budget III: Stream Flow P = Q + ET + G + ΔS Why Measure Streamflow? Water supply planning How much water can we take out (without harming ecosystems we want to protect) Flood protection How much
Culvert Sizing procedures for the 100-Year Peak Flow
 CULVERT SIZING PROCEDURES FOR THE 100-YEAR PEAK FLOW 343 APPENDIX A: Culvert Sizing procedures for the 100-Year Peak Flow A. INTRODUCTION Several methods have been developed for estimating the peak flood
Water Budget III: Stream Flow P = Q + ET + G + ΔS
 Water Budget III: Stream Flow P = Q + ET + G + ΔS Why Measure Streamflow? Water supply planning How much water can we take out (without harming ecosystems we want to protect) Flood protection How much
5/11/2007. WinTR-55 for Plan Reviewers Small Watershed Hydrology Hydrology Terms and Definitions
 WinTR-55 for Plan Reviewers Small Watershed Hydrology Hydrology Terms and Definitions 1 Course Outline Overview Review of Hydrology Terms and Definitions Modeling Single Sub-area Watersheds Multiple Sub-area
I DON T CARE WHAT THEY SAY, THIS GLOBAL WARMING SCARE IS JUST A BUNCH OF LOONY LEFT- WING ENVIRONMENTAL ANTI-GROWTH HYPE! SO, IS THIS YOUR FIRST
 I DON T CARE WHAT THEY SAY, THIS GLOBAL WARMING SCARE IS JUST A BUNCH OF LOONY LEFT- WING ENVIRONMENTAL ANTI-GROWTH HYPE! SO, IS THIS YOUR FIRST WINTER HERE IN BLAINE? Salt Lake City Tribune August 2015
21st Century Climate Change In SW New Mexico: What s in Store for the Gila? David S. Gutzler University of New Mexico
 21st Century Climate Change In SW New Mexico: What s in Store for the Gila? David S. Gutzler University of New Mexico gutzler@unm.edu Silver City, NM June 5, 2008 Global Warming in the 20th/Early 21st
Under a Changing Climate:
 Engineering Methods for Precipitation Under a Changing Climate: Outline of the Problem J. Rolf Olsen Institute for Water Resources U.S. Army Corps of Engineers Alexandria, Virginia ASCE Committee on Adaptation
Selected Hydrological Tools for In-stream Flow Analysis
 Hydrology Days 2014 Selected Hydrological Tools for In-stream Flow Analysis Robert T Milhous 1 Hydrologist. Fort Collins, Colorado 80526 Abstract: The selection of an instream need for a river requires
Non-stationary methods to Battle the Inland Sea
 Discharge (cfs) Non-stationary methods to Battle the Inland Sea KARA DIFRANCESCO, PHD CANDIDATE WATER RESOURCES ENGINEERING, OREGON STATE UNIVERSITY Time Dec Jan 1862 Feb 1940 Jan 1997 Future projections
Watershed Response to Water Storage. 8/1/2012 Paul Wymar Scientist Chippewa River Watershed Project
 Watershed Response to Water Storage 8/1/2012 Paul Wymar Scientist Chippewa River Watershed Project Chippewa River Watershed 1.3 Million Acres Largest tributary watershed in the Minnesota River Basin 7
Pre-Event Activities. Blue River. Pre Field Trip Suggestions
 Blue River Have you heard we all live in a watershed? Well, it is true! This total body activity will allow students to demonstrate how water flows in a watershed while exploring how seasonal variations
Modelling the Hydrologic Effects of. in the San Jose Watershed
 Modelling the Hydrologic Effects of Climate Change and Forest Management in the San Jose Watershed R.D. (Dan) Moore PhD PGeo Georg Jost PhD Departments of Geography and Forest Resources Management The
Effect of Land Surface on Runoff Generation
 Effect of Land Surface on Runoff Generation Context: Hydrologic Cycle Runoff vs Infiltration Infiltration: Process by which water on the ground surface enters the soil Runoff: Water (from rain, snowmelt,
SLIDES: Summary The California Perspective and California Perspective: Climate Change and Water Resources
 University of Colorado Law School Colorado Law Scholarly Commons Climate Change and the Future of the American West: Exploring the Legal and Policy Dimensions (Summer Conference, June 7-9) Getches-Wilkinson
Bird Track Springs Basis of Design Report APPENDIX HYDROLOGIC ANALYSIS FOR BIRD TRACK RESTORATION PROJECT
 Bird Track Springs Basis of Design Report APPENDIX C HYDROLOGIC ANALYSIS FOR BIRD TRACK RESTORATION PROJECT Technical Memorandum Date March 1, 2016 To: From: RE: Mike Knutson, Bureau of Reclamation Nick
Calibrating the Soquel-Aptos PRMS Model to Streamflow Data Using PEST
 Calibrating the Soquel-Aptos PRMS Model to Streamflow Data Using PEST Cameron Tana Georgina King HydroMetrics Water Resources Inc. California Water Environmental and Modeling Forum 2015 Annual Meeting
The Iowa Watershed Approach Antonio Arenas Assistant Research Engineer
 A vision for a more resilient Iowa Antonio Arenas Assistant Research Engineer antonio-arenasamado@uiowa.edu 1 Average annual precipitation (inches). Estimates are based on the 30-year annual average (1981-2010).
The Impact of Wetland Drainage on the Hydrology of a Northern Prairie Watershed
 John Pomeroy, Xing Fang, Stacey Dumanski, Kevin Shook, Cherie Westbrook, Xulin Guo, Tom Brown, Adam Minke, Centre for Hydrology, University of Saskatchewan, Saskatoon, Canada The Impact of Wetland Drainage
EFFECT OF UPSTREAM DEVELOPMENT ON THE CLEAR CREEK AREA
 EFFECT OF UPSTREAM DEVELOPMENT ON THE CLEAR CREEK AREA Technical Memorandum Farming in the Floodplain Project Prepared for May 2017 PCC Farmland Trust Photo credit: Google Earth TABLE OF CONTENTS Page
The Drainage Basin System
 The Drainage Basin System These icons indicate that teacher s notes or useful web addresses are available in the Notes Page. This icon indicates that the slide contains activities created in Flash. These
Water Budget III: Stream Flow P = Q + ET + G + ΔS
 Water Budget III: Stream Flow P = Q + ET + G + ΔS Why Measure Streamflow? Water supply planning How much water can we take out (without harming ecosystems we want to protect) Flood protection How much
Runoff Processes. Daene C. McKinney
 CE 374 K Hydrology Runoff Processes Daene C. McKinney Watershed Watershed Area draining to a stream Streamflow generated by water entering surface channels Affected by Physical, vegetative, and climatic
Lecture 1 Integrated water resources management and wetlands
 Wetlands and Poverty Reduction Project (WPRP) Training module on Wetlands and Water Resources Management Lecture 1 Integrated water resources management and wetlands 1 Water resources and use The hydrological
Freight Street Development Strategy
 Freight Street Development Strategy Appendix B: Naugatuck River Floodplain Analysis Freight Street Development Strategy DECEMBER 2017 Page B-1 1.0 NAUGATUCK RIVER FLOODPLAIN AT FREIGHT STREET 1.1 Watershed