Summary. River. 5 th 8 th. about the. Chemical. anteceden. Grade Level: 5 th. 12 th. Objectives: instructions to. determine the. Chicago River Field
|
|
|
- Jessie Hill
- 6 years ago
- Views:
Transcription
1 Water Chemistry Monitoring Chicago River Field Trip Activity Summary Students use basic to advanced water quality monitoring kits and probes to assess the water quality of the Chicago River. Water chemistry kits available for loan from Friends of the Chicago River include: GREEN kits for 5 th 8 th grade, and Hach kits for 9 th 12 th grade. GREEN kits include materials for temperature, ph, dissolved oxygen, biological oxygen demand, phosphate,, and nitrates. Hach kits include materials for temperature, ph, dissolved oxygen, biological oxygen demand, phosphate, and nitrates. Turbidity tubes, total dissolved solids probes, and Coliscan Easygel testss (fecal coliform/e. coli) are also available but need to be requested separately from the kits. Background With chemical tests you are testing for the presence and concentration of specific chemicals. Results will only tell you about the specific chemicals you tested, not about the possible presence of other pollutants. Chemical tests also only tell you what is present in the water at the moment you test. Factors, such as anteceden weather conditions (such as rainfall), time of day and year, will affect values. Grade Level: 5 th 12 th Duration: Variable (depending on type of monitoring kit used, experience of students and number of tests performed). Objectives: 1. Students will follow written instructions to determine the value of a variety of water quality indicators of the Chicago River. 2. Students will be able to explain what the water quality values mean for the health of the river. 3. Students will be able to infer what might be causing any water quality impairments. Materials: Water quality testing kits, enough for students to share Water quality data sheets, one per group Standards: 11.A..3a, 11.A.4a, 11.A.5a, 11.A..3c, 11.A.4c, 11.A.3d, 11.A..4d, 11.A.5d, 11.A.3e, 11.A..4e, 11.A.5e, 11.A.3f, 11.A..4f, 11.A.3g, 12.B.3a, 12.B. 4a NGSS: MS-ETS1-1, MS-ETS1-2, MS-ETS1-3, MS-LS2-3, HS-ETS1-1, HS-ETS1-2, HS-ETS1-3, 6.SP.4, 6.SP.5c, 7.SP. 7, HS-S-ID1-4, HS-S-IC-6, RST , SL.8. 5 p. 1


], too high (alkaline) or too low")

2 Temperature Importance: too highh a value willl preclude cold water animals from living in the river, less oxygen can dissolve in water the higher its temperature, higher temperatures promote higher growth rates. Sources (of high temperatures): hot water discharges (particularly power plants), lack of shade. <13 C: Suitable for cold-water species such as trout, mayflies, caddisflies, and stoneflies C: Suitable for some salmon, mayflies caddisflies, stoneflies, and beetles C: Suitable for most other fish, invertebrates, and warm water species. >25 C: Lethal to trout, salmon, many aquatic insects, and most cold water species. ph Importance: indicates the number of free hydrogen ions in the water [ph = -log10 (H+)], too high (alkaline) or too low (acidic) a value will preclude many forms of life from living in the water. Sources: acid rain, mining (note: in the Chicago region the ph of rivers, lakes and ponds is buffered by limestone bedrock and is quite often above 7.5) : Aquatic life is severely stressed : Few fish and invertebrates can survive : Acid-tolerant invertebrates and fish can survive : Suitable for human consumption : Suitable for most aquatic animals : Suitable for most aquatic plants. p. 2
 ). 0-3.0 : Few organisms can survive. 3.0-4.")

 DO(day 5)].")

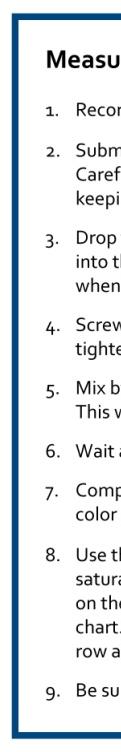
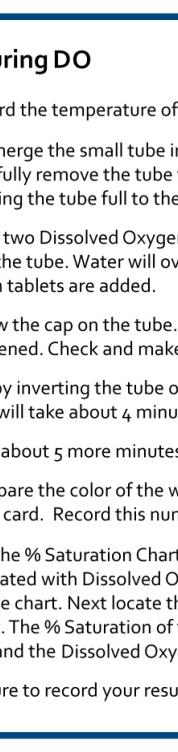
3 Dissolved Oxygen Importance: breathed by aquatic animals. Sources: by-product of photosynthesis, mixed in from air when water is turbulent (in riffles) ) : Few organisms can survive : Only a few fish and invertebrates can survive : Most non-trout, warm-water fish species can survive. 5.0 : EPA s suggested lower limit to maintain healthy aquatic biota. >7.0 : Necessary for trout, salmon and many invertebrates. Biological Oxygen Demand (BOD) Importance: Breathed by aquatic animals, it s what s remains after 5 days of bacterial decomposition [DO(day 1) DO(day 5)]. Sources: By-product of photosynthesis, mixed in from air when water is turbulent (in riffles) ), after bacteria use up what they need. <5.0 : Indicates good water quality. >5.0 : Indicates poor water quality. The procedure for BOD is the same as DO. On day 1, perform a DO test. Your BOD sample is gathered at the same time and needs to be stored for five days in total darkness (wrapped in aluminumm foil) and kept at room temperature. Then the DO test is done again. BOD = [DO(day 1) DO( (day 5)]. p. 3


4 Phosphates Importance: promotes growth, excessive levels can lead to eutrophication and fish kills and reduction in biodiversity. Sources: fertilizers, detergents : Typical of undisturbed forest streams. <0.5 : Suitable for human consumption : May increase aquatic plant growth. >0.1 : Likely to cause algal blooms. 1.0 : Approximate ideal upper limit for wastewater treatment plant effluent. p. 4


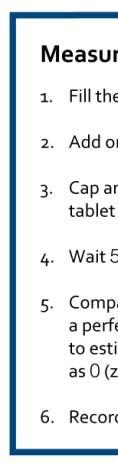
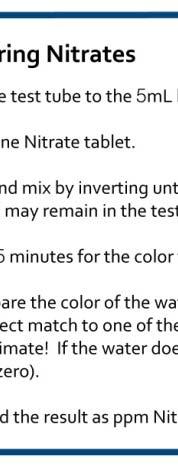
5 Nitrates Importance: promotes growth, excessive levels can lead to eutrophication and fish kills and reduction in biodiversity. Sources: fertilizers. 0.1 : Typical of undisturbed forest streams : May increase aquatic plant growth. >1.0 : Likely to cause algal blooms. <10.0 : Suitable for human consumptionn <90.0 : No direct effect on fish p. 5
6 Turbidity (Total Suspended Solids or TSS) Importance: impedes breathing of animals with gills, impedes filter feeding, and impedes sunlight that leads to a reduction in photosynthesis. Sources: erosion, organic material To sustain aquatic life, turbidity 10 day average should not exceed 25NTU/JTU and no reading should exceed 50NTU/JTU. For more detailed information, download the Turbidity instructions found at Total Dissolved Solids (TDS) Importance: impedes life processes of animals with gills, impedes filter feeding, impedes sunlight that leads to a reduction in photosynthesis, can destroy cellular structure and metabolism. Sources: chemical pollution, natural biochemicals. To sustain aquatic life, total dissolved solids shouldn t exceed 500. Most people think that drinking water tastes best at 200. For more detailed information, download the TDS instructions found at Fecal Coliform (E. coli) Importance: is a bacteria that though not pathogenic itself, is an indicator for the presence of human feces and thus the potential for the presence of pathogens. Sources: leaky septic systems, combined sewer overflows To be safe for swimming there should be no more than 200 colonies/1000 ml. For more detailed information, download the Coliform instructions found at Procedure Before the field trip Make sure your students understand all the tests that they will be conducting in the field. Students should understand how the water quality indicators impact aquatic plants, aquatic animals and humans, as well as what some possible sources of these chemicals are. Friends of the Chicago has a lesson, Water Quality Tests Explained, that can help students with this. Feel free, however, to develop your own method. Part of understanding water quality in the Chicago River necessitatess understanding watersheds. A lesson that explores this is What is a Watershed? by Friends of the Chicago River. Both lessons are available at p. 6
7 In addition, it is very helpful if students have the opportunity to practice using the water quality monitoring equipment before the field trip. Students can use the equipment in the classroom to test a nearby water body (such as a pond or puddle), tap water or water from a fish tank. In thinking about conducting the field trip, you can decide to have students do a subset of the tests, to divide students into expert groups and have each group focus on two or three tests, or have all student groups completee all tests. Another way to prepare students for their field trip is to have them develop hypotheses they can test at their field trip. Possibilities include hypotheses about the general water quality, about which of the parameters they think will be impaired, or how the Chicago River water quality compares to another water body. Preparing for the field trip For information on planning and organizing a field trip and for safety tips, visit our web site at and click on field trips. As with all field trips, students should be divided into small working groups. A group of four or five is ideal to ensuree that everyone participates. Larger groups work best when students within the group are assigned specific tests to complete and share data with the larger group. Review the water quality data sheets with students. Two different sheets are included here. One assumes students will be calculating Q-values and an overall water quality index (recommended for more advanced high school students). The other does not include Q-values. For information on how to use Q-values and calculate an overall water quality index, please referr to Field Manual for by Mitchell & Stapp which can be borrowed from Friends of the Chicago River or purchased from Earthforce or The Field Trip By the day of the field trip students should be well prepared and groups should know what their tasks are and how to use the equipment. Usually students only record their data on the day of the field trip. However, at some field trip sites tables and shelters are available and it is possible for students to begin their analysis on the day of the field trip. After the Field Trip If you are having students calculate Q-values, they can do so after returning from the field trip. In all cases have students spend time analyzing their data. Students can look at statistical issues such as calculating means and deciding if there are outliers, they can examine if they disproved their hypotheses, and discuss their results in terms of what they have to say about the Chicago River s water quality. What testss showed the most impairment? What tests looked good? What does thatt mean for the plants and animals inhabiting the river and for the animals and peoplee visiting the river? As an extension, have students research ways they can reduce some of the problems they found. Encourage students to think of big scale solutions (such as policy initiatives) and small scale solutionss (such as convincing their parents to buy dishwasher soap without phosphates). p. 7
8 Water Chemistry Data Sheet (Hach) School Name: Site Location: Date: Time: Test Expected Range Equipment Test Value Q-Value Weighting Factor Sub- Total ph Phosphate ( or mg/l) Nitrate ( or mg/l) Dissolved Oxygen (concentration: or mg/l, percent saturation: %) 1-12 Temperature: Concentration: % Saturation: 0.17 Biological Oxygen Demand ( or mg/l) Change in Temperature ( o C) Difference < 3 o C Site 1: Site 2: Difference: 0.10 Turbidity (cm) cm 0.08 Total Dissolved Solids (mg/l) Fecal Coliform (E.coli colonies/100ml) mg/l 50 to 100,000 colonies/ 100ml Q-Value x Weighing Factor = Sub-Total Sub-Totals Weighing Factors x 100 = Water Quality Score Totals: Water Quality Index (WQI) Excellent Good Medium Bad Very Bad 0-24 Water Quality Score: Water Quality Index (WQI): WQI is more accurate when more tests are performed. p. 8
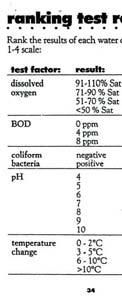
9 Water Chemistry Data Sheet (GREEN) School Name: Site Location: Date: Time: Test Expected Range Test Value Rank or Description ph Phosphate ( or mg/l) Nitrate ( or mg/l) Dissolved Oxygen (concentration: or mg/ /l, percent saturation: %) Biological Oxygen Demand ( or mg/l) Change in Temperaturee ( o C) Turbidity (cm) Total Dissolved Solids (mg/l) Fecal Coliform (E.coli colonies/100ml) Difference < 3 o C cm mg/l 50 to 100,000 colonies/ 100ml Temperature: Concentration: % Saturation: Site 1: Site 2: Difference: Overall Water Quality: p. 9

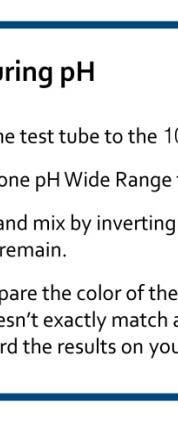


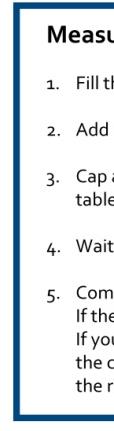
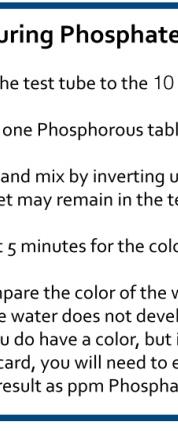
10 GREEN Kit Instructions You can also do additional tests such as turbidity, total dissolved solids, fecal coliform and biological oxygen demand. Instructions for these tests are available at p. 10
Water Chemistry Monitoring
 Chicago River Fieldtrip Activity Summary Students use basic to advanced water quality monitoring kits and probes to assess the water quality of the Chicago River. Water chemistry kits available for loan
Lake Washington. Water Quality Assessment Report. Copyright 2012 PLM Lake & Land Management Corp.
 Lake Washington 2012 Water Quality Assessment Report Copyright 2012 PLM Lake & Land Management Corp. Water Quality Report On May 22nd, June 18th, July 30th, August 29th, and September 27 th, 2012, PLM
He eia Fishpond Water Monitoring Project Due:
 He eia Fishpond Water Monitoring Project Due: While on your field trip to He eia Fishpond, you will be using a water monitoring kit. This kit was designed to provide a simple, affordable, non-hazardous
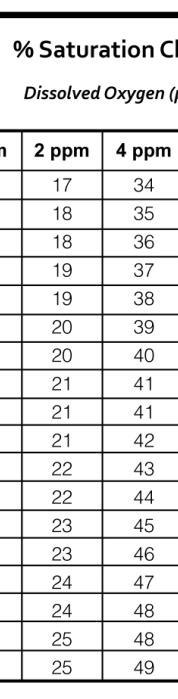
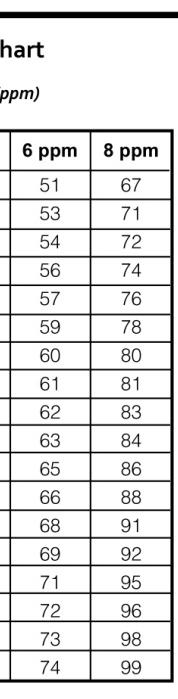
Activity 1: Using the Level of Oxygen- Saturation Chart graph Dissolved Oxygen vs. Temperature at 100% saturation. Start by making a 2 column table.
 Activity 1: Using the Level of Oxygen- Saturation Chart graph Dissolved Oxygen vs. Temperature at 100% saturation. Start by making a 2 column table. Number the first column with temperatures from 0 to
Aquatic Science Unit 2. Water Quality and Water Pollution
 Aquatic Science Unit 2 Water Quality and Water Pollution What is a healthy water body? In your own words, take a moment to describe what you believe are some of the characteristics of a healthy stream
Water Quality: The Basics
 Water Quality: The Basics Environmental Science Why is Water Quality Important? Effects all humans Safe drinking water Allows for food productions and SAFE food products Effects Wildlife Health domestic
Acidity and Alkalinity:
 Evaluation of Pollution Sources to Lake Glenville Quarterly Report December 2018 Kimberlee K Hall, PhD Environmental Health Program, Western Carolina University Summary Chemical and microbial analysis
Factsheet: City of West Haven Water Quality and Stormwater Summary
 79 Elm Street Hartford, CT 06106-5127 www.ct.gov/deep Affirmative Action/Equal Opportunity Employer Factsheet: City of West Haven Water Quality and Stormwater Summary This document was created for each
Applicable TEKS. Procedure. Duration. Objectives. Prerequisites. Materials. Temperature Station. ph Station
 L E S S O N LESSON 7 Survey: Physical Properties Applicable TEKS Grade 4 4.1 A 4.2 A, B, D, E, F 4.3 A 4.4 A, B Grade 4 4.1 A, C 4.8 C Duration Two 40-minute lessons Grade 5 5.1 A 5.2 A, C, D, E, F 5.3
Factsheet: Town of Deep River Water Quality and Stormwater Summary
 79 Elm Street Hartford, CT 06106-5127 www.ct.gov/deep Affirmative Action/Equal Opportunity Employer Factsheet: Town of Deep River Water Quality and Stormwater Summary This document was created for each
Each group or student should have a worksheet.
 Testing the Water Quality of the Manoa Stream Lesson 9 --------------------------------------------------------------------------------------------------------------------- Objectives The student will
National Science Content Standards: A: Science as Inquiry E: Science and Technology
 National Science Content Standards: A: Science as Inquiry E: Science and Technology To develop an understanding of water quality monitoring and an appreciation of the methods used to keep water safe and
Factsheet: Town of East Lyme Water Quality and Stormwater Summary
 79 Elm Street Hartford, CT 06106-5127 www.ct.gov/deep Affirmative Action/Equal Opportunity Employer Factsheet: Town of East Lyme Water Quality and Stormwater Summary This document was created for each
Factsheet: Town of Hamden Water Quality and Stormwater Summary
 79 Elm Street Hartford, CT 06106-5127 www.ct.gov/deep Affirmative Action/Equal Opportunity Employer Factsheet: Town of Hamden Water Quality and Stormwater Summary This document was created for each town
Hydrology and Water Quality. Water. Water 9/13/2016. Molecular Water a great solvent. Molecular Water
 Hydrology and Water Quality Water Molecular Water Exists as an equilibrium But equilibrium altered by what is dissolved in it Water Molecular Water a great solvent In reality, water in the environment
Santa Rosa Creek Water Quality Results 2004
 Santa Rosa Creek Water Quality Results 24 Community Clean Water Institute Site Description: SRC4: Off 3rd Street in downtown Santa Rosa. Behind the Vineyard Hotel just West of Highway 11 along the Prince
Hydrology and Water Quality. Water. Water 9/11/2018. Molecular Water a great solvent. Molecular Water
 Hydrology and Water Quality Water Molecular Water Exists as an equilibrium But equilibrium altered by what is dissolved in it Water Molecular Water a great solvent In reality, water in the environment
Reporting Period: 01/01/2008 to 12/31/2008. Understanding the Level 2 Stream Monitoring Data Report
 St Croix River at Old HWY 53 At Gordon, 163118 Saint Croix River Latitude: 46.252617, Longitude: -91.79963 Susan Peterson, Friends of the Saint Croix Headwaters James Heim, Friends of the Saint Croix Headwaters
Factsheet: Town of Trumbull Water Quality and Stormwater Summary
 79 Elm Street Hartford, CT 06106-5127 www.ct.gov/deep Affirmative Action/Equal Opportunity Employer Factsheet: Town of Trumbull Water Quality and Stormwater Summary This document was created for each town
Today s Webinar: Types of Monitoring and Assessment Data and What They Mean
 Welcome to the 1 st Webinar in the Series Monitoring & Assessment for Watershed Plans: Identifying, Accessing, and Using Data to Protect and Restore Indiana s Waters Each Monday in May at noon Today s
Reporting Period: 01/01/2010 to 12/31/2010. Understanding the Level 2 Stream Monitoring Data Report
 Squaw Creek, 10030147 Squaw Creek Latitude: 45.32639, Longitude: -88.945564 Jim Waters, Wolf River Trout Unlimited Andy Killoren, Wolf River Trout Unlimited Reporting Period: 01/01/2010 to 12/31/2010 Understanding
PROTECTING THE WACCAMAW WATERSHED. Water Quality Monitoring. Christine Ellis. Waccamaw RIVERKEEPER A Program of Winyah Rivers Foundation
 PROTECTING THE WACCAMAW WATERSHED Water Quality Monitoring Christine Ellis Waccamaw RIVERKEEPER A Program of Winyah Rivers Foundation Focusing on the Waccamaw Waccamaw RIVERKEEPER Program Citizen-Based
Reporting Period: 01/01/2008 to 12/31/2008. Understanding the Level 2 Stream Monitoring Data Report
 Panther Creek, 10010222 Panther Creek Latitude: 44.6216, Longitude: -90.568054 Carol Vedra, Beaver Creek Science Center Steven Hemersbach, Beaver Creek Citizen Science Center Reporting Period: 01/01/2008
Water Quality indicators and How Human Activities Affect Water Quality
 Water Quality indicators and How Human Activities Affect Water Quality Name: Online Assignment: Period: Date: Purpose: to learn how to evaluate water quality and how pollution can make water unavailable
Reporting Period: 01/01/2010 to 12/31/2010. Understanding the Level 2 Stream Monitoring Data Report
 Eau Claire River at Outlet Bay Rd, 10029003 Upper Eau Claire Lake Latitude: 46.302803, Longitude: -91.50336 Susan Peterson, Friends of the Saint Croix Headwaters John Kudlas, Friends of the St.Croix Headwaters
WATER QUALITY; WHY IS IT SO IMPORTANT?
 WATER QUALITY; WHY IS IT SO IMPORTANT? by Debra Veeder 62 OBJECTIVES: Students will be able to describe the relationship between chemical changes in a stream and the reasons these changes take place. METHOD:
Name Hour AP Biology Lab: Dissolved Oxygen in Aquatic Ecosystem: The Relationship between Temperature, DO, and Respiration Rates
 Name Hour AP Biology Lab: Dissolved Oxygen in Aquatic Ecosystem: The Relationship between Temperature, DO, and Respiration Rates Although water is composed of oxygen and hydrogen atoms, biological life
EUTROPHICATION. Student Lab Workbook
 EUTROPHICATION Student Lab Workbook THE SCIENTIFIC METHOD 1. Research Background literature research about a topic of interest 2. Identification of a problem Determine a problem (with regards to the topic)
A Claytor Nature Center Stream Monitoring Experience
 A Claytor Nature Center Stream Monitoring Experience Conduct field investigations in which distinctions are made among observations, hypotheses, results and conclusions Perform a visual habitat assessment
Grand River Monitoring
 City of Grand Rapids Environmental Services Grand River Monitoring by Mike Lunn Environmental Services Department Manager Grand River Monitoring History 1968 Grand River Monitoring Network Since 1988 Data
EUTROPHICATION. Teacher s Manual
 EUTROPHICATION Teacher s Manual Preface The following is a, hands on, and inquiry based lesson plan developed by COSEE Mid-Atlantic for teaching eutrophication. The National Education Science Standards
Science Enhanced Scope and Sequence Grade 6. Water Quality
 Water Quality Strand Topic Living Systems Investigating water quality Primary SOL 6.7 The student will investigate and understand the natural processes and human interactions that affect watershed systems.
Water Quality Testing
 Field Experience Water Quality Testing How s the Water? Overview Students will use chemical tests to determine the water quality of a local pond. Teacher Background: Water Quality In 1972 the Clean Water
Riffle Beetles to Riparian Buffers
 We care about WateR. it S What We do. Riffle Beetles to Riparian Buffers Exploring Methods of Assessing Surface Water Quality Grade level: 7-12 objective: Students will evaluate the quality of two water
BACKGROUND: The following is adapted from the Watershed Cruzin Guide:
 GOALS: To introduce students to the Watsonville Wetlands water system To help students identify sources of water pollution and learn how they can avoid polluting the environment To discuss the importance
Water Pollution. Chapter 20
 Water Pollution Chapter 20 Water Pollution Comes from Point and Nonpoint Sources Water pollution Any chemical, biological, or physical change in water quality that harms living organisms or makes water
Dissolved Oxygen, Productivity, and B.O.D. Lab
 Dissolved Oxygen, Productivity, and B.O.D. Lab Most living organisms, including aquatic organisms, require certain levels of oxygen to carry out normal metabolic processes. They are thus aerobic organisms.
Results from Fall Water Monitoring FortWhyte Alive Riverwatch Test Kit September October 2017
 Results from Fall Water Monitoring FortWhyte Alive Riverwatch Test Kit September October 2017 with: Westwood Collegiate, Elmwood Jr. High, Maples Met School, Miles Macdonnell Collegiate, Seven Oaks Met
Water Quality. CE 370 Lecture 1. Global Distribution of Earth s s Water
 Water Quality CE 370 Lecture 1 Global Distribution of Earth s s Water Water Demand and Supply in Saudi Arabia Total Water Consumption = 22 billion m 3 /Year Water Demand Water Supply Industrial Domestic
Reading the River 2006 Water Study Sixth Grade Science Mindy Fry Kenton County
 Reading the River 2006 Water Study Sixth Grade Science Mindy Fry Kenton County Curriculum Plan Lesson Context: To kick off this unit of study, I will have Jamie Egglemeyer from Sanitation District No.
UNIT - 2 STREAM QUALITY AND ITS SELF PURIFICATION PROCESS
 UNIT - 2 STREAM QUALITY AND ITS SELF PURIFICATION PROCESS The self-purification of natural water systems is a complex process that often involves physical, chemical, and biological processes working simultaneously.
We used these results to calculate the Water Quality Index (WQI) using this formula:
 using this formula:") Water Quality Study The water quality study of Sungai Way was undertaken by a certified laboratory (EraLab) on Friday, March 7, 2008 from 9.30am to 12pm. The official Certificate of Analysis of the water
Water Quality Study The water quality study of Sungai Way was undertaken by a certified laboratory (EraLab) on Friday, March 7, 2008 from 9.30am to 12pm. The official Certificate of Analysis of the water
LOCATION: Circle Your Location
 SSU WATERS COLLABORATIVE - COPELAND CREEK WATER QUALITY PROJECT WATER QUALITY DATA SHEET Student Names (no name, no credit!): Date: Tests on This DataSheet: Time: Conductivity/TDS Temperature Discharge
Water Pollution & Quality. Dr. Deniz AKGÜL Marmara University Department of Environmental Engineering
 Water Pollution & Quality Dr. Deniz AKGÜL Marmara University Department of Environmental Engineering IMPORTANCE OF WATER Life on planet Earth would be impossible without water. All life forms, from simple
LabQuest INTRODUCTION
 LabQuest 2 INTRODUCTION Water contains both hydrogen ions, H +, and hydroxide ions, OH. The relative concentrations of these two ions determine the value. 1 Water with a of 7 has equal concentrations of
MEMORANDUM Project Specific:
 Information Only MEMORANDUM Project Specific: 5-829-007 Policy Memo - File With TO: Robert Flaherty, Bullitt County Deputy Judge Executive FROM: Adam Connelly DATE: RE: 2006 Wet Weather Water Quality Monitoring
2009 Columbia River Water Quality Monitoring Data Report
 2009 Columbia River Water Quality Monitoring Data Report Table of Contents Page Introduction......3 Map of Columbia Basin....4 Maps of Portland and Wenatchee Area Sites..5 Maps or Columbia Gorge East and
Water Chemistry. Water 101
 Water Chemistry Water 101 I. Introduction A. Water is not pure Many different kinds of chemicals dissolved in it Ions, organic chemicals, organic matter, particulate matter, and gases can all be in water
Reading the River Water A Unit for 3 rd Grade. Lisa Handlon Taylor Mill Elementary Kenton County
 Reading the River 2004 Water A Unit for 3 rd Grade Lisa Handlon Taylor Mill Elementary Kenton County Grade Level: 3 rd Objectives In this lesson, students will: 1) identify aquatic organisms 2) assess
The Snapshot CONODOGUINET CREEK WATERSHED SNAPSHOT
 CONODOGUINET CREEK WATERSHED SNAPSHOT ABOVE: CONODOGUINET CREEK AT RT 74 BRIDGE FACING DOWNSTREAM The Snapshot The Conodoguinet Watershed Snapshot was a collaborative effort to engage local citizens in
WATER QUALITY TESTING STATION
 WATER QUALITY TESTING STATION Today, the students at your station are citizen scientists! Objectives Students will understand the importance and techniques of water quality sampling by: 1) Performing stream
Introduction to Water Quality Parameters
 Introduction to Water Quality Parameters Directions: Your group will be assigned one or two Water Quality (WQ) parameters to read about and present to the class. 1. Read the explanations for your assigned
How Sensitive Are They?
 Pollution Tolerance Levels How Sensitive Are They? Adapted from: An original Creek Connections activity. Creek Connections, Box 10, Allegheny College, Meadville, Pennsylvania 16335. Grade Level: intermediate
What we are going to talk about
 What we are going to talk about Water Quality and Monitoring Why and how Sampling Indicators Physical Chemical Biological Analyzing Data and making predictions Hands on Why do we care about water quality
Environmental Services
 Environmental Services 14 River Water Quality Summary for the Twin Cities Metropolitan Area This document is a summary of the 14 water quality of major rivers in the Twin Cities metropolitan area (metro
HARPETH RIVER MAIN STEM DISSOLVED OXYGEN STUDY
 HARPETH RIVER MAIN STEM DISSOLVED OXYGEN STUDY September 18, 2002 Report prepared by David J. Wilson Introduction Dissolved oxygen (dissolved O 2, a.k.a. DO) is essential for fish and benthic macroinvertebrates.
Florida Watersheds Video Southwest Florida Water Management District
 Teacher s Guide Florida Watersheds Video Download at: http://www.watermatters.org/watershedvideo Middle School Video Length: 11 minutes Lesson Time: One block or class period (approximately 45 minutes)
Resource. ph must be measured in the field. The ph will change if the water is collected and stored, and will not reflect the true value at the site.
 Resource ph What is ph? ph is a measurement of how acidic or alkaline (basic) the water is. ph is measured on a scale of 0 to 14, with 0 being the most acidic, and 14 being the most basic. Distilled water,
Measure of how much stuff (aka suspended solids) is mixed into the water (i.e., cloudy vs clear) Suspended solids = clay, silt, plankton, industrial
 is mixed into the water (i.e., cloudy vs clear) Suspended solids = clay, silt, plankton, industrial") Measure of how much stuff (aka suspended solids) is mixed into the water (i.e., cloudy vs clear) Suspended solids = clay, silt, plankton, industrial wastes, sewage Should not be confused with color, since
Measure of how much stuff (aka suspended solids) is mixed into the water (i.e., cloudy vs clear) Suspended solids = clay, silt, plankton, industrial wastes, sewage Should not be confused with color, since
Dissolved oxygen. Pre Assess. Post Assess. Big Ideas. Learning Target 1
 Dissolved oxygen MS LS2 I can construct an argument with empirical evidence to show that changes to physical or biological components of an ecosystem can affect populations. Learning Target 1 Pre Assess
Jackson Lake Analysis
 Jackson Lake Analysis Lake Zones Lake Zones Limnetic Zone- open water far from shore Light penetrates shallow, allowing photosynthesis Supports phytoplankton (algae, protists, cyanobacteria) which then
To diagram the nitrogen cycle and provide examples of human actions that affect this cycle.
 Purpose: Summary: Background: To diagram the nitrogen cycle and provide examples of human actions that affect this cycle. Students will learn about the nitrogen cycle through discussion and the construction
Wetlands Water Chemistry
 Wetlands Water Chemistry Overview Designed for middle school science students, this short unit encourages students to make connections between the visually observable nature of various natural waters samples
HYDROSPHERE EOG REVIEW
 HYDROSPHERE EOG REVIEW 1 Why is fresh water in short supply on Earth? A. Most of it is frozen B. Most of it is polluted C. Most of it is in the atmosphere D. Most of it is trapped underground A. About
Water Quality Tests Explained
 Chicago River Classroom Activity Summary When doing water quality testing it is important that students understand how each of the eight parameters affects the river. This demonstration can help teachers
Dirty Water. Adapted from: Dirty Water in Living in Water. National Aquarium in Baltimore, Grade Level: all. Duration: 1-2 class periods
 Dirty Water Adapted from: Dirty Water in Living in Water. National Aquarium in Baltimore, 1997. Nitrogen and Phosphorus Grade Level: all Duration: 1-2 class periods Setting: classroom or laboratory Summary:
Water Quality in the Upper Cohansey Watershed
 Slide 1 Water Quality in the Upper Cohansey Watershed Salvatore Mangiafico County Environmental and Resource Management Agent Cooperative Extension of Salem and Cumberland Counties This talk will present
Los Angeles Fresh Water Testing LAB
 Los Angeles Fresh Water Testing LAB Background: Freshwater is placed in Los Angeles from precipitation. The water either goes into the ground (which percolates into groundwater reservoirs) or runs off
a) Temperature b) Light c) Decomposition d) Mixing/Turbulence e) Salinity
 Temperature b) Light c) Decomposition d) Mixing/Turbulence e) Salinity") Dissolved Oxygen and Primary Productivity Activity Introduction: DO is often used as an indicator of water quality. You have probably read or seen news reports of fish kills that have been linked to sewage
Dissolved Oxygen and Primary Productivity Activity Introduction: DO is often used as an indicator of water quality. You have probably read or seen news reports of fish kills that have been linked to sewage
Watershed Investigations: How to Assess the Health of a Stream
 Watershed Investigations: How to Assess the Health of a Stream By Joan Chadde, Western UP Center for Science, Mathematics & Environmental Education. All photos by author, unless otherwise noted. Why Monitor
Detective on the case of the...
 Detective on the case of the... River Kid Mystery Allie, the equipment manager, packed the ph kit, thermometer, and bug pan for the hike to the creek. She placed the objects in three of the backpacks.
Redwood Shores Lagoon November 2016 Monthly Water Quality Monitoring Report
 Redwood Shores Lagoon November 2016 Monthly Water Quality Monitoring Report Prepared for Redwood City Public Works Services Department 1400 Broadway Redwood City, CA 94063-2594 Prepared by Clean Lakes,
Buffered Stream, Healthy Stream
 Buffered Stream, Healthy Stream Adapted from: An original Creek Connections activity. Creek Connections, Allegheny College, Meadville, Pennsylvania, 16335 Riparian Buffers Enhance Water Quality Grade Level:
Redwood Shores Lagoon February 2019 Monthly Water Quality Monitoring Report
 Redwood Shores Lagoon February 2019 Monthly Water Quality Monitoring Report Prepared for Redwood City Public Works Services Department 1400 Broadway Redwood City, CA 94063-2594 Prepared by Clean Lakes,
Homework Solution for Module 15 Waste Water Treatment Plants. 2. What is the difference between municipal and industrial wastewater?
 Homework Solution for Module 15 Waste Water Treatment Plants 1. Why do we have to treat wastewater? Because the dilution of a river is usually not sufficient to purify sewage and industrial pollution well
Ellen Bailey. UWW Educator training January 13,
 Ellen Bailey UWW Educator training January 13, 2017 ellen.bailey@usu.edu 801-536-4432 Utah Water Watch Partnership between USU Extension and the DWQ Started in 2012 Trained 750+ volunteers, monitoring
Redwood Shores Lagoon August Monthly Water Quality Monitoring Report
 Redwood Shores Lagoon August Monthly Water Quality Monitoring Report Prepared for Redwood City Public Works Services Department 1400 Broadway Redwood City, CA 94063-2594 Prepared by Clean Lakes, Inc. P.
SAMPLING YOUR ESTUARY Level IIB WHAT S IN THE WATER?
 SAMPLING YOUR ESTUARY Level IIB WHAT S IN THE WATER? GOAL Students will understand that an estuary is made up of different microenvironments whose plants and animals are dependent on its water quality.
Redwood Shores Lagoon May 2017 Monthly Water Quality Monitoring Report
 Redwood Shores Lagoon May 2017 Monthly Water Quality Monitoring Report Prepared for Redwood City Public Works Services Department 1400 Broadway Redwood City, CA 94063-2594 Prepared by Clean Lakes, Inc.
Fundamental Concepts: Overview of Water Quality
 Fundamental Concepts: Overview of Water Quality Ann Kenimer Texas A & M University University Curriculum Development for Decentralized Wastewater Management NDWRCDP Disclaimer This work was supported by
Water Pollution Overview. Sewage dumping
 Water Pollution Water Pollution Overview Sewage dumping Ocean Pollution Water Pollution Overview Urban Water Pollution Water Pollution Overview Water Pollution Overview Urban Runoff Water Pollution Overview
Overview of Chapter 21
 21 Water Pollution Overview of Chapter 21 Types of Water Pollution Water Quality Today Agricultural, Municipal, Industrial, Groundwater, Water pollution internationally Improving Water Quality Laws Controlling
Chemical Testing of Drinking Water
 Chemical Testing of Drinking Water Adapted from: An original Creek Connections activity. Water Chemistry Grade Level: all Duration: 50 minutes Setting: lab or classroom Summary: Students will conduct chemistry
Habitat Assessment. Summary. Background. Chicago River Field Trip Activity
 Chicago River Field Trip Activity Summary Students answer a series of quantitative and qualitative questions to gage the quality of river and river edge habitat. Data can be used to interpret results from
Environmental Services
 215 Environmental Services River Water Quality Summary for the Twin Cities Metropolitan Area In 215, Metropolitan Council Environmental Services (MCES) river monitoring was conducted at six automated and
Water Quality Report Card for Santa County Snapshot Day Results: May 5, 2012
 Water Quality Report Card for Santa County Snapshot Day Results: May 5, 2012 Prepared by: Debie Chirco-Macdonald Monitoring Coordinator Coastal Watershed Council 345 Lake, Suite F, Santa Cruz, CA 95062
Land Use Activities Potential Pollution Problems. Land Disposal septic system bacteria, nitrate, phosphate
 If Bugs Could Talk PURPOSE: To describe and identify the link between land use activities within a watershed and water quality. Students will also understand the link between aquatic macroinvertebrates
2018 WATER QUALITY MONITORING BLUE MARSH RESERVOIR LEESPORT, PENNSYLVANIA
 2018 WATER QUALITY MONITORING BLUE MARSH RESERVOIR LEESPORT, PENNSYLVANIA U.S. Army Corps of Engineers Philadelphia District Environmental Resources Branch January 2019 2018 Water Quality Monitoring Blue
What Impacts Water Quality? Learning Set Three. Teacher Guide
 What Impacts Water Quality? Learning Set Three Teacher Guide Content Learning Set Three What Impacts Water Quality? Overview........................................................... 181 Science Understanding
Ellis Pond Productivity Lab
 Name Per. Ellis Pond Productivity Lab Purpose: In this lab, you will have the opportunity to study the health of an aquatic ecosystem. We will measure the dissolved oxygen concentration and temperature
Overview of Chapter 21
 21 Water Pollution Overview of Chapter 21 Types of Water Pollution Water Quality Today Municipal Agricultural Industrial Improving Water Quality Laws Controlling Water Pollution Types of Water Pollution
Total Solids (TS) - material remaining after evaporation of sample liquid
 - material remaining after evaporation of sample liquid") Page 1 of 8 Reference Two publications are widely used as the principal cookbooks for water and wastewater analysis: o Standard Methods for the Analysis of Water and Wastewater. American Water Works Association
Page 1 of 8 Reference Two publications are widely used as the principal cookbooks for water and wastewater analysis: o Standard Methods for the Analysis of Water and Wastewater. American Water Works Association
What s In Our Water Lesson Plan
 What s In Our Water Lesson Plan NGSS Standard: MS-LS2-4- Students can construct and argument supported by empirical evidence that changes to physical or biological components of an ecosystem affects populations.
CBF Water Quality Interactive Map
 CBF Water Quality Interactive Map Student and adult groups that take part Often, they measure the water chemistry to evaluate the be doing it when you come out with us! By compiling these points on a map
Pollutants in our Waters
 Pollutants in our Waters CARIWIN Advanced Course in IWRM September 17, 2007 Apurva Gollamudi Brace Centre for Water Resources Management McGill University It isn t the pollution that s harming the environment.
Salem River Water Quality
 Slide 1 Salem River Water Quality Salvatore Mangiafico County Environmental and Resource Management Agent Cooperative Extension of Salem and Cumberland Counties This presentation will review some information
Dissolved oxygen. How Does Dissolved Oxygen Affect Freshwater Ecosystems? Ecology Dissolved Oxygen.notebook. September 30, 2014
 Dissolved oxygen Information from "Water's The Matter" module How Does Dissolved Oxygen Affect Freshwater Ecosystems? 1 Dissolved oxygen MS LS2 I can construct an argument with empirical evidence to show
Biochemical Oxygen Demand
 Biochemical Oxygen Demand Computer 20 Oxygen available to aquatic organisms is found in the form of dissolved oxygen. Oxygen gas is dissolved in a stream through aeration, diffusion from the atmosphere,
2016 WATER QUALITY MONITORING PROMPTON RESERVOIR PROMPTON, PENNSYLVANIA
 2016 WATER QUALITY MONITORING PROMPTON RESERVOIR PROMPTON, PENNSYLVANIA U.S. Army Corps of Engineers Philadelphia District Environmental Resources Branch December 2016 2016 Water Quality Monitoring Prompton
Basics of Water Quality Sheila Murphy
 Basics of Water Quality Sheila Murphy Water quality: The chemical, physical, and biological characteristics of water, usually in respect to its suitability for a particular purpose Water quality can include: