2009 through Texas Department of Transportation
|
|
|
- Moris Moore
- 6 years ago
- Views:
Transcription

1 Strategic Plan 2009 through 2013 Texas Department of Transportation

2
3 3 Letter from Commission Chair 4 Introduction 6 The Transportation Challenge 8 Taking Action 11 Overview: Goals, Strategies, Tactics 12 Financials CONTENTS 30 Goals Reduce Congestion Enhance Safety Expand Economic Opportunity Improve Air Quality Preserve the Value of Transportation Assets 35 Strategies Tactics Financing Partnerships Project Delivery Multimodal Freight System Preservation System Productivity Transportation Corridors Planning 53 The Road Ahead 1
4 2
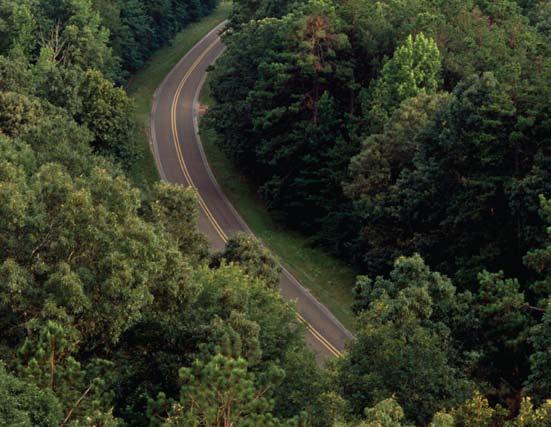
5 Letter from Commission Chair Fellow Texans, Legislators, local government officials, industry leaders, consumers, and transportation leaders all agree: Texas faces complex transportation challenges. Our state is fortunate to have both a strong economy and a growing population. We sit at the crossroads of international trade in the western hemisphere with more than $3.5 billion of freight shipped to, from, and within Texas every day. But this prosperity comes with a price tag. What we must do to preserve and improve our current transportation system continues to outstrip our financial resources. Over the next 25 years, road use in Texas will grow by 214 percent, much of it concentrated in our most congested metropolitan areas. The cost of highway construction, improvements, and maintenance continues to increase every year as the price of cement, oil, and steel continues to rise. We have no choice but to address the huge gap that exists between what it takes to efficiently move people and products and the funds available to do so. The vitality of our state depends on it. We know it will take bold leadership and the talents of many stakeholders to develop solutions that preserve our state s transportation system and respond to everincreasing travel demands. This five-year strategic plan reaffirms TxDOT s commitment to innovation, greater efficiency, and cost savings. Our goal is to build projects faster and at less expense to taxpayers. We have opened our doors to partnerships and are using every financing option available to us. This provides local and regional leaders with tools to meet their needs, driving down costs through competition, and making decisions that respond to industry and consumers. With the support and trust of the public, elected leaders, and our many partners, we are confident we can continue to produce what our state has come to expect of the Texas Department of Transportation: a transportation system that reduces congestion, enhances safety, improves air quality, preserves and builds on the existing infrastructure, and underpins the continued economic prosperity of Texas and the nation. Texans deserve no less than the world-class transportation system we plan to deliver. This conversation with you is always open. Please feel free to contact us at: AskTxDOT@dot.state.tx.us. Deirdre Delisi Chair, Texas Transportation Commission Farm to Market Road (FM) 31 near Deadwood, Texas Photo by Kevin Stillman/TxDOT 3


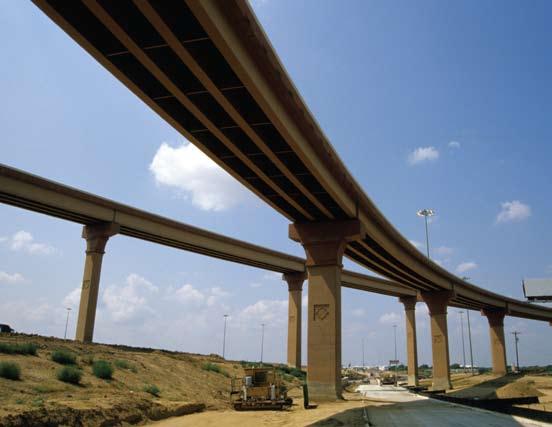
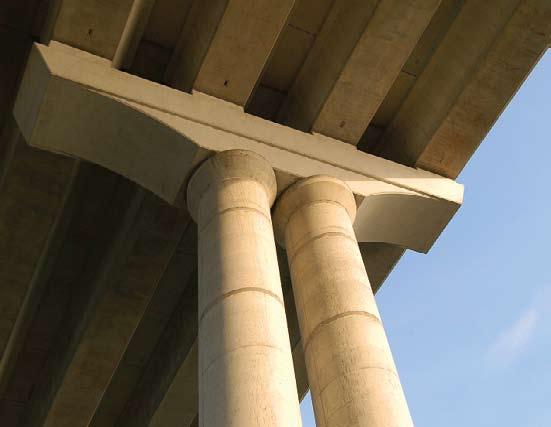
6 Texas has 50,189 bridges, about 40 percent more than any other state in the nation. TxDOT conducts vigorous inspections of each bridge at least once every two years. Corpus Christi Harbor Bridge on U.S. Highway 181 Photo by Stan A.Williams/TxDOT Queen Isabella Causeway in Port Isabel, Texas Photo by J. Griffis Smith/TxDOT Introduction This five-year strategic plan is TxDOT s report to Governor Rick Perry, members of the Texas Legislature, local partners, and the citizens of Texas. Strategic planning is an organization s process of defining its strategy or direction and making decisions on allocating its resources to pursue this strategy, including its capital and people. Strategic thinking means asking, Are we doing the right thing? It reflects TxDOT s attention to the big picture and a willingness to 4
7 adapt to changing circumstances in pursuit of its public service mission. TxDOT s strategic plan does not address every department activity, project, program, or function. Rather, it focuses on strategies that are seen as essential for TxDOT to fulfill our mission over the next five years. The plan addresses the key external and internal driving forces that are affecting or have the potential to affect TxDOT s mandates. 5

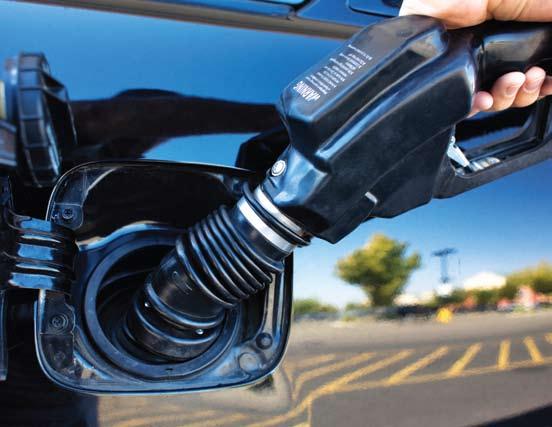
8 The Transportation Challenge The Texas transportation system plays a critical role in the economic and social well-being of all Texans. It provides the basic infrastructure that supports our economy and quality of life. Our roads, rail, airports, and transit move people to and from work and school; move goods to and from Texas manufacturers, distributors, businesses, and consumers; and move freight through Texas to destinations across the globe. Travel demand for people and goods is growing, the costs of construction are increasing markedly, and the purchasing power of our fuel tax revenues is declining. These factors are likely to continue even as our transportation needs grow. Long-term solutions have to involve more than simply expanding Texas highways. We cannot realistically expect to just build our way out of the congestion that exists in many key metropolitan areas of the state. And, just constructing more highways will not handle projected increases in traffic volumes in those same areas. We must find ways for our transportation system to encompass all transportation modes and serve the citizens of Texas. Projected Population Growth: 2005 to 2025 Growth in Travel Demand Economic and population growth negatively affect the performance of our transportation system. As travel demand increases, congestion worsens, air quality suffers, safety concerns grow, and maintenance needs multiply. TxDOT is working hard to identify new ways to minimize these impacts. Increased Costs of Doing Business In the past five years, every transportation agency in Texas experienced huge increases in the costs of doing business. Cost inflation has significantly increased the amount of capital required for transportation projects. Costs of materials, such as asphalt, concrete, fuel, and steel are rising steadily. The highway construction cost index increased by about 62 percent between 2002 and Since this means projects will cost more than planned, construction that could have been completed within ten years will have to be done over a 16-year period as more money becomes available. TxDOT is using all available financing options and exploring creative solutions to pay for projects. Reduced Buying Power of Motor Fuel Tax Our national highway system was built with money from federal and state motor fuel taxes. Motor fuel taxes are not enough to fund transportation projects, especially as inflation less than 25,000 25,000 to 74,999 75,000 to 249, ,000 to 999,999 greater than 1,000,000 less than 25,000 25,000 to 74,999 75,000 to 249, ,000 to 999,999 greater than 1,000, Texas Department of Transportation, Highway Cost Index, 2007.

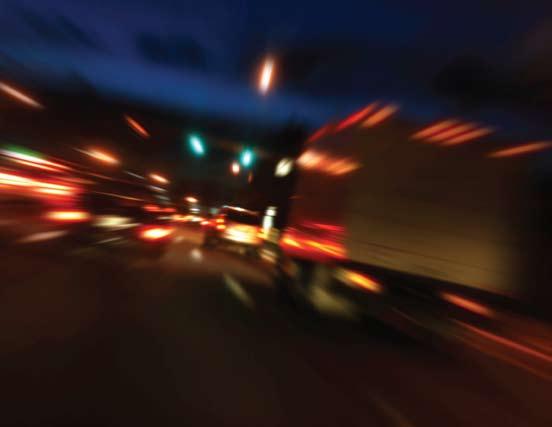
9 continues, vehicles become more fuel efficient, and more alternative fuels become available. Because of the way highway projects have typically been paid for, this creates an additional challenge as the balance between fuel consumption and highway use shifts. The effect of this imbalance is that each year TxDOT pays more per mile to deliver a product, and Texas highway users pay less per mile. Increased Fuel Prices In the first half of 2008, fuel prices in America increased to unprecedented, sustained levels. Oil prices rose to over $100 per barrel in February The current situation is unique; unlike the energy crises of the 1970s, there is no shortage of supply. For the first time, American drivers are making travel decisions influenced exclusively by persistently high motor fuel prices. Drivers make two types of decisions influenced by the cost of travel: First, drivers make shortrun decisions about whether or not to take a trip; second, drivers make long-run decisions about what type of vehicle to drive. All other factors being equal, higher fuel prices will cause drivers to make short-run decisions to drive less and long-run decisions to drive more fuel-efficient vehicles. The persistence of Comparison of Vehicle-Miles Traveled in Texas 2007 vs (reported in millions) MONTH CHANGE these trends will affect gasoline consumption and therefore TxDOT s revenue from state and federal motor fuel taxes. The short-run effects of high fuel prices on Texas drivers can be seen in the decrease in the number of vehicle-miles traveled (VMT) in 2008: Source: FHWA, Traffic Volume and Trends, January-June 2008 FEB MAR APR MAY JUNE* TOTAL 18,888 21,580 19,867 20,795 20, ,197 18,831 20,759 19,755 20,309 19,216 98, % -4.0% -0.6% -2.4% -4.4% -2.3% 7 *Preliminary Data

10 Taking Action Our strategic plan for TxDOT is a blueprint for action. In the simplest of terms, this plan is a set of decisions about what to do, how to do it, and why to do it. To meet Texas transportation challenges, we need a bold vision, strong leadership, and a commitment to collaborative problem solving. This plan will direct TxDOT as it takes actions to meet those challenges. 8


11 Town hall meetings provide information to the public and reflect our commitment to collaborative problem solving and community partnerships. Vision We will deliver a 21st century, multimodal transportation system that will improve the quality of life for Texas citizens and increase the competitive position for Texas industry. Mission We will provide safe, efficient, and effective means for the movement of people and goods throughout the state, facilitating trade and economic opportunity. 9
12 10

13 Goals Tactics Our five goals establish the general direction we Our tactics are programs or activities created Multimodal Freight will take to realize our vision and mission: to execute our four strategies: Rail Relocation Fund 1. Reduce congestion Financing Gulf Intracoastal Waterway Dredging 2. Enhance safety 3. Expand economic opportunity 4. Improve air quality 5. Preserve the value of transportation assets Strategies Our four strategies are the critical link between planning and implementation. They describe how we are going to achieve our goals: 1. We will use all available financial tools to build transportation projects. 2. We will empower local and regional leaders to solve local and regional transportation problems. 3. We will harness market-based principles to maximize competition, reduce costs, and guide investments. 4. We will facilitate consumer-driven decisions that respond to market forces. Motor Fuel Tax Revenues Debt Financing Pass-Through Financing Toll Equity Registration Fees Public-Private Partnerships Partnerships Local Tolling Entities Regional Mobility Authorities Metropolitan Planning Organizations Texas State Infrastructure Bank Strategic Highway Safety Plan Transit Aviation Project Delivery Performance-Based Construction Contracts Innovative Construction Techniques Project Indices Comprehensive Development Agreements Rail Partnerships System Preservation Texas Pavement Preservation Center Infrastructure Condition Ratings Routine Airport Maintenance Program System Productivity Advanced Traffic Management Transportation Corridors Planning Key Transportation Corridors Texas Metropolitan Mobility and Texas Urban Mobility Plans We must find ways for our transportation system to encompass all transportation modes. IH-10 in San Antonio 11
14 revenues Funding Sources General Revenue Fund <1% General Revenue Fund <1% General Revenue - Insurance Companies <1% Maintenance Tax/Insurance Department Fees <1% Expenditures Operational Expenses Plan it 19.1% Plan/Design/Manage 4.6% ROW Acquisition 7.2% Research <1% Contracted Planning and Design 7.0% GENERAL REVENUE DEDICATED <1% TEXAS HIGHWAY BEAUTIFICATION FEDERAL REIMBURSEMENTS 38.9% BUILD IT 40.4% Highway Construction 39.6% Aviation Services <1% STATE HIGHWAY FUND 31% Motor Fuel Tax 19.1% Vehicle Registration Fees 8.7% Other 3.3% BOND ISSUANCE PROCEEDS 30% Bond Proceeds - State Highway Fund 9.6% State Highway Fund - Debt Service 2.5% Bond Proceeds - Texas Mobility Fund 14.9% Texas Mobility Fund - Debt Service 3.0% OTHER <1% Appropriated Receipts <1% Interagency Contracts <1% Bond Proceeds - General Obligation Bonds <1% MAINTAIN IT 35.5% Contracted Maintenance 28.0% Routine Maintenance 7.1% Gulf Intracoastal Waterway <1% Ferry System <1% Gross Weight and Axle Fees <1% USE IT 2.8% Public Transportation 1.0% Client Transportation Services <1% Registration and Titling <1% Vehicle Dealer Regulation <1% Traffic Safety <1% Travel Information <1% Auto Theft Prevention <1% Rail Safety <1% MANAGE IT 2.2% Source: General Appropriations Act 80th Legislature Regular Session HB1 Based on 2008 TxDOT Requests Central Administration <1% Information Services <1% Other Support Services <1% Regional Administration <1% 12

15 Includes all planning, designing, and right of way acquiring for highways and other modes of transportation, as well as transportation research. Includes building highways and bridges and airport improvements. Our vast network of road, rail, air, and transit infrastructure moves people, goods, and freight all across Texas. Includes maintaining roadways, bridges, airports, the Gulf Intracoastal Waterway, and ferry systems. Includes managing public transportation, vehicle titles and registration, vehicle dealer regulation, motor carrier registration, traffic safety, travel information, and auto theft prevention. Includes administering central and regional management, information resources, financial matters, and other support services. 13

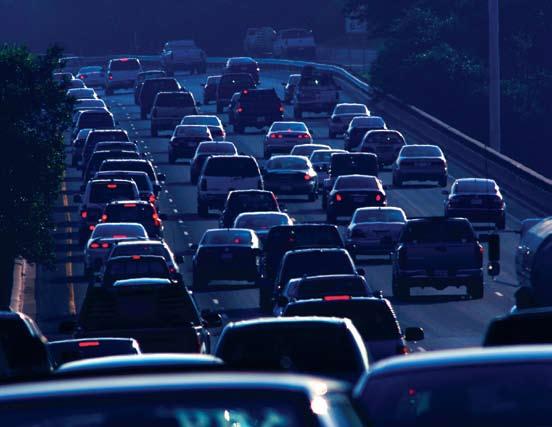
16 Our Goals Goal 1: Reduce Congestion Traffic congestion is not just frustrating, it is costly. On average, Texas urban drivers spend 30 hours stuck in traffic each year. The Texas Transportation Institute s 2007 Urban Mobility Report identifies many of Texas urban areas as among the most congested in the entire country. This report is based on 2005 figures, the most recent year for which complete data is available. The Dallas-Fort Worth and Houston areas ranked fifth and sixth, respectively, in travel delay. Metropolitan areas across the state have experienced tremendous population growth, resulting in increased traffic without a corresponding increase in highway construction. Congestion impacts the economy by wasting time, resources, and productivity. Congestion cost Texas urban areas more than $6 billion in wasted time and fuel in Idling cars burn more fuel, increasing emissions and worsening air pollution. Business deliveries and industry shipments stuck in traffic cause productivity to go down and costs to go up. Unreliable shipment delivery times cause problems for producers, suppliers, and shippers; and stop-and-go traffic can cause collisions that worsen conditions. Travel Time Index One measure of congestion is the Travel Time Index developed by the Texas Transportation Institute. The Travel Time Index indicates the average amount of extra time it takes to travel during rush hours than during non-congested times. In 2005, El Paso s Travel Time Index value was 1.17; meaning that a 30-minute trip on noncongested roads will take 35 minutes during peak hours. In Houston, which has a 2005 Travel Time Index of 1.36, a 30-minute trip will take 41 minutes. The Texas Transportation Institute evaluates urban areas in four categories: very large, large, medium, and small. These categories provide a clear representation of how Texas urban areas compare to one another and to other cities across the nation National Average Houston Dallas- Fort Worth Very Large 14 The Travel Time Index values of the Texas cities in the report, with the exception of Brownsville, have increased since The highest increases occurred in Austin, Dallas-Fort Worth, and Houston, where congestion increased 5 to 10 percent. For the most part, Texas urban areas have a Travel Time Index equal to or less than the national average and experience challenges similar to their counterparts in the rest of the nation. However, travel time indices in Austin and El Paso are above the national average for urban areas of their size. Travel Time Index in Texas Urban Areas Source: Texas Transportation Institute, 2007 Urban Mobility Report National Average San Antonio National Average Austin El Paso National Average Laredo Brownsville Large Medium Small Corpus Christi Beaumont Urban Texans spend the same or slightly less time than the national average getting to and from work. Travel Time Index DESIRED TREND DOWN UP ACTUAL TREND DART Cedars Station Photo by Dallas Area Rapid Transit

17 Our performance measure baseline from 2000 to 2005 shows overall mobility decreasing across Texas. More recent data on Texas cities congestion measures is not yet available, though the main short-run effect of high fuel prices is visible in the declining statewide vehicle-miles traveled in the first half of As most congestion occurs during peak commuting hours, which are essential trips for most drivers, congestion may not decrease in the short term. However, alternative modes of travel may become more attractive to commuters. In the long run, as drivers choose more efficient and alternative fuel vehicles, travel demand and congestion levels are expected to increase. 15
18 16

19 80% 70% 60% 50% 40% 30% 20% 10% 0% National Average Houston Dallas- Fort Worth Very Large Congested Peak Travel Times While the Travel Time Index indicates how much time the individual traveler spends on congested roads, the percent of congested peak travel indicates the amount of overall travel that occurs in congested conditions. This is a measure of the proportion of rush hour freight and passenger movement daily vehicle-miles traveled affected by congestion. For example, in 2005, two-thirds of the peak travel on Austin s roads was congested. Between 2000 and 2005, the amount of congested travel increased in every Texas urban area except Brownsville and nearly doubled in San Antonio and Laredo. With the exception of Austin and El Paso, urban areas in Texas had lower levels of congestion during 2 Texas Transportation Institute, Urban Congestion Report, June 2007 Congested Peak Travel in Texas Urban Areas Source: Texas Transportation Institute, 2007 Urban Mobility Report National Average San Antonio National Average Austin El Paso National Average Laredo Large Medium Small Brownsville Corpus Christi peak hours of travel in 2005 than the national average. Austin and El Paso had a higher proportion of congested travel than similar sized areas in other parts of the country. Commuter travel is a congestion factor that occurs regularly, making delays somewhat expected. However, congestion caused by collisions, breakdowns, bad weather, or sporting events can cause some of the longest delays, making travel time unpredictable. To reduce the risk of late arrival, a driver often budgets extra time, anticipating that congestion will be at its worst that day. Because there is no way to predict how congested traffic will be on any given day, that extra time is often wasted. This wasted time can be just as costly to businesses and individuals as delay itself. Since 2004, Houston and San Antonio have participated in a federal project that studies Beaumont 17 reliability in 23 cities across the country. In June 2007, San Antonio drivers had to plan 50 percent more time to travel on the most congested day of the month. 2 This means a 30-minute non-congested trip that would normally take 36 minutes during rush hour could take 45 minutes. What is TxDOT doing to reduce congestion? Congestion is the result of many factors, and the solution is not simple. We are constantly working to improve mobility on Texas roads through a combination of policies, practices, equipment, and infrastructure improvements. Intelligent Transportation Systems TxDOT and our regional partners use Intelligent Transportation Systems to observe and manage traffic in real-time. These include corridor management systems, emergency response systems, and electronic freight management. To reduce congestion and create more reliable travel times, we are expanding public transit, building toll roads, and applying congestion pricing policies. Texas Metropolitan Mobility Plan Adopted in 2004, this program requires each major metropolitan area to develop locally conceived, comprehensive regional mobility plans. Each plan identifies the funding shortfalls that exist between available resources and the amount needed to reduce congestion to a locally acceptable level. The metropolitan mobility planning process helps local regions identify a balanced package of short- and longrange strategies to tackle their mobility needs. To reduce congestion and create more reliable travel times, we are expanding public transit, building toll roads, and applying congestion pricing policies. The Spur 98 Bridge spanning the Guadalupe River in Kerrville. The bridge includes sidewalks, bike lanes, classic railing, and illumination on black wrought-iron posts. Photo by Stan A. Williams/TxDOT

20 18
21 Goal 2: Enhance Safety Road safety is a major concern for TxDOT. In 2005, more than 3,500 people one in every 6,500 Texans died on Texas roads. 3 Vehicle crashes cause more than injuries and fatalities. There are steep costs from property damage, lost earnings, medical costs, travel delay, and lost quality of life. The National Highway Traffic Safety Administration estimated the economic impact of vehicle crashes in Texas at nearly $20 billion per year in Only 25 percent of that total is paid by the crash victims themselves the rest is distributed throughout the Texas economy. 5 Safer roads will help us achieve our other goals. According to a recent report released by the American Automobile Association, crashes cause more than 40 percent of all unpredictable congestion. 6 3 National Highway Traffic Safety Administration, Traffic Safety Facts National Highway Traffic Safety Administration, Traffic Safety Facts American Automobile Association, Crashes vs. Congestion: What s the cost to society?, March American Automobile Association, Crashes vs. Congestion: What s the cost to society?, March Texas fatality rate: 1.42, National Highway Traffic Safety Administration, Traffic Safety Facts 2006 Fatality Rate measure shows the fatality rate in Texas We measure road safety by using the fatality decreasing through Federal data shows rate the number of deaths on Texas roads this trend continuing through per 100 million vehicle-miles traveled. Although We are committed to improving safety on our the number of fatalities remains high, we are roads through all available means. Safe roads making progress. Between 2000 and 2005 the can only be achieved through a combination fatality rate decreased by 15 percent to 1.5 of education, enforcement, and infrastructure fatalities per 100 million vehicle-miles traveled. investment. We evaluate the cause of every The fatality rate shows how Texas compares fatal crash so that we can focus our efforts on to the rest of the United States. Texas has a making our roads safer. The chart below shows comparatively high fatality rate, but since 2000 important characteristics of fatalities on our the rate has declined and is now approaching roads in the national average. Our baseline performance Fatality Rate: Fatalities per 100 Million Vehicle-Miles Traveled Source: TxDOT Traffic Operations Division, Traffic Safety Annual Report, 2007; NHTSA, Traffic Safety Facts, We are making progress. Between 2000 and 2005, the fatality rate on Texas roads decreased by 15 percent. Fatality Rate DESIRED TREND DOWN ACTUAL TREND DOWN

22 A major focus of TxDOT and our safety partners is alcohol and drug enforcement. In 2005, 48 percent of all fatal crashes in Texas were alcohol-related. This proportion has only decreased slightly since 2000, and is higher than the national proportion of 39 percent. Speeding is a major factor in crash-related fatalities. Transportation safety efforts in Texas also focus on rural roads. In 2005, 56 percent of all crashrelated fatalities occurred on rural roads, compared to 54 percent nationally. Fifty-four percent of all crash-related fatalities occurred when a vehicle left its lane. This is called roadway departure, and it includes In Texas, 44 percent more fatalities occurred in light trucks and vans than in passenger cars or heavy trucks. rollovers and incidents in which a vehicle crossed the median. Vehicle class is also an important factor in fatal crashes. In Texas, 44 percent more fatalities occurred in light trucks and vans than in passenger cars or heavy trucks. Another major factor in crash-related fatalities is speeding. Of the nearly $20 billion that crashes cost Texas in 2000, $3.5 billion of that total was the direct result of speeding-related crashes. 8 Speeding-related crash fatalities increased to 41 percent of all fatalities in % 50% 40% 30% 20% 10% 0% Characteristics of Crash-Related Fatalities, 2005 Source: NHTSA, Traffic Safety Facts, Rural Roads Roadway Departure Alcohol-Related Light Trucks/Vans Speeding-Related Within Intersection Driver Aged Pedestrian or Bicyclist Fatality 8 National Highway Traffic Safety Administration, Traffic Safety Facts

23 21


24 A major focus of TxDOT and our safety partners is alcohol and drug enforcement. What is TxDOT doing to enhance safety? Partnering TxDOT works closely with our partners to enhance safety on our roads. These partners include state and local law enforcement and emergency services, federal agencies, and public health and education entities all across Texas. TxDOT has a traffic safety program that spans 13 targeted safety program areas, including planning and administration; alcohol and drug countermeasures; occupant, pedestrian, bicyclist, and motorcycle safety; and driver education and behavior. Crash Data TxDOT now houses all crash data for the state in a new crash data system that will allow us to better determine the causes of crashes vehicle, human, and infrastructure and make better decisions to improve roadway safety. Each year, we upgrade our roadway system for improved safety. Proposition 14, passed in 2003, allows TxDOT to issue up to $1 billion per year in general obligation bonds to improve our highways, 20 percent of which are earmarked for safety. Click It or Ticket A major success of TxDOT and our safety partners has been increasing Texans seat belt use. Before Click It or Ticket enforcement programs began in 2002, only 76 percent of Texans used seat belts. In 2007, 92 percent buckled up. TxDOT estimates this increased seat belt use has saved 1,600 lives, prevented 37,600 injuries, and saved $6.66 billion in crash-related costs since Click It or Ticket began. 9 9 TxDOT Traffic Operations Division, Traffic Safety Annual Report
 grants to law enforcement safety by decreasing the number")
25 Teens in the Drivers Seat Selective Traffic Enforcement Program Alcohol and Drug Countermeasure Programs This program is currently under development TxDOT administers Selective Traffic Enforcement Along with our partners, we are improving drivers through targeted trainings, with the Texas Transportation Institute, and is Program (STEP) grants to law enforcement safety by decreasing the number of impaired numerous publications, enforcement the first peer-to-peer driving safety program in agencies across the state. In 2007, law drivers on our roads. We have a wide range of programs, workshops, and seminars. Texas. To address safe driving among teenagers enforcement agencies across the state alcohol and drug countermeasure programs, In 2007, the Texas DWI Resource in Texas, Teens in the Drivers Seat works with coordinated with TxDOT to improve roadway both large and small. TxDOT funds statewide Prosecutor trained more than 1,200 high school students to develop customized safety. These grants made possible almost public awareness campaigns, large-scale DWI prosecutors and police officers. safe driving awareness programs for their 300,000 extra hours of traffic enforcement on enforcement efforts, prosecutor and police school. Outreach strategies have included video Texas roads, leading to 12,425 Driving While officer training, and alcohol-free functions testimonials, student-run press conferences, Intoxicated (DWI) arrests and 334,823 speeding for Texas teens. For Texas law enforcement and web applications. citations.each year, we increase TxDOT funding and judicial communities, TxDOT increases for local enforcement and increased public awareness of drug- and alcohol-impaired information and education efforts. 23

26 Magnolia Hotel in Houston, Texas Photo by J. Griffis Smith/TxDOT 24

27 Goal 3: Expand Economic Opportunity A reliable, efficient, and safe transportation system supports and encourages economic growth. Our vast network of road, rail, air, and transit infrastructure all across Texas moves people, goods, and freight. Because our transportation system drives Texas economy, it is critical that we provide a transportation system that promotes economic health. A major transportation project has shortand long-term economic impacts. Initially, construction activities create jobs and surrounding property values may rise. However, the largest and most lasting impacts of transportation investments are the beneficial effects on business productivity and personal wealth. Investing in our transportation system reduces business costs and increases productivity. Adequate transportation infrastructure improves mobility, lowers the cost of transporting raw materials and finished goods, and increases the reliability of delivery. This allows companies to maintain cost-saving lower inventory levels. Infrastructure that improves access widens the labor pool for businesses by expanding the region from which they draw workers. Decreased congestion reduces driving time and fuel costs for commuters, commercial vehicles, and all travelers. This leads to increased personal wealth. In general, increased personal wealth in a region results in increased economic activity in that region. For every dollar of increased direct income earned in a region, there are an additional two dollars of increased economic activity. Although their impacts are more difficult to put in economic terms, transportation improvements also increase traveler safety and improve air quality. Texans enjoy the benefits of economic prosperity. We have the nation s second-largest economy, and our Gross Domestic Product ranks fifteenth in the world. 10 We are home to the most Fortune 500 companies in the United States. 11 We lead the nation in export revenues, and we gross more than $100 billion a year in international trade. 12 Our highways and railroads carry billions of dollars worth of freight through Texas every day. Dallas-Fort Worth International Airport is internationally recognized as the top cargo airport in the world. 13 The Port of Houston has the largest international ship channel in the nation, and ranks sixth worldwide in total cargo volume. 14 Sustained high fuel prices have an effect on our transportation-related economy. High fuel prices may affect freight and goods movement within and through Texas; as truck shipments become more expensive, manufacturers and suppliers may choose another shipment mode. As fuel prices rise, fewer non-essential trips shopping, dining out, and recreation are taken, which may negatively affect spending in Texas cities and towns. In the long run, manufacturers and businesses will increase the fuel efficiency of their fleets to lower transportation costs, just as drivers will choose different vehicles. How does investing in transportation support the economy? The strength of the Texas economy is dependent upon our transportation system. By maintaining and improving it, we are securing our status as one of the world s best places to do business. Business productivity and personal wealth will mean increased competitive advantage and expanded economic opportunity for Texas. TxDOT-commissioned research found that economic activity generated by TxDOT expenditures from 1996 to 2006 averaged 89,000 jobs, $10.2 billion in output, and $4.1 billion in labor income. As a result of the strategic use of new funding options, TxDOT expenditures grew by more than 42 percent from 1996 to This $7.5 billion investment generated $24.5 billion in travel efficiency and economic gain for residents and businesses in Texas. 15 IS ECONOMIC OPPORTUNITY EXPANDING? UP DESIRED TREND UP ACTUAL TREND The largest and most lasting impacts of transportation investments are the beneficial effects on business productivity and personal wealth. 10 United States Bureau of Economic Analysis 11 Fortune 500, Fortune, May 5, United States Bureau of Economic Analysis 13 Air Cargo Excellence Survey, Air Cargo World, March Port of Houston Authority 15 Cambridge Systematics for the Texas Department of Transportation, Transportation Spending and Economic Activity in Texas, 2006 Paso del Norte Bridge in El Paso, Texas 25

28 26

29 Goal 4: Improve Air Quality Clean air is important to TxDOT as it is to all Texans. Air pollution can cause or worsen medical conditions that pose a particular threat to children, the elderly, those with respiratory illness, and those who work and exercise outdoors. The Federal Clean Air Act established standards for air quality, regulated by the U.S. Environmental Protection Agency (EPA), that are tied to federal highway funding. If Texas does not meet EPA standards, our federal funding is put at risk. This would affect congestion and safety across the entire state. Vehicle emissions are a major source of air pollution. The U.S. Environmental Protection Agency estimates that vehicle emissions account for up to 70 percent of ozone-causing pollution in urban areas. Emissions can increase health risks since they contribute a considerable amount of air toxins and fine soot in localized pollution hot spots near highways, truck and rail centers, and other transportation facilities. Vehicle Emissions Air quality, like congestion, is highly localized, varies day-to-day, and has many causes. Today, the best measure of air quality related to vehicle emissions is the level of ozone in the air. Many pollutants that create ozone come from vehicle emissions. For example, the North Central Texas Council of Governments reports that in the Dallas-Fort Worth area, vehicle emissions account for 51 percent of nitrogen oxides (NOx) in the air. 16 Nitrogen oxides, combined with volatile organic compounds (VOC) and sunlight, create ground-level ozone. Because ozone levels vary based on geographic area, it is difficult to measure statewide air quality in a state as large and diverse as Texas. But, we do know there are 34 counties in six metropolitan areas in Texas that at times experience unhealthy air quality, leading the EPA to define them as either Early Action Compact or Eight-Hour Ozone Nonattainment areas. This means these regions have air quality that, over the course of a day, exceeds national air quality standards established in the Federal Clean Air Act. That is why TxDOT, the Texas Commission on Environmental Quality (TCEQ), and our local air quality partners focus the majority of our emissions reduction programs on these six areas: Dallas-Fort Worth, Houston-Galveston- Brazoria, San Antonio, Austin-San Marcos, Northeast Texas, and Beaumont-Port Arthur. TxDOT was also the first state transportation authority to join SmartWay Transport, a voluntary partnership between the EPA and freight industry sectors. The hottest months of the year are called ozone season. Ground-level ozone forms when pollutants react to heat and sunlight. June, July, and August are hot, sunny, and ideal for ozone formation. We focus our air quality measurement on this time of year, when pollution has the most effect on air quality. Today, the best measure of air quality related to vehicle emissions is the level of ozone in the air. TxDOT initiated the first statewide clean air public awareness program in the nation. Vehicle Emissions DESIRED TREND DOWN ACTUAL TREND DOWN 16 North Central Texas Council of Governments Transportation Department, December

30 The best free entertainment in town. From March until early November, the nightly flight of 1.5 million Mexican free-tailed bats from roosts beneath Austin s Ann Richards Bridge resembles smoke against the evening sky. Photo by J. Griffis Smith/TxDOT 28

31 Since 2000, the six areas we measure have decreased NOx and VOC emissions substantially. The nine nonattainment counties in the Dallas-Fort Worth area have decreased these emissions by nearly half. Combined, the Early Action Compact and Eight-Hour Ozone Nonattainment counties reduced their NOx by more than 440 tons per day and decreased VOC emissions by more than 160 tons per day between 2000 and Our most recent air quality data shows a continuation of the 2000 to 2005 baseline trend of decreasing emissions in Texas. 17 Information about fine soot pollution, especially in the vicinity of major highways and transportation centers, is less available due to limited air monitoring. TxDOT and our partners will examine the effects of fine soot pollution and other pollutants to determine their relationship to the transportation system Dallas- Fort Worth What is TxDOT doing to improve air quality? Drive Clean Across Texas This is the first statewide clean air public awareness program in the nation. The program focuses on reducing vehicle emissions by educating the public about its role in improving air quality. TxDOT supports Drive Clean Across Texas in partnership with TCEQ, EPA, Federal Highway Administration, the Texas Department of Public Safety, the Texas Department of State Health Services, and local air quality programs across Texas. TxDOT and our clean air partners provide classroom materials, train and educate Texans, and conduct public outreach using print ads, billboards, and customized brochures. Our messages provided consumers with five simple behavioral tips that can reduce air pollution: 1) maintain your vehicle, 2) drive less, 3) buy a cleaner vehicle, 4) drive the speed limit, and 5) reduce idling. Tons of NOx and VOCs Emitted Daily During Ozone Season Houston- Galveston- Brazoria Source: Texas Commission on Environmental Quality San Antonio Austin- San Marcos Northeast Texas Beaumont- Port Arthur 29 Reduce TxDOT s Environmental Footprint TxDOT leads by example on air quality issues, and we implemented a Clean Air Plan that supports and enforces important measures. We purchase alternative fueled vehicles and low emission vehicles, such as hybrids. We use cleaner-burning low and ultra low emission diesel fuel in all our on- and off-road equipment. We purchase only solar-powered, zero-emission sign and arrow boards, and install energy efficient LED bulbs in new signal lights. We encourage our contractors to improve air quality by using newer, cleaner-burning equipment; not mowing on ozone action days; and applying for Texas Emission Reduction Plan grants through TCEQ. Where feasible, we perform night construction in heavy traffic areas. Improve Mobility TxDOT wants to improve mobility in ways that will also improve air quality. Partnering with Metropolitan Planning Organizations (MPOs) across the state, we are planning for multimodal transportation solutions to reduce congestion. Idling cars use fuel less efficiently, while public transportation and ridesharing reduce emissions per trip. TxDOT and our regional partners will do more in the future to improve mobility of people and freight while reducing the environmental footprint of transportation across the state, particularly in areas where air pollution is a concern. 17 Texas Commission on Environmental Quality Ways to reduce emissions: Maintain your vehicle Drive less Buy a cleaner vehicle Drive the speed limit Reduce idling
32 Goal 5: Preserve the Value of Transportation Assets The Texas transportation system is among the state s largest capital investments. We need roads, runways, and bridges that are capable of handling the demands that millions of cars, planes, and trucks place on them each day. Preserving these assets and increasing their value to the public is critical for Texas economic health and safety. One of our five TxDOT budget categories, Maintain It, focuses on preventive maintenance and rehabilitation. These funds are used to preserve the structural integrity of our facilities and for safety improvements. The goal of the Maintain It funds category is to minimize the costs over time of managing and maintaining the transportation system. Roads, runways, and bridges that are allowed to deteriorate for too long must be replaced or rebuilt at a much higher cost than that of regular maintenance. Maintenance costs are only a part of the total costs of deteriorating infrastructure. Poor road surfaces can cause wear and tear on vehicles and can damage vehicle suspensions and tires. Vehicles often slow for rough pavement or potholes, causing delay and contributing to congestion in heavy traffic. Rough roads can also present a safety hazard by decreasing a driver s ability to maneuver and stop. Preserving Texas pavement and bridges is a Pavement Condition top priority. We measure their condition and We will achieve our system preservation goal evaluate their performance to ensure that when 90 percent of our roads and 80 percent of we take action and provide improvements at our bridges are rated good or better. TxDOT is the lowest life-cycle cost. Road and bridge committed to reaching these targets by conditions are rated on a scale from poor Through 2005, pavement and bridge condition to better that takes into account factors ratings steadily increased. However, 2007 including the smoothness of the ride and their pavement conditions of good or better fell by structural integrity. A road or bridge that is about half a percent from 2005 levels. This rated good or better meets or exceeds more recent data indicates that meeting our all federal and state safety and structural goal will require additional preservation efforts. requirements. The condition of Texas roads and bridges has steadily improved since In 2005, more than 87 percent of our pavement lane-miles and 76 percent of our bridges were rated good or better. Pavement in Good or Better Condition Source: TxDOT Construction Division, Annual Texas Condition Assessment Program Report, Lane-Miles in Good or Better Condition 2012 Goal 95% 90% 85% 80% 75% 70% 65% 60% Pavement and Bridge Conditions UP DESIRED TREND UP ACTUAL TREND 55% 50% Milo Interchange, Interstate 35 at Loop 20 in Laredo, Texas Photo by Michael Amador/TxDOT
33 31

34 Today, the cable-stayed Veterans Memorial Bridge serves northbound traffic on Texas 87. Photo by Kevin Stillman/TxDOT TxDOT is a national leader in system preservation, applying innovative engineering science to maximize the productivity of our system at the lowest costs. Bridge Conditions To manage bridges in Texas, we divide them into two categories those on the state highway system owned and maintained by TxDOT, and those that are not. The bridges that are maintained by a city or county are called offsystem bridges, and they account for one-third of all bridges in the state. The accompanying chart shows the difference in the conditions of off- and on-system bridges in Texas. While there is no reliable nationwide standard for pavement condition ratings, the U.S. Department of Transportation prepares the National Bridge Inventory every two years to determine the structural health of the nation s bridges. TxDOT conducts structural assessments and determines condition ratings for bridges in Texas. Bridges that need improvement fall into two categories: structurally deficient, which means its load capacity is significantly decreased due to deterioration; and functionally obsolete, which is a bridge that has no physical deficiency but does not perform the functional role required. For example, a bridge with no sidewalks on a section of highway with sidewalks is categorized as functionally obsolete. The proportion of bridges 18 US Department of Transportation, National Bridge Inventory, pavement condition measure: percent; bridge condition measure: percent; TxDOT Construction and Bridge Divisions. Texas Bridges in Good or Better Condition Source: TxDOT Bridge Division, Annual Report on Texas Bridges, Off-System On-System Entire System 2012 Goal 100% 90% 80% 70% 60% 50% 40% 30% 20% 10% 0% in Texas that are structurally deficient or functionally obsolete is 21 percent, which is lower than the national average of 27 percent. TxDOT is working hard to make sure our percentage continues to decrease over time. 18 improve. 19 In the short term, persistent high fuel prices will probably help us preserve the system, as it will experience less use. In the long term, however, demand will increase as drivers turn to more efficient and alternative fuel vehicles. The decline in the purchasing While the 2000 to 2005 performance measure power of the motor fuel tax due to increase in baseline shows both pavement and bridge construction costs from high energy costs will conditions increasing, more recent data make preserving our transportation assets show pavement condition decreasing slightly more difficult. through 2007 as bridge conditions continue to 32

35 What is TxDOT doing to preserve the value of transportation assets? Innovative Engineering Science TxDOT is a national leader in system preservation, applying innovative engineering science to maximize the productivity of our system at the lowest costs. Pavement and bridge condition ratings provide methods that enable TxDOT engineers and planners to make informed decisions about where and how to spend funds for road maintenance and preservation, bridge replacement and rehabilitation, and safety improvements. These methods ensure the most productive use of our maintenance dollars. Multiple Funding Options Although TxDOT is not responsible for off-system bridges, we do help cities and counties maintain and rehabilitate them through various funding programs. We 1) assist them with low-rate loans through the State Infrastructure Bank, 2) pay half their share for bridge replacement and rehabilitation through the Highway Bridge Program, and 3) lower the cost of construction for counties through the Economically Disadvantaged Counties Program. Possum Kingdom Masonry Arch Bridge spans the Brazos River. The 66-year-old bridge is 433 feet long and was designed to withstand floodwaters released from Morris Sheppard Dam upstream. Completed in 1942, it was built of local limestone by WPA workers many of whom were unemployed coal miners skilled at stonecutting. 33 Photo by Kevin Stillman/TxDOT

.")
36 As stewards of Texas transportation system, it is our responsibility to provide management and leadership to increase system efficiency and improve public transportation services and facilities. Downtown Houston viewed from the east of IH-45 (in foreground). Our Strategies 34

37 STRATEGY 1: We will use all available financial tools to build transportation projects. Traditional, tax-based methods of financing transportation projects are no longer sufficient to handle the state s transportation needs. Sustained high fuel efficiency and high fuel prices will significantly reduce the buying power and yield of the motor fuel tax. Relying on the motor fuel tax as a primary source of revenue to finance projects simply won t get the job done. Handling our growing mobility needs and preserving our transportation assets depend upon using some new funding options that make the best use of our available funds. Having alternative ways to fund projects is very good news for Texas. Through creative thinking and cooperation, the Texas Legislature provided some financial options to help support our needs now and into the future. The tools provided in House Bill (HB) 3588, passed in 2003, continue to serve Texas well. As we put these financial options to work, our goal is that our roadways become less crowded and those traveling in or through Texas will have an easier time getting where they need to go. 35

38 STRATEGY 2: We will empower local and regional leaders to solve local and regional transportation problems. TxDOT s role in local and regional transportation solutions is changing. We are partnering with communities across the state to share our technical skills and to facilitate in planning and financing projects. Delegating power to local authorities and giving them innovative ways to fund projects allows more flexibility in project development and construction. STRATEGY 3: We will harness market-based principles to maximize competition, reduce costs, and guide investments. TxDOT invests capital where it is most productive and where there is a consumer demand. We apply competitive pressure to drive down the cost of transportation projects to ensure the public gets the best deal for their investment in the system. We also make management and investment decisions that ensure funds are used in the most cost-effective way to meet our goals. Evaluating the return on investment against our goals will drive how we manage and fund transportation. TxDOT will continue to innovate and improve the work that we do and how we do it to decrease the costs of our projects and services. We are partnering with communities across the state to share our technical skills and to facilitate in planning and financing projects. STRATEGY 4: We will facilitate consumer-driven decisions that respond to market forces. To make the best use of our federal and state funding, we need to balance our use and development of transportation services with their costs. We must look at the cost of various transportation options from the user perspective. Will it be used enough to justify the cost? Is the cost in line with what people are willing to pay? One way to do this is through clear communication of pricing concepts and options. Toll roads, High Occupancy Toll lanes, and for-profit transportation providers, such as freight rail and aviation, use the pricing concept to help users decide which option is best for them given their individual travel needs. 36
39 37
40 Our Tactics Financing We will use all available financial options to motorist, if it were a toll road, is instead paid The primary purpose of toll equity is to make maintain and expand the transportation system. for or passed through to TxDOT. The local the best use of TxDOT funds by leveraging Through innovative financing, we can build area benefits from timely improvements in other sources of project funding, particularly Handling our growing projects sooner, which will help to more quickly address congestion and its environmental and mobility and safety, and the state benefits by not having to pay the hefty initial proceeds from bonds. The money that TxDOT saves from not having to fully fund the project economic impacts. investment associated with road building and with public funds can then be used for other mobility needs and preserving our transportation assets Motor Fuel Tax Revenues We depend on state and federal motor fuel taxes for the majority of our programming, administration, and project development financing. Our financing tactics enable the most productive use of these funds. maintenance. Public acceptance and traffic usage are higher on roads built with passthrough financing than conventional tolls because users don t experience time delays or the out-of-pocket expenses associated with conventional tolling. needed projects. Registration Fees A vehicle registration fee is required for all vehicles in Texas and the fee varies according to the class of vehicle being registered. In addition, counties in Texas levy vehicle depend upon using new funding options that make the best use of our resources. Debt Financing Construction costs have risen much faster than interest rates, making it financially feasible to borrow funds to accelerate projects. This enables us to pay a more current, reduced cost for construction materials. Also, we can use toll revenues from a completed project to finance this debt. This reduces life-cycle management Pass-through projects are underway in many Texas metropolitan areas, including: Congestion relief on State Spur 601 in El Paso; safety improvements to FM 365 in Jefferson County; congestion-related improvements to many roads in Hays County; and the construction of a US 277 relief loop in Val Verde County. Toll Equity registration fees to pay for improvements to their road systems. Texas vehicle registration fees remitted to the State Highway Fund average about $62 per vehicle registration. In fiscal year 2007, vehicle registration fees contributed $984.2 million to the State Highway Fund and provided $444.6 million to Texas counties. Public-Private Partnerships costs, and adds capacity more quickly. Toll equity allows state highway funds to be We have developed public-private Pass-Through Financing Pass-through financing is a partnership between a developer and TxDOT where roadway construction is funded with a pervehicle or per-vehicle mile paid by TxDOT to the developer. It is not a toll road. Instead, any toll that would typically be paid by a combined with other funds to build public toll roads. By issuing loans and grants, TxDOT can participate in the acquisition, construction, maintenance, or operation of a toll road built by other entities. The organization building the road then issues debt to finance the remaining cost of the project, saving TxDOT the cost equal to that debt. partnerships to help reach our goals to improve Texas transportation system. These financial partnerships provide additional funds that allow TxDOT to complete projects much quicker than with traditional funding sources. Public-private partnerships also encourage cost savings and innovation by the private sector. 38
41 39
42 40
, toll and SPAG airport authorities, transit agencies, and local and Permian Basin state government")
43 Partnerships Our strong multimodal partnerships help 4 TxDOT develop innovative and creative ways Amarillo to stretch funds farther and do the most good for the people of Texas. Our partners include Metropolitan Planning Organizations, 5 Lubbock Councils of Government (COGs), toll and SPAG airport authorities, transit agencies, and local and Permian Basin state government entities. We are continually El Paso seeking new strategic partnerships PBRPC to enhance our transportation system. 6 RGCOG Local Tolling Entities The Texas Transportation Commission partners with local tolling entities, such as the North Texas Tollway Authority and the Harris County Toll Road Authority, to improve the transportation system. Both have been solid partners in solving pressing transportation needs. Regional Mobility Authorities (RMAs) The Commission also partners with counties to establish RMAs. These are political subdivisions formed to allow an individual county or multiple counties to work together to develop and implement a regional approach to transportation needs. Since they have the authority to finance, acquire, design, construct, operate, maintain, expand, or extend transportation projects in their communities, RMAs give local governments a greater ability to provide mobility and safety benefits to citizens. RMAs receive funding for initial project development from the sale of bonds. They may also seek a loan or grant from TxDOT. Their projects 24 PRPC MRGDC WCTCOG San Angelo Abilene CVCOG 22 TxDOT District Number and Names NORTEX 1. Paris Wichita Falls 2. Fort Worth 3. Wichita 3 Falls 4. Amarillo 5. Lubbock2 6. OdessaNCTCOG 7. San Angelo 8. Abilene Waco Tyler 11. Lufkin 12. Houston 14 Capital 13. Yoakum Area 14. Austin 15. San Antonio Current Texas MPO, COG, and DOT District Boundaries Waco Permian Basin 9 El Paso CTCOG HOTCOG 11 DETCOG Central Texas Bryan-College Station PBRPC Corpus Christi 17. San Bryan Antonio and Bexar County 18. Dallas 19. Atlanta 20. Beaumont Laredo Urban Transportation 21. Pharr Study Laredo 23. Brownwood STDC 24. El Paso 21 Hidalgo 25. Childress CBCOG Victoria Corpus Christi Harlingen San-Benito County LRGVDC Texoma/Sherman n Denison 1 ARK-TEX North Central Texas Brownsville TexarkanaT Longview ETCOG Tyler may include highway, rail, aviation, and pedestrian facilities, and may be tolled or non-tolled. To date, their successes include: the construction and operation of a toll facility in the Central Texas RMA outside Austin (183A); a completed pass-through financing agreement in the Grayson County RMA; advanced transportation planning in the Alamo RMA; and an outer loop south and west of Tyler in the Northeast Texas RMA (Toll 49). Metropolitan Planning Organizations Working in partnership with TxDOT, MPOs help create long-term and short-term plans for effective transportation in and around urbanized areas. In addition to planning, BVCOG RGCOG South East 12 Texas CAPCOG Houston 24SETRPC H-GAC Galveston Area Council GCRPC 6 TxDOT Districts Texas MPOs Texas COGs 5 SPAG 4 Amarillo Lubbock PRPC 7 25 WCTCOG 8 MRGDC San Angelo Abilene CVCOG 22 NORTEX Wichita Falls San Antonio and Bexar County Laredo Urban Transportation Study Waco CTCOG HOTCOG 11 DETCOG Central Texas Bryan-College Station STDC 14 Hidalgo County 2 NCTCOG 21 Capital Area CAPCOG 16 CBCOG Corpus Christi Harlingen San-Benito LRGVDC Texoma/Sherman n Denison 1 ARK-TEX North Central Texas Victoria Brownsville 17 GCRPC 13 TexarkanaT Longview ETCOG Tyler South East Texas SETRPC MPOs authorize the use of certain federal funds in their areas and make project recommendations to the Commission. MPOs are made up of representatives from various organizations and often include local officials, transit officials, and state legislators. MPOs provide a means for local participation in transportation planning and decisions. There are currently 25 MPOs in Texas and they control hundreds of millions of dollars in funding each year. TxDOT provides oversight of federal transportation planning funds and provides necessary training for MPO boards and staff BVCOG Houston H-GAC Galveston Area Council TxDOT Districts Texas MPOs Texas COGs We are continually seeking new strategic partnerships to enhance our transportation system. 41

44 42

45 Texas State Infrastructure Bank State Infrastructure Banks (SIBs) were authorized in 1995, as a part of the National Highway Designation Act to help accelerate needed mobility communities, and others to identify and address Texas safety needs. The plan incorporates regional safety interests and encourages the development of regional Traffic Safety Aviation TxDOT assists cities and counties with federal and state funding for reliever and general aviation airports. We also participate in the Federal Aviation Our Adopt-An-Airport program allows communities to improvements by providing financial assistance to local entities through state transportation departments. TxDOT partners with communities to enable them to borrow funds at below-market rates, lowering overall project costs. SIB loans can help pay for several types of work, including environmental, planning and preliminary studies, right-of-way acquisitions, engineering and design work, and construction. Strategic Highway Safety Plan The Texas Strategic Highway Safety Plan identifies the state s key safety issues and guides decisions intended to lead to a significant reduction in highway fatalities and serious injuries on all public roads. TxDOT partners with schools, law enforcement, local Action Teams. Transit TxDOT provides financial support for transit in Texas smaller cities and rural areas through a number of federal grant programs and appropriated state dollars. In our seven largest urban areas, the MPOs receive federal funding for transit operations that serve the elderly and disabled populations. We work in partnership with all Texas transit authorities to provide support training and technical assistance so our mobility goals are met. In 2006, Texas transit systems reported more than 247 million trips on buses, commuter rail, and other forms of public transportation. 20 Administration s State Block Grant Program, with responsibilities for the federal improvement program for general aviation airports. Texas general aviation airport system is one of the largest in the nation with approximately 400 airports open to the public. In 2005, a TxDOT study found that Texas airports and related aviation activities provide over 61,200 jobs and $8.7 billion in total economic impact to the state. TxDOT also partners with community groups through our Adopt-An-Airport program. The program gives groups the opportunity to participate in the beautification and maintenance of their local airport. It also educates the public about the operation of their airport and its economic impact on their community. participate in the beautification and maintenance of their local airports. Texas general aviation airport system is one of the largest in the nation. 20 TxDOT Public Transportation Division, 2006 Texas Transit Statistics 43
46 44

47 Project Delivery Using CDAs results in We are focused on improving TxDOT s efficiency as well as the quality of our projects, products, Innovative Construction Techniques We continually pursue cutting-edge Comprehensive Development Agreements A Comprehensive Development Agreement greater price certainty and services. TxDOT is working hard to build credibility with the public by delivering projects and services faster and at lower costs. construction methods and technologies to improve our transportation infrastructure. For example, our bridge construction (CDA) is the tool TxDOT uses to enable private investments in the Texas transportation system. A CDA is an innovative project with a lump sum price, faster project delivery, Performance-Based Construction Contracts When negotiating construction contracts, we include penalties and incentives for timely work completion, warranties, and other performance-based specifications. methods enable us to build bridge decks faster with lowered costs and improved safety during construction. Project Indices TxDOT has enormous transportation needs and limited funds, so we must determine which projects get attention first. High-cost projects must compete with similar projects from all over the state to receive funding. We use metrics to compare needed projects to ensure we prioritize them appropriately to meet our goals. delivery method that rolls the design and construction of a toll road project into one comprehensive contract versus the traditional method of having individual contracts for separate phases of a project. Allowing TxDOT to hire one entity to do all the work on a project accelerates needed highway improvements. Using CDAs results in greater price certainty with a lump sum price, faster project delivery, and a guaranteed delivery date. State Highway (SH) 130 is an example of a highway being built under a CDA. and a guaranteed delivery date. We are focused on improving TxDOT s efficiency as well as the quality of our projects, products, and services. State Highway (SH) 130 at Decker Creek Photo by HDR 45

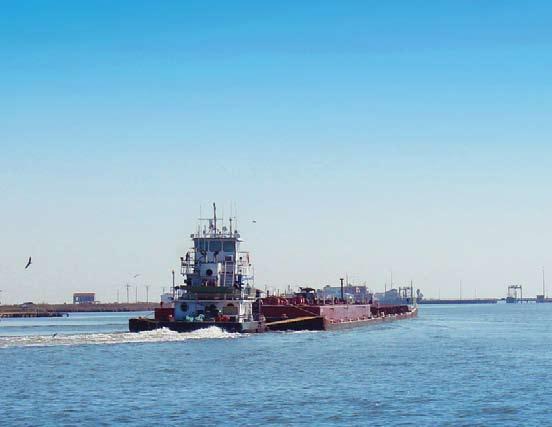
48 Multimodal Freight System Preservation Much of the nation s freight passes through Gulf Intracoastal Waterway (GIWW) Dredging The quality of our roads, bridges, and other Texas on its way across, into, or out of the The entire GIWW is a 1,300-mile-long infrastructure directly impacts our economy, United States. We plan, finance, and establish man-made canal that runs along the Gulf of safety, and mobility. To preserve and improve partnerships for multimodal solutions to rail, Mexico coastline from Texas southernmost the existing system at the lowest life-cycle truck, air, and waterway cargo transportation tip at Brownsville to St. Marks, Florida. costs, we apply cutting-edge engineering needs. With faster moving, more reliable The Texas portion of the waterway is 423 science in our projects and programs. freight transportation, our roads will be clearer, congestion impacts will lessen, and an important sector of our economy will be further strengthened. Rail Relocation Fund We are committed to improving rail transportation as an essential component of the Texas transportation system, especially in many urban areas of the state where rail lines are now moving through densely developed areas. Public safety and congestion issues resulted in the Texas Legislature passing HB 1546 and House Joint Resolution (HJR) 54 in the 2005 Legislative Session. Through approval of a constitutional amendment, Texas voters created the Rail Relocation and Improvement Fund. The Texas Constitution authorizes TxDOT to use this fund to issue grants and obligations for financing rail construction, relocation, and improvements to rail lines. These improvements focus on enhancing public safety for rail lines carrying hazardous materials through urban areas and increasing mobility through the conversion of freight rail lines to commuter rail lines. While the fund exists, it requires appropriations before TxDOT can use the fund. miles long. The GIWW is the nation s third busiest waterway with the Texas portion handling more than 58 percent of its traffic. The GIWW requires regular dredging to maintain the waterway at optimum levels and allow navigation without grounding for fully loaded commercial vessels. TxDOT, as the state sponsor, works cooperatively with the U.S. Army Corps of Engineers to maintain existing dredged material sites and find new locations for the placement of dredged material. Rail Partnerships TxDOT helps develop collaborative regional solutions for commuter and freight rail systems. In support of our mobility goals, we assist communities exploring multimodal solutions, such as the Austin- San Antonio Intermunicipal Commuter Rail District. We also contribute our expertise to rail partnerships, such as the Gulf Coast Freight Rail District. In this economically critical region, which covers Harris County, Fort Bend County, and the City of Houston, the district manages freight and passenger rail systems, partnering with governments and industry to sustain economic growth and limit quality of life impacts. The Texas Pavement Preservation Center In collaboration with the Center for Transportation Research at the University of Texas at Austin and the Texas Transportation Institute at Texas A&M University, we research and promote the use of pavement preservation strategies. Extending the service life of pavement saves money. It is much less expensive to maintain pavement than to completely reconstruct a roadway. While some improvements to extend the life of pavement may be costly initially, the roads will remain safe and usable longer. Infrastructure Condition Ratings TxDOT uses pavement and bridge condition ratings to guide road maintenance and preservation spending. Routine Airport Maintenance Program (RAMP) TxDOT provides grants to local governments to help them take care of their community airports. A RAMP grant can provide a general aviation airport up to a $50,000 match per airport for each fiscal year. The program includes lower cost airside and landside airport improvements and can cover new or additional work items other than maintenance. The Gulf Intracoastal Waterway is the nation s third busiest waterway. The Texas portion of the waterway is 423 miles long and handles more than 58 percent of its traffic. Tugboat pushing barge on the Gulf Intracoastal Waterway near Sargent, Texas. Photo by Scot Sullivan/TxDOT 46
49 47

50 All state highway facilities, including toll roads, will be completely owned by the State of Texas at all times. System Productivity As stewards of Texas transportation system, it is our responsibility to provide management and leadership to increase system efficiency. Our mission is to provide a system that is reliable, safe, and environmentally responsible a system that facilitates trade, productivity, and economic opportunity by allowing people and goods to move effectively throughout the state. We can help achieve this mission by maintaining strategic partnerships, and applying forwardthinking management practices. Advanced Traffic Management TxDOT districts and many cities have Traffic Management Centers that enable officials to better respond to congestion. In these centers, engineers are able to adjust the timing of traffic signals and watch for crashes and stalled vehicles. Law enforcement can monitor public safety from a center s security cameras. These centers enable better communication and response time resulting in faster clearing of incidents improving mobility and air Transportation Corridors In 2003, the Texas Legislature amended the Texas Transportation Code to authorize the state to build, own, and maintain the types of transportation facilities that most effectively meet the mobility needs of people and freight. These new provisions give the Texas Transportation Commission and TxDOT the authority to seek innovative financing and construction solutions to Texas mobility needs. They also allow TxDOT and local tolling entities to enter into Comprehensive Development Agreements. This means we can pool available federal, state, local, and private sector resources to develop multimodal transportation facilities, including highways, freight rail, passenger rail, and public utilities. The Commission can create a statewide system of multiple transportation facilities by connecting the facilities together and can share resources to improve mobility on the system. In May 2008, the Texas Transportation Commission adopted guiding principles and policies that will govern the development, All CDAs will include provisions that allow TxDOT to purchase or buy back the interest of a private developer in a CDA at any time if buying back the project would be in the best financial interest of the state. The Texas Transportation Commission shall approve, in a public meeting, the initial toll rates charged for the use of a toll project on the state highway system and the methodology for increasing the amount of tolls. Only new lanes added to an existing highway will be tolled, and there will be no reduction in the number of non-tolled lanes that exist today. CDAs will not include non-compete clauses that would prohibit improvements to existing roadways. TxDOT will always consider the use of existing right of way that satisfies the purpose and need of the project as a possible project location when conducting environmental studies. quality and reducing the risk of further incidents. Road users are able to plan trips in advance and make on-route adjustments using real-time information. construction, and operation of toll road projects on the state highway system. These policies reflect the comments TxDOT and the Commission have received from the public, legislators, and members of our citizen advisory committees. To the extent practical, TxDOT shall plan and design facilities so that a landowner s property is not severed into two or more separate tracts and the original shape of the property is preserved. All state highway facilities, including toll roads, will be completely owned by the State of Texas at all times. TxDOT will work to develop projects and meet our goals with these important principles in mind. 48

51 49
52 50
 long-term transportation plans for the state Plains case study in 2007 to consider Federal law requires that every MPO, in highway system.")
53 Planning TxDOT collects vast amounts of essential data Ports-to-Plains Case Study The Texas Metropolitan Mobility Plan (TMMP) to help guide us in developing short- and TxDOT commissioned the Ports-to- and the Texas Urban Mobility Plan (TUMP) long-term transportation plans for the state Plains case study in 2007 to consider Federal law requires that every MPO, in highway system. We provide planning funds and economic impacts and financing cooperation with TxDOT, develop a regional assistance to local governments and coordinate opportunities along a planned freight transportation plan to identify projects research statewide. Through planning and corridor route in West Texas. Study within certain financial constraints. The leadership, we ensure our transportation results established that this route TMMP and TUMP build on the regions local system is safe, reliable, and valuable to future could enhance mobility and economic plans by using the desired congestion generations of Texans. opportunity in West Texas through new targets for their regions to arrive at Key Transportation Corridors Corridor planning is a multi-jurisdictional process of coordination between TxDOT and local and regional government agencies. Together, we develop solutions for land use, safety, and mobility along an entire corridor. Some key transportation corridors we have evaluated include: Port-to-Port Feasibility Study: Corpus Christi to Laredo In 2006, TxDOT initiated the Port- infrastructure capacity and expanded transportation access. I-69 and I-35 Parallel Corridors Major corridor studies are underway in these freight corridors of statewide economic significance. The proposed I-69 corridor extends from Texarkana/ Shreveport to Mexico. Another proposed corridor would parallel I-35 and extend from south of San Antonio to the Dallas-Fort Worth area. unconstrained, needs-based plans. The TMMP and TUMP serve as a framework for identifying unmet local transportation needs. We partner with MPOs to implement these regional plans. Increasing the authority of MPOs over project selection and prioritization has simplified the regional planning process. Our mission is to provide a system that is reliable, safe, to-port Feasibility Study to assess the feasibility and cost of building and operating a truck-only tollway between the two ports. The proposed tollway would improve commercial and passenger mobility and safety and provide significant time and cost savings benefits to manufacturers and La Entrada al Pacifico Corridor Feasibility Study This study, currently underway, is examining potential transportation improvements between Mexico and Texas. It is analyzing potential freight diversion as a result of planned transportation and port improvements and environmentally responsible a system that facilitates trade, productivity, and economic retailers. in Mexico. The study is evaluating the potential impacts of the improvements opportunity. and diversions to the inland Port at Presidio and the roadway network north to Midland-Odessa. 51
54 52

55 The Road Ahead This strategic plan sets ambitious goals for the Texas Department of Transportation. Achieving these goals will take hard work and diligence. The Commission and the employees of TxDOT are proud of our accomplishments to date and we are ready for the challenges ahead. We are committed to maintaining an honest, open, and accountable agency that instills public trust and confidence while building a transportation system that will make all Texans proud. The Texas transportation system provides the basic infrastructure that supports our economy and quality of life. It is our commitment to you that TxDOT will continue to look for ways to become more efficient in planning, designing, building, operating, and maintaining Texas extensive transportation system. Through available technology, sound management, and appropriate levels of privatization, TxDOT will provide the public with improved transportation services and facilities. Together, we will deliver the best transportation system in the nation. 53

56 Prepared by the Government & Public Affairs Division of the Texas Department of Transportation 125 East 11th Street, Austin, Texas Copies of this publication have been deposited with the Texas State Library in compliance with the State Depository requirements. 2008, TxDOT All rights reserved. Printed on recycled stock.
INTERSTATE CORRIDOR PLANNING
 INTERSTATE CORRIDOR PLANNING Prioritization of Corridor Studies July 29, 2015 Importance of the Interstate System Texas is an integral part of the national interstate system. The interstate system provides
MOBILITY 2045: A FOCUS ON TRANSPORTATION CHOICE:
 Mobility 2045: The Metropolitan Transportation Plan for North Central Texas is the defining vision for the multimodal transportation system in the Dallas- Fort Worth Metropolitan Planning Area. The plan,
9.0 Meeting the Challenges
 9.0 Meeting the Challenges 9.1 SLRTP Goals The SLRTP is built around the six TxDOT Strategic Plan goals. 1. Develop an organizational structure and strategies designed to address the future multimodal
The Metropolitan Transportation Plan. Public Meetings January 2016
 The Metropolitan Transportation Plan for North Central Texas Public Meetings January 2016 Presentation Agenda Mobility 2040 Draft Recommendations 2016 Transportation Conformity RTC Policy Bundle Concept
NEW YORK TRANSPORTATION FACTS ECONOMIC IMPACTS
 The 2015 U.S. Transportation Construction Industry Profile: New York page 1 NEW YORK TRANSPORTATION FACTS ECONOMIC IMPACTS The design, construction and maintenance of transportation infrastructure in New
INVESTMENT SCENARIOS CHAPTER Illustrative Investment Approaches Public Outreach 6-1
 CHAPTER 6 As detailed in Chapters 4 and 5, Texas multimodal transportation needs estimated at $21 billion annually (2014 constant dollars) illustrated in Exhibit 4-12 far outstrip the approximately $9.1
IOWA TRANSPORTATION BY THE NUMBERS:
 IOWA TRANSPORTATION BY THE NUMBERS: Meeting the State s Need for Safe and Efficient Mobility MARCH 2013 202-466-6706 www.tripnet.org Founded in 1971, TRIP of Washington, DC, is a nonprofit organization
MAINE TRANSPORTATION BY THE NUMBERS:
 MAINE TRANSPORTATION BY THE NUMBERS: Meeting the State s Need for Safe, Smooth and Efficient Mobility OCTOBER 2016 202-466-6706 tripnet.org Founded in 1971, TRIP of Washington, DC, is a nonprofit organization
Texas Freight Mobility Plan. Chapter 1: Introduction
 Texas Freight Mobility Plan Chapter 1: Introduction Draft August 8, 2014 The Texas Freight Mobility Plan (the Freight Plan) gives Texas a road map for boosting our economic growth potential through a solid
2004 FEASIBILITY STUDY UPDATE
 Austin-San Antonio Intermunicipal Commuter Rail District 2004 FEASIBILITY STUDY UPDATE December 2004 EXECUTIVE SUMMARY INTRODUCTION Almost 3 million people in Central Texas, living and working between
Travel Time Index: Why All the Fuss? Tim Lomax Texas A&M Transportation Institute
 Travel Time Index: Why All the Fuss? Tim Lomax Texas A&M Transportation Institute http://mobility.tamu.edu/ Key Aspects of TTI s Performance Measurement Recommendations Goal: Help a range of audiences
TEXAS FREIGHT MOBILITY PLAN. Greater Houston Freight Committee Kick-Off Meeting
 TEXAS FREIGHT MOBILITY PLAN Greater Houston Freight Committee Kick-Off Meeting July 11, 2016 Overview of Texas Freight Mobility Plan The Freight Plan is TxDOT's first multimodal transportation plan that
MONTANA TRANSPORTATION BY THE NUMBERS:
 MONTANA TRANSPORTATION BY THE NUMBERS: Meeting the State s Need for Safe and Efficient Mobility FEBRUARY 2014 202-466-6706 tripnet.org Founded in 1971, TRIP of Washington, DC, is a nonprofit organization
CONNECTICUT TRANSPORTATION BY THE NUMBERS:
 CONNECTICUT TRANSPORTATION BY THE NUMBERS: Meeting the State s Need for Safe and Efficient Mobility MAY 2017 202-466-6706 tripnet.org Founded in 1971, TRIP of Washington, DC, is a nonprofit organization
2. Guiding Principles, Objectives, and Policies
 2. Guiding Principles, Objectives, and Policies INTRODUCTION The guiding principles for the 2040 MTP Update establish the vision and key focus areas for this planning effort. They combine the guidance
MONITORING IMPLEMENTATION AND PERFORMANCE
 12 MONITORING IMPLEMENTATION AND PERFORMANCE The FAST Act continues the legislation authorized under MAP-21, which created a data-driven, performance-based multimodal program to address the many challenges
1.0 Introduction to Transportation Planning
 1.0 Introduction to Transportation Planning A good plan is like a road map: it shows the final destination and usually the best way to get there. H. Stanley Judd 1.1 Purpose Why is Transportation Planning
North Central Texas Council of Governments 157
 13. Transportation System Safety The goal of the Transportation System Safety Program Area is to improve transportation safety throughout the region by supporting planning efforts to develop safety policies,
LOUISIANA TRANSPORTATION BY THE NUMBERS:
 LOUISIANA TRANSPORTATION BY THE NUMBERS: Meeting the State s Need for Safe, Smooth and Efficient Mobility MARCH 2017 202-466-6706 tripnet.org Founded in 1971, TRIP of Washington, DC, is a nonprofit organization
TEXAS DEPARTMENT OF TRANSPORTATION. Texas Metropolitan Mobility Plan: Breaking the Gridlock
 TEXAS DEPARTMENT OF TRANSPORTATION Texas Metropolitan Mobility Plan: Breaking the Gridlock CONTENTS PAGES Overview 1-2 Planning 1 Funding 2 Streamlined Project Delivery 2 Introduction: Why a Texas Mobility
MAINE TRANSPORTATION BY THE NUMBERS:
 MAINE TRANSPORTATION BY THE NUMBERS: Meeting the State s Need for Safe and Efficient Mobility OCTOBER 2012 202-466-6706 www.tripnet.org Founded in 1971, TRIP of Washington, DC, is a nonprofit organization
Regional Mobility Authorities in Texas
 Regional Mobility Authorities in Texas Testimony of Ginger Goodin, P.E., Senior Research Engineer and Director, TTI Transportation Policy Research Center John Overman, Research Scientist for Transit Mobility
TRANSPORTATION 101 Today and Tomorrow. Moving People and Goods
 TRANSPORTATION 101 Today and Tomorrow Moving People and Goods What is the Transportation Commission? An independent, seven-member body of citizens appointed by the Governor for six-year terms and representing
RTC Mobility Plan Workshop. North Central Texas Council of Governments July 9, 2015
 RTC Mobility Plan Workshop North Central Texas Council of Governments July 9, 2015 Agenda 1. Introduction to the Metropolitan Transportation Plan (MTP) 2. New Planning Parameters 3. Emerging Planning and
NEW HAMPSHIRE TRANSPORTATION BY THE NUMBERS:
 NEW HAMPSHIRE TRANSPORTATION BY THE NUMBERS: Meeting the State s Need for Safe and Efficient Mobility February 2013 202-466-6706 www.tripnet.org Founded in 1971, TRIP of Washington, DC, is a nonprofit
Congest-Shun. Tim Lomax Texas A&M Transportation Institute
 Congest-Shun An SEC Rival Discusses Mobility Data & How It Might Be Used to Design and Market Transportation Projects 58 th Annual Transportation Conference February 2015 Tim Lomax Texas A&M Transportation
OKLAHOMA TRANSPORTATION BY THE NUMBERS:
 OKLAHOMA TRANSPORTATION BY THE NUMBERS: Meeting the State s Need for Safe, Smooth and Efficient Mobility MAY 2017 202-466-6706 tripnet.org Founded in 1971, TRIP of Washington, DC, is a nonprofit organization
MISSISSIPPI TRANSPORTATION BY THE NUMBERS:
 MISSISSIPPI TRANSPORTATION BY THE NUMBERS: Meeting the State s Need for Safe and Efficient Mobility MARCH 2016 202-466-6706 tripnet.org Founded in 1971, TRIP of Washington, DC, is a nonprofit organization
Summary of transportation-related goals and objectives from existing regional plans
 SMTC 2050 Long Range Transportation Plan Appendix A: Summary of transportation-related goals and objectives from existing regional plans SMTC 2050 Long Range Transportation Plan Summary of transportation-related
2017 TRANSPORTATION POLICY STATEMENT
 0 TRANSPORTATION POLICY STATEMENT 1 1 1 1 1 1 0 1 0 1 0 1 Critical investments are needed to maintain and improve Virginia s transportation network. The structural imbalance between critical needs and
DECEMBER P R O G R E S S R E P O R T
 DECEMBER 201 2 P R O G R E S S R E P O R T The My 35 Plan is a dynamic document and will continue to be re-evaluated and updated by the Committee as needed. The My 35 Plan contains the ideas and recommendations
Chapter 1 Introduction
 Chapter 1 Introduction KEY POINTS The amount and value of freight are critical components of the overall economic health of Missouri. Missouri s multimodal freight system supports the movement of trucks,
TEXAS TRANSPORTATION PLAN DEVELOPMENT
 CHAPTER 2 The Texas Transportation Plan (TTP) advances performance-based planning concepts and integrates existing and ongoing state transportation plans and initiatives. While TxDOT s role as owner-operator,
Chapter 3 - Goals, Objectives, & Strategies
 Chapter 3 - This chapter presents goals, objectives, and strategies that have been developed as part of the Richmond Area MPO 2026 Long-Range Transportation Plan (LRTP) update. Strategies have been developed
This page intentionally left blank.
 EXECUTIVE SUMMARY This page intentionally left blank. SATOMORROW MULTIMODAL TRANSPORTATION PLAN EXECUTIVE SUMMARY Introduction The City of San Antonio is anticipated to experience tremendous growth resulting
KANSAS TRANSPORTATION BY THE NUMBERS:
 KANSAS TRANSPORTATION BY THE NUMBERS: Meeting the State s Need for Safe, Smooth and Efficient Mobility APRIL 2017 202-466-6706 tripnet.org Founded in 1971, TRIP of Washington, DC, is a nonprofit organization
Creating Safe, Sustainable, Multi-Modal Urban Transportation
 Policy 2015 Creating Safe, Sustainable, Multi-Modal Urban Transportation The National Association of City Transportation Officials (NACTO) is a coalition of America s largest cities hubs of economic activity,
The Ohio Department of Transportation Asset Management Playbook Plays for Success
 The Ohio Department of Transportation Asset Management Playbook 2017 8 Plays for Success The Ohio Department of Transportation Asset Management Playbook 1 Contents Introduction 2 Challenge 1: Flat Funding
The Metropolitan Transportation Plan. Public Meetings February 2016
 The Metropolitan Transportation Plan for North Central Texas Public Meetings February 2016 Presentation Agenda Mobility 2040 Draft Recommendations RTC Policy Bundle Concept Transportation Improvement Program
Transportation Concurrency
 2015 Frequently Asked Questions About. Transportation Concurrency Q. What is Transportation Concurrency? A. Transportation Concurrency is both a State law requirement and a City pre-application development
Transportation Concurrency
 2017 Frequently Asked Questions About. Transportation Concurrency Q. What is Transportation Concurrency? A. Transportation Concurrency is both a State law requirement and a City pre-application development
Ohio 21 st Century Transportation System It s Ours to Create!
 Ohio 21 st Century Transportation System It s Ours to Create! Jolene M. Molitoris, Assistant Director The Ohio Department of Transportation September 16, 2008 Ohio s transportation system is anchored by
GUIDING PRINCIPLES MEMORANDUM
 M E T R O P O L I TAN TRA NS P O RTATI O N PLAN GUIDING PRINCIPLES MEMORANDUM El Paso Metropolitan Planning Organization INTRODUCTION The guiding principles for development of the El Paso MPO s Destino
Wisconsin Transportation by the Numbers
 Wisconsin Transportation by the Numbers MEETING THE STATE S NEED FOR SAFE, SMOOTH AND EFFICIENT MOBILITY SEPTEMBER 2018 TRIPNET.ORG Founded in 1971, TRIP of Washington, DC, is a nonprofit organization
INTEGRATING FREIGHT IN CORRIDOR PLANNING AND PROJECT DEVELOPMENT. Steve Linhart, AICP Caroline Mays, AICP
 INTEGRATING FREIGHT IN CORRIDOR PLANNING AND PROJECT DEVELOPMENT Steve Linhart, AICP Caroline Mays, AICP June 17, 2016 The Importance of Freight Transportation in Texas Almost 4 billion tons of freight
Intermodalism -- Metropolitan Chicago's Built-In Economic Advantage
 May 1, 2015 Intermodalism -- Metropolitan Chicago's Built-In Economic Advantage CMAP's regional economic indicators microsite features key measures of metropolitan Chicago's economy and, where applicable,
EXECUTIVE SUMMARY. for improving the efficiency, mobility, reliability, and safety of this critical transportation corridor.
 TxDOT I-45 Freight Corridor Plan EXECUTIVE SUMMARY Interstate 45 (I 45), linking Galveston, Houston and Dallas is the most heavily traversed multimodal freight corridor in Texas. The highway element of
Transportation Problems and Issues Excerpts from WWW Links
 Transportation Problems and Issues Excerpts from WWW Links Reference Bok, D. (2018). Transportation policy and planning. https://www.hks.harvard.edu/courses/transportation-policy-and-planning Transportation
Appendix F: Scenario Planning
 Appendix F Scenario Planning Appendix F: Scenario Planning This technical memorandum discusses scenario planning, a visioning tool for the future of Missouri freight and freight planning. Why scenario
Regional Performance Measures Annual Progress Report TPO Board - 2/4/2016 Presentation by: Chris Wichman, Senior Planner
 2015 TPO Board - 2/4/2016 Presentation by: Chris Wichman, Senior Planner Overview History and definition of performance-based planning & programming Review of 2015 TPO Board Action Requested 2 History
Minnesota Statewide Freight System Plan Action Agenda Development Lead Agency (MnDOT or
 Economy What steps should be taken to ensure the freight system is used as a conduit for economic activity? E1 Intermodal and Intermodal and multimodal facility development to allow goods Multimodal Facilities
SCDOT Needs, Funding Challenges, and Economic Development. Getting to Good (and Staying There ) Robert St. Onge, SCDOT January 2013
 Robert St. Onge, SCDOT January 2013") SCDOT Needs, Funding Challenges, and Economic Development or Getting to Good (and Staying There ) Robert St. Onge, SCDOT January 2013 SCDOT s Mission Mission (Section 57-1-30, SC Code of Laws) The department
SCDOT Needs, Funding Challenges, and Economic Development or Getting to Good (and Staying There ) Robert St. Onge, SCDOT January 2013 SCDOT s Mission Mission (Section 57-1-30, SC Code of Laws) The department
HOW WILL THE NATION SATISFY GROWING DEMAND WITH LIMITED FUNDS? Europe 2,980. United States 1,130
 U.S. INFRASTRUCTURE HOW WILL THE NATION SATISFY GROWING DEMAND WITH LIMITED FUNDS? DEMAND FOR INFRASTRUCTURE: AT AN ALL-TIME HIGH D E C E M B E R 2 0 0 8 IHS Global Insight defines infrastructure as comprising
CHAPTER 6 PERFORMANCE PLANNING. Performance-Based Planning and Programming
 (Geoff Livingston/Flickr) CHAPTER 6 PERFORMANCE PLANNING The TPB has championed improvements in the ways the region s transportation system is managed and operated. This chapter describes the purpose of
EIGHT PLANNING FACTORS
 EIGHT PLANNING FACTORS Under the provisions of SAFETEA-LU, all Metropolitan Planning Organizations (MPOs) are required to consider eight (8) broad planning factors in the development of multi-modal transportation
E2 D0 U 1 C 3 A E T D IUOCNA A T IL O S N E A R L I E S S E R I E S HUB/DBE/SBE R A I L
 2E 0D1U3CEAT D UI O CN ATAI LO NSAELR ISEESR I E S R AIL HUB/DBE/SBE RAIL IN TEXAS OVERVIEW Since its inception, the Texas Department of Transportation (TxDOT) has focused on meeting the transportation
Attachment B: GM Memo a
 Attachment B: GM Memo 03-175a TO: Partnership Technical Advisory Committee DATE: May 18, 2003 FR: Lisa Klein W.I.: RE: Project Performance Measures for Transportation 2030 (2005 RTP) Legislation enacted
ONE NEVADA TRANSPORTATION PLAN The Nevada Department of Transportation s Long-Range Transportation Plan
 Executive Summary The s Long-Range Transportation Plan SAFETY, INFRASTRUCTURE, MOBILITY, ECONOMY, SUSTAINABILITY, COMMUNITY This Plan is Our Plan! A Transportation Plan by Nevadans, for Nevada How safely,
Speaker s notes for Rethinking our Path to Mobility presentation
 Speaker s notes for Rethinking our Path to Mobility presentation Slide 1 You know all those orange barrels that you see as you re driving around (name of city)? You might call them a good example of a
VIA Long Range Plan Glossary
 VIA Long Range Plan Glossary Accessibility. Accessibility is the ability to reach opportunities (economic, social, etc.) within a certain geographical area. Americans with Disabilities Act (ADA). Passed
America s Top Five Transportation Headaches
 America s Top Five Transportation Headaches -- and Their Remedies The nation s greatest challenges in providing a well-maintained, efficient and safe highway, bridge and transit system and the best opportunities
TRANSPORTATION PLAN Donald Vary
 LOUISIANA STATEWIDE TRANSPORTATION PLAN Donald Vary March 2, 2016 AGENDA Plan Development Decision-Making Process Outreach Activities Vision and Goals Transportation Needs Financial Analysis (revenue scenarios
Highest Priority Performance Measures for the TPP
 Highest Priority Performance Measures for the TPP The following list of measures are the highest priority performance measures as identified by modal working groups. These groups consist of staff from
New Approaches to Public Collaboration
 New Approaches to Public Collaboration Dean Wise Vice President, Network Strategy 2/25/2014 Rail Handles 40% of US Freight U.S. Freight By Mode 2009 Ton-Miles Truck 34% Rail 40% Water 12% Pipeline 14%
Chapter IX Regional Performance
 Chapter IX Regional Performance In recent years, performance-based planning and project programming have increasingly been employed by the North Central Texas Council of Governments (NCTCOG) in the development
2040 Addendum Performance-Based Planning November 2018
 2040 Long Range Transportation Plan 2040 Addendum Performance-Based Planning November 2018 Adopted June 13, 2018 250 S. Orange Ave, Suite 200, Orlando, FL 32801 407-481-5672 www.metroplanorlando.org MetroPlan
NORTHERN VIRGINIA TRANSPORTATION AUTHORITY
 XII NORTHERN VIRGINIA TRANSPORTATION AUTHORITY M E M O R A N D U M TO: FROM: Chairman Martin E. Nohe and Members Northern Virginia Transportation Authority Mary Hynes, Chairman, Governance and Personnel
PERFORMANCE-BASED PLANNING AND PROGRAMMING
 February 2017 performance-based planning and programming Boston Region MPO PERFORMANCE-BASED PLANNING AND PROGRAMMING WHAT IS PERFORMANCE-BASED PLANNING AND PROGRAMMING? Performance-based planning and
PURPOSE OF THE TRANSPORTATION IMPROVEMENT PROGRAM (TIP)
") INTRODUCTION PURPOSE OF THE TRANSPORTATION IMPROVEMENT PROGRAM (TIP) The Transportation Improvement program (TIP) is a staged, four-year program of projects proposed for funding by federal, State, and
INTRODUCTION PURPOSE OF THE TRANSPORTATION IMPROVEMENT PROGRAM (TIP) The Transportation Improvement program (TIP) is a staged, four-year program of projects proposed for funding by federal, State, and
RESOLUTION NO
 RESOLUTION NO. 2018-12 RESOLUTION OF THE SOUTHEASTERN WISCONSIN REGIONAL PLANNING COMMISSION AMENDING THE TRANSPORTATION IMPROVEMENT PROGRAM FOR SOUTHEASTERN WISCONSIN: 2017-2020 WHEREAS, the Southeastern
I know that you all understand the critical importance of the freight transportation system
 United States Senate Subcommittee on Surface Transportation and Merchant Marine Infrastructure, Safety and Security Testimony of Michael L. Ducker President and CEO FedEx Freight Corporation April 4, 2017
Congestion Management Process 2013 Update
 OVERVIEW OF THE DALLAS-FORT WORTH CONGESTION MANAGEMENT PROCESS Traffic Congestion In The Dallas-Fort Worth Region With the Dallas-Fort Worth (DFW) urban area as its center, the North Central Texas region
Rail Intermodal Keeps America Moving
 Rail Intermodal Keeps America Moving Association of American railroads March 2018 Summary Rail intermodal the movement of shipping containers and truck trailers on railroad flat cars has been growing rapidly
Chapter 5 - Needs Assessment and Freight Forecast
 Chapter 5 - Needs Assessment and Freight Forecast KEY POINTS Missouri s central location in the United States was consistently identified as a top strength of the State s freight system and an asset for
Trade & Logistics: Understanding the Industry
 Trade & Logistics: Understanding the Industry 1 Key Initiative of Governor Scott Florida has a once in a lifetime opportunity, with the expansion of the Panama Canal, to transform the state s economy to
GULF COAST RAIL DISTRICT VISION FOR REGIONAL RAIL
 GULF COAST RAIL DISTRICT VISION FOR REGIONAL RAIL OCTOBER 2014 Cover photographs courtesy of Top left - Mike Bates TABLE OF CONTENTS MISSION... 1 INTRODUCTION... 1 VISION STATEMENT... 1 BACKGROUND... 2
The Cost Savings Potential of Sustainability Practices
 The Cost Savings Potential of Sustainability Practices The Sustainability Triple Bottom Line The Triple Bottom Line (TBL) means addressing Environmental, Economic and Social Equity dimensions of a project
Summary. Freight transportation in New England
 This memo is preliminary in nature and subject to revision and review. Any views expressed are not necessarily those of the Federal Reserve Bank of Boston or the Federal Reserve System. To: Carrie Conaway,
11. POLICIES AND STRATEGIES
 11. POLICIES AND STRATEGIES The purpose of the 2015-2040 LRTP policies and strategies is to synthesize the Plan, which provides guidance for the development, management, and operation of the intermodal
Section 5: Performance-Based Planning
 Section 5: Performance-Based Planning Mapping the Future: The Southwestern PA Plan establishes a performance-based foundation for regional transportation investment decisions consistent with MAP-21 1 guidance.
TEXAS FREIGHT MOBILITY PLAN: DRAFT KEY POLICY RECOMMENDATIONS
 TEXAS FREIGHT MOBILITY PLAN: DRAFT KEY POLICY RECOMMENDATIONS Texas Freight Advisory Committee Midland August 14, 2014 Draft Key Policy Recommendations August 14, 2014 2014 Freight Mobility Plan Recommendations
PROVIDING SAFE AND EFFICIENT MOBILITY IN HAWAII: The Cost to Drivers of Deficient Roads, Highway Congestion and Traffic Crashes
 PROVIDING SAFE AND EFFICIENT MOBILITY IN HAWAII: The Cost to Drivers of Deficient Roads, Highway Congestion and Traffic Crashes MARCH 2012 202-466-6706 www.tripnet.org Founded in 1971, TRIP, of Washington,
VISION STATEMENT, MISSION STATEMENT, AND GOALS AND OBJECTIVES
 VISION STATEMENT, MISSION STATEMENT, AND GOALS AND OBJECTIVES Vision Statement: Our vision is to provide a high quality, safe, efficient, and cost-effective multi-modal transportation system that supports
Executive Summary. Building our Economy
 Building our Economy Transportation for a new Illinois chicago metropolis 2020 Transportation to Grow the Economy The report lays out three agendas for Illinois: 1. Families and businesses spend $100 billion
PERFORMANCE-BASED PLANNING AND PROGRAMMING
 February 2017 performance-based planning and programming Boston Region MPO PERFORMANCE-BASED PLANNING AND PROGRAMMING WHAT IS PERFORMANCE-BASED PLANNING AND PROGRAMMING? Performance-based planning and
TEXAS FREIGHT MOBILITY PLAN 2017
 TEXAS FREIGHT MOBILITY PLAN 2017 Texas Transportation Commission September 28, 2017 Overview of the Texas Freight Mobility Plan 2016 Plan First multimodal freight mobility plan Identified freight network,
Iowa s Deficient Bridges
 Iowa s Deficient Bridges Strategies to improve and maintain the condition of Iowa s bridges February 2008 The Road Information Program 1726 M Street, NW, Suite 401 Washington, DC 20036 Phone: (202) 466-6706
The Fertilizer Institute. Current Transportation Dynamics November 6, 2006 By Tom Williamson, Transportation Consultants Co.
 The Fertilizer Institute Current Transportation Dynamics November 6, 2006 By Tom Williamson, Transportation Consultants Co. Questions What will be the cost of fuel, insurance, taxes, and new transportation
Mobility and System Reliability Goal
 Mobility and System Reliability Goal Provide surface transportation infrastructure and services that will advance the efficient and reliable movement of people and goods throughout the state. Background:
National Cooperative Freight Research Program Project 03. Gordon Proctor TRB Summer Meeting 2010
 National Cooperative Freight Research Program Project 03 Gordon Proctor TRB Summer Meeting 2010 To develop measures to gauge the performance of the freight transportation system To support Investment Operations
WTP 2035 DRAFT STRATEGIES AND ACTIONS
 INTRODUCTION This Working Paper presents draft strategies and actions to be considered for inclusion in the draft Washington Transportation Plan 2035. It includes reference to the existing WTP 2030 strategies
PERFORMANCE-BASED PLANNING AND PROGRAMMING
 September 2018 performance-based planning and programming Boston Region Metropolitan Planning Organization: PERFORMANCE-BASED PLANNING AND PROGRAMMING WHAT IS PERFORMANCE-BASED PLANNING AND PROGRAMMING?
MnDOT Overview. Charlie Zelle Commissioner, MnDOT Jan. 23, 2017
 MnDOT Overview Charlie Zelle Commissioner, MnDOT Jan. 23, 2017 Creation of MnDOT Minnesota Statutes, Sections 174.01-174.03 Created by the Legislature in 1976 Combined former Department of Aeronautics,
6 CHARTING PERFORMANCE
 DRAFT 6 CHARTING PERFORMANCE OVERVIEW OF PERFORMANCE BASED PLANNING Background of Performance Based Planning Increasingly, over the past two decades, transportation agencies have been utilizing performance
Governor Baldacci s Transportation Bond Proposal
 Governor Baldacci s Transportation Bond Proposal Talking Points Highway and Bridge Investment The lifeblood of the Maine economy $100 HF Bond Maine s Bridges are old and getting older - Nearly 10% are
SECTION II CONTROLLED ACCESS FACILITIES
 SECTION II CONTROLLED ACCESS FACILITIES SYSTEM IDENTIFICATION A critical component of the Dallas-Fort Worth (DFW) Metropolitan Transportation System is the regional freeway and tollway systems, which are
CITY OF JACKSONVILLE 2030 MOBILITY PLAN STUDY UPDATE GOALS, OBJECTIVES, AND PERFORMANCE MEASURES PREPARED FOR: CITY OF JACKSONVILLE
 CITY OF JACKSONVILLE 2030 MOBILITY PLAN STUDY UPDATE GOALS, OBJECTIVES, AND PERFORMANCE MEASURES 3.20.2017 PREPARED FOR: CITY OF JACKSONVILLE 55 Railroad Row White River Junction, VT 05001 802.295.4999
Safety. Introduction. Total System
 Safety Introduction Ohio is the 35 th largest state in the nation based on geographic size, however it carries the 5 th largest total traffic volume and the 4 th largest truck traffic volume. With such
Accelerated Construction: A Path Forward by Texas Department of Transportation 512/ All Rights Reserved
 Accelerated Construction: A Path Forward 2018 by Texas Department of Transportation 512/416-2500 All Rights Reserved Introduction The construction zone is the visible and perhaps only connection between
TEXAS TRANSPORTATION PLAN
 TEXAS TRANSPORTATION PLAN TxDOT Planning Conference June 5, 2014 Michelle Maggiore, P.E., CH2M HILL Agenda 1 Performance-based planning what is it? 3 2 How is performance-based planning addressed in the