Alternative EAW Form for Animal Feedlots ENVIRONMENTAL ASSESSMENT WORKSHEET
|
|
|
- Esmond Miles
- 6 years ago
- Views:
Transcription
1
2 Alternative EAW Form for Animal Feedlots ENVIRONMENTAL ASSESSMENT WORKSHEET Note to reviewers: The Environmental Assessment Worksheet (EAW) provides information about a project that may have the potential for significant environmental effects. This EAW was prepared by the Minnesota Pollution Control Agency (MPCA), acting as the Responsible Governmental Unit (RGU), to determine whether an Environmental Impact Statement (EIS) should be prepared. The project proposer supplied reasonably accessible data for, but did not complete the final worksheet. Comments on the EAW must be submitted to the MPCA during the 30-day comment period which begins with notice of the availability of the EAW in the Minnesota Environmental Quality Board (EQB) Monitor. Comments on the EAW should address the accuracy and completeness of information, potential impacts that are reasonably expected to occur that warrant further investigation, and the need for an EIS. A copy of the EAW may be obtained from the MPCA by calling An electronic version of the completed EAW is available at the MPCA Web site 1. Basic Project Information. A. Feedlot Name: SLT Cattle Company Ted s Place B. Feedlot Proposer: Ted Bullerman C. RGU: Minnesota Pollution Control Agency Technical Contact Person Andrew A. Nesseth Contact Person Kevin J. Kain and Title Project Consultant - Extended Ag Services, Inc. and Title Project Manager Address 507 Milwaukee Street Address 520 Lafayette Road North Lakefield, Minnesota St. Paul, Minnesota Phone Phone Fax Fax extag@frontiernet.net kevin.kain@state.mn.us D. Reason for EAW Preparation: (check one) EIS Scoping Mandatory EAW X Citizen Petition RGU Discretion Proposer Volunteered If EAW or EIS is mandatory give EQB rule category subpart number and name: Animal Feedlots for expansion of an animal feedlot facility of more than 500 animal units if the facility is located wholly or partially in a sensitive area. Minn. R , subp. 29B p-ear1-05 TDD (for hearing and speech impaired only): Printed on recycled paper containing 30% fibers from paper recycled by consumers
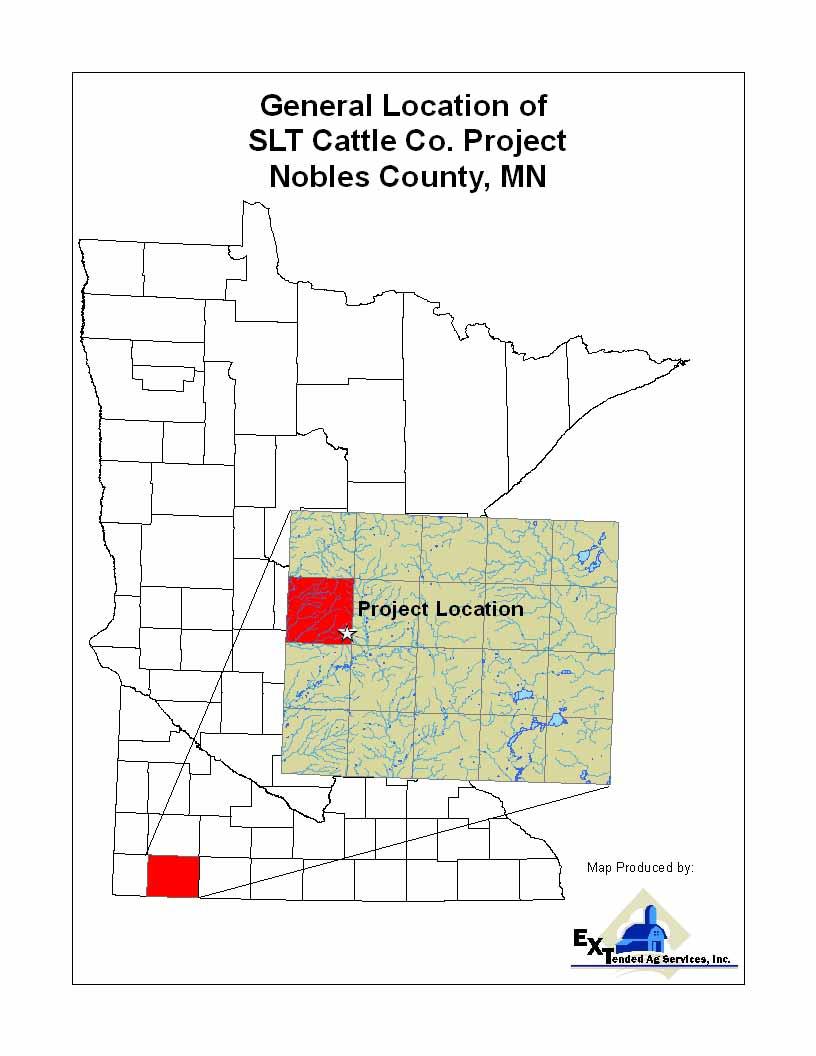
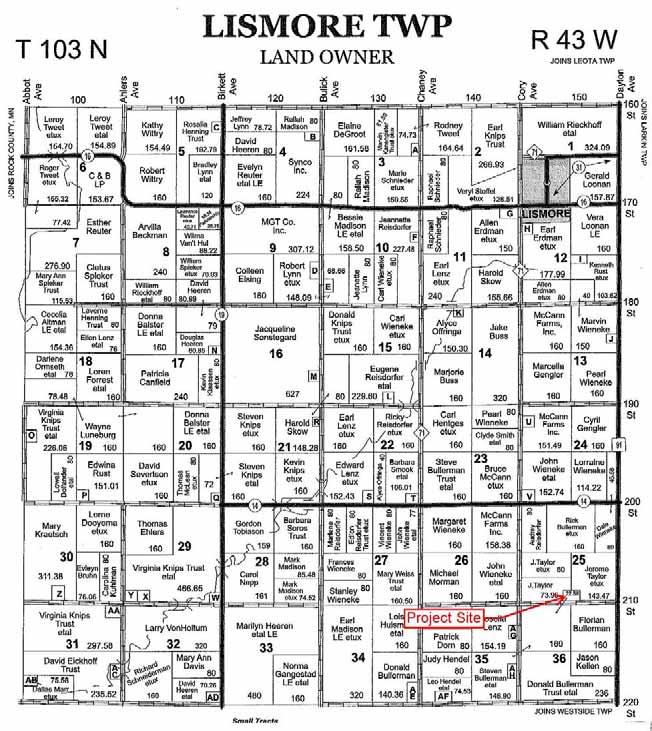
3 E. Project Location: County Nobles City/Twp Lismore SW 1/4 NE 1/4 Section 35 Township T103N Range R43W Watershed (name and 4-digit code): Rock River Watershed 0101 F. Attach each of the following to the EAW: Attachment A County map showing the general location of the project Attachment A1 Lismore Township Plat map with Project location Attachment B U.S. Geological Survey (USGS) 7.5 minute, 1:24,000 scale map indicating project boundaries Attachment C Map of Project site with significant natural features Attachment D Summary map of manure application sites Attachment E One-mile radius map Attachment F Correspondence with Minnesota Department of Natural Resources (DNR) Attachment G No document - skipped Attachment H Correspondence with Minnesota Historical Society Attachment I Air Quality Model Attachment J Results of Minnesota Phosphorus Index Modeling Attachment K Groundwater Sensitivity Map Attachment L Cumulative impacts map Attachment M Odor OFFSET Results Attachment N Traffic Impacts Map The National Pollutant Discharge Elimination System (NPDES)/State Disposal System (SDS) Permit Application and associated documents, including the Air Emissions and Odor Management Plan, the Animal Mortality Plan, the Emergency Response Plan, and the Manure Management Plan (MMP), are available for review by contacting Mr. George Schwint, of the MPCA s Willmar office, at G. Project summary of 50 words or less to be published in the EQB Monitor. Ted Bullerman (or the Proposer) is proposing the expansion of an existing beef finishing facility in Section 25 of Lismore Township in Nobles County. The facility currently has a maximum physical capacity of 1,596 animal units 1 housed in a combination of open lots and confinement barns. The proposed facility expansion will consist of the construction of two additional total confinement barns that will have a maximum physical capacity of 400 head in each barn (Project). After construction, the maximum physical capacity of the entire facility will be 2,560 animal units. Liquid manure will be stored in reinforced concrete pits located beneath the finishing barns and in a solid manure pack in the calf and grower barns. 1 An animal unit or AU is a unit of measure developed to compare the differences in the amount of manure produced by livestock species. The AU is standardized to the amount of manure produced on a regular basis by a slaughter steer or heifer, which also correlates to 1,000 pounds of body weight. The AU is used for administrative purposes by various governmental entities for permitting and record-keeping. SLT Cattle Company Ted s Place Environmental Assessment Lismore Township, Minnesota 2 Worksheet
4 H. Please check all boxes that apply and fill in requested data: Animal Type Number Proposed Type of Confinement Finishing hogs Sows Nursery pigs Dairy cows Beef cattle 800 Total confinement Turkeys Layer hens Chickens Pullets Other (Please identify species) I. Project magnitude data. Total acreage of farm: 1,741.7 Number of animal units proposed in this project: 764 Total animal unit capacity at this location after project construction: 2,560 Acreage required for manure application: 1,312 per year J. Describe construction methods and timing. Ted Bullerman proposes to construct three 70-foot by 200-foot total confinement, naturally-ventilated barns with concrete, slatted floors, and 12-foot deep, reinforced concrete pits beneath each of the barns to hold the manure generated by the finishing cattle. The concrete manure pit walls will be 12 to 14 inches thick and the divider wall will be 16 inches thick. No other construction is expected to occur at the site as a result of the proposed Project. A perimeter drain tile will be installed around the base of the liquid manure storage pit. The drain tile will help to control the potential hydrostatic pressure that could be exerted on the pit walls and floors. Inspection ports connected to the perimeter tiles will allow the producer to observe whether or not the tiles are operational, and may help to identify seepage from the pits if a leak were to occur. The anticipated time line for the proposed Project is for construction to commence in the fall of 2009 and finish in the spring The actual construction date is dependent on the completion of the environmental review process and the issuance of the NPDES/SDS Permit. K. Past and future stages. Is this project an expansion or addition to an existing feedlot? Yes No Are future expansions of this feedlot planned or likely? Yes No If either question is answered yes, briefly describe the existing feedlot (species, number of animals and animal units, and type of operation) and any past environmental review or the anticipated expansion. The proposed Project is an expansion of an existing feedlot located in the SW¼ of the SE¼ of Section 25 in Lismore Township, Nobles County. The existing facility consists of two 70-foot by 200-foot total confinement, naturally-ventilated finishing barns, one 100-foot by 352-foot total SLT Cattle Company Ted s Place Environmental Assessment Lismore Township, Minnesota 3 Worksheet
5 confinement, naturally ventilated grower barn, two 60-foot by 200-foot total confinement, naturally ventilated calf barns, one 40-foot by 60-foot total confinement, naturally ventilated calf barn, and one 85-foot by 96-foot temporary holding barn for cattle being shipped to market. Liquid manure generated by the beef finishing cattle is stored in an under-floor, reinforced concrete pit. The solid manure generated by the dairy heifers and the dairy calves is stored in a manure pack on a solid concrete floor. No prior environmental review has taken place for the existing facility because it has expanded over time. The proposer indicated there are no plans in the foreseeable future to expand its operation at this Project site or within six miles of the existing feedlot. 2. Land uses and noteworthy resources in proximity to the site. A. Adjacent land uses. Describe the uses of adjacent lands and give the distances and directions to nearby residences, schools, daycare facilities, senior citizen housing, places of worship, and other places accessible to the public (including roads) within one mile of the feedlot and within or adjacent to the boundaries of the manure application sites. Land surrounding the proposed Project and the manure application sites is predominately agricultural and rural in nature. The feedlot facility and all of the manure application sites are located in the Missouri River Basin, the Rock River and several minor watersheds. Land use within the area is primarily agricultural comprised of primarily two-year corn/soybean rotations and a small amount of small grains, hay, and grasslands enrolled in the Conservation Reserve Program. Feedlot: There are a total of nine residences located within one mile of the site, one of which is within one-half mile, and a total of five feedlots within one mile of the feedlot site. A map showing neighbors within one mile of the feedlot are shown in Attachment E. Odor impacts associated with the proposed Project are shown in Attachments I and L. There are no schools, daycare facilities, senior citizens housing, or public places of worship within a one-mile radius of the Project area. Manure Application Sites. The manure application sites are within 6.5 miles of the feedlot facility and are located in Leota, Larkin, Lismore, Westside, and Olney Townships (Attachment D) in Nobles County. Nobles County Lismore Township Section 13: The manure application site located in Section 13 has been in crop production for decades and is about one mile south of the town of Lismore. The site is bordered by 180 th Street to the north and Cory Avenue to the west. The farm is about two miles from the Project site. One residence is located adjacent to the manure application site to the west. Section 23: The manure application sites in Section 23 are bordered by 200 th Street to the south, Cory Avenue to the east and Chaney Avenue to the west. One residence is located within the boundaries of the site in the SE¼. One residence is located across Cory Avenue to the east. Three residences are located adjacent to the site in the SW¼ -- one across Chaney Avenue to the northwest, one to the southwest across the intersection of Chaney Avenue and 200 th Street, and one across 200 th Street to the south. The town of Lismore is approximately 2.5 miles to the north. Both sites have been in crop production for decades. SLT Cattle Company Ted s Place Environmental Assessment Lismore Township, Minnesota 4 Worksheet
6 Section 25: The manure application site in Section 25 is located approximately three miles north of the city of Adrian. The field is bordered by 210 th Street to the south, Cory Avenue to the west, and Highway 91 to the east. One residence is located adjacent to the manure application site to the east and the Project Proposer s residence is located within the boundaries of the site. The land has been in crop production for decades. Section 35: The manure application site in Section 35 is bordered by Cory Avenue to the east and 220 th Street to the south. There is one residence within the boundaries of the manure application site. The farm is one mile south of the Project site and is two miles north of the city of Adrian. The land has been in crop production for decades. Section 36: The manure application site in Section 36 is adjacent to the Project site and is south of 210 th Street, east of Cory Avenue, and runs adjacent to Highway 91to the west. The field is directly adjacent to the Project site. There are no residences within the manure application site, but two residences are located adjacent to the site, within approximately 300 feet. The city of Adrian is located about 2.5 miles to the south. The land has been in crop production for decades. Westside Township Section 1: The manure application site in Section 1 is adjacent and west of Highway 71 and north of 230 th Street. There is one residence within the manure application site. The Project site is located about two miles to the north, and the city of Adrian is located about 1.25 miles to the south. The city of Adrian campground is located approximately one mile to the south. The farm has been in crop production for decades. Section 36: The manure application site in Section 36 is bordered by Cory Avenue to the west. The field is located approximately 6.5 miles from the Project site. One residence is situated within the boundaries of the field. The city of Adrian is located approximately two miles to the north. The farm has been in crop production for decades. Olney Township Section 29: The manure application site in Section 29 is adjacent and east of Dillman Avenue. The field is about 6.5 miles south of the Project site. There are no residences within the manure application site and one residence adjacent to the south. The city of Adrian Wellhead Protection Area is located adjacent to the site to the north. The city of Adrian is located approximately 1.25 miles to the northwest. The land has been in crop production for decades. Leota Township Section 24: The manure application site in Section 24 of Leota Township is located three miles north of the town of Lismore and seven miles north of the Project site. Highway 91 is directly east of the site and 160 th Avenue is adjacent to the south. One residence is located within the boundaries of the manure application site. The farm has been in crop production for decades. Larkin Township Section 7: The manure application site in Section 7 of Larkin Township is three-quarters of a mile east of the town of Lismore and four miles north of the Project site. One residence is located within the boundaries of the manure application site. Highway 71 is adjacent and to the west of the site and 170 th Street is adjacent to the north. A cemetery is located to adjacent to the site to the north. The farm has been in crop production for decades. Section 31: The manure application site in Section 31 is one mile east of the Project site. The farm is bordered by 210 th Avenue to the North and Dillman Avenue to the east. One residence is adjacent to the site to the north. The farm has been in crop production for decades. SLT Cattle Company Ted s Place Environmental Assessment Lismore Township, Minnesota 5 Worksheet
7 B. Compatibility with plans and land use regulations. Is the project subject to any of the following adopted plans or ordinances? Check all that apply: local comprehensive plan land use plan or ordinance 2 shoreland zoning ordinance 2,3 flood plain ordinance wild or scenic river land use district ordinance local wellhead protection plan Is there anything about the proposed feedlot that is not consistent with any provision of any ordinance or plan checked? Yes No. If yes, describe the inconsistency and how it will be resolved. Is there anything about the proposed feedlot that is not consistent with any provision of any ordinance or plan checked? Yes No. If yes, describe the inconsistency and how it will be resolved. Are there any lands in proximity to the feedlot that are officially planned for or zoned for future uses that might be incompatible with a feedlot (such as residential development)? Yes No If yes, describe the potentially affected use and its location relative to the feedlot, its anticipated development schedule, and any plans to avoid or minimize potential conflicts with the feedlot. C. Nearby resources. Are any of the following resources on or in proximity to the feedlot, manure storage areas, or within or adjacent to the boundaries of the manure application sites? Drinking Water Supply Management Areas designated by the Minnesota Department of Health? Yes No Public water supply wells (within two miles)? Yes No Archaeological, historical or architectural resources? Yes No Designated public parks, recreation areas or trails? Yes No Lakes or Wildlife Management Areas? Yes No State-listed (endangered, threatened or special concern) species, rare plant communities or other sensitive ecological resources such as native prairie habitat, colonial waterbird nesting colonies or regionally rare plant communities? Yes No Scenic views and vistas? Yes No Other unique resources? Yes No 2 Nobles County Zoning Ordinance. 3 According to the Nobles County Ordinance Section 16.Sub.11.2.b. (Shoreland Regulations), No new feedlot shall be located within 1000 feet of the normal high water mark of a lake or within 300 feet of the normal high water mark of a stream or river All new or existing feedlots shall meet the Shoreland Standards outlined in the Nobles County Shoreland Ordinance Section A and B. The proposed Project is not within 1,000 feet of an ordinary high water level or 100-year floodplain, and complies with the Shoreland Standards in the Nobles County Ordinance. SLT Cattle Company Ted s Place Environmental Assessment Lismore Township, Minnesota 6 Worksheet
8 If yes, describe the resource and identify any project-related impacts on the resource. Describe any measures to minimize or avoid adverse impacts. Resources Adrian Campground The Adrian Campground was identified about one mile to the south of the proposed manure application site in Westside 1, SE¼ of SE¼ (Attachment D). The Adrian Campground is a large recreational vehicle park featuring a variety of recreational activities. The site is open from May 15 October 15. The facility offers a public source of drinking water. City of Adrian Source Water Protection Area The city of Adrian water supply system is implementing a wellhead protection plan that has been approved by the Minnesota Department of Health under Minn. R. ch The water wells used by the Adrian meet current standards for construction and maintenance. These factors do not contribute to the susceptibility of the source water to contamination. The aquifer sensitivity refers to the degree of geological protection afforded the aquifer(s) used by the public water supply. The SWPA for the city of Adrian has both high and low aquifer sensitivities within its boundary. Rare Species/Natural Features The Minnesota Natural Heritage database has been reviewed to determine if any rare plant or animal species or other significant natural features are known to occur within an approximate one-mile radius of the proposed feedlot facility or manure application sites. Based on the review, there is one known occurrence of a rare species or native plant communities within an approximate one-mile radius of the Project area or a manure application site. The following that are listed are those elements that were identified by the Minnesota Department of Natural Resources: 1. Topeka shiner (Notropis Topeka): a. Elk Creek and Kanaranzi Creek are federally designated as critical habitat for the Topeka shiner, a federally-listed endangered and state-listed special concern fish species. Topeka shiners are adversely impacted by actions that alter stream hydrology or decrease water quality, including sedimentation and eutrophication. If applicable, steps should be taken to ensure that nutrient-rich runoff to this river does not occur. Mitigation Measures Surface Water Mitigation measures for protecting surface water resources and the biota that depend on unique or delicate ecological conditions for survival are based on limiting nutrient loading in land utilized by the Project and reducing the potential for mobilization of these nutrients. The Project Proposer will be required to follow an MMP that is designed to protect water quality by determining proper rate, timing and placement of manure applications, including following mandatory setbacks from sensitive features. The MMP has been reviewed and approved by the MPCA and it determines the nutrients needed for the intended crop from all sources. Pursuant to the MMP, liquid manure will be injected into the soil via knife injection at agronomic rates. Soil injection of liquid manure reduces the likelihood of manurecontaminated, surface-water runoff carrying excess nutrients and/or fecal coliform. Solid manure will be applied via surface application with little or no incorporation during the fall, winter and spring seasons. The majority of solid manure will be applied in the winter months on the soil surface. All applicable setbacks from sensitive features are outlined in the MMP. A review of the Minnesota Phosphorus Index indicated that the relative risk of mobilized nutrients was low or very low. SLT Cattle Company Ted s Place Environmental Assessment Lismore Township, Minnesota 7 Worksheet
9 Groundwater The Project proposer will operate the facility under the DNR Water Appropriations Permit, discussed in 4.A of this document. All nitrogen applications will follow agronomic rates based on soil organic matter content, legume credits, previous crop, commercial fertilizer inputs, and the nitrogen content of the manure. Following the MMP, in accordance with the conditions of the NPDES/SDS Permit, will reduce the potential for nitrate leaching. A review of the geology of southwestern Minnesota as a part of the Regional Hydrogeologic Assessment Series showed the predominant groundwater sensitivity rating on the land receiving manure applications is moderate sensitivity defined as taking contaminants years to decades to reach the water table (see Attachment K). It should be noted however; that the information provided in the review is generalized due to the scale of the project. No site specific investigation was done on the land application acres only an investigation of the Project site. Air Quality The application of manure will cause odors to be present due to the application of animal manure. The producer will follow the best management practices outlined in the Air Quality and Odor Management Plan. Both the MMP and the Air Quality and Odor Management plan outline immediate incorporation of liquid manure by knife injection for all liquid manure as best management practice that minimizes odors associated with manure applications. Surface application for solid manure will be employed with little or no incorporation. Air quality impacts to the resources are not expected to be significant (Attachment I & Attachment M). 3. Geologic and soil conditions. A. Approximate depth (in feet) to: Feedlot Manure Storage Area Manure Application Sites Ground Water (minimum) (average) >10 >50 >50 Bedrock (minimum) >300 >300 >300 (average) >400 >400 >400 B. NRCS Soil Feedlot Manure Storage Area Manure Application Sites Classifications (if known) Silty Clay Loam with 1-3 percent slopes Silty Clay Loam with 1-3 percent slopes, Silty Clay Loam with 2-6 percent slopes Silty Clay Loam with 0-3 slopes Silty Loam with 0-3 slopes Clay Loam with 0-3 slopes Silty Clay Loam with 2-6 slopes C. Indicate with a yes or no whether any of the following geologic site hazards to ground water are present at the feedlot, manure storage area, or manure application sites. Karst features (sinkhole, cave, resurgent spring, disappearing spring, karst window, blind valley, or dry valley) Feedlot Manure Storage Area Manure Application Sites No No No Exposed bedrock No No No Soils developed in bedrock (as No No No shown on soils maps) For items answered yes (in C), describe the features, show them on a map, and discuss proposed design and mitigation measures to avoid or minimize potential impacts. SLT Cattle Company Ted s Place Environmental Assessment Lismore Township, Minnesota 8 Worksheet
10 4. Water Use, Tiling and Drainage, and Physical Alterations. A. Will the project involve installation or abandonment of any water wells, appropriation of any ground or surface water (including dewatering), or connection to any public water supply? Yes No If yes, as applicable, give location and purpose of any new wells; the source, duration, quantity and purpose of any appropriations or public supply connections; and unique well numbers and the Department of Natural Resources (DNR) appropriation permit numbers, if available. Identify any existing and new wells on the site map. If there are no wells known on-site, explain methodology used to determine that none are present. The existing well will be used to provide water for the entire site, which will be subject to DNR Water Appropriation Animal Feedlots and Livestock Operations General Permit # The total water usage for the site after the proposed Project will be approximately 9,899,100 gallons per year, with a projected service consumption of 247,477,500 gallons over a 25-year period. The following table is a breakdown of the estimated water usage by production phase: Production Phase Days on Feed Number of Head Gallons/Hd Total Gallons Finishing Cattle (1000 lbs) , ,500,000 Dairy Heifers (700 lbs) ,544,400 Dairy Calves (300 lbs) ,700 Total Gallons Per Year = 9,899,100 A DNR Water Appropriations Permit will be required and will be applied for during the process of environmental review. The purpose of the DNR permit program is to ensure water resources are managed so that adequate supply is provided to long-range seasonal requirements for domestic, agricultural, fish and wildlife, recreational, power, navigational, and quality control. The permit program balances competing management objectives, including both the development and protection of water resources. Minn. Stat. 103G.261 establishes domestic water use as the highest priority of the state s water when supplies are limited. If a well interference arises, the DNR has a standard procedure for investigating the matter. If a commercial operator is found to be causing the problem, the operator must correct it. The well is completed in the Cretaceous aquifer. 6 Cretaceous sediments overlie the Precambrian crystalline rocks. 7 Woodward and Anderson described yields from wells in Cretaceous sandstones as variable, ranging from a few to several tens of gallons per minute (gpm). 8 Based on work conducted in the southwestern region of Minnesota, it was noted that Yields for Quaternary sediments are extremely 4 Adapted from GPE-1400, Water Requirements for Beef Cattle. University of Nebraska. 5 Schroeder, J.W. Extension Dairy Specialist, University of North Dakota. Water Needs and Quality Guidelines for Dairy Cattle. Web site (retrieved July 2008). 6 Murray County Major Aquifers. Murray County Environmental Services, Map prepared by SDRC 4/08. Retrieved on August 31, 2008 [Web site]. 7 Setterholm, D.R., Geologic maps of late Cretaceous rocks, southwestern Minnesota: Minnesota Geologic Survey Miscellaneous Map Series M-69, 2 pls., scale 175,000 and smaller. 8 Woodward, D.G., and Anderson, H.W., Jr., Hydrogeologic water-quality characteristics of the Cretaceous aquifer, southwestern Minnesota: US Geological Survey Water-Resources Investigations Report , 2 pls. SLT Cattle Company Ted s Place Environmental Assessment Lismore Township, Minnesota 9 Worksheet
11 variable. Higher yields are generally associated with surficial and gravel deposits that can yield as much as 1,000 gpm. However, yields are generally less than 100 gpm. 9 Based on the information reviewed from the County Well Logs, the Cretaceous aquifer at the Project site is covered by approximately 100 to 200 feet of low permeability superglacial drift, thereby reducing the potential for contamination from land application or manure storage activities. 10 See Attachment K for details on the relative risk of groundwater resources in relation to the proposed Project. B. Will the project involve installation of drain tiling, tile inlets or outlets? Yes No If yes, describe. A four-inch perimeter drain tile constructed of high density polyethylene pipe will be installed around the base of the liquid manure storage pit. The tile will help to control the potential hydrostatic pressure that could be exerted on the pit walls and floors. Inspection ports connected to the perimeter tiles will allow the producer to observe whether or not the tiles are operational, and may help to identify seepage from the pits if a leak were to occur. The perimeter tile will discharge into existing field tile lines. C. Will the project involve the physical or hydrologic alteration dredging, filling, stream diversion, outfall structure, diking, and impoundment of any surface waters such as a lake, pond, wetland, stream or drainage ditch? Yes No 5. Manure management. A. Check the box or boxes below which best describe the manure management system proposed for this feedlot. Stockpiling for land application Containment storage under barns for land application Containment storage outside of barns for land application Dry litter pack on barn floors for eventual land application Composting system Treatment of manure to remove solids and/or to recover energy Other (please describe) B. Manure collection, handling, and storage. Quantities of manure generated by: Beef Finishers Dairy Heifers/Calves 4,500,000 Gallons 2,500 Tons Frequency and duration of manure removal: Manure Type Number Days per Cycle Frequency of Cycle Liquid Solid 1 10 Total days per year: 42 9 Bradt, Randy, Jr., Surficial Hydrogeology. Regional Hydrogeologic Assessment Series. RHA-2, Part-B, Plate 3 of Bradt, Randy, Jr., Sensitivity of Surficial Aquifers to Pollution. RHA-2, Part-B, Plate 4 of 4. SLT Cattle Company Ted s Place Environmental Assessment Lismore Township, Minnesota 10 Worksheet
12 Give a brief description of how manures will be collected, handled (including methods of removal), and stored at this feedlot: Liquid beef manure generated by the proposed Project will be collected during the year and stored in deep pits (concrete) under slatted floors. In the fall, the liquid manure in the deep pits will be agitated and pumped out by a portable chopper pump. All liquid manure will be applied by a licensed commercial applicator. The liquid manure will be incorporated immediately upon land application via liquid tanker equipped with a knife injection system. Solid beef manure and bedding from the proposed Project will be scraped and hauled to land application sites in the fall, winter, and spring for immediate application. The majority of solid manure will be applied in the winter months on the soil surface. In the summer months, solid manure will be stockpiled until field conditions allow manure application. C. Manure utilization. Physical state of manure to be applied: liquid solid other - describe: D. Manure application. 1. Describe application technology, technique, frequency, time of year and locations. The liquid manure from this feedlot will be applied during the fall after the crops have been harvested from the designated land application sites. It will be incorporated into the soil immediately during land application via knife injection. Liquid manure will be applied utilizing a liquid tanker that injects the manure into the soil profile. The manure application equipment will be operated by a licensed commercial applicator and will be calibrated by using a flow meter and adjusting the speed of the equipment during application. Solid manure will be applied via a box spreader. Solid manure is applied to the soil surface with little or no incorporation. The box spreader is calibrated by calculating the number of acres covered by each load. The weight of the spreader is divided by the product of the length and width of the manure spread in the field for each load. Solid manure is spread in the fall, winter and spring months (non-growing season). The majority of solid manure will be applied in the winter months on the soil surface. 2. Describe the agronomic rates of application (per acre) to be used and whether the rates are based on nitrogen or phosphorus. Will there be a nutrient management plan? Yes No The manure will be applied at agronomic rates. Field priority will be based on moisture conditions in the field with those with those having lower levels of phosphorus and potassium soil tests receiving the manure first. Other factors that will determine nutrient needs will be crop grown, yield goal, organic matter content, manure credits, and other legume credits. Nutrient rates will be determined by utilizing University of Minnesota Extension Service bulletin, Fertilizer Recommendations for Agronomic Crops in Minnesota. Previous Crop Crop to utilize Manure Expected Yield Nitrogen needed Phosphorus needed Corn Corn 200 bu/ac 180 lbs N/ac 69 lbs P 2 O 5 /ac* Soybeans Corn 200 bu/ac 140 lbs N/ac 109 lbs P 2 O 5 /ac** Note: * P 2 O 5 needs per crop year ** P 2 O 5 needs for two-year rotation ac = acres bu = bushel N = nitrogen lbs = pounds P 2 O 5 = phosphorus SLT Cattle Company Ted s Place Environmental Assessment Lismore Township, Minnesota 11 Worksheet
13 This procedure has been developed from continual land grant research as the one that best predicts the amount of that nutrient in the soil that can be used by plants. Using this method, a Maximum Return to Nitrogen value will be used in determining the appropriate manure application rates. The manure application acres will be soil sampled every four years at a minimum to monitor crop needs and target acres that will positively respond to manure applications. 3. Discuss the capacity of the sites to handle the volume and composition of manure. Identify any improvements necessary. It is estimated that the finishing cattle at this facility will generate approximately 4,500,000 gallons of liquid manure per year and the feeder and calves will generate approximately 2,500 tons per year of solid manure. All manure will be applied at agronomic rates. Accordingly, approximately 1,312 corn acres each year will be needed to utilize all of the manure generated at this facility. The proposer currently has approximately 1,477 total acres available for manure application under the Project proposer s management and an additional acres available for land application by manure transfer. Manure acreage is land that is either owned or rented by the manager and is always available for application. Crop Rotations The Project proposer is currently managing the cropland in a corn corn-soybean rotation. However, some farms may be operated in a corn-soybean or a continuous corn rotation. The actual crop rotation is depended on a number of factors including, but not limited to, market conditions, crop pest and disease cycles, cost of inputs, and available management time. The MMP will be updated to reflect significant changes to the crop rotation that affect crop nutrient needs. Corn will be the primary crop grown following any manure application. In order to achieve a yield goal of 200 bushels of corn per acre in the corn/corn/soybean rotation, liquid beef manure will be applied at a nitrogen-based rate to provide approximately 140 pounds of nitrogen per acre for corn following soybeans and 180 pounds of nitrogen per acre for corn following corn or other non-legume. Based on previous manure tests from the existing facility, this will require an application rate of approximately 5,500 gallons of liquid manure per acre from the proposed Project for the first year and 4,500 gallons of liquid manure per acre from the Project in the subsequent years. Solid manure will be sold to nearby landowners for land application. It is estimated that application rates will range from 8 12 ton per acre; however, actual rates will be dictated by the manure recipient. All manure applied in Minnesota must follow an MMP that complies with the nutrient rates set forth in Minnesota feedlot rules. 11 An estimated 1,312 acres will be needed to utilize all of the manure after the first year. Please note that none the land for manure application is labeled as highly erodible by the Natural Resources Conservation Service. No improvements to any of the manure application sites will be necessary. An evaluation of each field scheduled to receive manure applications considering slope, proximity to water, tillage, crop rotations, and nutrient applications (timing, rate, placement) was conducted using the Minnesota Phosphorus Index 12 (Attachment J). The Minnesota Phosphorus Index is a management tool to 11 See Generally Minnesota Feedlot Rules. Minn. R Initial funding for development of the Minnesota Phosphorus Index came from the Minnesota Environmental Quality Board and the University of Minnesota Extension Service in response to the results of the Generic Environmental Impact Statement (GEIS) on Animal Agriculture. Current funding is from a U.S. Environmental Protection Agency 319 grant sponsored by the Minnesota Department of Agriculture. Developers include: John Moncrief, Paul Bloom, Dave Mulla, Neil Hansen, Gyles Randall, Carl Rosen, Ed Dorsey, and Ann Lewandowski, University of Minnesota. SLT Cattle Company Ted s Place Environmental Assessment Lismore Township, Minnesota 12 Worksheet
14 estimate the relative risk that phosphorus is being lost from an agricultural field and delivered to a nearby ditch, stream, or lake. All fields reviewed received low ratings, indicating that minor management changes are recommended. 4. Describe any required setbacks for land application systems. Feature Based on an MPCA review and approval of the MMP for the existing and proposed feedlots, the Project proposers have an adequate land-base to properly apply animal waste as fertilizer. Nobles County does have specific ordinance directed at the land application activities. These setbacks supersede those set out by the MPCA. 13 The MPCA feedlot regulations pertaining to setback distances will also apply. The Project proposer will abide by the MPCA and Nobles County feedlot rules regarding land application practices and environmentally sensitive features (Minn. R ). Table #1 MPCA Animal Waste Land Application Setback Distances (in feet) Winter Non-Winter With Immediate Incorporation (<24 hours) With P No P Non-Winter Not incorporated within 24 hours With Vegetated Mgmt. Mgmt. Buffer Lake, Stream Intermittent Stream* DNR protected wetlands** Drainage ditch w/o quarry* Inadequate Vegetated Buffer Open Tile Intake Well, mine or quarry Sinkhole with no Downslope Downslope 50 Downslope 50 diversion Upslope 300 Upslope 300 Upslope 300 * Intermittent streams and ditches pertain to those identified on USGS quadrangle maps, excluding drainage ditches with berms that protect from runoff into the ditch and segments of intermittent streams, which are grassed waterways. USGS quadrangle maps can be found at County Soil and Water Conservation District Offices or can be viewed on the internet at (August 17, 2004). ** Wetland setbacks pertain to all protected wetlands identified on DNR protected waters and wetlands maps (these maps are often located in County Soil and Water Conservation District offices and typically include all wetlands over ten acres) Nobles County Land Use Ordinance. SLT Cattle Company Ted s Place Environmental Assessment Lismore Township, Minnesota 13 Worksheet
15 Section of the Nobles County Land Use Ordinance provides as follows: Land Application of Manure (MN Rules ) 1. Manure and process wastewater land application must conform to MN Rules a. Must not result in a discharge to waters of the state during the application process, except that manure and process wastewater application is allowed onto seasonally saturated soils that are seeded to annual farm crops or crop rotations of perennial grasses or legumes; or b. Must not cause pollution of waters of the state due to manure-contaminated runoff. 2. Manure and process wastewater application into road ditches is prohibited. 3. All manure and process wastewater applications to land must meet the requirements of this part except where specifically exempted. 4. When ownership of manure or process wastewater is transferred from an animal feedlot with capacity of 300 or more animal units or a manure storage area capable of holding the manure produced by 300 or more animal units for application to land not owned or leased by the owner of the animal feedlot or the manure storage area, any person receiving the manure or the process waste water shall: a. comply with the manure management plan completed by the owner of the animal feedlot where the manure or process wastewater was produced; and b. complete the manure management plan requirements in subpart 4, item D, except for provisions that were completed by the owner of the animal feedlot where the manure or process wastewater was produced. 5. Surface Manure Application Setbacks to Sensitive Areas All manure and process wastewater applied within 300 feet of sensitive areas must be injected or incorporated within 24 hours of application. Sensitive areas include surface waters, waterways, rights-of-way, and open tile intakes. Irrigation: Manure and process wastewater application by a traveling gun, center pivot, or other irrigation equipment is not permitted. Top water with less than 15pounds of nitrogen per 1,000 gallons may be applied to standing crops. Tests shall be taken at any time as requested by the County Feedlot Officer. E. Other methods of manure utilization. If the project will utilize manure other than by land application, please describe the methods. None. SLT Cattle Company Ted s Place Environmental Assessment Lismore Township, Minnesota 14 Worksheet
16 6. Air/odor emissions. A. Identify the major sources of air or odor emissions from this feedlot. The surfaces of the barns that come into contact with animals and manure, especially floors, are sources of odor. The animals themselves are also sources of odor. The manure collection and storage facilities, the dead animal disposal and storage areas, and the manure application fields are also significant sources of odor. Dust generated by truck traffic around the site can also contribute as a carrier of odor. B. Describe any proposed feedlot design features or air or odor emission mitigation measures to be implemented to avoid or minimize potential adverse impacts and discuss their anticipated effectiveness. The facility is a total confinement facility; thus odors are mitigated by reducing the surface area of manure exposed to the atmosphere. Odor management practices are outlined in an MPCA-approved Odor Management Plan. The proposer will maintain clean, dry floors, eliminate manure buildup, and clean up any spilled feed. Liquid manure will all be injected immediately into soil to minimize the release of odors by eliminating contact with the atmosphere. Required setbacks will be observed from nearby residences for manure application. Weather conditions, primarily wind speed/direction and humidity, will be evaluated before manure is land applied to insure minimal impacts on neighbors and the public. Feedlot odors will still be present at the facility; however, the proposed design features and management will help mitigate these odors. C. Provide a summary of the results of an air emissions modeling study designed to compare predicted emissions at the property boundaries with state standards, health risk values, or odor threshold concentrations. The modeling must incorporate an appropriate background concentration for hydrogen sulfide to account for potential cumulative air quality impacts. Air quality modeling estimated the atmospheric concentrations of hydrogen sulfide, ammonia, and selected odorous gases at the property lines for the proposed SLT Cattle Company and at 20 of the proposed feedlot s nearest neighbors. A complete report of the air quality modeling findings is found in Attachment I. The CALPUFF modeling results suggest that the expanded SLT Cattle Company feedlot will comply with the Minnesota ambient air quality standard for hydrogen sulfide. CALPUFF predicted a maximum hourly property-line hydrogen sulfide concentration of 6.31 parts per billion (ppb) (v/v). When a background concentration of 17 ppb is added to the CALPUFF prediction, the maximum property-line hydrogen sulfide concentration is ppb, which is below the ambient standard of 30 ppb. The CALPUFF results indicate that the expanded SLT Cattle Company will not create exceedences of the subchronic hydrogen sulfide inhalation health risk value (ihrv) at the neighboring residences. The estimated maximum 13-week time-averaged hydrogen sulfide concentration for the feedlot s neighbors is 1.17 micrograms per cubic meter (µg/m 3 ). When a background concentration of 1.00 µg/m 3 is added to the CALPUFF estimate, the maximum 13-week neighbor hydrogen sulfide concentration is 2.17 µg/m 3, which is below the subchronic hydrogen sulfide ihrv of 10 µg/m 3. The modeling results suggest that the expanded SLT Cattle Company will not create exceedences of the acute ammonia ihrv. CALPUFF predicted a maximum hourly property-line ammonia concentration of 598 µg/m 3. When a background concentration of 148 µg/m 3 is added to the CALPUFF prediction, the maximum property-line ammonia concentration is 746 µg/m 3, which is below the acute ammonia ihrv of 3,200 µg/m 3. The CALPUFF results also indicate that the expanded SLT Cattle Company will not create exceedences of the chronic ammonia ihrv at the neighboring residences. The estimated maximum one-year time-averaged ammonia concentration for the feedlot s neighbors is µg/m 3. When a background ammonia concentration of 5.72 µg/m 3 is added to the CALPUFF estimate, the maximum annual ammonia concentration for a neighbor is µg/m 3, which is below the chronic ammonia ihrv of 80 µg/m 3. SLT Cattle Company Ted s Place Environmental Assessment Lismore Township, Minnesota 15 Worksheet
17 Proposed Site Hydrogen Sulfide Results (ppb) 8 Acute Ammonia Results (µg/m 3 ) 9 Odor Results 14 North ppb 356 µg/m 3 44 µg/m 3 South ppb 746 µg/m 3 57 µg/m 3 East ppb 323 µg/m 3 38 µg/m 3 West ppb 303 µg/m 3 26 µg/m 3 shown are with an additional background concentration. *All values *See Attachment E for a more complete discussion of modeled odor impacts. In summary, the CALPUFF modeling results suggest that the proposed SLT Cattle Company will comply with the ambient air quality standard for hydrogen sulfide. The CALPUFF results also suggest that the proposed feedlot will not create exceedences of the subchronic ihrv for hydrogen sulfide, the acute ihrv for ammonia, and the chronic ihrv for ammonia. D. Describe any plans to notify neighbors of operational events (such as manure storage agitation and pumpout) that may result in higher-than-usual levels of air or odor emissions. There are nine residences and five other feedlots located within one mile of the facility. The producers do not plan to notify neighbors prior to operational events such as manure storage, agitation, pump out or application, but they are willing to work around planned social events. The County Feedlot Officer will be notified prior to operational events such as manure agitation and land application. E. Noise and dust. Describe sources, characteristics, duration, quantities or intensity and any proposed measures to mitigate adverse impacts. The loudest noise generated at the facility is due, almost exclusively, to truck traffic entering and leaving the site. Additional noise will also be generated at the residents along the roads used by traffic servicing the Project site. The nearest neighbors are within one-half mile and the separation distance is primary mitigating factor in reducing the potential for adverse impacts from this Project. 7. Dead Animal Disposal Describe the quantities of dead animals anticipated, the method for storing and disposing of carcasses, and frequency of disposal. A 12-foot by 12-foot mortality disposal box will be constructed on the proposed Project site. The disposal area will be constructed of ten-inch tongue and groove polyvinyl chloride paneling. A swinging door with latch will provide access to the box and security from scavengers. The floor of the disposal area will be 14 Odor impact assessment based on odor units. A value of 72 odor units is considered to be a faint odor detectable by most people. SLT Cattle Company Ted s Place Environmental Assessment Lismore Township, Minnesota 16 Worksheet
18 compacted clay. The area surrounding the mortality box will be seeded to grass. Mortalities are removed as discovered from the barns. A rendering company that services livestock producers will be utilized to pick up mortalities on a per call basis. Rendering service is expected to be reliable and timely. The predicted annual mortality rate is approximately 30 head of dairy calves, 14 head of dairy heifers, and 20 head of finishing cattle each year from the entire Project site. In the event of a catastrophic loss, the Proposer will work with the MPCA and the Minnesota Animal Board of Health to properly dispose of the animals. 8. Surface Water Runoff. Compare the quantity and quality of site runoff before and after the project. Describe permanent controls to manage or treat runoff. Livestock Production Site Surface water runoff will increase on the proposed expansion site due to an increase in impervious surfaces, in particular the construction of roofed buildings. However, because the proposed Project is a total confinement facility, it is unlikely that this runoff will come in contact with livestock or manure. A stormwater retention area has been constructed to slow the release of rainwater to the surrounding hydrologic system. Water falling on the finishing barn will be routed to the stormwater retention areas or into the under-barn liquid manure pits. Surface water falling on the roadways will be allowed to infiltrate into the soils on site or to area cropland. The contractor and engineer will be responsible for managing surface-water runoff during construction. Land Application Sites The land application of manure, if improperly applied, can adversely impact surface water resources through manure-laden runoff or manure residue leaching into drain tile lines that outfall to surface waters. The Project contains land application areas that are located within the Rock River watershed and more specifically, the Elk Creek, Kanaranzi Creek, and Champepadan Creek subwatersheds. The watershed has been farmed for several decades. The change in stormwater runoff characteristics (physically and chemically) from the Project land application areas is expected to remain the same and under certain circumstances, improve as a result of the land application activities regulated under the MPCA NPDES/SDS Permit. The improvements would occur through developing better soil tilth 15 from organic fertilizer and the uniform practice of incorporating manure over the acres identified in the MMP. The potential impact to surface water resources from the Project s land application activities is not expected to create a significant impact because as discussed in Item 5 of the EAW, manure will be applied on the soil at agronomic rates. This means that only the amount of manure that can be used by the growing crop as nutrients will be applied. The agronomic rate is based on the type of crop grown, the soil type and the soil fertility. 15 Good tilth is a sign of healthy soil organisms. While digesting organic material, bacteria secrete gum and slime-like matter in the soil. This works like glue, binding soil particles and humus together to form aggregates. The aggregates are crumb-like and allow for good air circulation and water drainage in the soil. Well-aggregated soil is regarded as having good tilth. The addition of organic material will feed micro-organisms and, thus, improve tilth. (retrieved May 2, 2007). SLT Cattle Company Ted s Place Environmental Assessment Lismore Township, Minnesota 17 Worksheet
19 9. Traffic and Public Infrastructure Impacts. A. Estimate the number of heavy truck trips generated per week and describes their routing over local roads. Describe any road improvements to be made. The township road servicing the Project site (210 th Street) is expected to bear the largest impact of increased traffic. A feed truck will be visiting the site once per week to restock the commodity shed. The truck will travel along U.S. Highway 91 before heading west on 210 th Street to access the site. Approximately every two weeks, three semi-trucks with trailers will unload feeder calves to restock empty barns. These trucks will utilize U.S. Highway 91. Approximately every two-three weeks, five semi trucks with trailers will load up the finished cattle and or dairy heifers for market. These trucks will utilize 210 th Street to U.S. Highway 91 to Interstate 90. A table outlining the projected increases of traffic levels is shown below. An increase of 0.1 percent is expected on U.S. Highway 14 and State Highway 91. The most significant traffic impacts are expected to take place during the fall while liquid manure is being removed from the site. Liquid manure is removed with a portable chopper pump into a slurry wagon or semi-tractor with a tanker to haul to the field. The slurry wagon would have a knife injection system with disc coulters. The spreader is calibrated by the volume of the tanker (9,500 gallons) times 90 percent and is divided by the area covered (length times width); typically one round is made (2.18 acres) resulting in an application rate close to 4,000 gallons/acre. The tractor is equipped with a light bar and GPS to track to swath of the application and thus record what has been applied to ensure no overlap occurs. It typically takes three days per barn to apply the manure. The tanker is estimated at 15,000 pounds gross weight, and full it weighs about 90,000 pounds (four axles). The liquid manure is hauled only once per year in the fall. Solid manure is hauled in a Knight 8150 box spreader with a ton capacity. The solid manure is spread one time per month, averaging about 20 ten-ton loads (high bedding, low moisture). The manure is spread on any of the fields listed in the MMP. The Project proposer has agreed to follow all applicable road postings. See Attachment N for details of local roads and ratings to be used by the proposed Project. It was also noted that the additional traffic volume from the Project will not be an impact to the normal road use. However, adverse impacts to road surfaces can result from traffic loads that exceed local road postings. 16 The Project proposer is required to follow all local weight restrictions and consideration will be given towards proper load limits and routes for all vehicles. If the Project proposer is found to be responsible for damages to road surfaces, he can be held liable. No road improvements are necessary or planned for the proposed Project. B. Will new or expanded utilities, roads, other infrastructure, or public services be required to serve the project? Yes No 16 from Nobles County Highway Engineer, Stephen Schnieder, to project consultant, Andrew Nesseth, on June 5, 2009, from Mark Scheidel, Minnesota Department of Transportation/Mankato Office, to project consultant Andrew Nesseth, noting that based on the proposed traffic load, no adverse impacts are considered likely. SLT Cattle Company Ted s Place Environmental Assessment Lismore Township, Minnesota 18 Worksheet
20 10. Permits and approvals required. Mark required permits and give status of application: Unit of government Type of Application Status MPCA NPDES/SDS Permit Pending MPCA NPDES/SDS Construction Stormwater Permit MPCA Notification/Status Change for Underground Storage Tanks County/twp/city Conditional use or other land use permit Pending DNR Water Appropriation Pending Other* *(List any other approvals required along with the unit of government, type of approval needed, and status of approval process.) 11. Other potential environmental impacts, including cumulative impacts. If the project may cause any adverse environmental impacts not addressed by items 1 to 10, identify and discuss them here, along with any proposed mitigation. This includes any cumulative impacts caused by the project in combination with other existing, proposed, and reasonably foreseeable future projects that may interact with the project described in this EAW in such a way as to cause cumulative impacts. Examples of cumulative impacts to consider include air quality, stormwater volume or quality, and surface water quality. The MPCA is required to inquire whether a proposed project, which may not individually have the potential to cause significant environmental effects, could have a significant effect when considered along with other projects. This type of impact is known as a cumulative potential effect. In order to assess the proposed Project s cumulative potential effects of related or anticipated future projects, the MPCA conducted an analysis that addressed other projects or operations in context to the potential direct or indirect impacts of the proposed Project that: (1) are already in existence or planned for the future; (2) are located in the surrounding area; and (3) might reasonably be expected to affect the same natural resources. The following is a review of the analysis conducted to determine if the proposed Project would contribute to an adverse cumulative potential effect. The Project consultant reviewed existing public data to identify the number of feedlots and other projects within the same subwatersheds of the proposed Project. The public data reviewed included the most recent MPCA feedlot registration database and related project or permit databases for other operations that may hold an air quality, water quality, hazardous waste, or solid waste permit. A total of 190 livestock operations, representing 67,179.8 animal units are located in the same minor watersheds as the proposed Project and or land application sites associated with the Project (see Attachment L). The proposed Project represents a 1.4 percent increase in animal units in the affected area. Lastly, the MPCA reviewed the proposed and existing projects to determine whether collectively they might reasonably be expected to affect the same natural resources. The natural resources of concern included groundwater, surface waters, air quality, and land use. The following is a brief discussion of each. Water Resources Water resources include the waters found on the surface and below the ground. This Project will utilize groundwater resources as a potable water source for livestock production. Land application of livestock waste has the potential to impact both surface and groundwater resources if conducted without regard to agronomic rate. SLT Cattle Company Ted s Place Environmental Assessment Lismore Township, Minnesota 19 Worksheet
21 1. Groundwater There are three areas of concern related to groundwater. Contamination from manure storage structures, contamination from land application, and effects on water supply from increased demand. To protect groundwater, the Project proposer is required to follow the design criteria in Minn. R. ch for the construction of the liquid manure storage structures for the cattle manure and the land application of the manure. The proposed plans and specifications for the manure storage pits, the design and operation of the open lots, and the MMP for the land application of the manure have been reviewed and approved by MPCA staff, and will be enforceable conditions of the Project s feedlot NPDES/SDS Permit. The soil type and depth to bedrock were considered as factors in the review to determine groundwater sensitivity and pollutant impacts. The designation reflects the surfical geology of the area, which is, in this case, primarily glacial till. No known karst topography exists within the vicinity of Project site or the manure application sites. The producer is required to follow an MPCA-approved MMP and submit an annual report to the MPCA on manure production, land application, and any discharges. The approved MMP is an enforceable part the project s NPDES/SDS Permit. The proposed expansion is not expected to adversely impact groundwater from land application of manure. The existing groundwater use is commercial with an assumed average consumption rate of eight gallons per head of cattle per day. As previously discussed in Item 4.A., the Project is designed to consume 9,899,100 million gallons of water a year, for a total of million gallons over the 25-year service life of the proposed facility. A review of published geologic and hydrogeologic data indicates that the water-bearing characteristics of the surficial aquifer (including recharge) and the nature of its existing use as a groundwater source, water use for this Project is not expected to interfere with other groundwater users. The proposed Project will be required to obtain a Water Appropriation Permit from the DNR. The purpose of the permit program is to ensure water resources are managed so that adequate supply is provided to long-range seasonal requirements for domestic, agricultural, fish and wildlife, recreational, power, navigational, and quality control. The program exists to balance competing management objectives, including both the development and protection of water resources. The proposed Project is not expected to contribute to an adverse or irreversible cumulative potential impact of groundwater resources. 2. Surface Water Impacts Total Maximum Daily Load (TMDL) a) Rock River Watershed Fecal Coliform and Turbidity The Rock River Watershed has an approved TMDL for multiple reaches for both turbidity and fecal coliform bacteria, which encompasses the entire watershed. The proposed site and manure application sites are located in the Elk Creek and Champepadan Creek subwatersheds, both of which are included in the TMDL. The TMDL report estimates a needed total suspended solids reduction of approximately 27 percent to 68 percent, with the higher reductions needed in higher flow periods. Turbidity levels during mid-range and low flows are at or near the water quality standard. The Rock River TMDL Report identified the primary sources of turbidity to be soil erosion in the riparian zone from livestock, stream bank erosion/slumping, upland soil loss from row cropland and algae growth. Fecal coliform bacteria exceed the water quality standard during August and September and require up to a 60 percent reduction to remove the impairment. Dominant sources of bacteria were cattle with stream access, feedlots without runoff controls, improperly applied manure, and nonfunctioning septic systems. An SLT Cattle Company Ted s Place Environmental Assessment Lismore Township, Minnesota 20 Worksheet
22 implementation plan has been approved for this TMDL project where manure management, installation of conservation practices, monitoring, and education have been identified as potential actions to be completed to address the impairments. b) Kanaranzi Creek Watershed E. coli bacteria and Turbidity The 2010 Draft TMDL List includes three listings in the Kanaranzi Creek Watershed, two listings for E.coli bacteria, and one listing for turbidity. Several of the proposed manure application sites are located in this impaired watershed. It should be noted that improper manure application could affect bacteria levels in the impaired reaches. A TMDL project is slated to begin in 2011 with additional data collection. Topeka shiners (Notropis Topeka) c) Topeka shiners are found in the Missouri River drainage; therefore, their presence in Minnesota is limited to the extreme southwestern portions of the state, which includes the Rock River. Topeka shiners prefer prairie stream headwater areas because these smaller streams tend to have cooler temperatures and good water quality. Topeka shiners, however, occupy a variety of habitats, including runs, pools, and backwater areas of various river orders. Larger rivers, although not the primary staging and resting areas for Topeka shiners, serve as critical migration routes that allow the exchange of genetic material and repopulation of areas that periodically run dry. An important characteristic of good quality Topeka shiner habitat is the availability of clean gravel or sand substrates with vegetated banks of grasses and forbs. High turbidity levels in the Rock River are associated with higher turbidity levels in the tributaries. As a result, increased sedimentation has occurred and Topeka shiner habitat has become more limited. Declines in Topeka shiner numbers have occurred throughout nearly all of its range thus it is listed as an Endangered Species. The Minnesota population of Topeka shiners is in better condition than those found in other states. An examination of watershed-level activities points to a variety of conclusions about why the species has declined. The TMDLs for turbidity contained in the Rock River Watershed TMDL Report, when achieved, will help maintain and improve spawning habitat for the Topeka shiner in the Rock River. All livestock will be housed in a total confinement building and will not have access to streambanks. Liquid manure will be stored in beneath-barn concrete pits that were designed by a Professional Engineer and approved by the MPCA. Solid manure will be stored in a manure pack on a concrete floor until land applied. The Project site itself is required by the NPDES/SDS Permit to meet a zero discharge standard. The MMP calls for all manure to be applied at nitrogen-based agronomic rates. Cropland is required to be sampled and tested for soil phosphorus levels once every four years. If soil phosphorus levels reach very high levels (120 ppm Olson, 150 ppm Bray) the MMP must by modified to prevent additional buildup of soil phosphorus. Additionally, the MMP calls for liquid manure to be injected into the soil profile at the time of application during the fall months, which will reduce the potential for fecal coliform bacteria to be transported to surface waters via surface runoff. The majority of solid manure will be applied in the winter months on the soil surface. Applicable setbacks from sensitive features help prevent nutrient transport to nearby surface waters and exposure to harsh temperatures and UV radiation helps to destroy fecal coliform bacteria. The MMP is an enforceable part of the NPDES/SDS Permit. If a spill or release occurs, the Project proposers will be required to ensure remediation occurs. These requirements have been included in the Emergency Response Plan and will be enforceable conditions of the Project s NPDES/SDS Feedlot Permit. SLT Cattle Company Ted s Place Environmental Assessment Lismore Township, Minnesota 21 Worksheet
23 Land The land identified for the purpose of this Project includes the site of the proposer s Project, along with the land application acreage available. Two issues have been identified with respect to land resources wildlife habitat and row crop agriculture. 1. Habitat All the land to be used for the proposed expansion is currently open agricultural land that offers limited protection, food, or cover for wildlife. Therefore, no additional impacts are expected as a result of this Project. 2. Row Crop Agriculture The Project is designed to primarily utilize existing row crop feedstock. As a result, new and existing row crop agriculture is not expected to create an additional new impact to environmental quality as it pertains to local water quality.. Air Quality The Project has been evaluated for regulated pollutants (e.g., hydrogen sulfide, odor, and ammonia) and accounted for other off-site sources through the use of a background concentration. 1. Regulated Pollutants Air quality computer modeling was performed that estimated concentrations in the air of hydrogen sulfide, ammonia, and selected odorous gases from the proposed Project. The model estimated pollutant concentrations from the proposed Project, along with an ambient hydrogen sulfide and ammonia background concentration, to account for any off-site air emission sources or activities. The air quality modeling evaluation predicted concentrations of the selected gases at the proposed Project property lines and nearest neighbors. A background concentration is the amount of pollutants already in the air from other sources and is used in this evaluation to address cumulative air impacts. Hydrogen sulfide and ammonia may be present from other feedlot barns or the agitation and pump out of a neighboring feedlot. Air emissions from other emission sources may affect the compliance status of the proposed facility, or impact downwind human and environmental receptors. The background level for hydrogen sulfide that was used in the computer model was derived from monitoring at other feedlot facilities in Minnesota. The modeling adds the background air pollutant concentration to the emission concentration predicted from the proposed Project. Traffic The cumulative potential effects analysis for traffic included an evaluation for the direct contribution of new traffic through the development and operation of the proposed Project in context to the existing traffic load. The direct impact analysis is provided in Item 9.A of the EAW. According to the Nobles County Highway Department, the additional traffic identified in Item 9.A is not considered to be a significant contribution to existing traffic load. However, extensive manure hauling operations utilizing CSAH 19 could adversely affect the condition of the roadway, which, at present, is not in good condition. Other than this roadway, the Project does not present an adverse cumulative potential effect, provided that all load restrictions are abided by received from Stephen Schnieder, P.E. Nobles County Highway Department on June 5, SLT Cattle Company Ted s Place Environmental Assessment Lismore Township, Minnesota 22 Worksheet
24
25 ATTACHMENT A
26 Attachment A1

27 ATTACHMENT B
28 ATTACHMENT C
29 ATTACHMENT D
30 ATTACHMENT E

31 Minnesota Department of Natural Resources Division of Ecological Resources, Box Lafayette Road ATTACHMENT F Phone: (651) Fax: (651) heidi.cyr@dnr.state.mn.us April 2, 2009 Correspondence # ERDB Mr. Andrew Nesseth Extended Ag Services, Inc. 507 Milwaukee St. Lakefield, MN St. Paul, Minnesota RE: Natural Heritage information in the vicinity of the proposed SLT Bullerman-Ted s County Township (N) Range (W) Section(s) Nobles , 23, 25, 35, , Dear Mr. Nesseth, , 36 As requested, the Minnesota Natural Heritage Information System has been queried to determine if any rare species or other significant natural features are known to occur within an approximate one-mile radius of the proposed project. Based on this query, several rare features have been documented within the search area (for details, see the enclosed database reports; please visit the Rare Species Guide at for more information on the biology, habitat use, and conservation measures of these rare species). Please note that the following rare features may be impacted by the proposed project: Elk Creek and Kanaranzi Creek are federally designated as critical habitat for the Topeka shiner (Notropis topeka), a federally-listed endangered and state-listed special concern fish species. Topeka shiners are adversely impacted by actions that alter stream hydrology or decrease water quality, including sedimentation and eutrophication. If applicable, steps should be taken to ensure that nutrient-rich runoff to this river does not occur. The Natural Heritage Information System (NHIS), a collection of databases that contains information about Minnesota s rare natural features, is maintained by the Division of Ecological Resources, Department of Natural Resources. The NHIS is continually updated as new information becomes available, and is the most complete source of data on Minnesota's rare or otherwise significant species, native plant communities, and other natural features. However, the NHIS is not an exhaustive inventory and thus does not represent all of the occurrences of rare features within the state. Therefore, ecologically significant features for which we have no records may exist within the project area. The enclosed results include an Index Report and a Detailed Report of records in the Rare Features Database, the main database of the NHIS. To control the release of specific location information, which might result in the destruction of a rare feature, both reports are copyrighted. The Index Report provides rare feature locations only to the nearest section, and may be reprinted, unaltered, in an environmental review document (e.g., EAW or EIS), municipal natural resource plan, or report compiled by your company for the project listed above. If you wish to reproduce the index report for any other purpose, please contact me to request written permission. The Detailed Report is for your personal use only as it may include specific location information that is considered nonpublic data under Minnesota Statutes, section , subd. 2. If you wish to reprint or publish the Detailed Report for any purpose, please contact me to request written permission.
32 This letter does not constitute review or approval by the Department of Natural Resources as a whole. Instead, it identifies issues regarding known occurrences of rare features and potential effects to these rare features. Additional rare features for which we have no data may be present in the project area, or there may be other natural resource concerns associated with the proposed project. For these concerns, please contact your DNR Regional Environmental Assessment Ecologist, Kevin Mixon, at (507) Please be aware that additional site assessments or review may be required. Thank you for consulting us on this matter, and for your interest in preserving Minnesota's rare natural resources. An invoice will be mailed to you under separate cover. Sincerely, Heidi Cyr Endangered Species Environmental Review Specialist enc. Rare Features Database: Index Report Rare Features Database: Detail Report Rare Features Database Reports: An Explanation of Fields Fact sheets: Topeka Shiner (Notropis topeka) Client ID # 19
33 Attachment G No document - skipped
34 Archaeological Site Locations ATTACHMENT H Site Number Site Name Twp. Range Sec. Quarter Sections Acres Phase Site Description Tradition Context Reports NR CEF DOE County: Nobles 21NO SW-SE-SE-SE 0.1 SA MULT Thursday, March 12, 2009 Page 1 of 1
35 Andrew Nesseth From: Sent: To: Subject: Attachments: Cinadr, Thomas Thursday, March 12, :42 AM 'Andrew Nesseth' RE: MNHS review for EAW Archaeology.rtf THIS IS NOT A PROJECT CLEARANCE. 1
36 Tom Cinadr Survey and Information Management Coordinator Minnesota State Historic Preservation Office Minnesota Historical Society 345 Kellogg Boulevard West St. Paul, MN From: Andrew Nesseth Sent: Tuesday, March 10, :38 PM To: Cinadr, Thomas Cc: 'Andrew Nesseth' Subject: MNHS review for EAW Tom, I would like to request a search for any archeological sites or cultural resources within a two mile radius of an existing cattle confinement feedlot that is located in Nobles County (T102N, R43W, 25) Lismore 25, SE1/4. See below for project details: Site location & description: An existing feedlot will convert open lots to a total confinement building. The site will house 2500 head of finishing cattle, 600 head of dairy heifers and 600 head of dairy calves. All manure generated by the finishing cattle will be stored in 12-ft deep concrete pits and all manure generated by the heifers and calves will be stored in a manure pack onto of a solid concrete floor. Liquid manure will be applied to land that is currently in commodity production continuous corn via soil injection and the solid manure will be applied on the surface will some incorporation. Manure Application Sites: The manure would be applied at agronomic rates on predominately clay loam and silty clay loam soils. We will recommend best management practices for applying manure by following all proper & mandatory setbacks to sensitive features. All land is soil tested every 2 years. Deep nitrate testing is conducted on selected acres. Township Range Legal Description Acres 104N 43W Leota 24, SE1/ N 42W Larkin 7, NW1/ N 43W Lismore 13, NW1/ N 43W Lismore 23, S1/ N 43W Lismore 25, S1/ N 43W Lismore 31, N1/2 of NE1/ N 43W Lismore 36, N1/ N 43W Lismore 35, SE1/ N 43W Westside 1, SE1/4 of SE1/ N 43W Westside 26, N1/2 of SW1/4 & S1/2 of NW1/ N 42W Olney 29, S1/2 of NW1/ Thank you, in advance, for your assistance. If you have any questions, please feel free to get a hold of me. Andrew Nesseth Extended Ag Services, Inc

37 This and any attachments may contain privileged or confidential information. This is intended solely for the use of the individual or entity to which it is addressed. If you are not the intended recipient of this , you are hereby notified that any copying, distribution, dissemination or action taken in relation to the contents of this and any of its attachments is strictly prohibited and may be unlawful. If you have received this in error, please notify the sender immediately and permanently delete the original and destroy any copies, printouts or attachments. 3

38 ATTACHMENT I Air Quality Modeling Report SLT Cattle Company Proposed Cattle Feedlot Expansion Nobles County Lismore Township S Section 25 Prepared by Charles J. Gantzer, Ph.D. Barr Engineering Company 4700 West 77th Street Minneapolis, MN June 2009
39 Table of Contents Introduction... 1 General Modeling Approach... 3 Impact Thresholds and Background Values... 4 Source Characterizations... 6 Neighboring Residences... 8 Site Descriptions Expanded SLTCC Cattle Feedlot Feedlot # Feedlot # Feedlot # Feedlot # Feedlot # Feedlot # Feedlot # Gas Emission Rates Cattle Barns Dairy Barns Calf Barns Hog Finishing Barns Hog Gestation Barn Open Cattle and Dairy Lots Dairy Manure Basins Hog Manure Basin Runoff Basins... 22
40 Hydrogen Sulfide at Property Lines and Neighbors Ammonia at Property Lines and Neighbors Odorous Gas Concentrations at Property Lines and Neighbors Odor Intensities at Property Lines and Neighbors Summary... 27
41 Introduction SLT Cattle Company (SLTCC) proposes to expand its cattle feedlot located in the S of Section 25, Lismore Township, Nobles County. The proposed expansion would add two 400-head deep-pitted cattle barns to the feedlot. Based on a protocol approved by the Minnesota Pollution Control Agency (MPCA) on June 19, 2009, air quality modeling estimated the hydrogen sulfide concentrations, ammonia concentrations, and odor intensities at the property lines for the expanded SLTCC cattle feedlot and at 20 of the expanded feedlot s nearest neighbors. In addition to the emissions from the SLTCC feedlot, the modeling also considered the gaseous emissions from seven neighboring feedlots. The locations of the SLTCC feedlot and the neighboring feedlots are provided in Figure 1. The following atmospheric concentrations were calculated: 1. the maximum hourly hydrogen sulfide concentration at the property lines for the expanded SLTCC feedlot to assess the potential to comply with Minnesota s ambient air quality standard for hydrogen sulfide of 30 ppb (v/v); 2. the maximum 13-week time-averaged hydrogen sulfide concentration at 20 of the expanded feedlot s nearest neighbors to assess the potential to exceed Minnesota s subchronic inhalation Health Risk Value (ihrv) for hydrogen sulfide of 10 g/m 3 ; 3. the maximum hourly ammonia concentration at the property lines for the expanded SLTCC feedlot to assess the potential to exceed Minnesota s acute ihrv for ammonia of 3,200 g/m 3 ; 4. the maximum annual ammonia concentration at 20 of the expanded feedlot s nearest neighbors to assess the potential to exceed Minnesota s chronic ihrv for ammonia of 80 g/m 3 ; and 5. the maximum hourly odor intensities at the property lines for the expanded SLTCC feedlot and at 20 of the expanded feedlot s nearest neighbors to access the potential for off-site odor episodes. The above concentrations were estimated using the CALPUFF air quality model, based on 5 years of historical meteorological data. The modeling results suggest that the expanded SLTCC feedlot will comply with the Minnesota ambient air quality standard for hydrogen sulfide. CALPUFF predicted a maximum hourly propertyline hydrogen sulfide concentration of 6.31 ppb. When a background concentration of 17 ppb is added to the CALPUFF prediction, the maximum property-line hydrogen sulfide concentration is ppb, which is below the ambient standard of 30 ppb. Thus, no violation of the 30-ppb ambient hydrogen sulfide standard was modeled for the expanded SLTCC feedlot. The CALPUFF results indicate that the expanded SLTCC feedlot and the seven neighboring feedlots will not create exceedences of the subchronic hydrogen sulfide ihrv at the neighboring residences. The estimated maximum 13-week hydrogen sulfide concentration for the neighboring residences is 1.17 g/m 3. When a background concentration of 1.00 g/m 3 is added to the CALPUFF estimate, the maximum 13-week neighbor hydrogen sulfide concentration is 2.17 g/m 3, which is below the subchronic hydrogen sulfide ihrv of 10 g/m 3. 1 SLTCC Cattle Feedlot Report
42 Figure 1. Modeled locations of the SLTCC cattle feedlot, the seven neighboring feedlots, and the 20 nearest neighboring residences (not labeled). 2 SLTCC Cattle Feedlot Report
43 The modeling results suggest that the expanded SLTCC feedlot will not create exceedences of the acute ammonia ihrv. CALPUFF predicted a maximum hourly property-line ammonia concentration of 598 g/m 3. When a background concentration of 148 g/m 3 is added to the CALPUFF prediction, the maximum property-line ammonia concentration is 746 g/m 3, which is below the acute ammonia ihrv of 3,200 g/m 3. The CALPUFF results indicate that the expanded SLTCC feedlot and the seven neighboring feedlots will not create exceedences of the chronic ammonia ihrv at the neighboring residences. The estimated maximum annual ammonia concentration for the neighbors is g/m 3. When a background ammonia concentration of 5.72 g/m 3 is added to the CALPUFF estimate, the maximum annual ammonia concentration for a neighboring residence is g/m 3, which is below the chronic ammonia ihrv of 80 g/m 3. Thus, the modeling results for the expanded SLTCC feedlot suggest compliance with the hydrogen sulfide air quality standard, no exceedences of the subchronic hydrogen sulfide ihrv, and no exceedences of the acute and chronic ammonia ihrvs. General Modeling Approach The modeling approach assumed that the gaseous emissions from the expanded SLTCC feedlot and the seven neighboring feedlots are the only significant and quantifiable emission sources within a 3-mile by 3-mile grid. The air quality impacts associated with the eight feedlots were explicitly modeled. The air quality impacts associated with any other sources in the modeled 3-mile by 3-mile grid were considered implicitly as contributors to the background concentrations that are added to the modeling results. Hence, the background concentrations of hydrogen sulfide and ammonia include the impacts associated with sources such as small feedlots (e.g., less than 50 animal units), septic tank vents, fertilizer and manure application to cropland, and wetlands. The CALPUFF (version 6.262, level ) air quality model 1, 2, 3 was used to estimate the property-line and nearest-neighbor odorous gas concentrations. CALPUFF was selected, because of its ability to account for calm wind conditions. The estimated concentrations were based on historical wind speeds, wind directions, atmospheric stabilities, and rural mixing heights. The historical weather data consisted of five years ( ) of surface meteorological data from the National Weather Service (NWS) station in Sioux Falls, SD and of upper air data from the NWS station in Huron, SD. The surface and upper air weather data files were combined into an ISCtype meteorological file by the U.S. Environmental Protection Agency s (EPA s) PCRAMMET software. 4 The surface and upper air weather data sets were obtained from the EPA s Support Center for Regulatory Air Models. 5 Maximum hourly, 13-week, and annual average concentrations were calculated. Rural dispersion coefficients were used to characterize atmospheric U.S. EPA A User s Guide for the CALPUFF Dispersion Model. U.S. Environmental Protection Agency, Office of Air Quality Planning and Standards, Research Triangle Park, NC, EPA-454/B Scire J. S., Strimaitis D. G., and Yamarino R. J A User s Guide for the CALPUFF Dispersion Model (Version 5). Earth Tech, Inc., Concord, MA. 496 pp. 3 U.S. EPA Revision to the Guideline for Air Quality Models. 40 CFR Ch. 1, Part 51, Appendix W (April 15, 2004 Edition). 4 U.S. EPA PCRAMMET User s Guide. U.S. Environmental Protection Agency, Office of Air Quality Planning and Standards, Research Triangle Park, NC. EPA-454-B (Revised June 1999) SLTCC Cattle Feedlot Report
44 mixing. The modeling assumed no decay of any modeled gas due to chemical reactions. The modeled receptor height was 0 meters, i.e., ground level. A flat terrain was assumed. All modeled property-line and nearest-neighbor receptors were defined as discrete receptors. Property-line receptors were less than or equal to 25 meters apart. An arbitrary Cartesian coordinate system (x, y) was used with the southwest corner of Section 25 (Lismore Township, Nobles County) as the origin (0, 0). Positive values of x represent distance east of the origin. Positive values of y represent distance north of the origin. Impact Thresholds and Background Values To assess the potential for environmental impacts, the atmospheric hydrogen sulfide concentrations, ammonia concentrations, and odor intensities generated by the air quality modeling were compared to air quality standards, inhalation Health Risk Values (ihrvs), published odor threshold concentrations, and an odor classification system based on detection-threshold odor intensities. The direct comparison of the model-generated concentrations to these environmental threshold concentrations does not consider the impact of different averaging times. EPA guidelines do not allow concentrations to be time averaged for time periods less than an hour. 6 This is important because the Minnesota ambient air quality standards for hydrogen sulfide are based on average concentrations over a 30-minute time period and because the published odor intensity correlations are often based on instantaneous measurements. For example, an hourly modelgenerated hydrogen sulfide concentration of 29 ppb (v/v) may contain a half-hour average concentration that exceeds the 30 ppb standard. Also, an odor intensity that an odor panelist may find to be merely detectable in a short-term field measurement could be annoying if present for an hour or longer. The background concentrations of hydrogen sulfide and ammonia provided in Table 1 were added to the CALPUFF estimated concentrations as described in EPA guidelines. 7 The listed concentrations represent background concentrations for rural Minnesota. The listed 17-ppb background hydrogen sulfide concentration is appropriate when assessing a feedlot s potential to comply with the 30-ppb standard. A background concentration of 18 ppb should be used when assessing the potential to comply with the 50-ppb hydrogen sulfide standard. The background concentrations listed in Table 1 are not the time-averaged concentrations obtained from monitoring. Instead, the listed concentrations reflect the monitored data expressed in the terms of the exceedence or violation condition for the corresponding ihrv guideline or ambient standard. For example, the background 208-ppb ammonia concentration for the acute ammonia ihrv represents the maximum hourly concentration that occurred within the entire length of monitoring. This is the appropriate interpretation of background for the acute ammonia ihrv, because the guidance is concerned with any potential exceedence of the ihrv. Also, the 17-ppb hydrogen sulfide background represents the third highest 30- minute concentration that occurred within any 5-day period. This is appropriate, because the ambient hydrogen sulfide standard defines a violation as the third exceedence of 30-ppb within any 5-day period. 6 U.S. EPA Revision to the Guideline for Air Quality Models. 40 CFR Ch. 1, Part 51, Appendix W. 7 Ibid. 4 SLTCC Cattle Feedlot Report
45 Table 1. Background concentrations for rural Minnesota. Pollutant Hourly Background Concentration Daily Background Concentration 13-Week Background Concentration Annual Background Concentration Hydrogen Sulfide 17 ppb (v/v) (24.3 g/m 3 ) Not Required 0.70 ppb (v/v) (1.00 g/m 3 ) Not Required Ammonia 208 ppb (v/v) (148 g/m 3 ) Not Required Not Required 8.07 ppb (v/v) (5.72 g/m 3 ) To assess the potential for odor episodes, the estimated atmospheric concentrations of hydrogen sulfide and ammonia were compared to the reported odor threshold concentration for each gas. The odor threshold concentration is defined as the gas-phase concentration at which 50 percent of the population can detect the gas s odor. For this presentation, odor number is defined as the ratio of the estimated atmospheric concentration for a specific odorous gas divided by its odor threshold concentration. An odor number equal to 1 suggests that 50 percent of the population can detect the estimated atmospheric concentration for a specific gas. An odor number greater than 1 suggests that more than 50 percent of the population can detect the gas, while a value less than 1 indicates that less than 50 percent of the population can detect the gas. Typically, an odor number below about 0.1 suggests that less than 1 percent of the population can detect the gas. 8 The odor threshold concentrations used in this assessment are presented in Table 2. Table 2. Odor threshold concentrations. 9 Odorous Gas Odor Threshold Concentration (ppb, v/v) Hydrogen Sulfide 3.7 Ammonia 1,500 8 Nagy G. Z The odor impact model. Journal of Air & Waste Management Association 41(10): Minnesota Environmental Quality Board A Summary of the Literature Related to the Social, Environmental, Economic and Health Effects: Volume 2. Generic Environmental Impact Statement on Animal Agriculture, Prepared by the University of Minnesota, September Table 2 presents the geometric mean of the lower and upper odor threshold concentrations obtained from this reference. 5 SLTCC Cattle Feedlot Report
46 As a second means of assessing potential odor impacts, the CALPUFF-generated odor intensities (expressed as detection-threshold odor units) were compared to the reference odor intensities provided in Table 3. An odor intensity of 83 detection-threshold odor units (OU) is defined as a faint odor and is the odor intensity that an average person might detect if attention is called to the odor, but the odor would not otherwise be noticed. 10 Table 3. Odor intensity classification. 11 Odor Intensity Number Odor Strength n-butanol Reference Solution (ppm) Detection-Threshold Odor Units (OU, D/T) 0 no odor very faint faint moderate 2, strong 6, very strong 20,250 2,140 Source Characterizations The modeled livestock barns were characterized as either line sources or volume sources using the approaches described in EPA air quality modeling documentation. 12 For barns with lengths greater than twice their width (aspect ratio greater than 2), the barn was represented as a line source, i.e., a line of separated square volume subsources. Barns with aspect ratios less than or equal to 2 were modeled as a square volume source. The runoff basins at Feedlot #2 and the manure storage basins at Feedlot #3, Feedlot #4, and Feedlot #7 were characterized as non-buoyant area sources. The runoff basins at Feedlot #2 and 10 Jacobson L. D. and Guo H Odor from feedlots setback estimation tool (OFFSET). In: Livestock and Poultry Odor Workshop II, Dept. of Biosystems & Agricultural Engineering, University of Minnesota, St. Paul, MN, 39 pp. 11 Jacobson L. D. et al Development of an odor rating system to estimate setback distances from animal feedlots: odor for feedlots setback estimation tool (OFFSET). Final Report. Prepared by the Department of Biosystems and Agricultural Engineering, University of Minnesota, St. Paul, MN. 26 pp. 12 U.S. EPA User s Guide for the Industrial Source Complex (ISC3) Dispersion Models. Volume II Description of Model Algorithms. U.S. Environmental Protection Agency, Office of Air Quality, Research Triangle Park, NC, EPA-454/B b. 6 SLTCC Cattle Feedlot Report
47 the hog manure basins at Feedlot #4 and Feedlot #7 were modeled as crust-free basins. The BASINODOR algorithms estimated hourly emission rates based on the water-phase concentration of the modeled gas, the estimated water temperature, and the recorded wind speed. BASINODOR uses EPA-recommended masstransfer algorithms to estimate emission rates. 13 The liquid-phase mass transfer coefficient in the BASINODOR algorithms were defined by modified Mackay-Yeun correlations, based on an examination of the data presented in Hedden (1982) 14 and Lunney (1983). 15 For the crust-covered dairy manure basin at Feedlot #3, the overall mass transfer coefficients were adjusted to account for the presence of a crust. The crust was assumed to prevent the windinduced mixing of the liquid surface and to consist of a 1-inch thick dry crust. The crust was also assumed to reduce the gas-phase mass transfer coefficient. No chemical or biological reactions were assumed to occur within the crust. The modeled effectiveness of a 1-inch thick dry crust in reducing emissions is provided in Figure 2. Percent Reduction in Emission Rate Wind Speed (mph) Hydrogen Sulfide Ammonia n-butyric Acid Figure 2. Modeled percent reduction in emission rates from a crust-covered basin compared to a crust-free basin. The gasspecific responses to wind speed are due to differences in the Henry s Law coefficients and diffusion coefficients for the three gases. A uniform temperature of 20 C (68 F) is assumed. 13 U.S. EPA Air Emissions Models for Waste and Wastewater. U.S. Environmental Protection Agency, Office of Air Quality Planning and Standards, Research Triangle Park, NC, EPA-453/R A. 14 Hedden T Volatile Organic Chemical Emissions from Wastewater Impoundments Under No-Wind Conditions. Master s thesis, University of Arkansas, Fayetteville, AR 15 Lunney P. D Characterization of Wind and Depth Effects upon Liquid Phase Mass Transfer Coefficients: Simulation Studies. Master s thesis, University of Arkansas, Fayetteville, AR. 7 SLTCC Cattle Feedlot Report
48 Hourly water temperatures within each basin were estimated by the heat balance approach described in Thomann and Mueller (1987). 16 The approach assumes that the basin is crust-free and completely-mixed vertically, and that the sky is free of clouds. The EPA s PCRAMMET algorithms 17 were used to estimate the hourly variation in solar radiation based on day of the year, hour of the day, site latitude, and site longitude. The location of the National Weather Surface station in Sioux Falls, SD provided the site latitude and longitude. Basin depth was assumed constant and equal to maximum design capacity depth. When the water temperature algorithms predict water temperatures less than or equal to 0 C (32 F), the emission algorithms assumed that the basin is ice covered and that no gases are emitted into the atmosphere. For the open cattle lots at Feedlot #2 and Feedlot #3, the OPENLOTFLUX algorithms estimated the hourly hydrogen sulfide and ammonia emission flux rates based on the wind speed, cloud cover, solar, elevation, air temperature, and surface soil temperature. OPENLOTFLUX uses mass transfer algorithms obtained from the agricultural and micrometeorological literature. 18, 19 The historical soil temperatures at 4-inch below the surface near Lamberton, MN were used in estimating the surface soil temperatures. 20 The EPA s PCRAMMET algorithms 21 were used to estimate the hourly variation in solar elevation. OPENLOTFLUX also used the average effective hydrogen sulfide and ammonia concentrations at the surface of the manure pack obtained from cattle feedlot monitoring data. 22, 23 Neighboring Residences The air quality modeling estimated the odorous gas concentrations concentrations at the 20 neighboring residences shown in Figure Thomann R. V. and Mueller J. A Principles of Surface Water Quality Modeling and Control. Harper & Row, Publishers, Inc., New York, NY, 644 pp. 17 U.S. EPA PCRAMMET User s Guide. U.S. Environmental Protection Agency, Office of Air Quality Planning and Standards, Research Triangle Park, NC. EPA-454-B (Revised June 1999). 18 Sommer S. G. and Olesen J. E Modeling ammonia volatilization from animal slurry applied with trail hoses to cereals. Atmospheric Environment 34(15): Arya S. P Introduction to Micrometeorology. Second Edition. Academic Press, San Diego, CA U.S. EPA PCRAMMET User s Guide. U.S. Environmental Protection Agency, Office of Air Quality Planning and Standards, Research Triangle Park, NC. EPA-454-B (Revised June 1999). 22 Todd R. W. et al Ammonia and gaseous nitrogen emissions from a commercial cattle feedyard estimated using the flux-gradient method and the N:P ratio analysis. In: State of the Science, Animal Manure and Waste Management, January 4-7, 2005, San Antonio, TX. 23 Baek B. H. et al Ammonia and hydrogen sulfide flux and dry deposition velocity estimates using vertical gradient method at a commercial beef cattle feedlot. International Journal of Global Environmental Issues 6(2-3): SLTCC Cattle Feedlot Report
49 Figure 3. Modeled locations of the SLTCC cattle feedlot, the seven neighboring feedlots (not labeled), and the 20 nearest neighboring residences. 9 SLTCC Cattle Feedlot Report
50 Site Descriptions 1015' Expanded SLTCC Cattle Feedlot After the proposed expansion, the SLTCC cattle feedlot will consist of two calf barns and six cattle barns. Five of the modeled cattle barns have deep manure storage pits. Cattle #6 and the two calf barns do not have deep pits for manure storage. All barns will be naturally-ventilated. The modeled locations of the barns are provided in Figure 4. As illustrated in Figure 5, the setback distances from the barns to the property lines range from 65 to 2,500 feet. 175' Cattle #5 (proposed) Cattle #4 (proposed) Cattle #3 Cattle #2 Cattle #1 (2358', 33') 270' 65' 45' 160' Cattle #6 Calf #2 N 280' W S Calf #1 E 105' 374' 865' The physical characteristics of the cattle barns are provided in Table 4. The barns were modeled as line sources. Figure 4. Modeled barn locations for the expanded SLTCC cattle feedlot. The red line represents a portion of the feedlot s south property line. 5214' N W E S 1902' 2607' 1979' 2500' (33', 33') 65' Figure 5. Modeled barn and property line locations for the expanded SLTCC cattle feedlot. 10 SLTCC Cattle Feedlot Report
51 Table 4. Dimensions and capacities of the cattle barns at the expanded SLTCC feedlot. Barn Barn Length (feet) Barn Width (feet) Barn Height (feet) Number of Housed Steers Calf # calves Calf # calves Cattle # Cattle # Cattle # Cattle # Cattle # Cattle # Feedlot #1 Feedlot #1 is a hog feedlot with a single finishing barn. The modeled location of the barn is provided in Figure ' W N S E The physical characteristics of the hog-finishing barn are provided in Table 5. The barn was modeled as a line source. 605' 965' Finishing #1 100' 615' 200' (33', 9562') Figure 6. Modeled barn location for Feedlot #1. 11 SLTCC Cattle Feedlot Report
52 Table 5. Dimensions and capacities of the hog barn at Feedlot #1. Hog Barn Barn Length (feet) Barn Width (feet) Barn Height (feet) Number of Housed Pigs Finishing # ,000 Feedlot #2 Feedlot #2 is cattle operation consisting of open lots, a calf barn, and runoff basins. The modeled locations of the lots, barn, and basins are provided in Figure 7. The physical characteristics of the calf barn are provided in Table 6. The barn was modeled as a volume source. Based on aerial photographs, the modeled dimensions of Lot #1 are 240 ft by 200 ft and of Lot #2 were 240 ft by 185 ft. These dimensions include the associated partial confinement barns. The modeled dimensions for Basin #1 were 285 ft by 85 ft and for Basin #2 were 600 ft by 40 ft. These two runoff basins were modeled as crustfree manure storage basins. Lot #1 120' Lot #2 180' 140' (3964', 5918') Basin #1 800' 433' 40' W Calf #1 Basin #2 Figure 7. Modeled lot, barn, and runoff basin locations for Feedlot #2. N S E 60' 900' Table 6. Dimensions and capacities of the calf barn at Feedlot #2. Barn Barn Length (feet) Barn Width (feet) Barn Height (feet) Number of Housed Calves Calf # SLTCC Cattle Feedlot Report
53 Feedlot #3 Feedlot #3 is a dairy operation consisting of three barns, two open lots, and a manure storage basin. The modeled locations of the barns, lots, and basin are provided in Figure 8. Based on aerial photographs, the modeled dimensions of Lot #3 were 195 ft by 110 ft and of Lot #4 were 240 ft by 230 ft. These dimensions include the associated partial confinement barns. The modeled dimensions of the manure basin were 410 ft by 180 ft. The physical characteristics of the barns are provided in Table 7. The barns were modeled as volume and line sources. 65' N W E Lot #3 300' S 275' Dairy #1 Dairy #3 923' 145' 100' Basin #3 (5313', 5925') Dairy #2 Lot #4 Figure 8. Modeled locations of the dairy barns, open lots, and manure storage basin for Feedlot #3. 170' 278' 1025' Table 7. Dimensions and capacities of the dairy barns at Feedlot #3. Barn Barn Length (feet) Barn Width (feet) Barn Height (feet) Number of Housed Cows Dairy # Dairy # Dairy # Feedlot #4 Feedlot #4 is hog feedlot with three hogfinishing barns and a manure storage basin. The modeled locations of the barns and basin are provided in Figure 9. The physical characteristics of the barns are provided in Table 8. The barns were modeled as line sources. The circular manure basin was modeled as a 80-ft square basin. Finishing #1 230' (1320', 4780') 150' 190' Basin #4 117' 1066' Finishing #2 Finishing #3 441' Figure 9. Modeled locations of the hog barns and manure storage basin for Feedlot #4. W N S E 467' 13 SLTCC Cattle Feedlot Report
54 Table 8. Dimensions and capacities of the hog barns at Feedlot #4. Hog Barn Barn Length (feet) Barn Width (feet) Barn Height (feet) Number of Housed Pigs Finishing # ,945 Finishing # Finishing # Feedlot #5 Feedlot #5 is a combination calf and hog feedlot. The feedlot consists of one calf barn, one hog-gestation barn, and two hog-finishing barns. The modeled locations of the barns are provided in Figure 10. W N S 586' E Finishing #1 300' 200' Calf #1 Gestation #1 487' The physical characteristics of the barns are provided in Table 9. The barns were modeled as volume and line sources. (-4765', 33') Finishing #2 155' 111' 40' Figure 10. Modeled locations of the livestock barns for Feedlot #5. Table 9. Dimensions and capacities of the livestock barns at Feedlot #5. Livestock Barn Barn Length (feet) Barn Width (feet) Barn Height (feet) Number of Housed Animals Calf # calves Gestation # sows Finishing # pigs Finishing # pigs 14 SLTCC Cattle Feedlot Report
55 Feedlot #6 Feedlot #6 is hog feedlot with two hog-finishing barns. The modeled locations of the barns are provided in Figure 11. The physical characteristics of the barns are provided in Table 10. The barns were modeled as line sources. 231' 45' 45' 60' Finishing #1 Finishing #2 (1845', -5247') 646' Figure 11. Modeled locations of the hog barns for Feedlot #6. W N S E Table 10. Dimensions and capacities of the hog barns at Feedlot #6. Hog Barn Barn Length (feet) Barn Width (feet) Barn Height (feet) Number of Housed Pigs Finishing # ,200 Finishing # ,200 Feedlot #7 Feedlot #5 is a combination cattle and hog feedlot. The feedlot consists of two calf barns, two cattle barns, two hog-finishing barns, and a hog manure storage basin. The modeled locations of the barns and basin are provided in Figure 12. Finishing #1 174' 787' Basin #5 W N S E The physical characteristics of the barns are provided in Table 11. The barns were modeled as volume and line sources. The modeled dimensions of hog manure basin were 100 ft by 60 ft. Finishing #2 Calf #1 Cattle #1 290' 145' Cattle #2 Calf #2 755' (5313', -3395') 30' Figure 12. Modeled locations of the livestock barns and manure basins for Feedlot #7. 15 SLTCC Cattle Feedlot Report
56 Table 11. Dimensions and capacities of the livestock barns at Feedlot #7. Livestock Barn Barn Length (feet) Barn Width (feet) Barn Height (feet) Number of Housed Animals Calf # calves Calf # calves Cattle # cattle Cattle # cattle Finishing # pigs Finishing # pigs Gas Emission Rates Cattle Barns The cattle barns at expanded SLTCC feedlot and Feedlot #7 were modeled as sources of hydrogen sulfide, ammonia, and odor. For the deep-pitted cattle barns, a constant hydrogen sulfide flux of 0.37 g/(m 2 sec) was used to characterize the hydrogen sulfide emissions. This flux value was developed from hydrogen sulfide and carbon dioxide concentration measurements collected from a deep-pitted freestall heifer barn in southern Wisconsin. The carbon dioxide measurement method was used to estimate the air exchange rate for the barn. 24 For cattle barns without a deep manure pit, a hydrogen sulfide flux of 0.45 g/(m 2 sec) was used to characterize the hydrogen sulfide emissions from each barn MPCA Hancock Pro-Pork Hog Feedlot Project. Final Environmental Impact Statement. Minnesota Pollution Control Agency, September 15, Clark P. C. and McQuitty J. B Air quality in six Alberta commercial free-stall dairy barns. Canadian Agricultural Engineering 29(1): SLTCC Cattle Feedlot Report
57 Steers were assumed to have annual average ammonia emission factor of 5.76 kg/head/year. 26 The resulting barn ammonia emission rates were multiplied by the monthly scalars in Table 12 to account for potential temperature effects. The cattle barns were assumed to have a constant odor flux of 4.42 OU m 3 /(m 2 sec). 27 Dairy Barns The dairy barns at Feedlot #3 were modeled as sources of hydrogen sulfide, ammonia, and odor. A flux of 0.55 g/(m 2 sec) was used to characterize the hydrogen sulfide emissions from each barn. 28 Lactating dairy cows were assumed to have an ammonia emission factor of kg/head/year. 29 To account for potential temperature effects, the resulting barn ammonia emission rates were multiplied by the monthly scalars in Table 12. The dairy barns were assumed to have a constant odor flux of 1.34 OU m 3 /(m 2 sec). 30 Table 12. Monthly ammonia emission scalars for naturally-ventilated livestock barns. Month Ammonia Emission Scalar January 0.25 February 0.50 March 1.00 April 1.75 May 2.25 June 1.50 July 1.25 August 1.00 September 1.00 October 0.75 November 0.50 December Battye R., Battye W., Overcash C. and Fudge S Development and selection of ammonia emission factors. Final Report. Prepared by EC/R Incorporated, Durham, NC for the U. S. Environmental Protection Agency, Office of Research and Development, Washington D.C., 112 pp. 27 Gay S. W. et al Odor, total reduced sulfur, and ammonia emissions from animal housing facilities and manure storage units in Minnesota. Applied Engineering in Agriculture 19(3): Smith J. F. et al Comprehensive evaluation of a low-profile cross-ventilated freestall barn. Western Dairy Management Conference, Reno, NV, March 7-9, Battye R., Battye W., Overcash C. and Fudge S Development and selection of ammonia emission factors. Final Report. Prepared by EC/R Incorporated, Durham, NC for the U. S. Environmental Protection Agency, Office of Research and Development, Washington D.C., 112 pp. 30 Gay S. W. et al Odor, total reduced sulfur, and ammonia emissions from animal housing facilities and manure storage units in Minnesota. Applied Engineering in Agriculture 19(3): SLTCC Cattle Feedlot Report
58 Calf Barns The calf barns at the expanded SLTCC feedlot, Feedlot #2, Feedlot #5, and Feedlot #7 were modeled as sources of hydrogen sulfide, ammonia, and odor. A flux of 0.45 g/(m 2 sec) was used to characterize the hydrogen sulfide emissions from each barn. 31 Calves were assumed to have an ammonia emission factor of 1.6 kg/head/year. 32 The annual average emission rates were multiplied by the monthly scalars in Table 12 to account for potential temperature effects. The calf barns were assumed to have a constant odor flux of 3.00 OU m 3 /(m 2 sec). 33 Hog Finishing Barns The hog-finishing barns at Feedlot #1, Feedlot #4, Feedlot #6, and Feedlot #7 were modeled as sources of hydrogen sulfide, ammonia, and odor. The barn hydrogen sulfide and odor emission rates were based on fluxes of 3.35 g H2S/(m 2 sec) and 6.86 OU m 3 /(m 2 sec), respectively. 34 The ammonia emission rates for the hogfinishing barns were based on an ammonia emission rate factor of 3.7 kg NH3/head/yr. 35 To account for temperature-influenced variations in ammonia emissions from the hog barns, the ammonia emission factor was multiplied by the monthly scalars listed in Table 12. Hog Gestation Barn The hog-gestation barn at Feedlot #5 was modeled as a source of hydrogen sulfide, ammonia, and odor. The barn hydrogen sulfide and odor emission rates were based on fluxes of 3.58 g H2S/(m 2 sec) and 9.15 OU m 3 /(m 2 sec), respectively. 36 The ammonia emission rate for the hoggestation barn was based on an ammonia emission rate factor of 8.09 kg NH3/head/yr. 37 To account for potential temperature effects, the ammonia emission factor were multiplied by the monthly scalars listed in Table Clark P. C. and McQuitty J. B Air quality in six Alberta commercial free-stall dairy barns. Canadian Agricultural Engineering 29(1): Battye R., Battye W., Overcash C. and Fudge S Development and selection of ammonia emission factors. Final Report. Prepared by EC/R Incorporated, Durham, NC for the U. S. Environmental Protection Agency, Office of Research and Development, Washington D.C., 112 pp. 33 Gay S. W. et al Odor, total reduced sulfur, and ammonia emissions from animal housing facilities and manure storage units in Minnesota. Applied Engineering in Agriculture 19(3): Gay S. W. et al Odor, total reduced sulfur, and ammonia emissions from animal housing facilities and manure storage units in Minnesota. Applied Engineering in Agriculture 19(3): U.S. EPA Review of Emissions Factors and Methodologies to Estimate Ammonia Emissions from Animal Waste Handling. U.S. Environmental Protection Agency, Office of Research and Development, Research Triangle Park, NC, EPA-600/R Jacobson L. D. et al Aerial pollutants emissions from confined animal buildings: dry sow buildings in Minnesota. Air & Waste Management Association Conference, Minneapolis, MN, June 21-24, Battye R., Battye W., Overcash C. and Fudge S Development and selection of ammonia emission factors. Final Report. Prepared by EC/R Incorporated, Durham, NC for the U. S. Environmental Protection Agency, Office of Research and Development, Washington D.C., 112 pp. 18 SLTCC Cattle Feedlot Report
59 Open Cattle and Dairy Lots The open cattle lots at Feedlot #2 and the open dairy lots at Feedlot #3 were modeled as sources of odor, hydrogen sulfide, and ammonia. Emission rates were equal to the surface area times the estimated emission flux rate. The modeled odor emission flux rates from the manure pack of the open lots varied monthly, based on an April odor flux of 4.76 OU m 3 /(m 2 sec). 38 To account for monthly variations in odor emission flux rates, the April flux was multiplied by the monthly scalars listed in Table 13. The modeled hydrogen sulfide and ammonia emission flux rates from the manure pack of the open lots varied hourly. The OPENLOTFLUX algorithms estimated the emission flux rates, based on the wind speed, air temperature, manure pack temperature, and effective surface concentrations. The algorithms used the average effective hydrogen sulfide and ammonia concentrations at the surface of the manure pack obtained from cattle feedlot monitoring data. 39, 40 To illustrate the range and variability in the hourly emissions, the estimated 1987 noon-hour emission flux rates for hydrogen sulfide are provided in Figures 13. Table 13. Monthly odor emission scalars for cattle lots. 41 Month Odor Emission Scalar January 0.38 February 0.38 March 0.38 April 1.00 May 1.00 June 0.67 July 0.67 August 0.64 September 0.38 October 0.38 November 0.38 December Duysen R. D. et al Ammonia, hydrogen sulfide and odor emissions from a beef cattle feedlot. ASAE Meeting Paper No St. Joseph, MI. 39 Todd R. W. et al Ammonia and gaseous nitrogen emissions from a commercial cattle feedyard estimated using the flux-gradient method and the N:P ratio analysis. In: State of the Science, Animal Manure and Waste Management, January 4-7, 2005, San Antonio, TX. 40 Baek B. H. et al Ammonia and hydrogen sulfide flux and dry deposition velocity estimates using vertical gradient method at a commercial beef cattle feedlot. International Journal of Global Environmental Issues 6(2-3): Duysen R. D. et al Ammonia, hydrogen sulfide and odor emissions from a beef cattle feedlot. ASAE Meeting Paper No St. Joseph, MI 19 SLTCC Cattle Feedlot Report
60 0.075 Table 14. Chemical characteristics of basins storing dairy manure. H 2 S Flux (g/m 2 /day) Parameter Units Value ph -log10[h + ] 7.8 Sulfide mg S/L 1.3 Ammonia mg N/L Julian Day Figure 13. Estimated 1987 noon-hour hydrogen sulfide emission flux rates for the open cattle and dairy lots Dairy Manure Basins The dairy manure storage basin at Feedlot #3 was modeled as a source of odor, hydrogen sulfide, and ammonia. The basin was assumed to have a 1-inch thick crust floating on the manure surface. The odor emission rates for the basin was based on a constant odor flux of 8.7 OU m 3 /(m 2 sec). 42 The BASINODOR algorithms estimated the hourly hydrogen sulfide and ammonia emissions from the basin based on the manure chemistry provided in Table 14. To illustrate the range and variability in the hourly emissions, the estimated 1987 noon-hour emission flux rates for hydrogen sulfide and ammonia are provided in Figures 14 and 15, respectively. H 2 S Flux (g/m 2 /day) Julian Day Figure 14. Estimated 1987 noon-hour hydrogen sulfide flux rates for the crustcovered dairy manure basin at Feedlot #3. 42 Gay S. W. et al Odor, total reduced sulfur, and ammonia emissions from animal housing facilities and manure storage units in Minnesota. Applied Engineering in Agriculture 19(3): This flux is the geometric mean odor flux for all listed earthen storage basins for dairy cows. 20 SLTCC Cattle Feedlot Report
61 NH 3 Flux (g/m 2 /day) Julian Day To illustrate the range and variability in the hourly emissions, the estimated 1987 noon-hour emission flux rates for hydrogen sulfide and ammonia are provided in Figures 16 and 17, respectively. For the crust-free hog-manure basins at Feedlot #4 and Feedlot #7, the estimated odor emission flux rate varied with wind speed. At low wind speeds, the estimated odor flux was 16.7 OU m 3 /(m 2 sec). 43 To account for the effect of wind velocity on odor emission rates, the emission flux rates were multiplied by the scalars plotted in Figure , 45 Figure 15. Estimated 1987 noon-hour ammonia flux rates for the crust-covered dairy manure basin at Feedlot #3. Table 15. Chemical characteristics of basins storing hog manure. 46 Hog Manure Basin The hog manure storage basins at Feedlot #4 and Feedlot #7 were modeled as sources of hydrogen sulfide, ammonia, and odor. The basins were modeled as crust-free basins. The BASINODOR algorithms estimated the hourly hydrogen sulfide and ammonia emissions from the manure storage basins based on the manure chemistry provided in Table 15. Parameter Units Value ph -log10[h + ] 7.5 Sulfide mg S/L 5.3 Ammonia mg N/L 1, Gay S. W. et al Odor, total reduced sulfur, and ammonia emissions from animal housing facilities and manure storage units in Minnesota. Applied Engineering in Agriculture 19(3): Schmidt D. R., Bicudo J. R., and Janni K. A Determining odor emissions from manure surfaces using a wind tunnel. ASAE Paper No St. Joseph, MI. 45 U.S. EPA Air Emissions Models for Waste and Wastewater. U.S. Environmental Protection Agency, Office of Air Quality Planning and Standards, Research Triangle Park, NC, EPA-453/R A. 46 MPCA Hancock Pro-Pork Hog Feedlot Project. Final Environmental Impact Statement. Minnesota Pollution Control Agency, September 15, SLTCC Cattle Feedlot Report
62 H 2 S Flux (g/m 2 /day) 4 Odor Flux Scalar Julian Day Wind Velocity (meter/second) Figure 16. Estimated 1987 noon-hour hydrogen sulfide flux rates for the hog manure basin at Feedlot #4. Figure 18. Odor emission flux scalar as a function of wind velocity for crust-free basins. NH 3 Flux (g/m 2 /day) Julian Day Figure 17. Estimated 1987 noon-hour ammonia flux rates for the hog manure basin at Feedlot #4. Runoff Basins The two runoff collection basins at Feedlot #2 were modeled as sources of hydrogen sulfide, ammonia, and odor. The basins were assumed to have crust-free surfaces. Because representative chemical parameters for runoff basins at cattle feedlots are not available, the runoff basins were assumed to have the chemistry of a dairy manure storage basin. Thus, the BASINODOR algorithms estimated hourly hydrogen sulfide and ammonia emissions from the runoff collection basins based on the chemistry provided in Table 14. For the crust-free runoff basins at Feedlot #2, the estimated odor emission flux rate varied with wind speed. At low wind speeds, the estimated odor flux will be 8.7 OU m 3 /(m 2 sec). 47 To account for the effect of wind velocity on odor emission rates, the emission flux rates were multiplied by the scalars plotted in Figure Gay S. W. et al Odor, total reduced sulfur, and ammonia emissions from animal housing facilities and manure storage units in Minnesota. Applied Engineering in Agriculture 19(3): SLTCC Cattle Feedlot Report
63 Hydrogen Sulfide at Property Lines and Neighbors The CALPUFF results suggest that the expanded SLTCC cattle feedlot will comply with the Minnesota ambient air quality standard for hydrogen sulfide. The estimated maximum hourly concentrations for the expanded feedlot s property lines are provided in Table 16. When a background concentration of 17 ppb is added to the CALPUFF-generated concentrations, the maximum estimated property-line hydrogen sulfide concentration is ppb, which is below the standard of 30 ppb. Thus, no violations of the hydrogen sulfide standard were modeled. Table 16. Maximum hourly property-line hydrogen sulfide concentrations. Property Line H2S Concentration Without Background (ppb, v/v) H2S Concentration With a 17 ppb Background (ppb, v/v) North East South West The maximum CALPUFF-generated hourly hydrogen sulfide concentrations (without background) are plotted in Figure 19. The plotted 3-ppb concentration isopleth is assumed to represent the the maximum extent of detectable hydrogen sulfide odors. This assumption overestimates the extent of detectable odors, because the reported odor threshold concentration for hydrogen sulfide is 3.7 ppb (Table 2). The 3-ppb isopleth in Figure 19 suggests that the hydrogen sulfide emissions from the expanded SLTCC feedlot and the neighboring seven feedlots can generate detectable off-site concentrations of hydrogen sulfide. North/South Distance (miles) East/West Distance (miles) Figure 19. Maximum CALPUFF-generated hourly hydrogen sulfide concentrations in ppb for the expanded SLTCC cattle feedlot and the seven neighboring feedlots. The contour lines represent 3, 8, and 13 ppb of hydrogen sulfide. The plotted concentrations do not include the 17-ppb background hydrogen sulfide concentration. The point (0, 0) is the southwest corner of Section 25. The CALPUFF results also suggest that the emissions from the expanded SLTCC feedlot and the seven neighboring feedlots will not cause exceedences of the subchronic hydrogen sulfide ihrv at the 20 neighboring residences. As provided in Table 17, when a background concentration of 1.00 g/m 3 is added to the CALPUFF-generated concentrations, the maximum 13-week hydrogen sulfide concentration for a neighbor is 2.17 g/m 3, which is below the subchronic ihrv for hydrogen sulfide of 10 g/m SLTCC Cattle Feedlot Report
64 Table 17. Maximum 13-week hydrogen sulfide concentrations for neighbors. (* = feedlot residences) Neighbor H2S Concentration Without Background ( g/m 3 ) H2S Concentration With a 1 g/m 3 Background ( g/m 3 ) A B1* B B3* B C C2* C D D D E1* F F2* G G G I I2* I Ammonia at Property Lines and Neighbors The CALPUFF-generated maximum hourly property-line ammonia concentrations are provided in Table 18. The highest estimated property-line concentration with a background concentration of 148 g/m 3 is 746 g/m 3, which is below the acute ihrv for ammonia of 3,200 g/m 3. Thus, the modeling results suggest that the expanded SLTCC feedlot will not cause exceedences of the acute ammonia ihrv. Table 18. Maximum hourly property-line ammonia concentrations. Property Line NH3 Concentration Without Background ( g/m 3 ) NH3 Concentration With a 148 g/m 3 Background ( g/m 3 ) North East South West The maximum CALPUFF-generated hourly ammonia concentrations (without background) are plotted in Figure 20. The reported odor threshold concentration for ammonia is 1,067 g/m 3 or 1,500 ppb (v/v) (Table 2). The 1,000- g/m 3 isopleth in Figure 20 suggests that the expanded SLTCC feedlot will not generate detectable off-site concentrations of ammonia. 24 SLTCC Cattle Feedlot Report
65 2 Table 19. Maximum annual ammonia concentrations for neighbors. (* = feedlot residences) North/South Distance (miles) , ,000 Neighbor NH3 Concentration Without Background ( g/m 3 ) NH3 Concentration With a 5.72 g/m 3 Background ( g/m 3 ) East/West Distance (miles) Figure 20. Maximum CALPUFF-generated hourly ammonia concentration in g/m 3 for the expanded SLTCC cattle feedlot and the seven neighboring feedlots. The contour lines represent 500 and 1,000 g/m 3 of ammonia. The plotted concentrations do not include the 148 g/m 3 background ammonia concentration. The CALPUFF results also suggest that the emissions from the expanded SLTCC cattle feedlot and the seven neighboring feedlots will not cause exceedences of the chronic ammonia ihrv at the 20 nearest neighbors. The highest annual ammonia concentration for a neighbor with a background concentration of 5.72 g/m 3 is g/m 3, which is below the chronic ammonia ihrv of 80 g/m 3. The maximum annual ammonia concentrations for each of the modeled nearest neighbors are provided in Table 19. A B1* B B3* B C C2* C D D D E1* F F2* G G G I I2* I SLTCC Cattle Feedlot Report
66 Odorous Gas Concentrations at Property Lines and Neighbors The CALPUFF modeling estimated the groundlevel atmospheric concentrations of hydrogen sulfide and ammonia at the property lines for the expanded SLTCC cattle feedlot and at the feedlot s neighbors. The estimated maximum property-line concentrations are 837 ppb for ammonia (without background) and 6.31 ppb for hydrogen sulfide (without background). The corresponding odor numbers for the maximum property-line concentrations are 1.7 for hydrogen sulfide and 0.6 for ammonia. Population response curves suggest that 78 percent of the population could detect the estimated maximum property-line hydrogen sulfide concentration, and 20 percent the ammonia concentration. The estimated maximum hourly concentrations for neighboring residences are 1,123 ppb for ammonia (without background), and ppb for hydrogen sulfide (without background). The corresponding odor numbers for the maximum neighbor concentrations are 7.3 for hydrogen sulfide and 0.7 for ammonia. Population response curves suggest that 99 percent of the population could detect the estimated maximum neighbor hydrogen sulfide concentration, and 34 percent the ammonia concentration. The population response curves assume the presence of individual gases. Odor Intensities at Property Lines and Neighbors The CALPUFF modeling estimated the groundlevel odor intensities at the expanded SLTCC feedlot s property lines and at the feedlot s neighbors. As indicated in Table 20, the maximum hourly odor intensity at the expanded feedlot s property lines is 57 odor units (OU), which is below the faint odor threshold of 83 OU. Table 20. Maximum hourly property-line odor intensities for the expanded SLTCC cattle feedlot. Property Line Maximum Hourly Odor Intensity (OU, d/t) North 44 East 38 South 57 West 26 Figure 21 suggests that expanded SLTCC feedlot can create off-site odors with very faint intensities. However, as provided in Table 21, the maximum odor intensities at the neighboring residences can exceed the 83-OU threshold for faint odors due to the emissions from the neighboring feedlots. North/South Distance (miles) East/West Distance (miles) Figure 21. Maximum CALPUFF-generated hourly odor intensities for the expanded SLTCC feedlot and the seven neighboring feedlots. The threshold for very faint odors is 28 OU and for faint odors is 83 OU (Table 3) SLTCC Cattle Feedlot Report
67 Table 21. Maximum neighbor odor intensities. (* = feedlot residences) Neighbor Maximum Hourly Odor Intensity (OU, d/t) A1 37 B1* 23 B2 29 B3* 198 B4 52 C1 33 C2* 161 C3 32 D1 49 D2 32 D3 14 E1* 142 F1 15 F2* 20 G1 13 G2 11 G3 5 I1 18 I2* 118 I3 13 Summary The CALPUFF modeling results suggest that the expanded SLTCC cattle feedlot will comply with the air quality standard for hydrogen sulfide at its property lines. The modeling also suggests that the expanded feedlot will not create exceedences the acute ammonia ihrv at its property lines. The CALPUFF results indicate that the expanded SLTCC feedlot and the seven neighboring feedlots will not create exceedences of the subchronic ihrv for hydrogen sulfide and the chronic ihrv for ammonia at the neighboring residences. While the CALPUFF modeling results indicate that detectable concentrations of hydrogen sulfide and ammonia can exist beyond the expanded feedlot s property lines, the modeled odor intensities at the expanded feedlot s property lines are less than the threshold for faint odors. 27 SLTCC Cattle Feedlot Report
68 ATTACHMENT J
69
70
71
72
73
74
75
76
77
78
79
80
81
82
83
84
85
86
87
88
89
90
91
92
93
94 ATTACHMENT K
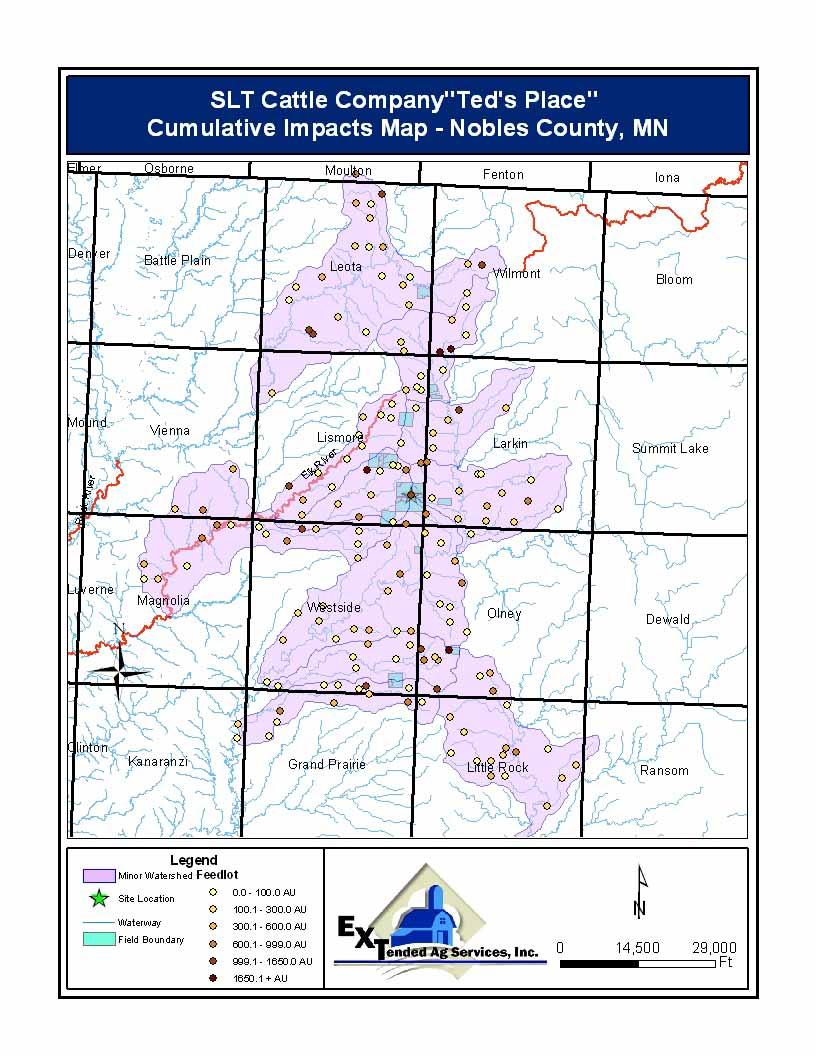
95 ATTACHMENT L
96 ATTACHMENT M OFFSET CALCULATOR Description p or SLT Cattle Company - Ted Ted's s : comments: t S Source # S D i ti Source Description 2003 University of Minnesota Extension Service Version 1.01 Odor OFFSET Calculation # E i i Emission Similar Si il Number sources N b Width (f t) (feet) Length L th (f t) (feet) Od C Odor Control t lt Technology h l Control C t l F t Factor Od Odor Emission E i i F t Factor Finishing-deep pit None 2 Finishing-deep pit None 3 Finishing-deep pit None 4 Finishing-deep pit 200 None None Dairy-tie stall None Dairy-tie stall None Dairy-tie stall 60 None None Finishing-deep pit 6 9 Dairy-tie stall * *Use Use for other source source, emission number number, or control factor not currently listed listed. Total Odor Emission Factor= % odor annoy ffree 99% 98% 97% 96% 94% 91% Hours per month th Setback Distance miles il f t feet For more information, information see J Jacobson, b L L.D., D D D. R R. S Schmidt, h idt and ds S. W Wood., d OFFSET: OFFSET Od Odor from f Feedlots F dl t Setback S tb k E Estimation ti ti T Tooll. FO FO C C C. St St. P Paul, l Mi Minn.: U i University it off Mi Minnesota t Extension E t i Service. S i ( (htt // t i d /di t ib ti /li t k t /DI7680 ht l)
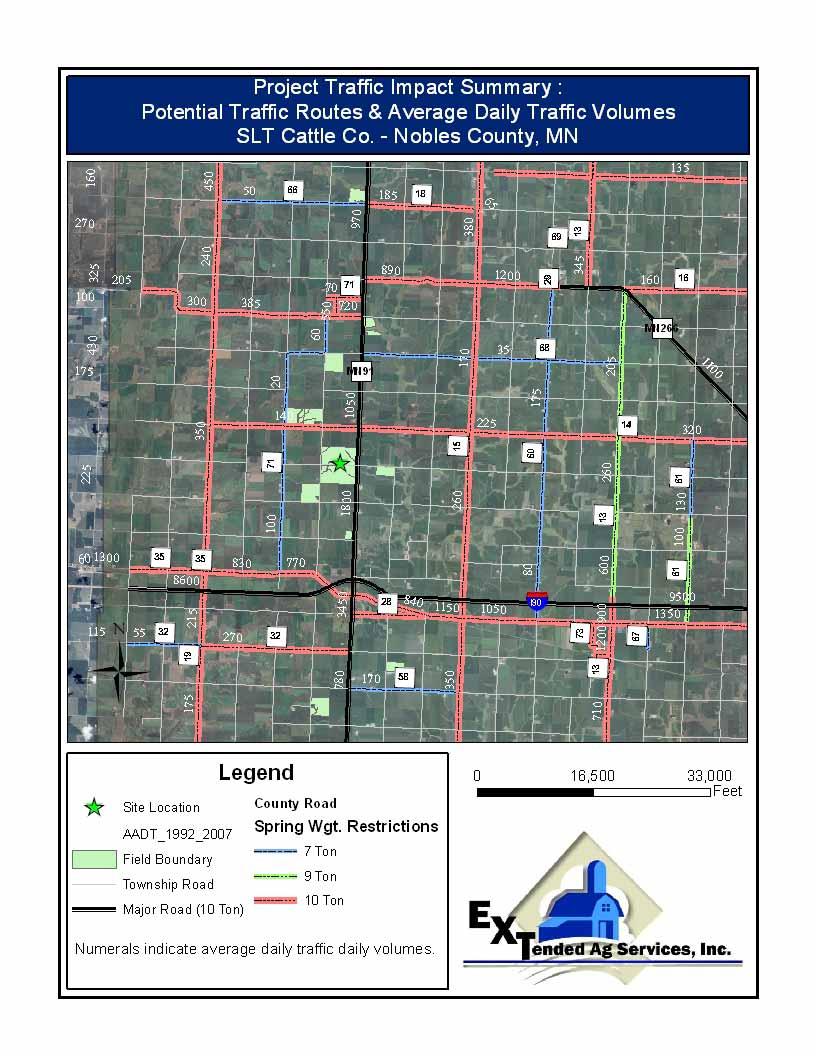
97 ATTACHMENT N
STATE OF MINNESOTA MINNESOTA POLLUTION CONTROL AGENCY FINDINGS OF FACT. Project Description
 STATE OF MINNESOTA MINNESOTA POLLUTION CONTROL AGENCY IN THE MATTER OF THE DECISION ON THE NEED FOR AN ENVIRONMENTAL IMPACT STATEMENT FOR THE PROPOSED STROBEL FARMS JUNGBLOET SITE & BUECKSLER SITE BLUE
STATE OF MINNESOTA MINNESOTA POLLUTION CONTROL AGENCY FINDINGS OF FACT
 STATE OF MINNESOTA MINNESOTA POLLUTION CONTROL AGENCY IN THE MATTER OF THE DECISION ON THE NEED FOR AN ENVIRONMENTAL IMPACT STATEMENT FOR THE PROPOSED BINFORD FARMS SECTION 4 FEEDLOT EXPANSION MAGNOLIA
STATE OF MINNESOTA MINNESOTA POLLUTION CONTROL AGENCY FINDINGS OF FACT
 STATE OF MINNESOTA MINNESOTA POLLUTION CONTROL AGENCY IN THE MATTER OF THE DECISION ON THE NEED FOR AN ENVIRONMENTAL IMPACT STATEMENT FOR THE PROPOSED AHRENDT BROTHERS CATTLE EXPANSION PROJECT MOUND TOWNSHIP,
STATE OF MINNESOTA MINNESOTA POLLUTION CONTROL AGENCY FINDINGS OF FACT
 STATE OF MINNESOTA MINNESOTA POLLUTION CONTROL AGENCY IN THE MATTER OF THE DECISION ON THE NEED FOR AN ENVIRONMENTAL IMPACT STATEMENT FOR THE PROPOSED ASMUS EGG FARMS INC FEEDLOT EXPANSION ALFSBORG TOWNSHIP
Alternative EAW Form for Animal Feedlots ENVIRONMENTAL ASSESSMENT WORKSHEET
 Alternative EAW Form for Animal Feedlots ENVIRONMENTAL ASSESSMENT WORKSHEET Note to reviewers: The Worksheet (EAW) provides information about a project that may have the potential for significant environmental
STATE OF MINNESOTA MINNESOTA POLLUTION CONTROL AGENCY FINDINGS OF FACT
 p-ear2-59b STATE OF MINNESOTA MINNESOTA POLLUTION CONTROL AGENCY IN THE MATTER OF THE DECISION ON THE NEED FOR AN ENVIRONMENTAL IMPACT STATEMENT FOR THE PROPOSED HEARTLAND HUTTERIAN BRETHREN, INC. FEEDLOT
Please note that comment letters submitted to the MPCA do become public documents and will be part of the official public record for this project.
 August 26, 2005 TO: INTERESTED PARTIES RE: Enclosed is the Worksheet (EAW) for the proposed New Fashion Pork, Fransen Site, Nobles County. The EAW was prepared by the Minnesota Pollution Control Agency
Alternative EAW Form for Animal Feedlots ENVIRONMENTAL ASSESSMENT WORKSHEET
 Alternative EAW Form for Animal Feedlots ENVIRONMENTAL ASSESSMENT WORKSHEET Note to reviewers: The Worksheet (EAW) provides information about a project that may have the potential for significant environmental
STATE OF MINNESOTA MINNESOTA POLLUTION CONTROL AGENCY FINDINGS OF FACT
 STATE OF MINNESOTA MINNESOTA POLLUTION CONTROL AGENCY IN THE MATTER OF THE DECISION ON THE NEED FOR AN ENVIRONMENTAL IMPACT STATEMENT FOR THE PROPOSED NEW FASHION PORK, ENGELKES SITE NOBLES COUNTY WORTHINGTON,
Alternative EAW Form for Animal Feedlots ENVIRONMENTAL ASSESSMENT WORKSHEET
 Alternative EAW Form for Animal Feedlots ENVIRONMENTAL ASSESSMENT WORKSHEET Note to reviewers: The Worksheet (EAW) provides information about a project that may have the potential for significant environmental
STATE OF MINNESOTA MINNESOTA POLLUTION CONTROL AGENCY
 p-ear2-131b STATE OF MINNESOTA MINNESOTA POLLUTION CONTROL AGENCY IN THE MATTER OF THE DECISION ON THE NEED FOR AN ENVIRONMENTAL IMPACT STATEMENT FOR THE PROPOSED HI-WAY 30 HOGS, LLC PROJECT BYRON TOWNSHIP,
STATE OF MINNESOTA MINNESOTA POLLUTION CONTROL AGENCY FINDINGS OF FACT
 STATE OF MINNESOTA MINNESOTA POLLUTION CONTROL AGENCY IN THE MATTER OF THE DECISION ON THE NEED FOR AN ENVIRONMENTAL IMPACT STATEMENT FOR THE PROPOSED ARMSTRONG FEEDLOT FREEDOM TOWNSHIP/WASECA COUNTY WASECA,
STATE OF MINNESOTA MINNESOTA POLLUTION CONTROL AGENCY FINDINGS OF FACT
 STATE OF MINNESOTA MINNESOTA POLLUTION CONTROL AGENCY IN THE MATTER OF THE DECISION ON THE NEED FOR AN ENVIRONMENTAL IMPACT STATEMENT FOR THE PROPOSED PJM PORK, INC. SWINE FEEDLOT EXPANSION PROJECT COURTLAND
Alternative EAW Form for Animal Feedlots ENVIRONMENTAL ASSESSMENT WORKSHEET
 Alternative EAW Form for Animal Feedlots ENVIRONMENTAL ASSESSMENT WORKSHEET Note to reviewers: The Worksheet (EAW) provides information about a project that may have the potential for significant environmental
STATE OF MINNESOTA MINNESOTA POLLUTION CONTROL AGENCY
 p-ear2-97b STATE OF MINNESOTA MINNESOTA POLLUTION CONTROL AGENCY IN THE MATTER OF THE DECISION ON THE NEED FOR AN ENVIRONMENTAL IMPACT STATEMENT FOR THE PROPOSED BUENDORF HOG FACILITY HARTLAND TOWNSHIP
STATE OF MINNESOTA MINNESOTA POLLUTION CONTROL AGENCY FINDINGS OF FACT
 STATE OF MINNESOTA MINNESOTA POLLUTION CONTROL AGENCY IN THE MATTER OF THE DECISION ON THE NEED FOR AN ENVIRONMENTAL IMPACT STATEMENT FOR THE PROPOSED BRAUN HOG FEEDLOT EXPANSION PRAIRIEVILLE TOWNSHIP/BROWN
Alternative EAW Form for Animal Feedlots ENVIRONMENTAL ASSESSMENT WORKSHEET
 Alternative EAW Form for Animal Feedlots ENVIRONMENTAL ASSESSMENT WORKSHEET Note to reviewers: The Environmental Assessment Worksheet (EAW) provides information about a project that may have the potential
Alternative EAW Form for Animal Feedlots ENVIRONMENTAL ASSESSMENT WORKSHEET
 Alternative EAW Form for Animal Feedlots ENVIRONMENTAL ASSESSMENT WORKSHEET Note to reviewers: The Worksheet (EAW) provides information about a project that may have the potential for significant environmental
Environmental Information Worksheet
 Environmental Information Worksheet Water System Owner (Attach additional sheets if necessary) Needs and Alternatives Provide a brief narrative that describes: Current drinking water system needs. Project
Alternative EAW Form for Animal Feedlots ENVIRONMENTAL ASSESSMENT WORKSHEET
 Alternative EAW Form for Animal Feedlots ENVIRONMENTAL ASSESSMENT WORKSHEET Note to reviewers: The Environmental Assessment Worksheet (EAW) provides information about a project that may have the potential
STATE OF MINNESOTA MINNESOTA POLLUTION CONTROL AGENCY
 p-ear2-82b STATE OF MINNESOTA MINNESOTA POLLUTION CONTROL AGENCY IN THE MATTER OF THE DECISION ON THE NEED FOR AN ENVIRONMENTAL IMPACT STATEMENT FOR THE PROPOSED R & R THIER FEEDLOTS, INC. OLNEY TOWNSHIP
Alternative EAW Form for Animal Feedlots ENVIRONMENTAL ASSESSMENT WORKSHEET
 Alternative EAW Form for Animal Feedlots ENVIRONMENTAL ASSESSMENT WORKSHEET Note to reviewers: The Environmental Assessment Worksheet (EAW) provides information about a project that may have the potential
Alternative EAW Form for Animal Feedlots ENVIRONMENTAL ASSESSMENT WORKSHEET
 Alternative EAW Form for Animal Feedlots ENVIRONMENTAL ASSESSMENT WORKSHEET Note to reviewers: The Environmental Assessment Worksheet (EAW) provides information about a project that may have the potential
STATE OF MINNESOTA MINNESOTA POLLUTION CONTROL AGENCY FINDINGS OF FACT FACILITY HISTORY
 STATE OF MINNESOTA MINNESOTA POLLUTION CONTROL AGENCY IN THE MATTER OF THE DECISION ON THE NEED FOR AN ENVIRONMENTAL IMPACT STATEMENT FOR THE PROPOSED NEW SWEDEN DAIRY NEW SWEDEN TOWNSHIP NICOLLET COUNTY,
STATE OF MINNESOTA MINNESOTA POLLUTION CONTROL AGENCY FINDINGS OF FACT
 p-ear2-41b STATE OF MINNESOTA MINNESOTA POLLUTION CONTROL AGENCY IN THE MATTER OF THE DECISION ON THE NEED FOR AN ENVIRONMENTAL IMPACT STATEMENT FOR THE PROPOSED HIGH ISLAND DAIRY, LLC LAKE PRAIRIE TOWNSHIP
Alternative EAW Form for Animal Feedlots ENVIRONMENTAL ASSESSMENT WORKSHEET
 Alternative EAW Form for Animal Feedlots ENVIRONMENTAL ASSESSMENT WORKSHEET Note to reviewers: The Environmental Assessment Worksheet (EAW) provides information about a project that may have the potential
Permit Application for an Animal Feedlot or Manure Storage Area
 Permit Application for an Animal Feedlot or Manure Storage Area This permit application must be completed and submitted for Construction Short Form, Interim, National Pollutant Discharge Elimination System
STATE OF MINNESOTA MINNESOTA POLLUTION CONTROL AGENCY FINDINGS OF FACT PROPOSED PROJECT DESCRIPTION
 STATE OF MINNESOTA MINNESOTA POLLUTION CONTROL AGENCY IN THE MATTER OF THE DECISION ON THE NEED FOR AN ENVIRONMENTAL IMPACT STATEMENT FOR THE PROPOSED LOWELL FRANZEN FEEDLOT PROJECT LYLE TOWNSHIP MOWER
ATTACHMENTS: 1. Findings of Fact, Conclusion of Law, and Order 5/24/07
 The MPCA is the governmental unit responsible for preparing an Environmental Assessment Worksheet (EAW) when an animal feedlot project meets the thresholds specified in Minn. R. 4410.4300, subp. 29A. As
Reviewing Manure Management Plans - FAQ
 Reviewing Manure Management Plans - FAQ Regional Division Feedlot Program Contents: Manure storage... 2 Field locations... 3 Nutrient management.. 5 Sensitive areas... 6 Checklist... 8 MPCA Area Offices
Notice of Availability of an Environmental Assessment Worksheet (EAW) Prairie Feeders, LLC - FP21 Site
 Prairie Feeders, LLC - FP21 Site") Public comment information EAW public comment period begins: December 3, 2018 EAW public comment period ends: 4:30 p.m. on January 2, 2019 Notice published in the EQB Monitor: December 3, 2018 Permit public
Public comment information EAW public comment period begins: December 3, 2018 EAW public comment period ends: 4:30 p.m. on January 2, 2019 Notice published in the EQB Monitor: December 3, 2018 Permit public
Alternative EAW Form for Animal Feedlots ENVIRONMENTAL ASSESSMENT WORKSHEET
 Alternative EAW Form for Animal Feedlots ENVIRONMENTAL ASSESSMENT WORKSHEET Note to reviewers: The Environmental Assessment Worksheet (EAW) provides information about a project that may have the potential
STATE OF MINNESOTA MINNESOTA POLLUTION CONTROL AGENCY FINDINGS OF FACT
 ATTACHMENT 1 STATE OF MINNESOTA MINNESOTA POLLUTION CONTROL AGENCY IN THE MATTER OF THE DECISION ON THE NEED FOR AN ENVIRONMENTAL IMPACT STATEMENT FOR THE PROPOSED LISMORE HUTTERIAN BRETHREN, INC., SWINE
STATE OF MINNESOTA. Minnesota Pollution Control Agency. FACT SHEET for the STATE OF MINNESOTA GENERAL ANIMAL FEEDLOT PERMIT. Permit Number MNG450000
 STATE OF MINNESOTA Minnesota Pollution Control Agency FACT SHEET for the STATE OF MINNESOTA GENERAL ANIMAL FEEDLOT PERMIT Permit Number MNG450000 I. INTRODUCTION The Minnesota Pollution Control Agency
Alternative EAW Form for Animal Feedlots ENVIRONMENTAL ASSESSMENT WORKSHEET
 Alternative EAW Form for Animal Feedlots ENVIRONMENTAL ASSESSMENT WORKSHEET Note to reviewers: The Environmental Assessment Worksheet (EAW) provides information about a project that may have the potential
STATE OF MINNESOTA. Minnesota Pollution Control Agency. FACT SHEET for the
 I. INTRODUCTION STATE OF MINNESOTA Minnesota Pollution Control Agency FACT SHEET for the 2016 GENERAL NATIONAL POLLUTANT DISCHARGE ELIMINATION SYSTEM (NPDES) ANIMAL FEEDLOT PERMIT Permit Number MNG440000
Feedlot Construction Setbacks from Open Water and Wells
 Feedlot Construction Setbacks from Open Water and Wells Water Quality/Feedlots #8.30 May 2009 Contents New and expanded feedlots near waters... 2 Setbacks from wells... 3 Public water supply wells... 4
MINNESOTA POLLUTION CONTROL AGENCY. Watershed Division. Board Item Cover Sheet. MEETING DATE: August 26, 2014 DATE MAILED: August 15, 2014
 b-bp14-08-03a MINNESOTA POLLUTION CONTROL AGENCY Watershed Division Board Item Cover Sheet MEETING DATE: August 26, 2014 DATE MAILED: August 15, 2014 Presenter(s): Supervisor: Manager: Division Director:
STATE OF MINNESOTA MINNESOTA POLLUTION CONTROL AGENCY FINDINGS OF FACT
 STATE OF MINNESOTA MINNESOTA POLLUTION CONTROL AGENCY IN THE MATTER OF THE DECISION ON THE NEED FOR AN ENVIRONMENTAL IMPACT STATEMENT FOR THE PROPOSED WAHKON WASTEWATER TREATMENT FACILITY EXPANSION MILLE
STATE OF MINNESOTA MINNESOTA POLLUTION CONTROL AGENCY FINDINGS OF FACT
 p-ear2-44b STATE OF MINNESOTA MINNESOTA POLLUTION CONTROL AGENCY IN THE MATTER OF THE DECISION ON THE NEED FOR AN ENVIRONMENTAL IMPACT STATEMENT FOR THE PROPOSED RANDY S SANITATION TRANSFER FACILITY PROPOSED
Alternative EAW Form for Animal Feedlots ENVIRONMENTAL ASSESSMENT WORKSHEET
 Alternative EAW Form for Animal Feedlots ENVIRONMENTAL ASSESSMENT WORKSHEET Note to reviewers: The Worksheet (EAW) provides information about a project that may have the potential for significant environmental
Minnesota Pollution Control Agency
 STATE OF MINNESOTA Watershed Division National Pollutant Discharge Elimination System (NPDES)/ State Disposal System (SDS) Permit for a Concentrated Animal Feeding Operation (CAFO) Permit Number MN0070548
STATE OF MINNESOTA MINNESOTA POLLUTION CONTROL AGENCY FINDINGS OF FACT
 STATE OF MINNESOTA MINNESOTA POLLUTION CONTROL AGENCY IN THE MATTER OF THE DECISION ON THE NEED FOR AN ENVIRONMENTAL IMPACT STATEMENT FOR THE PROPOSED THREE LITTLE PIGS FARM ROCK LAKE TOWNSHIP LYON COUNTY,
Notice of Availability of an Environmental Assessment Worksheet (EAW) Reichmann Land & Cattle, LLP Blair West Site
 Reichmann Land & Cattle, LLP Blair West Site") Public Comment Information EAW Public comment period begins: August 31, 2015 EAW Public comment period ends: September 30, 2015 Notice published in the EQB Monitor: August 31, 2015 Notice of Availability
Public Comment Information EAW Public comment period begins: August 31, 2015 EAW Public comment period ends: September 30, 2015 Notice published in the EQB Monitor: August 31, 2015 Notice of Availability
Notice of Availability of an Environmental Assessment Worksheet (EAW) Campbell Dairy
 Campbell Dairy") Notice of Availability of an Environmental Assessment Worksheet (EAW) Campbell Dairy Doc Type: Public Notice Public Comment Information EAW Public comment period begins: December 19, 2016 EAW Public comment
Notice of Availability of an Environmental Assessment Worksheet (EAW) Campbell Dairy Doc Type: Public Notice Public Comment Information EAW Public comment period begins: December 19, 2016 EAW Public comment
STATE OF MINNESOTA MINNESOTA POLLUTION CONTROL AGENCY FINDINGS OF FACT. Project Description
 p-ear2-46b STATE OF MINNESOTA MINNESOTA POLLUTION CONTROL AGENCY IN THE MATTER OF THE DECISION ON THE NEED FOR AN ENVIRONMENTAL IMPACT STATEMENT FOR THE PROPOSED SHAMROCK RECYCLING AND TRANSFER STATION
STATE OF MINNESOTA MINNESOTA POLLUTION CONTROL AGENCY
 STATE OF MINNESOTA MINNESOTA POLLUTION CONTROL AGENCY In the Matter of the Decision on the Need for an Environmental Impact Statement for the Proposed Remer Wastewater Treatment Facility Expansion FINDINGS
Missouri Concentrated Animal Feeding Operation Nutrient Management Technical Standard
 Missouri Concentrated Animal Feeding Operation Nutrient Management Technical Standard March 4, 2009 Division of Environmental Quality Water Protection Program I Introduction A. Authority and Purpose Missouri
STATE OF MINNESOTA MINNESOTA POLLUTION CONTROL AGENCY FINDINGS OF FACT
 STATE OF MINNESOTA MINNESOTA POLLUTION CONTROL AGENCY IN THE MATTER OF THE DECISION ON THE NEED FOR AN ENVIRONMENTAL IMPACT STATEMENT FOR THE PROPOSED METROPOLITAN COUNCIL ENVIRONMENTAL SERVICES ST. LOUIS
Minnesota EAW Supplement
 Appendix I: Minnesota EAW Supplement Lower Pool 2 Channel Management Study: Boulanger Bend to Lock and Dam No. 2 Minnesota EAW Item Identification A supplement prepared for the Minnesota DNR to identify
STATE OF MINNESOTA MINNESOTA POLLUTION CONTROL AGENCY FINDINGS OF FACT
 STATE OF MINNESOTA MINNESOTA POLLUTION CONTROL AGENCY IN THE MATTER OF THE DECISION ON THE NEED FOR AN ENVIRONMENTAL IMPACT STATEMENT FOR THE PROPOSED LESTER PRAIRIE WASTEWATER TREATMENT FACILITY EXPANSION
1. Project title NMCWD Eden Prairie Lakes Water Quality Improvement Project, NW and SW Anderson Lakes Drawdown
 Version 2/99 editorial corrections May, 05 ENVIRONMENTAL ASSESSMENT WORKSHEET Note to preparers: This form and EAW Guidelines are available at http://www.eqb.state.mn.us. The Environmental Assessment Worksheet
VIRGINIA POLLUTION ABATEMENT (VPA) PERMIT APPLICATION. FORM B - ANIMAL FEEDING OPERATIONS (AFOs)
 PERMIT APPLICATION. FORM B - ANIMAL FEEDING OPERATIONS (AFOs)") VIRGINIA POLLUTION ABATEMENT (VPA) PERMIT APPLICATION FORM B - ANIMAL FEEDING OPERATIONS (AFOs) Department of Environmental Quality Rev. 02-2013 VIRGINIA POLLUTION ABATEMENT (VPA) PERMIT APPLICATION FORM
VIRGINIA POLLUTION ABATEMENT (VPA) PERMIT APPLICATION FORM B - ANIMAL FEEDING OPERATIONS (AFOs) Department of Environmental Quality Rev. 02-2013 VIRGINIA POLLUTION ABATEMENT (VPA) PERMIT APPLICATION FORM
IOWA LIVESTOCK ENVIRONMENTAL REGULATIONS & MANURE AGREEMENTS
 IOWA LIVESTOCK ENVIRONMENTAL REGULATIONS & MANURE AGREEMENTS IOWA PORK PRODUCERS ASSOCIATION January 23, 2008 Eldon McAfee ANIMAL CAPACITY Animal weight capacity and animal unit capacity Constructed before
SUBCHAPTER 1. INTRODUCTION
 SUBCHAPTER 1. INTRODUCTION Section 252:606-1-2. Definitions [AMENDED] 252:606-1-4. Date of federal regulations incorporated [AMENDED] 252:606-1-2. Definitions In addition to terms defined in Title 27A
Minnesota Pollution Control Agency
 STATE OF MINNESOTA Watershed Division National Pollutant Discharge Elimination System (NPDES)/ State Disposal System (SDS) Permit for a Concentrated Animal Feeding Operation (CAFO) Permit Number MN0070394
Alternative EAW Form for Animal Feedlots ENVIRONMENTAL ASSESSMENT WORKSHEET
 p-ear2-66a Alternative EAW Form for Animal Feedlots ENVIRONMENTAL ASSESSMENT WORKSHEET Note to preparers: This form is authorized for use only for the preparation of Environmental Assessment Worksheets
STATE OF MINNESOTA MINNESOTA POLLUTION CONTROL AGENCY FINDINGS OF FACT
 STATE OF MINNESOTA MINNESOTA POLLUTION CONTROL AGENCY IN THE MATTER OF THE DECISION ON THE NEED FOR AN ENVIRONMENTAL IMPACT STATEMENT FOR THE PROPOSED LONSDALE WASTEWATER TREATMENT FACILITY EXPANSION,
Whatcom County Farm Plan
 Whatcom County Farm Plan Planning Workbook: Checklist and Action Plan For use with the publication: Tips on Land and Water Management For: Land Owner Address Date Introduction Conservation planning means
Alternative EAW Form for Animal Feedlots ENVIRONMENTAL ASSESSMENT WORKSHEET
 Alternative EAW Form for Animal Feedlots ENVIRONMENTAL ASSESSMENT WORKSHEET Note to reviewers: The Environmental Assessment Worksheet (EAW) provides information about a project that may have the potential
WHATCOM COUNTY STANDARD CONSERVATION FARM PLAN PLANNING WORKBOOK: Checklist and Action Plan
 WHATCOM COUNTY STANDARD CONSERVATION FARM PLAN PLANNING WORKBOOK: Checklist and Action Plan For use with the publication: Tips on Land and Water Management For: Land Owner Operator Address Date 0 Introduction
WHATCOM COUNTY STANDARD FARM CONSERVATION PLAN PLANNING WORKBOOK: Checklist and Action Plan
 WHATCOM COUNTY STANDARD FARM CONSERVATION PLAN PLANNING WORKBOOK: Checklist and Action Plan For use with the publication: Tips on Land and Water Management For: Land Owner Address Date Introduction Conservation
Appendix X: Non-Point Source Pollution
 Appendix X: Non-Point Source Pollution Sources Nonpoint source of pollution, unlike pollution from industrial and sewage treatment plants, comes from many different sources. Nonpoint source pollution is
for The Minnesota Pollution Control Agency
 STATE OF MINNESOTA Regional Division Page 1 of 67 Minnesota Pollution Control Agency National Pollutant Discharge Elimination System (NPDES)/ State Disposal System (SDS) Permit for a Concentrated Animal
APPENDIX D CONCENTRATED ANIMAL FEEDING OPERATION REGULATIONS
 89 Intent APPENDIX D CONCENTRATED ANIMAL FEEDING OPERATION REGULATIONS An adequate supply of healthy livestock, poultry and other animals is essential to the well-being of county citizens and the State
STATE OF MINNESOTA MINNESOTA POLLUTION CONTROL AGENCY FINDINGS OF FACT
 STATE OF MINNESOTA MINNESOTA POLLUTION CONTROL AGENCY IN THE MATTER OF THE DECISION ON THE NEED FOR AN ENVIRONMENTAL IMPACT STATEMENT FOR THE PROPOSED EAGLE BEND WASTEWATER TREATMENT FACILITY IMPROVEMENTS
STATE OF MINNESOTA MINNESOTA POLLUTION CONTROL AGENCY FINDINGS OF FACT
 p-ear2-20b STATE OF MINNESOTA MINNESOTA POLLUTION CONTROL AGENCY IN THE MATTER OF THE DECISION ON THE NEED FOR AN ENVIRONMENTAL IMPACT STATEMENT FOR THE PROPOSED LONG PRAIRIE MUNICIPAL WASTEWATER TREATMENT
Manure Management Manual Revisions
 Manure Management Manual Revisions Jim Spontak PA DEP Farms In PA 63,136 farms in PA 33813 have livestock Average farm is 124 acres, about 75% under 200 acres Women as the primary farm operator increased
The Rules and Regulations for Water Quality Control, Chapter September 15, 2003
 The Rules and Regulations for Water Quality Control, Chapter 391-3-6 September 15, 2003 391-3-6-.21 Animal (Non-Swine) Feeding Operation Permit Requirements (1) Purpose. The purpose of this paragraph 391-3-6-.21
Section 1 - General Information (All farms must complete this section)
") Section 1 - General Information (All farms must complete this section) This section includes a contact information page for the plan listing the farm name and address, the plan preparer name and address
Section 1 - General Information (All farms must complete this section) This section includes a contact information page for the plan listing the farm name and address, the plan preparer name and address
The Minnesota Livestock Producer s Guide to Feedlot Rules
 The Minnesota Livestock Producer s Guide to Feedlot Rules Overview of the Feedlot Rules, Minnesota Rules, Chapter 7020 This guide is intended to help livestock producers better understand environmental
REDWOOD COUNTY ZONING ORDINANCE SECTION 17 FEEDLOT REGULATIONS SUBDIVISION 3. CONDITIONAL USE PERMITS 4
 REDWOOD COUNTY ZONING ORDINANCE SECTION 17 FEEDLOT REGULATIONS TABLE OF CONTENTS PAGE SUBDIVISION 1. APPLICATION 1 SUBDIVISION 2. STANDARDS FOR ALL FEEDLOT OPERATIONS 1 SUBDIVISION 3. CONDITIONAL USE PERMITS
TABLE OF CONTENTS CHAPTER STATUTORY AUTHORIZATION...
 TABLE OF CONTENTS CHAPTER 1... 1 STATUTORY AUTHORIZATION... 1 Subdivision 1. Adoption by Reference of State Regulations.... 1 Subdivsion 2. Adoption by Reference of State Regulations.... 1 CHAPTER 2...
COON CREEK WATERSHED DISTRICT PERMIT REVIEW. Spring Lake Park Schools Westwood Middle School st Avenue NE, Spring Lake Park, MN 55432
 PAN 16-112, Westwood Middle School, Page 1 of 6 COON CREEK WATERSHED DISTRICT PERMIT REVIEW MEETING DATE: August 22, 2016 AGENDA NUMBER: 10 FILE NUMBER: 16-112 ITEM: Westwood Middle School RECOMMENDATION:
ENVIRONMENTAL ASSESSMENT WORKSHEET
 ENVIRONMENTAL ASSESSMENT WORKSHEET Note to reviewers: The Worksheet (EAW) provides information about a project that may have the potential for significant environmental effects. This EAW was prepared by
Agricultural/Rural Riparian Buffer Analysis
 Agricultural/Rural Riparian Buffer Analysis December 2014 Executive Summary The Agricultural/Rural Riparian Buffer Analysis was developed from a 2014 analysis of current requirements for the riparian areas
Manure Management Milk Shake Dairy Ken Johnson Cache County, Utah
 Manure Management Milk Shake Dairy Ken Johnson Cache County, Utah Purpose: To provide the site specifications necessary to properly utilize manure generated on the Milk Shake Diary owned and operated by
STATE OF MINNESOTA MINNESOTA POLLUTION CONTROL AGENCY FINDINGS OF FACT. St. Francis Wastewater Treatment Facility Project Description
 p-ear2-78b STATE OF MINNESOTA MINNESOTA POLLUTION CONTROL AGENCY IN THE MATTER OF THE DECISION ON THE NEED FOR AN ENVIRONMENTAL IMPACT STATEMENT FOR THE PROPOSED ST. FRANCIS WASTEWATER TREATMENT FACILITY
NUTRIENT MANAGEMENT (ac.) CODE 590
 CODE 590") IG-590-1 NATURAL RESOURCES CONSERVATION SERVICE CONSERVATION PRACTICE INSTALLATION GUIDELINES NUTRIENT MANAGEMENT (ac.) CODE 590 GUIDELINES APPLICABLE FOR ALL PURPOSES Nutrient management activities shall
IG-590-1 NATURAL RESOURCES CONSERVATION SERVICE CONSERVATION PRACTICE INSTALLATION GUIDELINES NUTRIENT MANAGEMENT (ac.) CODE 590 GUIDELINES APPLICABLE FOR ALL PURPOSES Nutrient management activities shall
2nd Bulletin of the Minnesota Agriculture Water Quality Certification Program and Assessment Tool
 2nd Bulletin of the Minnesota Agriculture Water Quality Certification Program and Assessment Tool What s in this bulletin? May 2014 1. Soil hydrologic group and tile drainage 2. Irrigation scoring 3. Alternative
REVISOR JRM/JC RD4337
 1.1 Department of Agriculture 1.2 Proposed Permanent Rules Relating to Groundwater Protection 1.3 1573.0010 DEFINITIONS. 1.4 Subpart 1. Scope. The terms used in this chapter have the meanings given them
South Fish Creek Watershed Animal Waste Storage and Management
 Chapter 7 South Fish Creek Watershed Animal Waste Storage and Management FINDINGS: The Bayfield County Board of Supervisors makes the following findings: 1. The predominant farmed soils in Bayfield County
Lincoln County Verdi Township Spring Creek Watershed Survey
 D:\fanmap\mda\verdi\data\report\report1.doc Date of last update 6/2/98 Printing date-1/11/02 Lincoln County Verdi Township Spring Creek Watershed Survey For additional information, contact: Denton Bruening
GLASI GLASI. Priority Subwatershed Project. Great Lakes Agricultural Stewardship Initiative
 GLASI GLASI Great Lakes Agricultural Stewardship Initiative Priority Subwatershed Project Wigle Creek Priority Subwatershed Project Essex Region Conservation Authority Up to $75,000 per eligible farm business
STATE OF MINNESOTA MINNESOTA POLLUTION CONTROL AGENCY FINDINGS OF FACT FACILITY HISTORY
 STATE OF MINNESOTA MINNESOTA POLLUTION CONTROL AGENCY IN THE MATTER OF THE DECISION ON THE NEED FOR AN ENVIRONMENTAL IMPACT STATEMENT FOR THE PROPOSED HOWARD LAKE WASTEWATER TREATMENT IMPROVEMENTS PROJECT
STATE OF MINNESOTA MINNESOTA POLLUTION CONTROL AGENCY FINDINGS OF FACT
 STATE OF MINNESOTA MINNESOTA POLLUTION CONTROL AGENCY IN THE MATTER OF THE DECISION ON THE NEED FOR AN ENVIRONMENTAL IMPACT STATEMENT FOR THE PROPOSED FLINT HILLS RESOURCES, LP - ULTRA LOW SULFUR DIESEL
COMPREHENSIVE NUTRIENT MANAGEMENT PLAN REVIEW CHECKLIST FOR CERTIFIED CNMP PROVIDERS
 Customer Name: CNMP Preparer s Name: CNMP Reviewer s Name and Date: COMPREHENSIVE NUTRIENT MANAGEMENT PLAN REVIEW CHECKLIST FOR CERTIFIED CNMP PROVIDERS COMPONENT Yes No NA 1. Overview - Brief statement
Manure Management on the Urban Fringe
 Manure Management on the Urban Fringe Section A: Traffic and Manure Hauling Farmers have told us about a number of problems that they have had managing manure on the urban fringe. This first series of
INTENSIVE LIVESTOCK, DAIRY, POULTRY FACILITIES
 PAGE 23: 1 ARTICLE 23 INTENSIVE LIVESTOCK, DAIRY, POULTRY FACILITIES 3-510 INTENT It is the intent of this Article to preserve the agricultural character of King and Queen County, to protect the health,
Title 130 Livestock Waste Control Regulations: Summary of Land Application Requirements Amended Effective October 4, 2011
 Title 130 Livestock Waste Control Regulations: Summary of Land Application Requirements Amended Effective October 4, 2011 References to land application of animal manures were extracted from Title 130
TO INTERESTED PARTIES: RE: Chippewa Valley Ethanol Company Expansion
 TO INTERESTED PARTIES: RE: The Minnesota Pollution Control Agency (MPCA) has approved the,, and Order for the Environmental Assessment Worksheet (EAW) on the proposed Project, Swift County. The Findings
Fact Sheet #7 Reducing the Risk of Groundwater Contamination by Improving Livestock Waste Storage
 Fact Sheet #7 Reducing the Risk of Groundwater Contamination by Improving Livestock Waste Storage N E W M E X I C O FARM A SYST Farmstead Assessment System Fact Sheet #7 Reducing the Risk of Groundwater
Manure Application Setback Comparisons in the EPA Region 7: The National Setbacks Database
 Manure Application Setback Comparisons in the EPA Region 7: The National Setbacks Database Manure Application Setbacks: What do We Mean? Defined as the distance from the identified sensitive area where
"Closure plan" means the plan approved by the Division for clean up and closure of the AFO and associated waste storage and disposal facilities.
 391-3-6-.21 Animal Feeding Operation Permit Requirements.* Amended. (1) Purpose. The purpose of this paragraph 391-3-6-.21 is to provide for the uniform procedures and practices to be followed relating
Agronomy Facts 40 Nutrient Management Legislation in Pennsylvania: A Summary of the 2006 Regulations
 Agronomy Facts 40 Nutrient Management Legislation in Pennsylvania: A Summary of the 2006 Regulations Introduction In spring 1993, the Pennsylvania Nutrient Management Act (Act 6) became law. On October
COON CREEK WATERSHED DISTRICT PERMIT REVIEW. KTJ 314, LLC Blaine, MN 55449
 18-118 ABRA Auto Body, Page 1 of 8 COON CREEK WATERSHED DISTRICT PERMIT REVIEW MEETING DATE: August 13, 2018 AGENDA NUMBER: 14 FILE NUMBER: 18-118 ITEM: ABRA Auto Body RECOMMENDATION: Approve with 6 Stipulations
STATE OF MINNESOTA MINNESOTA POLLUTION CONTROL AGENCY
 p-ear2-101b STATE OF MINNESOTA MINNESOTA POLLUTION CONTROL AGENCY IN THE MATTER OF THE DECISION ON THE NEED FOR AN ENVIRONMENTAL IMPACT STATEMENT FOR THE PROPOSED JOE WAGNER FEEDLOT MILLERVILLE TOWNSHIP
VIRGINIA POLLUTION ABATEMENT APPLICATION FORM D MUNICIPAL EFFLUENT AND BIOSOLIDS
 VIRGINIA POLLUTION ABATEMENT APPLICATION FORM D MUNICIPAL EFFLUENT AND BIOSOLIDS PART D-II LAND APPLICATION OF BIOSOLIDS All of the information provided in this application will become part of the Biosolids
Model Riparian Buffer Ordinance.
 Model Riparian Buffer Ordinance. This is a sample riparian buffer ordinance written as an amendment to an existing zoning ordinance. This ordinance complies with the state minimum standards for river corridor
Controlling runon and runoff:
 Chapter 8. Surface Water Management This chapter explores: runon and runoff what they are, and the risks associated with them. various management options runon reductions, runoff catchbasins, vegetated