Urban Runoff Literature Review
|
|
|
- Ginger Campbell
- 6 years ago
- Views:
Transcription
1 Urban Runoff Literature Review A presentation to the TMDL group of the Regional Board June 24 th 2002 Lester McKee, Jon Leatherbarrow, Sarah Newland Jay Davis
2 Climate and Hydrology Lester McKee SFEI
3 Summary of Findings The discharge of water from small tributaries is about 4% of the total runoff entering the Bay (about the same as the area ratio (5%)) The ten largest watersheds (ranging in size from 105 to 1,662 km 2 ) make up 75% of the area (Alameda, Coyote, Guadalupe, San Francisquito, Sonoma, Napa, Wooden Valley, Walnut, San Leandro, and San Lorenzo) Rainfall in the region varies from about 250 to 2,000 mm, 90% wet season There is an average of 58 to 67 rain days per year (>0.1 in) Annual rainfall varies from 200% of normal to 40% of normal The region undergoes periods of drought and flood that can last 4-8 years There are also longer term flood dominated and drought dominated periods that can last for several decades or more
4 Between 87 and 99% of the annual runoff occurs from November to April Runoff can vary from 0% of annual rainfall during drought years to 75% of annual rainfall during wet years Inter-annual runoff variation is amongst the highest in the world and urbanization further increases the flashiness of runoff response adding to the difficulties of field monitoring and subsequent modeling an extrapolation The response time of small tributaries ranges from about 5 hours (100 km 2 ) to more than 12 hours for Alameda Creek (1,662 km 2 ) Urbanization increases flow volume, peek flow, and decreases the response time although there are complexities associated with basin configuration A regional scale water budget was constructed using the last 30 years of data and shows that annual runoff volume varies from 180 to 3,930 Mm 3 and averages 918 Mm 3
5
6 Sediment Processes Lester McKee and Sarah Newland SFEI
7 Why is an Understanding of Sediment Processes Important? Suspended sediment loads from local tributaries currently forms about 40% of the sediment load entering the Bay annually and this may be rising Suspended sediment carries with it contaminants such as Hg, PCBs, PAHs, and OCs There is a great relationship between SSC and turbidity SS (mg l -1 ) Turbidity (NTU) Discharge (10 3 Ml d -1 ) Average ( ) X: 16 NTU Flow-weighted: 136 NTU y = 1.790x r 2 = Year Average : 380 mm y : 269 mm y Turbidity (NTU)
8 Conceptual Model Net tectonic uplift Contributing Upland Watershed Lowland Floodplain SF Bay Sediment sources Landslides Sheet and rill erosion 38-64% Headward extension Channel bed and bank aggradation Channel bed and bank erosion 8-60% Agricultural and urban erosion Channel bed and bank aggradation Channel bed and bank erosion Floodplain inundation Sediment delivery to the Bay 7-55% Within channel storage Floodplain storage 47%
9 Available Local Existing Concentration Data The USGS has measured suspended sediment concentrations in streams within the nine-county Bay Area over the past 40+ years at 26 locations. Three locations in Alameda County have >15 years of data. 18 locations have one or more full wet season of data. USGS is presently monitoring six locations: 1. Alameda Ck. at Niles 2. Cull Ck. above Cull Ck. Reservoir 3. San Lorenzo Ck. above Don Castro Reservoir 4. Arroyo de la Laguna near Pleasanton 5. Alameda Ck. below Welch Ck. near Sunol 6. Crow Ck. near Hayward
10 Suspended Sediment Character Peaks in excess of 5,000 mg l -1 at 12 locations - will make the use of surrogate techniques more difficult FWMC calculated in excess of 3000 mg l -1 at 2 locations, 1,000 mg l -1 at 9 out of 17 locations and are greater than 374 mg l -1 at all locations. SSC(mg/L) 120 Cull Ck. above Cull Ck. Reservoir Discharge (m^3/s) At locations where there have been sufficient measurements, grains in suspension are between 67 and 100% finer than 0.62 mm (silts and clays). - Surrogate technologies are likely to work well for these grain sizes % Fines (<62.5 µm) Stations CULL C AB CULL COLMA C A SOUTH ALAMEDA C NR NI SAN LORENZO C A ARROYO VALLE BL NAPA R NR NAPA WILDCAT C AT VA CORTE MADERA C WEST FORK PERMA PESCADERO C NR
11 Seasonal Loads Character Cull Creek (wet season ) Napa River (WY 1979) Wildcat Creek (WY ) October (%) (%) 0 November December January February March April May June July August September
12 Inter-annual Loads Character Non urban / less urban watersheds - 3 to 4 orders of magnitude annual variation SSC (mg/l) Colma Ck., South San Francisco Urbanized areas (if Colma Ck is a good indicator) - 1 to 2 orders of magnitude annual variation Colma Ck. has low discharge variability, and high and variable SSC Percentage of suspended particles finer than mm Discharge (m^3/s) Discharge (m^3/s)
13 Summary and Ramifications for Sampling Contaminants Peak SSC are high but a turbidity threshold sampling technique can overcome this problem. Grain sizes vary during floods but are in the range of acceptability for surrogate techniques. Existing USGS sediment gauging provides an opportunity to sample for contaminants. Several long term data collection sites could be used to interpret less intensive sampling sites and for testing the best extrapolation methods Studies that select for a certain time (for example 3 years) may fail to sample the range of sediment and contaminant response to climatic variation and therefore fail to estimate the average or range of annual loads. - The solution is to selectively sample certain floods for contaminants over a less defined period of time (for example it may take 4 years or five years
14
15 Mercury Literature Review Lester McKee Jon Leatherbarrow Jay Davis SFEI
16 Hg Sources in the Watersheds There are 16 historic mine locations in the Bay Area. Ultramafic serpentinite rocks that are found in all nine counties. Hg is used in the urban environment in common everyday products and devices. This suggests that urban areas with high population will also be likely to have high mercury loads. Hg is transported from naturally occurring deposits and contaminated locations in dissolved, colloidal, and particulate forms. Particulate mercury is conventionally reported as the mass that does not pass through a 0.4 or 0.45µm filter paper. The colloidal fraction can be partitioned out using ultra-filtration leaving the truly dissolved fraction that passes through µm pore size
17 Hg Transport in the Watersheds Based on studies in other parts of the US, particulate Hg is between 69 and 99% of total Hg in the water column of contaminated streams. In agricultural watersheds particulate Hg may only form 37-50% of the total mercury load and organic carbon seems to play a role in transport. Hg Given that colloidal transport make up part of the dissolved phase and colloidal material is detectable using optical sensors, surrogate techniques are likely to be applicable to loading studies for Hg under most circumstances. Field and laboratory techniques must be Clean. This issue will pose a challenge or potential barrier to the use of automated field sampling for mercury. Manual collection be necessary, and extrapolation using relationships with suspended sediment or turbidity are likely to be appropriate. Hg Suspended Sediment Organic Carbon
18 Hg Transport in the Watersheds 2 Concentrations of suspended particulate matter and %OC in particles has been found to influence the partitioning of mercury between dissolved and particulate forms. Log k d SPM Log k d %POC Catastrophic events such as large rainstorms, and landslides or tailings dam failures can occur. These rare events may cause the majority of loads. Total mercury concentration can be expected to vary by 2-3 orders of magnitude during storm events. Total mercury concentrations in undisturbed rural watersheds are likely to be 3-10 ng l -1. Hg concentration is likely to be 30 times greater in urban and mixed urban and agricultural watersheds and more than 500 times greater at historic mine sites
19 Hg Character for Different Land Uses Concentration in different land uses Gambonini mine (18) Abandoned mercury mines (17) Cache Ck. Mining (16) 70% urban, New Almaden mining district (15) 28% urban, 20% Agriculture (14) Nyanza chemical dump super fund (13) 1% urban, 31% Agriculture (12) 100% urban (11) Mostly Urban (10) 61% Agriculture (9) Mostly Urban (8) 2% urban, 35% Agriculture (7) 83% Agriculture (6) Mostly undisturbed, 12% Agriculture (5) 1% urban, 27% Agriculture (4) Dam (3) Undisturbed rural (2) Undisturbed rural (1) Cache Ck. Mining (16) Gambonini mine (18) Abandoned mercury mines (17) 70% urban, New Almaden mining district (15) Nyanza chemical dump super fund (13) 1% urban, 27% Agriculture (4) 1% urban, 31% Agriculture (12) 28% urban, 20% Agriculture (14) Dam (3) Mostly Urban (8) 2% urban, 35% Agriculture (7) 100% urban (11) 61% Agriculture (9) Mostly Urban (10) 83% Agriculture (6) Undisturbed rural (1) Undisturbed rural (2) Mostly undisturbed, 12% Agriculture (5) Maximum recorded Total Hg (ng/l) Concentration variation in different land uses Concentration variation (maximum/minimum)
20 Loads Variation Monthly loads in the Central Valley have been found to vary by 129 to 292 times from the wettest month to the driest month. Daily loads in watersheds can vary by upward of 1000 times. Given the relationship between Hg and suspended sediment, it is likely that 90% or more of the annual load will be transported during the wet season during short lived flood events.
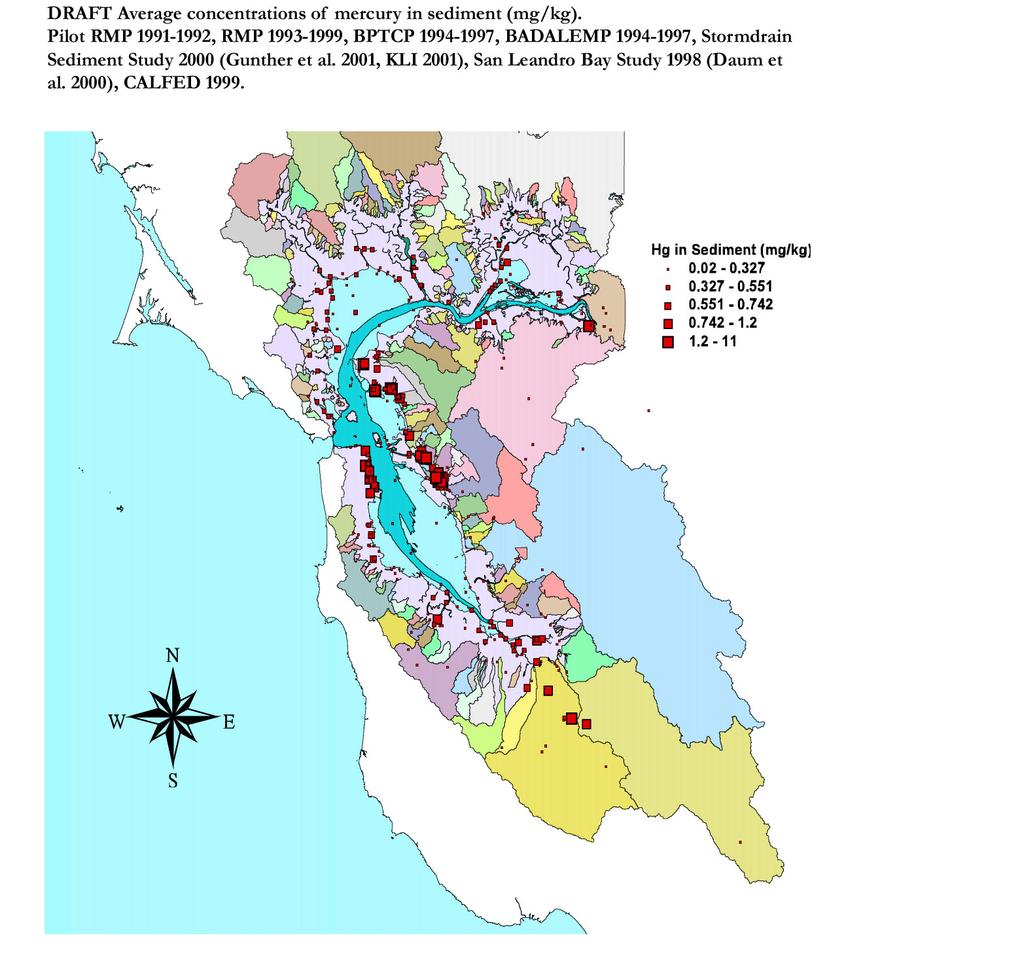
21 Concentrations in Sediments
22 Recommendations for the Use Bed Sediment Concentrations The ratio of concentrations in suspended sediment : bed sediment were found to be 0.2 to 31.4 Given the variety of chemical and geomorphic processes that may occur during the source activation, transport, deposition, and period of time since deposition we recommend: The use of bed sediment concentrations for watershed characterization has a low sensitivity Bed sediment concentrations will not be useful as a trend indicator The use of bed sediment data for loads calculations will have indeterminable errors and bias
23 Summary and Recommendations Where to measure Given the distribution of mercury sources and climatic influences, it is recommended that sampling for loads concentrate on: 1. Guadalupe River (for mining and urban loads characterization) 2. Napa River (for mining and rural / background loads characterization) Should resources be available, further studies should be initiated in: 3. Petaluma (for mining and rural / background loads characterization) 4. Carquinez (for mining loads characterization under low rainfall conditions) 5. San Mateo (for mining and urban loads characterization) 6. Alameda (for urban loads characterization under low rainfall conditions)
24 When to measure? November and April First flush process when studying both urban and rural watersheds Studies should be reactive given watersheds in the Bay Area are flashy Monthly intervals throughout the year using (similar to the USGS Central Valley sampling program) for seasonal and spatial characterization
25 What to measure? Given watersheds in the Bay Area have very high suspended sediment concentrations and loads, mercury studies should concentrate resources on: Total Hg Particulate Hg SSC, TOC, POC, DOC Given the direct impact of methyl Hg, studies should supply more limited resources to determining what proportion of total mercury loads are in methylated forms: Particulate methyl mercury Dissolved methyl mercury
Watershed Modeling of Copper Loads to San Francisco Bay
 Watershed Modeling of Copper Loads to San Francisco Bay Tony Donigian AQUA TERRA Consultants Brake Pad Partnership Stakeholder Conference July 31, 2007 Watershed Model Objectives - Provide daily loadings
A Review of Urban Runoff Processes in the Bay Area:
 San Francisco Estuary Regional Monitoring Program for Trace Substances A Review of Urban Runoff Processes in the Bay Area: Existing Knowledge, Conceptual Models, and Monitoring Recommendations Lester McKee
Rainfall, runoff and sediment transport in the Napa River watershed: now and a possible future
 Rainfall, runoff and sediment transport in the Napa River watershed: now and a possible future Lester McKee San Francisco Estuary Institute 5/24/2017 1 The importance of the natural water cycle of infiltration
2008 AWRA Spring Specialty Conference March 17-19, 2008
 THE SAN FRANCISCO BAY WATERSHED MODEL FOR COPPER RUNOFF FROM BRAKE PAD WEAR DEBRIS: Part II Model Application and Results Anthony S. Donigian, Jr., Brian R. Bicknell, James N. Carleton, and Kirsten Sinclair
Copper and Solids Removed Via Street Sweeping 3/27/07. Kirsten Sinclair Rosselot Prepared for the Brake Pad Partnership
 and Solids Removed Via Street Sweeping 3/27/07 Kirsten Sinclair Rosselot Prepared for the Brake Pad Partnership The Brake Pad Partnership is conducting a study whose purpose is to gain a better understanding
Sources and transport of mercury and methylmercury in rivers and streams of the Upper Mississippi River watershed
 NIMD Forum 21 February 4-5, 21 Sources and transport of mercury and methylmercury in rivers and streams of the Upper Mississippi River watershed Steven J. Balogh Metropolitan Council Environmental Services
Predicting Wildland Fire Impacts on Public Drinking Water
 Predicting Wildland Fire Impacts on Public Drinking Water William B. Samuels 1 Douglas Ryan 2, Kevin Hyde 3, William Elliott 4, David Calkin 5, Kelly Burnett 6, Dan Miller 7 and Deborah Martin 8 1 SAIC,
City of Daphne, Alabama Water Quality Monitoring Plan For Phase II MS4
 City of Daphne, Alabama Water Quality Monitoring Plan For Phase II MS4 2016-2021 Permit # ALR 040039, Expiration Date: September 30, 2021 I. Introduction This document presents the City of Daphne s Stormwater
Concentrations and Loads of Mercury, PCBs, and OC Pesticides Associated with Suspended Sediments in the Lower Guadalupe River, San Jose, California
 San Francisco Estuary Institute Regional Watershed Program Concentrations and Loads of Mercury, PCBs, and OC Pesticides Associated with Suspended Sediments in the Lower Guadalupe River, San Jose, California
Delta Mercury Tributary Council May 7, 2013 Izzy Martin and Bob Schneider. Water Bonds and Mercury Remediation in the Sierra and Coast Range
 Delta Mercury Tributary Council May 7, 2013 Izzy Martin and Bob Schneider Water Bonds and Mercury Remediation in the Sierra and Coast Range Questions? 1. Do we have the facts correct? 2. Who should administer
CHAPTER 1 INTRODUCTION. Stream processes are strongly related to the physical conditions of the
 1 CHAPTER 1 INTRODUCTION Stream processes are strongly related to the physical conditions of the watershed from which they flow. Alterations to physical conditions of a watershed manifest themselves through
Is this the right tool for your needs? Lester McKee San Francisco Estuary Institute (SFEI) May 2001
 May 2001") The use of the Simple Model for informing environmental science and management: Is this the right tool for your needs? Lester McKee San Francisco Estuary Institute (SFEI) May 2001 Fact: Field data collection
The use of the Simple Model for informing environmental science and management: Is this the right tool for your needs? Lester McKee San Francisco Estuary Institute (SFEI) May 2001 Fact: Field data collection
Malakoff Diggins State Historic Park Humbug Creek Watershed Assessment and Management Recommendations DRAFT. Presentation to DTMC January 15, 2014
 Malakoff Diggins State Historic Park Humbug Creek Watershed Assessment and Management Recommendations DRAFT Presentation to DTMC January 15, 2014 Legacy Mines in California Map by California Department
Sediment flux through the Golden Gate during the high flows of 2016 and 2017
 NOTE: This information is preliminary and is subject to revision. It is being provided to meet the need for timely best science. The information is provided on the condition that neither the U.S. Geological
Contents Chapter 1: Introduction Chapter 2: Identification and Description of Santa Clara Basin Watershed
 Contents Chapter 1: Introduction 1.1 Background and Purpose... 1 1 1.2 Goals and Elements of the SWRP... 1 2 1.3 Previous and Current Planning Efforts... 1 3 1.3.1 Regional Plans... 1 3 1.3.2 Local Watershed
Attachment 4-1. Table 4-1. FY SCVURPPP monitoring plan for Santa Clara Basin Watersheds 1.
 Watershed Area Coyote Creek Chemical Quarter in FY 07-08 Data Type 2 1st 2nd 3rd 4th Rationale Lead Agency Contaminants- 3 S(10) General Water Quality 4 S(20) Biological Toxicity- 5 S(10) Pathogen Indicator
1.1 MONITORING PROGRAM OBJECTIVES The major objectives of the Monitoring Program outlined in the Municipal Stormwater Permit are to:
 1.1 MONITORING PROGRAM OBJECTIVES The major objectives of the Monitoring Program outlined in the Municipal Stormwater Permit are to: Assess compliance with the Los Angeles County Municipal Stormwater Permit
Small Tributaries Loading Strategy Multi-Year Plan
 Small Tributaries Loading Strategy Multi-Year Plan 0 0 Contents Small Tributaries Loading Strategy Multi-Year Plan... i Acknowledgments... ii Introduction... Background... Management Questions and Strategy
Recommendations for future characterization. Lester McKee San Francisco Estuary Institute. Mallard Island data supplied by David Schoellhamer USGS
 Sediment And Pollutant Transport From The Sacramento / San Joaquin Delta During Large Resuspension Events: Recommendations for future characterization. Lester McKee San Francisco Estuary Institute Mallard
Newtown Creek Superfund Site Point Sources Sampling CAG Meeting March 22, 2016
 Newtown Creek Superfund Site Point Sources Sampling CAG Meeting March 22, 2016 CSTAG Meeting May 19-20, 2014 May 19, 2015 1 Objectives Define point source discharge for the study area Discuss the purpose
Prepared in Cooperation with: the Houston Galveston Area Council and the Texas Commission on Environmental Quality. By Lee Bodkin and Jeannette Oden
 Surrogate Relationship Development of Suspended Sediment and Total Suspended Solids Utilizing Turbidity and Streamflow Data in the West Fork San Jacinto River, near Conroe, Texas, July 2008 August 2009
There is a reliable, clean water supply for current and future generations.
 E2 There is a reliable, clean water supply for current and future generations. E2.1. Current and future water supply for municipalities, industries, agriculture, and the environment is reliable. 2.1.1.
Turbidity-controlled suspended sediment sampling
 Summer 1996 Turbidity-controlled suspended sediment sampling Jack Lewis and Rand Eads Pacific Southwest Research Station, USDA-Forest Service, Arcata, California For estimating suspended sediment concentration
Watershed Modeling of Copper Runoff to San Francisco Bay from Brake Pad Wear Debris
 ABSTRACT Watershed Modeling of Copper Runoff to San Francisco Bay from Brake Pad Wear Debris Anthony S. Donigian Jr. 1, Brian R. Bicknell 1, and Kirsten Sinclair Rosselot 2 1 AQUA TERRA Consultants and
Qian Zhang (UMCES / CBPO) Joel Blomquist (USGS / ITAT)
 Joel Blomquist (USGS / ITAT)") CBP STAC Water Clarity Workshop Solomons, MD, 02/06/2017 Long-term Riverine Inputs from Major Tributaries to Chesapeake Bay Relevant to Water Clarity Qian Zhang (UMCES / CBPO) Joel Blomquist (USGS / ITAT)
CBP STAC Water Clarity Workshop Solomons, MD, 02/06/2017 Long-term Riverine Inputs from Major Tributaries to Chesapeake Bay Relevant to Water Clarity Qian Zhang (UMCES / CBPO) Joel Blomquist (USGS / ITAT)
Hydromodification Management Measures
 Chapter 7 Hydromodification Management Measures This Chapter summarizes the requirements for controlling erosive flows from development projects. 7.1 Why Require Hydromodification Management? Changes in
Hydromodification Management Measures
 Chapter 7 Hydromodification Management Measures This Chapter summarizes the requirements for controlling erosive flows from development projects. 7.1 Why Require Hydromodification Management? Changes in
SANTA CLARA VALLEY WATER DISTRICT. Safe Clean Water and Natural Flood Protection Program
 SANTA CLARA VALLEY WATER DISTRICT Safe Clean Water and Natural Flood Protection Program Prioritization and Implementation of Pollution Prevention and Reduction Activities Plan to Address Impaired Water
How Effective Are Sediment and Turbidity Reduction Projects in the Stony Clove Creek Watershed?
 How Effective Are Sediment and Turbidity Reduction Projects in the Stony Clove Creek Watershed? CATSKILL ENVIRONMENTAL RESEARCH MONITORING CONFERENCE OCTOBER 27, 2016 Danyelle Davis (NYCDEP) Jason Siemion
Cost-Effective, Applicable Monitoring Approaches to Address the Resource Objectives of the North Bay Watershed Association
 WATERSHEDS SCIENCE PROGRAM Cost-Effective, Applicable Monitoring Approaches to Address the Resource Objectives of the North Bay Watershed Association A report prepared by San Francisco Estuary Institute
Watershed Modeling of Copper Loads to San Francisco Bay
 - DRAFT - Watershed Modeling of Copper Loads to San Francisco Bay Prepared by A. S. Donigian, Jr. B. R. Bicknell AQUA TERRA Consultants 2685 Marine Way, Suite 1314 Mountain View, CA 94043 Submitted to
Field Evaluation of a Stormceptor Model STC 1200 Westwood, Massachusetts. Prepared by: Stormceptor Group of Companies
 F I E L D M O N I T O R I N G Field Evaluation of a Stormceptor Model STC 1200 Westwood, Massachusetts Prepared by: Stormceptor Group of Companies June, 2004 Field Monitoring Evaluation of a Westwood,
Summary of Water Monitoring Data
 Clay County Drainage Site Summary of Water Monitoring Data 2011 2015 Introduction The Red River Valley in northwestern Minnesota is experiencing an increase in the amount of agricultural subsurface drainage
fcgov.com/water-quality Water Quality Update Summer 2017 Monitoring and Protecting Our Water Sources
 Water Quality Update Summer 217 Monitoring and Protecting Our Water Sources SOURCE WATER MONITORING The Upper Cache la Poudre (UCLP) Watershed Collaborative Monitoring Program was established in 28 between
RMP Small Tributaries Loading Strategy
 RMP Small Tributaries Loading Strategy by L. McKee A. Feng C. Sommers R. Looker CONTRIBUTION NO. 585 DECEMBER 2009 SAN FRANCISCO ESTUARY INSTITUTE 4911 Central Avenue, Richmond, CA 94804 p: 510-746-7334
Turbidity Threshold Sampling in Watershed Research
 Turbidity Threshold Sampling in Watershed Research Rand Eads, Jack Lewis Abstract When monitoring suspended sediment for watershed research, reliable and accurate results may be a higher priority than
Sarah Connick, Project Manager, Sustainable Conservation
 Date: May 20, 2006 To: From: Subject: Sarah Connick, Project Manager, Sustainable Conservation Alexis Dufour, Terry Cooke Brake Pad Partnership (BPP), Land Use Land Cover Analysis for Watershed Modeling
Stream Management Master Plan (SMMP): An Updated Regional Vision for Integrated Flood Management
: An Updated Regional Vision for Integrated Flood Management") Stream Management Master Plan (SMMP): An Updated Regional Vision for Integrated Flood Management Jeff Tang, Zone 7 Water Agency, jtang@zone7water.com Elke Rank, Zone 7 Water Agency, erank@zone7water.com
Stream Management Master Plan (SMMP): An Updated Regional Vision for Integrated Flood Management Jeff Tang, Zone 7 Water Agency, jtang@zone7water.com Elke Rank, Zone 7 Water Agency, erank@zone7water.com
How does sediment affect fish and macroinvertebrates?
 How does sediment affect fish and macroinvertebrates? How does sediment affect fish and macroinvertebrates? Suspended sediment (TSS): breathing, vision Sediment on streambed: egg development living space
CONTRIBUTION NO. 876 / July 2018 SAN FRANCISCO ESTUARY INSTITUTE CLEAN WATER PROGRAM/RMP 4911 CENTRAL AVE., RICHMOND, CA
 Statistical Methods Development and Sampling Design Optimization to Support Trends Analysis for Loads of Polychlorinated Biphenyls from the Guadalupe River in San Jose, California, USA Prepared by Aroon
Mercury transport and transformation at the Black Butte Mine Superfund Site
 Mercury transport and transformation at the Black Butte Mine Superfund Site Eckley, CS 1, Luxton, T 2, Schenk, L 3, McKernan, J 2, Goulet, J 1, Lynch, K 1, Muza, R 1 1. EPA R-10 2. EPA ORD National Risk
Jordan River Total Maximum Daily Load (TMDL) Phase 1
 Phase 1") Jordan River Total Maximum Daily Load (TMDL) Phase 1 Presentation at Salt Lake County Watershed Symposium September 27, 2012 http://www.waterquality.utah.gov/tmdl/jordan_tmdl.htm What causes low oxygen
Jordan River Total Maximum Daily Load (TMDL) Phase 1 Presentation at Salt Lake County Watershed Symposium September 27, 2012 http://www.waterquality.utah.gov/tmdl/jordan_tmdl.htm What causes low oxygen
From Coal Country to the Chesapeake:
 From Coal Country to the Chesapeake: USGS Water Science in West Virginia and Virginia John Jastram USGS Virginia & West Virginia Water Science Center What we do Operate streamgages, observation wells,
Hydrology and Water Quality. Water. Water 9/13/2016. Molecular Water a great solvent. Molecular Water
 Hydrology and Water Quality Water Molecular Water Exists as an equilibrium But equilibrium altered by what is dissolved in it Water Molecular Water a great solvent In reality, water in the environment
Hydrology and Water Quality. Water. Water 9/11/2018. Molecular Water a great solvent. Molecular Water
 Hydrology and Water Quality Water Molecular Water Exists as an equilibrium But equilibrium altered by what is dissolved in it Water Molecular Water a great solvent In reality, water in the environment
San Francisco Public Utilities Commission Hydrological Conditions Report For May 2017 J. Chester, C. Graham, & M. Tsang, June 5, 2017
 San Francisco Public Utilities Commission Hydrological Conditions Report For May 2017 J. Chester, C. Graham, & M. Tsang, June 5, 2017 High inflows increased inflows to and releases from Hetch Hetchy. The
River transport and chemistry. Lecture Outline
 OCN 401 Biogeochemical Systems (10.12.17) (Schlesinger & Bernhardt: Chapter 8) River transport and chemistry Lecture Outline 1. Introduction Overview 2. Soil Hydraulics & Stream Hydrology 3. Stream Load
RMP Sources, Pathways, and Loadings Workgroups Meeting October 24 th, 2012 San Francisco Estuary Institute Meeting Summary
 RMP Sources, Pathways, and Loadings Workgroups Meeting October 24 th, 2012 San Francisco Estuary Institute Meeting Summary In Attendance: Arleen Feng (ACCWP for BASMAA) Roger Bannerman (WI DNR) Jan O Hara
Conceptual Model to Support PCB Management and Monitoring in the Emeryville Crescent Priority Margin Unit
 Conceptual Model to Support PCB Management and Monitoring in the Emeryville Crescent Priority Margin Unit Prepared by Jay A. Davis, Donald Yee, Alicia N. Gilbreath, and Lester J. McKee San Francisco Estuary
The Hydrosphere. Introduction To Surface Water. What Do You Think?
 Introduction To Surface Water Unit Essential Questions: How does the Earth cycle its water through its major reservoirs? How does society s use of resources affect water quality? Presentation Objectives:
River transport and chemistry
 OCN 401 Biogeochemical Systems (10.15.15) (Schlesinger & Bernhardt: Chapter 8) River transport and chemistry Lecture Outline 1. Introduction - Overview 2. Soil Hydraulics & Stream Hydrology 3. Stream Load
Trends in water quality across Ohio watersheds
 Trends in water quality across Ohio watersheds Laura Johnson and Ken Krieger Ohio Water Resources Council Workgroup for Water Resources Monitoring 1 March 1 Heidelberg Tributary Loading Program 1 stations
Water Quantity and Quality in Chaparral Region Streams
 Water Quantity and Quality in Chaparral Region Streams Christopher Solek, Council for Watershed Health 2 nd Southern CA Chaparral Symposium, June 8-10 2015 Creeks Named Chaparral in USA Bonneville Co.,
Water Supply Board Briefing. Water Operations Department March 22, 2016
 Water Supply Board Briefing Water Operations Department March 22, 2016 Water Supply Briefing California Water Supply District Water Supply Water Supply Projections Water Supply Schedule 2 California Water
10. INDEX. South Bay Salt Pond Restoration Project December 2007 Final Environmental Impact Statement/Report
 10. INDEX A Adaptive management, ES-4, ES-17, ES-18, ES-20, ES-54, ES-55, ES-56, 1-23, 3.1-5, 3.1-6, 3.3-45, 3.3-51, 3.3-52, 3.3-53, 3.3-55, 3.3-64, 3.3-65, 3.3-71, 3.4-25, 3.4-30, 3.4-45, 3.4-56, 3.4-58,
DEVELOPMENT OF A HYDRO-GEOMORPHIC MODEL FOR THE LAGUNA CREEK WATERSHED
 DEVELOPMENT OF A HYDRO-GEOMORPHIC MODEL FOR THE LAGUNA CREEK WATERSHED Agenda Background Hydro-Geomorphic Modeling Methodology HEC-HMS Modeling How is the Model Used Background Proposition 50 Grant Funding
AGENDA DATE: November 14, 2018
 ALAMEDA COUNTY FLOOD CONTROL AND WATER CONSERVATION DISTRICT, ZONE 7 100 NORTH CANYONS PARKWAY, LIVERMORE, CA 94551 PHONE (925) 454-5000 FAX (925) 454-5727 ORIGINATING SECTION: INTEGRATED PLANNING CONTACT:
Phase II Assessment Potential Impacts of Uranium Mining in Virginia on Drinking Water Sources
 Phase II Assessment Potential Impacts of Uranium Mining in Virginia on Drinking Water Sources EXECUTIVE SUMMARY February 202 Executive Summary There is interest in mining and milling a large uranium reserve
Monitoring Stormwater Best Management Practices: Why Is It Important and What To Monitor
 Monitoring Stormwater Best Management Practices: Why Is It Important and What To Monitor Scott D. Struck, Ph.D. US EPA, Urban Watershed Management Branch New Jersey Water Monitoring Workshop 4/20/2006
Diazinon and Pesticide-Related Toxicity in Bay Area Urban Creeks
 Diazinon and Pesticide-Related Toxicity in Bay Area Urban Creeks Water Quality Attainment Strategy and Total Maximum Daily Load (TMDL) Proposed Basin Plan Amendment and Staff Report Drawing provided by
A Preliminary Assessment of Potential Impacts of Uranium Mining in Virginia on Drinking Water Sources
 A Preliminary Assessment of Potential Impacts of Uranium Mining in Virginia on Drinking Water Sources EXECUTIVE SUMMARY January 28, 2011 ES-0 Executive Summary A large uranium reserve, estimated to be
Groundwater and Groundwater Surface Water Interaction: How Does It Work?
 Napa Valley Groundwater Advisory Committee February 23, 2012 Groundwater and Groundwater Surface Water Interaction: How Does It Work? Thomas Harter University of California, Davis ThHarter@ucdavis.edu
Sediment and nutrient generation rates for Queensland rural catchments an event monitoring program to improve water quality modelling
 Sediment and nutrient generation rates for Queensland rural catchments an event monitoring program to improve water quality modelling Dave Waters¹ and Robert Packett² 1 Queensland Department of Natural
Anacostia River Sediment Project Current Status. September 28, 2017
 Anacostia River Sediment Project Current Status September 28, 2017 2 Topics Introduction Conceptual Site Model (CSM) Phase 2 RI Data Human Health Risk Assessment Draft Summary Ecological Risk Assessment
LAND DEVELOPMENT AND ITS AFFECT ON WATER QUALITY IN HALLS MILL CREEK
 LAND DEVELOPMENT AND ITS AFFECT ON WATER QUALITY IN HALLS MILL CREEK Chris L. Murphy, Department of Earth Sciences, University of South Alabama, Mobile, AL 36688. E-mail: clm404@jaguar1.usouthal.edu. As
Peach Creek Watershed
 SH 304 Peach Creek Watershed Bastrop Peach Cree FM 713 Caldwell Peach Creek, Sandy Fork Copperas Creek 1803C Peach Creek Fayette FM 1054 US 90 Waelder US IH US 90 FM 1680 IH 10 Dry Run Gonzales SH 97 Peach
7. WATER QUALITY MONITORING PROGRAM PLAN
 7. WATER QUALITY MONITORING PROGRAM PLAN INTRODUCTION This section serves as the Annual Monitoring Program Plan for the Santa Clara Valley Urban Runoff Pollution Prevention Program (SCVURPPP or Program).
Re-plumbing Roadside Ditch Networks
 Re-plumbing Roadside Ditch Networks Ditches Improving management to reduce flooding, water pollution, and in-stream erosion and habitat degradation Rebecca Schneider Dept. Natural Resources Cornell University,
Integrated Flood Plain Management from a European Perspective
 Integrated Flood Plain Management from a European Perspective Brigitte Urban und Mariele Evers Abs. Nr. OR-072 Objectives of The EU Water Framework Directive On 23 October 2000, the "Directive 2000/60/EC
Sediment levels in the Minnesota River
 Sediment levels in the Minnesota River Scott Matteson Water Resources Center, MN State University Mankato Pat Baskfield Minnesota Pollution Control Agency Sediment levels in the Minnesota River 1.) Who
Hetch Hetchy Treatability at the Sunol Valley Water Treatment Plant
 Operated by the San Francisco Public Utilities Commission Hetch Hetchy Treatability at the Sunol Valley Water Treatment Plant Annual Technology Transfer Workshop November 13, 2013 Enio Sebastiani, P.E.,
Water Quality Ecosystem Services in the Urban Environment
 Water Quality Ecosystem Services in the Urban Environment Dianna Hogan and JV Loperfido ACES 2010 December 7, 2010 U.S. Department of the Interior U.S. Geological Survey Water Quality Ecosystem Services
Sources, Pathways, and Loadings: Five-Year Work Plan ( )
") S A N F R A N C I S CO E S T U A RY I N S T I T U T E R E G I O N A L M O N I TO R I N G P R O G R A M F O R T R AC E S U B S TA N C E S Sources, Pathways, and Loadings: Five-Year Work Plan (2005-2009)
S A N F R A N C I S CO E S T U A RY I N S T I T U T E R E G I O N A L M O N I TO R I N G P R O G R A M F O R T R AC E S U B S TA N C E S Sources, Pathways, and Loadings: Five-Year Work Plan (2005-2009)
Long-term change of stream water quality as a consequence of watershed development and management
 Long-term change of stream water quality as a consequence of watershed development and management T. Kinouchi, K. Musiake Department of Environment System Management, Fukushima University, Japan kinouchi@sss.fukushima-u.ac.jp.
JOE RICH CREEK WATERSHED
 Water Quality Monitoring For the South Slopes of the JOE RICH CREEK WATERSHED (Year 4-2003 Data) Prepared for GORMAN BROS. LUMBER LTD. Westbank, BC by DOBSON ENGINEERING LTD. #4, 1960 Springfield Road
SECTION IV WATERSHED TECHNICAL ANALYSIS
 A. Watershed Modeling SECTION IV WATERSHED TECHNICAL ANALYSIS An initial step in the preparation of this stormwater management plan was the selection of a stormwater simulation model to be utilized. It
River Processes River action (fluvial)
") River action (fluvial) is probably the single most important geomorphic agent and their influence in geomorphology can hardly be overestimated. 1 To understand the complexity associated with river flow
River action (fluvial) is probably the single most important geomorphic agent and their influence in geomorphology can hardly be overestimated. 1 To understand the complexity associated with river flow
Use of SWAT for Urban Water Management Projects in Texas
 Use of SWAT for Urban Water Management Projects in Texas Jaehak Jeong and Allan Jones Texas AgriLife Research Presentation Outline Modeling of Urban Watersheds and Stormwater Best Management Practices
U.S. Department of the Interior U.S. Geological Survey
 Evaluation of stream quality and relations between stream biological conditions and environmental variables in urbanizing watersheds of northeastern Kansas Teresa Rasmussen, U.S. Geological Survey, Lawrence,
5.4 Alameda Creek Watershed Streams and Reservoirs
 5.4 Alameda Creek Watershed Streams and Reservoirs 5.4 Alameda Creek 5.4 Alameda Creek Watershed Streams and Reservoirs Section 5.4 Subsections 5.4.1 Stream Flow and Reservoir Water Levels 5.4.2 Geomorphology
3F. Hydrology and Water Quality
 This section provides an analysis of potential hydrological and water quality impacts associated with implementation of the proposed project. The section also evaluates and describes the potential impacts
CE 2031 WATER RESOURCES ENGINEERING L T P C
 CE 2031 WATER RESOURCES ENGINEERING L T P C 3 0 0 3 QUESTION BANK PART - A UNIT I GENERAL 1. Write short notes on Water Resources Survey. 2. How do you calculate Average Annual Runoff depth? 3. Write short
4.0 SAN GABRIEL RIVER WATERSHED MANAGEMENT AREA
 4.0 SAN GABRIEL RIVER WATERSHED MANAGEMENT AREA 4.1 Watershed Description 4.1.1 Watershed Land Use, Percent Impervious, and Population Land use in the San Gabriel River Watershed Management Area is approximately
ATTENUATION OF METAL CONCENTRATIONS IN TERRACE RESERVOIR, CONEJOS COUNTY, COLORADO, MAY 1994 THROUGH MAY 1995
 ATTENUATION OF METAL CONCENTRATIONS IN TERRACE RESERVOIR, CONEJOS COUNTY, COLORADO, MAY 1994 THROUGH MAY 1995 By Robert W. Stogner, Sr. U.S. Geological Survey, WRD 201 W. 8th Street, Suite 200 Pueblo,
Technical Memorandum No Basis of Comparison
 Pajaro River Watershed Study in association with Technical Memorandum No. 1.2.1 Basis of Comparison Task: Basis of Comparison To: PRWFPA Staff Working Group Prepared by: J. Schaaf Reviewed by: R. Raines
City and County of San Francisco San Francisco Planning Department. Summary Presentation on
 City and County of San Francisco San Francisco Planning Department Summary Presentation on Draft Program Environmental Impact Report for the San Francisco Public Utilities Commission s Water System Improvement
Management Modeling of Suspended Solids and Living Resource Interactions
 Management Modeling of Suspended Solids and Living Resource Interactions Carl Cerco 1, Mark Noel 1, Sung-Chan Kim 2 1 Environmental Laboratory, US Army ERDC, Vicksburg MS, USA 2 Coastal and Hydraulics
Napa Watershed Symposium. Factors affecting future water quantity and quality in Napa County, and strategies for adaptation
 Napa Watershed Symposium Factors affecting future water quantity and quality in Napa County, and strategies for adaptation Pierre Stephens California Department of Water Resources May 21, 2009 Source:
Pollutants of Concern Monitoring - Data Report
 Pollutants of Concern Monitoring - Data Report Water Year 2016 Submitted in compliance with Provision C.8.h.iii of NPDES Permit # CAS612008 (Order No. R2-2015-0049) March 31, 2017 This report is submitted
Project Activity Description Water Plan Category Primary Activity Resource of Concern Priority. known)
") Board of Water and Soil s Water of Concern Targeting Projects and Activities (A) (B) (C) (D) (E) (F) (G) (H) (I) (J) (K) Conventional Subwatershed: 12- Water Quality Water Quality Scale of Activity Watershed:
Board of Water and Soil s Water of Concern Targeting Projects and Activities (A) (B) (C) (D) (E) (F) (G) (H) (I) (J) (K) Conventional Subwatershed: 12- Water Quality Water Quality Scale of Activity Watershed:
SOURCE WATER MONITORING
 Monitoring and Protecting Our Water Sources SOURCE WATER MONITORING The Upper Cache la Poudre (UCLP) Watershed Collaborative Monitoring Program was established in 2008 between the City of Fort Collins,
DTMC Discussion Delta RMP Mercury Monitoring Design
 DTMC Discussion Delta RMP Mercury Monitoring Design April 15, 2014 At DWR Jay Davis, Ph.D. Stephen McCord, Ph.D., P.E. Overview Delta RMP process & people Initial Hg monitoring focus Available information
Trends in Dissolved Reactive Phosphorus in Lake Erie Tributaries
 Trends in Dissolved Reactive Phosphorus in Lake Erie Tributaries R. Peter Richards, David B. Baker, John P. Crumrine National Center for Water Quality Research Heidelberg College Tiffin, Ohio 44883 Windsor,
SURFACE WATER HYDROLOGY
 SURFACE WATER HYDROLOGY OVERVIEW According to the best available subwatershed maps (Navigant Consulting, Inc. 2000) there are 32 foothill streams which are drained by 24 subwatershed areas comprising the
Dissolved Organic Carbon Introduction Dissolved organic carbon (DOC) was defined in this study as the carbon component of organic material <0.
 was defined in this study as the carbon component of organic material <0.") Dissolved Organic Carbon Introduction Dissolved organic carbon (DOC) was defined in this study as the carbon component of organic material
Dissolved Organic Carbon Introduction Dissolved organic carbon (DOC) was defined in this study as the carbon component of organic material
Stream Ecology Lab Module 4/5 Determining Discharge and Sediment Yield in a Small Stream
 Stream Ecology Lab Module 4/5 Determining Discharge and Sediment Yield in a Small Stream Introduction: In this lab you will determine the total suspended solids yield per year for two streams a local stream
Water quality of road runoff in the Blue Mountains, NSW, Australia
 Geo-Environment and Landscape Evolution III 151 Water quality of road runoff in the Blue Mountains, NSW, Australia S. Riley 1, S. Shrestha 1, P. Hackney 2 & R. A. Mann 3 1 Sustainable Engineering and Technology
CASE STUDY OKUYOSHINO, JAPAN
 SEDIMENT MANAGEMENT CASE STUDY OKUYOSHINO, JAPAN Key project features Name: Okuyoshino Country: Japan Category: bypass channel/tunnel Reservoir volume (original): 15.47 Mm 3 Installed capacity: 1,206 MW
EVALUATION OF METAL TRANSPORT INTO AND OUT OF TERRACE RESERVOIR, CONEJOS COUNTY, COLORADO, APRIL 1994 THROUGH MARCH 1995
 EVALUATION OF METAL TRANSPORT INTO AND OUT OF TERRACE RESERVOIR, CONEJOS COUNTY, COLORADO, APRIL 1994 THROUGH MARCH 1995 By Sheryl A. Ferguson U.S. Geological Survey, WRD 201 W. 8th Street, Suite 200 Pueblo,
Treatability of Organic and Radioactive Emerging Contaminants in Stormwater Runoff
 Treatability of Organic and Radioactive Emerging Contaminants in Stormwater Runoff Robert Pitt, Ph.D., P.E., D.WRE, BCEE, University of Alabama Shirley Clark, Ph.D., P.E., D.WRE, Penn State - Harrisburg