4.1 Introduction 4.2 Kiln System. 4.3 Kiln System Analysis 4.4 Results and Discussion 4.5 Conclusion
|
|
|
- Willa Lawson
- 6 years ago
- Views:
Transcription
1 ENERGY AND EXERGY ANALYSIS OF THE KILN SYSTEM IN THE CEMENT PLANT 4 Contents 4.1 Introduction 4.2 Kiln System. 4.3 Kiln System Analysis 4.4 Results and Discussion 4.5 Conclusion 4.1 Introduction The conservation, balance and management of energy are hot and emerging topic of today s discussion. In this regard, the attempts for energy balance in the industries of developing countries like India are having extreme significance. Cement industry is an energy intensive industry. Theoretically, producing one tonne of clinker requires a minimum on 1.6 GJ heat (Liu et al., 1999). The specific thermal energy consumption in cement industries in India varies from 2.95 GJ to 4 GJ/tonne of clinker. The higher specific energy consumption is due to the harder raw material and poor quality of fuel. In this study, the energy utilization efficiency for kiln system with different operating conditions was determined. Mass balance, energy and exergy utilization efficiency of the kiln system were analyzed using the actual operational data. 103
2 Chapter Kiln System The plant uses the dry process with four stage cyclone pre-heaters and an inclined Kiln. The specification of kiln is given as follows Length Diameter Designed capacity 65 m 4.4 m 1213 tonnes per day Kiln slope 3% Kiln speed Normal speed RPM 1.2 RPM The rotary cement kiln is a long cylindrical steel shell lined on the interior with refractory bricks. The shell slopes slightly (3%) and slowly rotates on its axis at between revolutions per minute. Coal ground to fine power in the coal mill, is weighed in an electronic weight feeder and fired to the kiln through a burner pipe positioned almost concentric to the kiln at the outlet. This forms intense heat at the outlet end of kiln, imparting thermal energy for clinkerisation. The pulverised coal is injected into the kiln with the help of primary air. Secondary air is drawn first through the cooler and then through the kiln for combustion of the coal. In the cooler the air is heated by the cooling clinker, so that it may be C before it enters the kiln, thus causing intense and rapid combustion of the coal. Required raw meal is extracted from the storage silos, weighed in an electronic feeder and lifted to top of the preheater unit. The raw meal travels down the preheater countering the exit hot gas from kiln. In the drying zone the moisture content of material escape as water vapour. Above 600 C, calcium carbonate and magnesium carbonate in the feed starts decomposing to 104
3 form calcium oxide, magnesium oxide and carbon dioxide. The partly calcined material enters the kiln where temperature is maintained at 850 C. The feed that enters the kiln inlet gradually travel towers the outlet end due to rotation and slope of kiln. Hot gas from the kiln moves upwards, as a result the raw materials are exposed to hot gases and in its course, it gets fully calcined. The calcined material then enters to the burning zone (1450 o C) of the kiln and the entire chemical reactions takes place there and clinker is formed. Fig.4.1 shows details of the kiln system. The calcinations and reactions will take place at different zones in the kiln system to form clinker, which is a mixture of the phase components such as β-dicalcium silicate (β- C 2 S), Tri calcium aluminate( C 3 A) and Tetra calcium aluminoferrite (C 4 AF). The β-dicalcium silica further reacts with more CaO at higher temperatures to form Tri calcium silicate (C 3 S) in the burning zone. The main reactions in the kiln system are tabulated in Table 4.1 (Kaantee et al., 2004; Mintus et al., 2006; Mujumdar and Ranade, 2006). Table 4.1 Chemical reactions process in kiln system Reaction name Reaction Calcinations process CaCO 3 CaO+ CO 2 MgCO 3 dissociation MgCO 3 MgO + CO 2 β-c 2 S formation C 3 S formation C 3 A formation C 4 AF formation 2CaO+ SiO 2 β -C 2 S β -C 2 S+ CaO C 3 S 3CaO + Al 2 O 3 C 3 A 4CaO +Al 2 O 3 + Fe 2 O 2 C 4 AF The clinker thus formed is dark green in colour with 30% of it in the form of nodules. Clinker leaving the kiln at around 1200 o C is quenched and cooled to around 100 o C in the cooler unit and stored in the clinker stockpile. 105
4 Chapter-4 Fig. 4.1 Kiln system 106
5 4.3 Kiln System Analysis The energy and exergy analysis of the kiln system were conducted for two operating conditions given as follows. I. Clinker production rate of 1400 tpd The operation data of the kiln system for the production rate of 1400 tonnes per day is given in the Table 4.2 Table 4.2 Operation data of kiln system for the production rate of 1400 tonnes per day Ambient temperature 35 0 C Present kiln capacity 1400 TPD Required kiln feed 87 TPH Temperature of feed 55 0 C Raw meal /clinker factor 1.49 Coal consumption TPH Flow rate of preheater Exhaust gas Nm 3 /hr Preheater exhaust gas temperature C O 2 % Preheater exit gas 4.2% O 2 % Kiln inlet (junction between preheater and kiln) 1.8% Flow rate of primary air Nm 3 /hr Temperature of Primary air 71 0 C Flow rate of cooler inlet air Nm 3 /hr Excess air 10% Clinker discharge temperature from cooler 95 0 C Flow rate of gas to coal mill Temperature of coal mill gas Flow rate of cooler hot air Temperature of hot air from cooler 6157 Nm 3 /hr C Nm 3 /hr C Temperature of secondary air C Dust concentration in Preheater exhaust gas g/ Nm 3 Surface temperature of kiln Surface temperature of preheater Surface temperature of cooler C 80 0 C 82 0 C 107
6 Chapter-4 The control volume for the study includes the pre-heaters, rotary kiln and cooler. The streams into the system are the raw meal, the air into the cooler and coal fired in the kiln. The streams leaving the system are clinker out from the cooler, the exhaust gas from the preheater and hot gases from the cooler. During this operating condition (Production rate of 1400 tonnes per day) the various input and output gas volume at different locations are measured with pitot tube with manometer assembly. The kiln, preheater and cooler surface temperature were measured with radiation pyrometer. The material input and output temperature is measured by using a thermocouple. The temperatures of inlet and outlet gas are continuously measured by the online temperature probes which are installed on the system. Fig.4.2 Schematic diagram of the kiln system (Production rate of 1400 tonnes per day) 108
7 The Fig. 4.2 shows the various input and output streams based on mass flow rate of the kiln system. The raw meal at the rate kg/sec (55 0 C) from the raw mill supplied to the top of the preheater and it moves down to the rotary kiln. The hot gas from kiln moves upwards as a result of which heat transfer take place between raw meal and hot gas and the gas then discharged to the surrounding (384 0 C). In the kiln, raw meal subject to chemical reaction and burning, the clinker is formed and it is cooled in the clinker cooler. The clinker discharge rate from the cooler is 16.2 kg/sec at 95 0 C. The pulverised coal is supplied to the kiln at the outer end with the primary air (71 0 C). The secondary air (850 0 C) drawn from the clinker cooler moves through the kiln and preheter. The suction is created by the preheater fan. It was observed that, kiln inlet (junction between preheater and kiln) O 2 level was 1.8% which indicates that the kiln is operating with 10% excess air. The secondary air required for complete combustion of coal in the kiln was calculated as kg/sec. The coal mill fan drawn air from the clinker cooler with temperature of C. The temperature of cooler hot air discharged to the surrounding is about C. It was observed that the O 2 level at preheater exit is indicated to be 4.2%. Normally for optimum energy consumption, the percentage of oxygen to be maintained at preheater exit and kiln inlet are 3.5% and 1.5 % respectively. It was observed that air leakage in to the kiln is negligible. The air leakage mainly occurs across the preheater and clinker cooler. In this case the total infiltration air to the whole system was found to be 12.4%. II Clinker production rate of 1369 tonnes per day The operation data of the kiln system for the production rate of 1369 tonnes per day is shown in Table
8 Chapter-4 Table 4.3 Operation data of kiln system for the production rate of 1369 tonnes per day Ambient temperature 30 0 C Present kiln capacity 1369 TPD Required kiln feed 85 TPH Temperature of feed 55 0 C Raw meal /clinker factor 1.49 Coal consumption TPH Flow rate of preheater Exhaust gas Nm 3 /hr Preheater exhaust gas temperature C O 2 % Preheater exhaust gas 4% O 2 % Kiln inlet (junction between preheater and kiln) 1.8% Flow rate of primary air Nm 3 /hr Temperature of Primary air 53 0 C Flow rate of cooler inlet air Nm 3 /hr Excess air 10% Clinker discharge temperature C Flow rate of gas to coal mill 6405 Nm 3 /hr Temperature of coal mill gas C Flow rate of cooler hot air Nm 3 /hr Temperature of hot air from cooler C Temperature of secondary air C Dust concentration in Preheater exhaust gas g/ Nm 3 Surface temperature of kiln Surface temperature of preheater Surface temperature of cooler C 82 0 C 85 0 C Fig.4.3 shows the various streams based on mass flow rate in the kiln system. The clinker discharge rate from the cooler in this operating condition is about kg/sec at C. The required kiln feed for the 110
9 clinker production is supplied through top of the preheater about 23.6kg/sec (55 0 C). The gas streams at outlet of the system are preheater exhaust gas (395 0 C), cooler hot air (220 0 C) and coal mill gas (340 0 C). The gas streams at inlet of the system are primary air (53 0 C) and cooler air to cool the clinker. For this operating condition the pulverised coal is supplied to the kiln with the primary air at the rate of 3.01 kg/sec. It was noted that, kiln inlet (junction between preheater and kiln) O 2 level is 1.8% which reveals that the kiln is operating with 10% excess air. The secondary air required for the complete combustion of coal in the kiln was calculated as 18.35kg/sec. The temperature of secondary air is about C. It was observed that the O 2 at preheater exit and kiln inlet are indicated to be 4 % and 1.8% respectively. In this case the total infiltration air for the whole system was found to be 15 %. Fig. 4.3 Schematic diagram of the kiln system (Production rate of 1369 tonnes per day) 111
10 Chapter Results and Discussion Mass balance of the Kiln System (Production rate of 1400 tonnes per day) The stream data obtained from the plant is used to perform a mass balance over the system. It is usually more convenient to define mass or energy data per kg of clinker produced per unit time. The clinker production rate of in the kiln is estimated to be 16.2 kg of clinker/sec. For this production rate of various input and output components of the kiln system are estimated as follows. Inputs (i) Raw meal feed = kg/sec Raw meal per kg of clinker production, ( m ) = k rm = 1.49 kg/kg-clinker (ii) Rate of coal consumption = kg/sec Coal per kg of clinker production, ( m k ) c = 16.2 = 0.19 kg/kg-clinker (iii) Primary air mass flow rate = 6.77 kg/sec Primary air per kg of clinker production, 6.77 ( m k ) pa = 16.2 =0.418 kg/kg-clinker (iv) Mass flow rate of air into the cooler = kg/sec Cooler air per kg of clinker production, ( m ) = k ca = kg/kg-clinker 112
11 (v) Infiltrated air mass flow rate = 13.2 kg/sec 13.2 Infiltrated air per kg of clinker production, ( m k ) ia = 16.2 = kg/kg-clinker Outputs (i) Preheater exhaust gas mass flow rate = 41.47kg/sec Preheater exhaust gas per kg of clinker production, ( m k ) eg = 16.2 = 2.56 kg/kg-clinker (ii) Mass flow rate of dust = 1.21 kg/sec (iii) 1.21 Dust per kg of clinker production, ( m k ) d = 16.2 = kg/kg-clinker Cooler hot air mass flow rate = kg/sec Cooler hot air per kg of clinker production, ( m k ) co = 16.2 = 2.82 kg/kg-clinker (iv) Mass flow rate gas to coal mill = kg/sec Coal mill gas per kg of clinker production ( m k ) cm = 16.2 = kg/kg-clinker (v) Clinker flow rate, m cli = 16.2 kg-clinker /sec 16.2 Clinker discharge ( m k ) cli = = 1unit
12 Chapter-4 The mass balance of the kiln system is summarized in Fig.4.4. All gas streams are assumed to be ideal gases at the given temperatures. Fig. 4.4 Mass balance in the kiln system (Production rate of 1400 tonnes per day) Energy balance of the Kiln System (Production rate of 1400 tonnes per day) The following assumptions are made to analyze the kiln system. (a) (b) (c) (d) Steady state working conditions. The change in the ambient temperature is neglected. Cold air leakage into the kiln is negligible. Average kiln surface temperature does not change. For the rotary kiln system, the energy balance equation is given as follows ( m k ) in h in = ( m k ) out h out + (Q k ) L (4.1) where ( m k ) in and ( m k ) out are mass in and out of the kiln system. h in and h out are specific enthalpy in and out of the kiln system (Q k ) L = heat loss from the kiln surface 114
13 Based on the collected data, an energy balance is applied to the kiln system. The equations can be found in hand book (Peray, 1979). The reference enthalpy is considered to be zero at 0 0 C for the calculation. The specific heat capacity ( c p ) of the each input and output material for c analysis has been calculated by using relation c p = a + b T+ where a, 2 T b and c are the constants for the components of material and T represents temperature in Kelvin (Perry and Green, 1984). The compositions of input and output materials are shown in Annexure A. The constants of each component of the input and output materials are taken from standard hand book (Perry and Green, 1984). The complete energy balance for the system is shown in Table

14 Chapter-4 116
15 117
16 Chapter-4 118
17 (4.2) = % Fig. 4.5 shows the energy flow diagram of the kiln system. The specific thermal energy consumption of the plant was kj/kgclinker, out of which 3945 kj/kg-clinker (93.9 %) was the combustion of coal. The other input includes sensible heat of coal 10.25kJ/kg-clinker (0.24%), sensible heat of raw meal 64.9 kj/kg-clinker (1.55 %), and air kJ/kg-clinker (4.31 %). The kiln exhaust gas with kj/kgclinker (25.45%) and clinker cooler hot gas kJ/kg-clinker (13.73%) are discharged to the surrounding. The heat loss by convection and radiation together from the kiln surface is found to be kj/kg-clinker (7.28%) and that for the pre-heater and clinker cooler of the system is estimated to be 7.81 kj/kg-clinker (0.19%). The other heat losses include clinker discharged from the cooler kj/kg-clinker (1.88%), gas drawn to coal mill kj/kg-clinker (1.03%), dust kj/kg-clinker(0.69%) and moisture in coal kj/kg-clinker (0.47%). The unaccounted heat loss was found to be kj/kg-clinker (7.48%). The overall efficiency of the system was found to be η = 41.8% and the value is close to a plant in Turkey 48.2% (Kolip, 1990). 119
18 Chapter-4 Fig.4.5 Energy flow diagram (Sankey diagram) of kiln system (Production rate of 1400 tonnes per day) 120
19 4.4.3 CO 2 emissions For the present operating conditions the kiln was fired with coal at the rate of kg/hr. CO 2 emissions from the kiln system are mainly due to the combustion of coal and decarbonation reactions. Complete combustion of coal and decarbonation reaction is assumed. The corresponding, stoichiometric of the reactions are written as follows. C+ O 2 CO 2 CaCO 3 CaO+ CO 2 Total yield of CO 2 is determined considering 1 kg-clinker, 0.19 kg of coal/kg of clinker and stoichiometric mass ratio. It is found that 0.37 kg CO 2 per kg of clinker is generated from the complete combustion of coal. The raw meal to clinker ratio at the present operating condition is 1.49 and it contains kg of CaCO 3. Therefore it was determined that 0.52 kg of CO 2 per kg of clinker is generated during the decarbonation reaction. Hence the total emissions of CO 2 due to combustion of coal and decarbonation reaction for a clinker production rate of 1400 tonnes per day is estimated to be 1246 tonnes per day Energy conservation opportunities One of the objectives of the energy conservation measures is to expand the use of the secondary energy as much as possible and thereby reduce the requirement for primary purchased energy. In this study, only thermal energy conservation measures are presented. Basically all output flow from the kiln system could have potential for waste heat recovery. The main sources energy conservation can be kiln and cooler exhaust gases and radiation heat from kiln. The recovered waste heat can be used for power generation, drying raw material and coal and preheating the secondary air for kiln. 121
20 Chapter Waste heat recovery steam generation (WHRSG) Production rate of 1400 tonnes per day The overall efficiency of the system can be improved by recovering some of the heat losses and the recovered heat can be used for several purposes, such as electricity generation, hot water generation etc. The waste heat recovery system can also be considered as an environment friendly system since it utilizes available wasted energy and reduces the resulting CO 2 emissions of cement production processes. It is possible to recover the major heat losses such as like kiln exhaust gas and hot air from cooler stack by using waste heat recovery steam generation (WHRSG) unit. Fig. 4.6 Waste heat recovery steam generation application The four stage pre-heaters have exhaust gases leaving at temperature 384 C. The clinker is discharged red-hot from the kiln and transferred to clinker coolers, which performs the function of cooling the clinker for downstream transport and processing and the temperature of air discharge from the cooler is 200 o C. Both streams would be directed through a waste 122
21 heat recovery steam generator and available energy is transferred to water via the WHRSG. The schematic diagram of WHRSG unit is shown in Fig.4.6. The available waste energy is such that the steam would be generated. The steam would then be used to power the steam turbine driven electrical generator. The electricity generated would offset a portion of the purchased electricity, thereby reducing electrical demand. In order to determine the size of the generator, the available energy from the gas stream must be found. Once this is determined, an approximation of the steaming rate for a specified pressure can be estimated. The steam rate and pressure will determine the size of the generator. As the gas passes through the WHRSG, energy will be transferred and gas temperature will drop. Targeting a pressure of 8 bar at the turbine inlet, the minimum steam temperature at the WHRSG exit would be higher than corresponding saturation temperature which is roughly 170 o C. After exiting the WHRSG, the energy of these streams can be recovered by using a compact heat exchanger. Hence the final temperature can be reduced as low as possible, which might be limited by the acid dew point temperature of stream. According to the final temperature of both the streams, the final enthalpies have been calculated to be h co = kj/kg, h eg = kj/kg. So the available heat energy would be Q available = [( m k ) eg (h eg1 -h eg2 )+ ( m k ) co (h co1 -h co2 )] m cli (4.2) where (m k ) eg is the mass of exhaust gases from the pre-heater (kg/kgclinker), (m k ) co is the mass of air from the cooler (kg/kg-clinker) and m cli is the mass flow rate of clinker(kg/sec) Q available = [2.56( ) ( )] 16.2 =8253 kw 123
22 Chapter-4 It is assuming a reasonable efficiency of 85% for the steam generator. Then the energy that would be transferred through WHRSG = = 7015 kw For utilizing this available recovered heat energy, a steam turbine unit is considered with a turbine pressure of 8 bar and a condenser pressure of 10 kpa. It can be shown that the net power, which would be obtained from this turbine, is almost 1000 kw. Then the author assumed that the useful power generated is 1000 kw, then the energy saving will be based on the 1000 kw. Assuming 8000 hours of usage per year, Energy saved = power generated hours of usage (4.3) = 1000kW 8000hr/yr= kwh/yr The average unit price of electricity can be taken as INR 5/kWh, therefore, the cost saving would be = = INR 4 Crores/year. The first cost estimate for the system is about INR 6 Crores and taking into account the operating cost, the payback period for the system is estimated as follows. Payback period = implementation cost/ annual cost of saving = INR 6Crores INR 4 Crores / yr = 1.5 yr = 18 months For improving the performance of the waste heat recovery steam generation unit, modifying the existing cycle with flash steam system is an 124
23 excellent option. The flash steam power cycle is based on the property that a certain mass of steam can be separated from water at saturated state if the pressure is lowered. The amount of flashed steam depends on the pressure before the flash tank and the final pressure in the tank. The lower the pressure in the flashing tank the higher is the amount of steam, but on the other side, low pressure steam generates a lesser amount of power. Fig. 4.7 shows the configuration of flash steam cycle for the cement plant. In this case two heat recovery steam generators are used to recover the two waste heat sources; one for the preheater exhaust, called the suspension preheater boiler, and the other for the clinker cooler exhaust called the air quenching cooler boiler. The working fluid passed through feed pump is sent into air quenching cooler boiler and preheated initially. One part of preheated working fluid is vaporized and superheated in air quenching cooler boiler, and another part of preheated working fluid is sent to suspension preheater boiler to be vaporized and superheated. The two streams of superheated steam from air quenching cooler boiler and suspension preheater boiler are mixed and expended through turbine to generate power. The rest of preheated working fluid is expanded in the flasher and is separated into saturated steam and saturated water. The saturated steam is then sent into turbine to generate power. The turbine exhaust is condensed in the condenser, and passes through condensing pump to be mixed with saturated water from the flasher. 125
24 Chapter-4 Fig.4.7 Waste heat recovery steam generation unit with steam flash cycle Heat recovery from the kiln surface (Production rate of 1400 tonnes per day). The convection and radiation heat loss from the kiln surface was found to be around 7% of the input energy. Using a secondary stationary shell on the kiln surface can significantly reduce this heat loss. For current rotary kiln, the radius is 2.2m, and for secondary shell radius of 2.6m can be considered. Since the distance between surfaces is relatively small 40cm, a realistic estimation for the temperature of secondary shell can be made. Assume the temperature of the secondary shell as 280 o C (T 2 ). Consider the secondary shell made of steel with relatively low surface emission and thermal conductivity. The heat transfer by radiation calculated by Eq. 4.4 (Frank, 2001). 126
25 (4.4) where A kiln is the surface area of the kiln = 2 Л r L k σ Stefan Boltzman constant = W/m 2 K 4 T 1 is the Kiln surface temperature = 573 K T 2 is the Shell surface temperature = 553 K. ε 1 = emissivity for oxidized kiln surface ε 2 = emissivity for stainless steel shell. Q ra = kw This heat loss is to be transferred through the insulation of the secondary shell. For glass wool insulation, the thermal conductivity is taken as 0.05 W/mK. The thickness of the glass wool insulation can be determined by using the expression for resistance of the insulation. The thermal resistance of the insulation is Rt ins r ins In r Shell = (4.5) ( 2 π kins Lins) where k ins is the thermal conductivity of the insulation material. r ins is the outer radius of the insulated secondary shell, r shell is the outer radius of the secondary shell L ins is the length of the insulation shell Rt ins r ins In r Shell = ( 2 π ) 127
26 Chapter-4 Assuming temperature difference of T=250 o C (which means outer surface temperature of 50 o C), So the radius of the insulation r ins can be determined from the following relation. T ins = Q ra (resistance of the insulation) (4.6) r ins In = (2 π ) So the radius of the insulation found to be (r ins ) = 2.65m, and the thickness would be, t = r ins r shell = = 0.05 m = 50 mm When the secondary shell is added to the kiln surface the convection heat loss become insignificant. Hence the total energy saving would be = (242.75kJ/kg-clinker 16.2kg-clinker/sec) = kW from the radiation and = 63.2kJ/kg-clinker 16.2kg-clinker/sec= kw from the convection heat transfers. Therefore the secondary shell would save the 4.7 MW, which is about 6.9 % of input energy. This energy saving would result the reduction in fuel consumption of the kiln system, that would reduce CO 2 emissions. The overall efficiency would be increased by approximately 3 to 4% CO 2 reduction methods in cement plants. The following methods are also used to reduce CO 2 emissions from the cement plants: (i) (ii) Use of Low carbon intensive fuels Use of Waste fuels 128
27 (iii) (iv) (v) Use of Renewable energy Use of Lower clinker to cement ratio and Carbon capture and storage (CCS). (i) Use of Low carbon intensive fuels It is found that lower carbon content fuels reduce CO 2 emissions from the kiln system compared to higher carbon content fuels. CO 2 emissions by fuel consumption are practically the same as the CO 2 emissions from limestone calcination. In the cement plants saving of 1 kcal reduces CO 2 emissions by about gm (PCA, 2008). (ii) Use of Waste fuels Rotary kilns producing cement clinker can use waste materials as fuels. Greco et al., (2004) has found that cement kilns by and large encompass extremely elevated temperatures, high turbulence, continuously oxidizing conditions and lengthy residence times. The use of a flammable waste reduces the use of conventional fossil fuels and also the generation of CO 2 emissions. They also found that it is possible to replace more than 50% of the fuel requirements of a cement kiln with waste fuels. One of the significant sources of waste materials that can be used as fuel for cement kilns is used tires. Cement kilns totally consume used tires, with no residual waste produced. (iii) Use of Renewable energy In a thermal power plant using coal as fuel, power generation of one kwh results in the production of about 0.83 gm CO 2 (IPCC, 2007). CO 2 emissions due to electrical power consumption in a cement plant are dependent on the electrical power generation source and hence if 129
28 Chapter-4 electrical power for the same is generated from other sources like hydro, wind or nuclear power, a cement plant would be contributing practically zero CO 2 emissions. (iv) Use of Lower clinker to cement ratio The method of reducing CO 2 emissions from the cement manufacturing industry by reducing the amount of clinker used when making finished cement is found to be better compared to the previously mentioned techniques. Blending of cement with additives to replace clinker have significant effects in the reduction of CO 2 emissions. (v) Carbon capture and storage (CCS) CO 2 capture and storage (CCS) is an emerging method for reducing CO 2 emissions in cement plants. There are a number of storage destinations such as saline aquifers, porous geologic formation, depleted oil and gas reservoirs and coal seams. In this method there are basically three strategies for CO 2 capture in cement plants. They are (i) Pre-combustion, (ii) Post-combustion, and (iii) Oxy-combustion a) Precombustion For new cement plants integrated with gasification technologies, precombustion CO 2 capture will be more applicable to produce Syngas (a mixture of H 2, CO, H 2 O, and CO 2 ) from the main plant fuel. H 2 would be then fired in the cement kiln after capturing CO 2 from this Syngas. However CO 2 released by calcination of limestone will not be captured. In addition, a new generation of burner technology and cement kiln lines will be required. 130
29 b) Post-combustion A commercially mature technology used in chemical industry for separation of CO 2 is the post combustion capture by amine scrubbing (e.g. using Monoethanolamine (MEA)). The CO 2 is stripped from ammine solution, dried, compressed and transported to storage site. Alie et al. (2005) found out that the main challenge lies in the scale up of this process and its implementation for scrubbing of CO 2 from flue gases that contain a number of contaminations potentially harmful to the operation of the scrubber unit. Post-combustion CO 2 capture technologies exhibiting the following characteristics are extremely useful in the present cement industry: 1) technical compatibility with cement manufacturing operating conditions, 2) non-toxic, non-hazardous materials, 3) minimal impact on cement plant operations, and 4) affinity to operational experience of cement plants. c) Oxy - firing In this method, the combustion air is totally replaced with pure oxygen combined with recycled CO 2 rich flue gas to moderate the flame temperature. Due to high percentage of CO 2 in flue gases originating from the calcinations process, combustion in a CO 2 / O 2 atmosphere looks like one of the finest options for CO 2 reduction in the cement plant. If cement kiln could be successfully operated with a high CO 2 atmosphere and leakage could be greatly reduced, oxy-combustion of the kiln could be a reasonable option (Adia et al., 2009). 131
30 Chapter Exergy balance of the kiln system (Production rate of 1400 tonnes per day). The process for which the exergy analysis performed is assumed to be the kiln system as an open system under the steady state working condition. The reference pressure and temperature for the dead state conditions are assumed to be 101 kpa and 298 K respectively. There are physical exergy in the process. The chemical reaction takes place in the preheater and rotary kiln. The following assumptions are considered for the exergy analysis. a) The effect of the pressure on the input and output enthalpies are neglected. b) All gas steams are ideal gas mixtures. c) The process is at the steady-state conditions, that is no parameter changes with time. Equations for the exergy analysis were given in the Annexure C. Table 4.5 and 4.6 shows the enthalpy and entropy balance in the kiln system. The exergy balance is shown in Fig 4.7. The detailed calculation of exergy of the input and output steams are shown in Annexure E. The exergy calculation for the clinker formation is given in Annexure D. 132
31 133
32 Chapter-4 134
33 135
34 Chapter-4 Fig.4.8 Exergy flow diagram (Sankey diagram) of the kiln system (Production rate of 1400 tonnes per day) 136
35 The exergy analysis results of the input and output components are shown in Table 4.7. It is clear from that the results exhibit good consistency between input and output exergy fluxes. The available exergy of the whole system was found to be kj/kg-clinker. It is also interesting to observe from Table 4.7 that almost % ( kj/kg-clinker) of the input exergy is the chemical exergy of coal. ----(4.7) = 28.3 % The allocation of input and output exergies of various components can be best represented by the Sankey diagram as shown in Fig This value represents 28.3% of the useful exergy with the remaining 71.7 % being exergy losses at the various stages of the system. The major loss is due to irreversibility in the system 56.53% ( kj/kgclinker). The kiln exhaust gas kj/kg-clinker (8.39 %) and clinker cooler hot gas kj/kg-clinker (2.63 %) are discharged to the surrounding. The exergy with heat losses are found to be kj/kgclinker (3.62%). The coal mill gas and dust were found to be kj/kg-clinker (0.3%) and 9.29kJ/kg-clinker (0.23%) respectively Mass balance of the Kiln System (Production rate of 1369 tonnes per day) In this case the clinker production rate in the kiln is estimated to be kg of clinker/sec. For this operating condition the various input and out put components of the kiln system are estimated as follows. 137
36 Chapter-4 Inputs (i) Present kiln feed (raw meal) = 23.6 kg/sec Raw meal per kg of clinker production, ( m ) = k rm = 1.49 kg/kg-clinker (ii) Rate of coal consumption = 3.01 kg/sec Coal per kg of clinker, ( m ) = k c = 0.19 kg/kg-clinker (iii) Primary air mass flow rate = 6.18 kg/sec Primary air per kg of clinker, ( m ) = k pa = 0.43 kg/kg-clinker (iv) Cooler air mass flow rate, = kg/sec Cooler air per kg of clinker, ( m ) = k ca = kg/kg-clinker (v) Infiltrated air mass flow rate =13.99 kg/sec Infiltrated air per kg of clinker production, ( m k ) ia = = kg/kg-clinker 138
37 Outputs (i) Preheater exhaust gas mass flow rate = 40.08kg/sec Preheater exhaust gas per kg of clinker production, ( m ) = k eg =2.53 kg/kg-clinker (ii) Mass flow rate of dust = 1.18 kg/sec Dust per kg of clinker production, 1.18 ( m k ) d = = kg/kg-clinker (iii) Cooler hot air mass flow rate = kg/sec Cooler hot air per kg of clinker production, ( m ) = k co = kg/kg-clinker (iv) Mass flow rate of gas to coal mill = 2.11 kg/sec Coal mill gas per kg of clinker production ( m ) = k cm = kg/kg-clinker (v) Clinker flow rate, m cli = kg /sec Clinker discharge ( m k ) cli = = 1unit
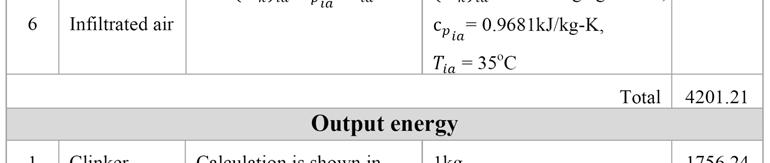
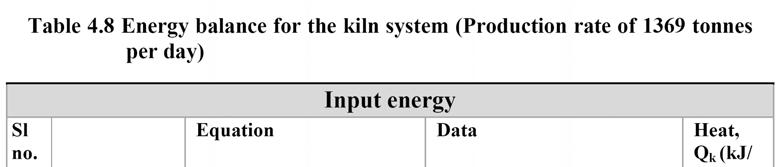
38 Chapter-4 The mass balance of the kiln system is summarized in Fig.4.9 Fig. 4.9 Mass balance in the kiln system (Production rate 1369 tonnes per day) Energy balance of the Kiln System (Production rate of 1369 tonnes per day) The energy balance for the pyrprocessing unit for this the operating condition is presented in Table

39 141
40 Chapter-4 142
41 143
42 Chapter-4 Fig.4.10 Energy flow diagram of the kiln system (Production rate of 1369 tonnes per day) 144
43 Fig.4.10 shows the Sankey diagram demonstrating magnitudes and percentages of energy flows and losses. The results shows that fuel combustion generate heat of 3945 kj/kg-clinker (95.14%). The total sensible heats of raw meal, coal and air at the input are found to be kj/kg-clinker (4.86%). The first law efficiency of the system is found to be 42.36%. The major energy losses such as kiln exhaust gas, clinker cooler hot gas and radiation and convection of kin system were estimated to be kj/kg-clinker (26.29%), kj/kg-clinker (11.2%) and kj/kg-clinker (8.1%) respectively. The heat energy carried by the coal mill gas was found to be kj/kg-clinker (1.15%). The other heat losses are clinker discharge kj/kg-clinker (3.16%), dust kj/kg-clinker (0.72%) and moisture in coal kj/kg-clinker (0.49%). The unaccounted heat loss was found to be kj/kg-clinker (6.56%). The total emissions of CO 2 due to combustion of coal and decarbonation reactions for a clinker production rate of 1369 tonnes per day is estimated to be 1218 tonnes per day Exergy balance of the kiln system (Production rate of 1369 tonnes per day) The input and output enthalpy and entropy for this operating condition are shown in the Table 4.9 and Table 4.10 respectively. The exergy of the various streams of the clinker production process are shown in the Table
44 Chapter-4 146
45 147
46 Chapter-4 148
47 Fig.4.11 Exergy flow diagram of the kiln system (Production rate of 1369 tonnes per day) 149
48 Chapter-4 Fig shows the Sankey diagram of input and output exergy of various components of the kiln system. The exergy efficiency for this operating condition was found to be 28.6%. The contribution of the major input exergy is coal and it is found to be (99.94%) and the remaining contains exergy of raw meal 1.67 kj/kg-clinker (0.04%) and air 0.67 kj/kg-clinker (0.02%). The irreversibility in the system was found to be kj/kg-clinker (55.88%). The kiln exhaust gas with kJ/kg clinker (8.73%) and clinker cooler hot gas kj/kg-clinker (2.32%) are released to the surrounding. The exergy associated to radiation and convection heat losses are found to be kj/kg-clinker (3.89%). The exergy of coal mill gas and dust are found to be 13.97kJ/kg-clinker (0.35%) and 9.79 kj/kg-clinker (0.24%) respectively. 4.5 Conclusion Energy analysis is a powerful tool, which has been effectively used in the design and performance evaluation of energy related systems. The energy efficiency value for the kiln system for first operating condition (Production rate of 1400 tonnes per day) was found to be 41.8%. The major heat losses for the system were identified as the preheater exhaust gas and hot air discharged from the cooler. The preheater exhaust gas carries about kj/kg-clinker and that of the cooler hot gas is kj/kg-clinker, which indicate that the total energy recovery potential from these waste gases is of the order of 39.18%. The selected retrofit steam cycle showed an energy saving potential of 7 MW from the waste heat streams. The CO 2 emission due to the combustion of coal and decarbonation reaction of raw meal in the first operating condition was found to be 1246 tonnes per day. 150
49 The heat loss by convection and radiation together from the kiln surface is about kj/kg-clinker (7.28%) and that for the pre-heater and clinker cooler of the system is estimated to be 7.81 kj/kg-clinker (0.19%). For the kiln system, a secondary shell system has been proposed and designed. This system would lead to saving 6.9% of the input energy; hence the overall efficiency would be increased by approximately 3 to 4%. As for the exergy, it was determined that the exergy efficiency of the existing system is `28.3% and the irreversibility is 56.53%. Therefore it is seen that exergy analysis accounts for the operation, indicating the locations of energy degradation in the process. The main cause of irreversibility in the process is due to conversion of chemical energy of the fuel to thermal energy. For the second operating condition (Production rate of 1369 tonnes per day) first law and second law efficiencies of the kiln system were found to be 42.36% and 28.6% respectively. The irreversibility of the system was found to be kj/kg-clinker (55.87%). The values are very close to the previous operating condition. The energy loss by the preheater exhaust gas and cooler exhaust were found to be kj/kg-clinker (26.29%) and kJ/kg-clinker (11.2%) respectively. As a result the total energy recovery potential from these waste gases in this operating condition was estimated to be 37.49%. Here results obtained for the energy and exergy analyses of the kiln system were almost close to the first operating condition (Production rate of 1400 tonnes per day). Therefore the average values of the energy and exergy efficiencies of the kiln system were found to be 42.08% and 28.45% respectively
CO 2 Capture and Storage: Options and Challenges for the Cement Industry
 CO 2 Capture and Storage: Options and Challenges for the Cement Industry Martin Schneider, Düsseldorf, Germany CSI Workshop Beijing, 16 17 November 2008 CO 2 abatement costs will tremendously increase
ME ENGINEERING THERMODYNAMICS UNIT III QUESTION BANK SVCET
 1. A vessel of volume 0.04m 3 contains a mixture of saturated water and steam at a temperature of 250 0 C. The mass of the liquid present is 9 kg. Find the pressure, mass, specific volume, enthalpy, entropy
CEMENT MANUFACTURING PROCESS
 CEMENT MANUFACTURING PROCESS Definition: Defined as a product material obtained by calcination of calcareous (a material containing lime) and argillaceous (a material which contain silica) materials. According
16 th NATIONAL CERTIFICATION EXAMINATION FOR ENERGY MANAGERS & ENERGY AUDITORS September, 2015
 16 th NATIONAL CERTIFICATION EXAMINATION FOR ENERGY MANAGERS & ENERGY AUDITORS September, 2015 PAPER 2: Energy Efficiency in Thermal Utilities Date: 19.09.2015 Timings: 1400-1700 HRS Duration: 3 HRS Max.
CHAPTER 1 BASIC CONCEPTS
 GTU Paper Analysis CHAPTER 1 BASIC CONCEPTS Sr. No. Questions Jan 15 Jun 15 Dec 15 May 16 Jan 17 Jun 17 Nov 17 May 18 Differentiate between the followings; 1) Intensive properties and extensive properties,
MODEL SOLUTIONS. 16 th NATIONAL CERTIFICATION EXAMINATION FOR ENERGY MANAGERS & ENERGY AUDITORS September, 2015
 MODEL SOLUTIONS 16 th NATIONAL CERTIFICATION EXAMINATION FOR ENERGY MANAGERS & ENERGY AUDITORS September, 2015 PAPER 2: Energy Efficiency in Thermal Utilities Date: 19.09.2015 Timings: 1400-1700 HRS Duration:
(Part 2: Cement Industry Sector) Stanley Santos
 Stanley Santos") Challenges to the Deployment of CCS in the Energy Intensive Industries (Part 2: Cement Industry Sector) Stanley Santos IEA Greenhouse Gas R&D Programme Cheltenham, UK IEA MOST Joint Workshop CCS Opportunities
Challenges to the Deployment of CCS in the Energy Intensive Industries (Part 2: Cement Industry Sector) Stanley Santos IEA Greenhouse Gas R&D Programme Cheltenham, UK IEA MOST Joint Workshop CCS Opportunities
Fully Integrated Simulation of a Cement Plant with a Carbon Capture Ca-looping Process
 Fully Integrated Simulation of a Cement Plant with a Carbon Capture Ca-looping Process Dursun Can Ozcan, Hyungwoong Ahn, Stefano Brandani Institute for Materials and Processes School of Engineering University
Problems in chapter 9 CB Thermodynamics
 Problems in chapter 9 CB Thermodynamics 9-82 Air is used as the working fluid in a simple ideal Brayton cycle that has a pressure ratio of 12, a compressor inlet temperature of 300 K, and a turbine inlet
CEMENT PLANT ENVIRONMENTAL TECHNOLOGY FOR ACHIEVING HIGH SO 2 REMOVAL
 CEMENT PLANT ENVIRONMENTAL TECHNOLOGY FOR ACHIEVING HIGH SO 2 REMOVAL Sara Safariyeganeh sara.safariyeganeh@mecsglobal.com Cary Joe Lovett, PE joe.lovett@holcim.com Abstract - The EPA has adopted revised
OPTIMIZATION OF PARAMETERS FOR HEAT RECOVERY STEAM GENERATOR (HRSG) IN COMBINED CYCLE PLANTS
 IN COMBINED CYCLE PLANTS") OPTIMIZATION OF PARAMETERS FOR HEAT RECOVERY STEAM GENERATOR (HRSG) IN COMBINED CYCLE PLANTS Muammer Alus, Milan V. Petrovic University of Belgrade-Faculty of Mechanical Engineering, Laboratory of Thermal
OPTIMIZATION OF PARAMETERS FOR HEAT RECOVERY STEAM GENERATOR (HRSG) IN COMBINED CYCLE PLANTS Muammer Alus, Milan V. Petrovic University of Belgrade-Faculty of Mechanical Engineering, Laboratory of Thermal
14 th NATIONAL CERTIFICATION EXAMINATION FOR ENERGY AUDITORS August, 2013
 14 th NATIONAL CERTIFICATION EXAMINATION FOR ENERGY AUDITORS August, 2013 PAPER 4: Energy Performance Assessment for Equipment and Utility Systems Date: 25.8.2013 Timings: 14:00-16:00 Hrs Duration: 2 Hrs
Verification of Microfine Lime Theoretical Model for SO 2 Removal in Precalciner Cement Plants
 Verification of Microfine Lime Theoretical Model for SO 2 Removal in Precalciner Cement Plants Paper # 34 Ronald L. Hawks, V.P. Design Engineering Environmental Quality Management, Inc. 3325 Durham-Chapel
Chapter 1 STEAM CYCLES
 Chapter 1 STEAM CYCLES Assoc. Prof. Dr. Mazlan Abdul Wahid Faculty of Mechanical Engineering Universiti Teknologi Malaysia www.fkm.utm.my/~mazlan 1 Chapter 1 STEAM CYCLES 1 Chapter Objectives To carry
CO 2 capture using lime as sorbent in a carbonation/calcination cycle
 capture using lime as sorbent in a carbonation/calcination cycle Adina Bosoaga 1 and John Oakey Energy Technology Centre, Cranfield University, Cranfield, MK43 0AL, UK 1 Corresponding author: a.bosoaga@cranfield.ac.uk
Chapter 10 POWER CYCLES. Department of Mechanical Engineering
 Chapter 10 VAPOR AND COMBINED POWER CYCLES Dr Ali Jawarneh Department of Mechanical Engineering Hashemite University it 2 Objectives Analyze vapor power cycles in which h the working fluid is alternately
- 2 - SME Q1. (a) Briefly explain how the following methods used in a gas-turbine power plant increase the thermal efficiency:
 Briefly explain how the following methods used in a gas-turbine power plant increase the thermal efficiency:") - 2 - Q1. (a) Briefly explain how the following methods used in a gas-turbine power plant increase the thermal efficiency: i) regenerator ii) intercooling between compressors (6 marks) (b) Air enters a
- 2 - Q1. (a) Briefly explain how the following methods used in a gas-turbine power plant increase the thermal efficiency: i) regenerator ii) intercooling between compressors (6 marks) (b) Air enters a
R13 SET - 1 '' ''' '' ' '''' Code No: RT31035
 R13 SET - 1 III B. Tech I Semester Regular/Supplementary Examinations, October/November - 2016 THERMAL ENGINEERING II (Mechanical Engineering) Time: 3 hours Max. Marks: 70 Note: 1. Question Paper consists
SHRI RAMSWAROOP MEMORIAL COLLEGE OF ENGG. & MANAGEMENT B.Tech. [SEM IV (ME-41, 42,43 & 44)] QUIZ TEST-1 (Session: )
![SHRI RAMSWAROOP MEMORIAL COLLEGE OF ENGG. & MANAGEMENT B.Tech. [SEM IV (ME-41, 42,43 & 44)] QUIZ TEST-1 (Session: )](/thumbs/72/67555697.jpg "SHRI RAMSWAROOP MEMORIAL COLLEGE OF ENGG. & MANAGEMENT B.Tech. [SEM IV (ME-41, 42,43 & 44)] QUIZ TEST-1 (Session: )") QUIZ TEST-1 Q.1. In a stage of an impulse turbine provided with a single row wheel, the mean diameter of the blade ring is 80cm and the speed of the rotation is 3000rpm. The steam issues from the nozzle
QUIZ TEST-1 Q.1. In a stage of an impulse turbine provided with a single row wheel, the mean diameter of the blade ring is 80cm and the speed of the rotation is 3000rpm. The steam issues from the nozzle
Department of Mechanical Engineering. MSc/PGDip/PGCert in Energy Systems and the Environment. Specialist Modules
 Department of Mechanical Engineering MSc/PGDip/PGCert in Energy Systems and the Environment Specialist Modules Wednesday 17 January 2007 2.00pm 5.00pm (3 hours) Full-time MSc/PGDip/PGCert students should
CHAPTER 3 HEURISTIC APPROACH TO MODELING THE BOILER FURNACE
 CHAPTER 3 HEURISTIC APPROACH TO MODELING THE BOILER FURNACE 3.1 INTRODUCTION Modeling and simulation of boiler systems has been an interesting subject of investigation for many years. Mathematical modeling
Chapters 5, 6, and 7. Use T 0 = 20 C and p 0 = 100 kpa and constant specific heats unless otherwise noted. Note also that 1 bar = 100 kpa.
 Chapters 5, 6, and 7 Use T 0 = 20 C and p 0 = 100 kpa and constant specific heats unless otherwise noted. Note also that 1 bar = 100 kpa. 5-1. Steam enters a steady-flow device at 16 MPa and 560 C with
a. The power required to drive the compressor; b. The inlet and output pipe cross-sectional area. [Ans: kw, m 2 ] [3.34, R. K.
![a. The power required to drive the compressor; b. The inlet and output pipe cross-sectional area. [Ans: kw, m 2 ] [3.34, R. K.](/thumbs/76/73432086.jpg "a. The power required to drive the compressor; b. The inlet and output pipe cross-sectional area. [Ans: kw, m 2 ] [3.34, R. K.") CHAPTER 2 - FIRST LAW OF THERMODYNAMICS 1. At the inlet to a certain nozzle the enthalpy of fluid passing is 2800 kj/kg, and the velocity is 50 m/s. At the discharge end the enthalpy is 2600 kj/kg. The
CHAPTER 2 - FIRST LAW OF THERMODYNAMICS 1. At the inlet to a certain nozzle the enthalpy of fluid passing is 2800 kj/kg, and the velocity is 50 m/s. At the discharge end the enthalpy is 2600 kj/kg. The
MODEL SOLUTIONS. 16 th NATIONAL CERTIFICATION EXAMINATION FOR ENERGY MANAGERS & ENERGY AUDITORS September, 2015
 MODEL SOLUTIONS 16 th NATIONAL CERTIFICATION EXAMINATION FOR ENERGY MANAGERS & ENERGY AUDITORS September, 2015 PAPER 2: Energy Efficiency in Thermal Utilities Date: 19.09.2015 Timings: 1400-1700 HRS Duration:
15 th NATIONAL CERTIFICATION EXAMINATION FOR ENERGY AUDITORS August, 2014
 15 th NATIONAL CERTIFICATION EXAMINATION FOR ENERGY AUDITORS August, 2014 Paper 4 SET A PAPER 4: Energy Performance Assessment for Equipment and Utility Systems Date: 24.8.2013 Timings: 14:00-16:00 Hrs
MODEL SOLUTIONS. 16 th NATIONAL CERTIFICATION EXAMINATION FOR ENERGY MANAGERS & ENERGY AUDITORS September, 2015
 MODEL SOLUTIONS 16 th NATIONAL CERTIFICATION EXAMINATION FOR ENERGY MANAGERS & ENERGY AUDITORS September, 2015 PAPER 2: Energy Efficiency in Thermal Utilities Date: 19.09.2015 Timings: 1400-1700 HRS Duration:
AN INDIRECT-FIRED ROTARY SUGARCANE BAGASSE TORREFYER: DESIGN AND PERFORMANCE
 Technical Bulletin No. 40 AN INDIRECT-FIRED ROTARY SUGARCANE BAGASSE TORREFYER: DESIGN AND PERFORMANCE by Alexis Belonio, Isidore Alcantara and Daniel Belonio Sugar mills basically require a lot of power
ENVIRONOMIC CONSEQUENCES OF CCS TECHNOLOGY INTEGRATION IN THE CEMENT PROCESS CHAIN
 ENVIRONOMIC CONSEQUENCES OF CCS TECHNOLOGY INTEGRATION IN THE CEMENT PROCESS CHAIN Nela SLAVU 1,2, Cristian DINCA 1, Roxana PATRASCU 1, Energy Generation and Use Department, University POLITEHNICA of Bucharest,
Chapter 10. In Chap. 9 we discussed gas power cycles for which the VAPOR AND COMBINED POWER CYCLES. Objectives
 Chapter 0 VAPOR AND COMBINED POWER CYCLES In Chap. 9 we discussed gas power cycles for which the working fluid remains a gas throughout the entire cycle. In this chapter, we consider vapor power cycles
Industrial Gas Analyzers in Applications Information
 Industrial Gas Analyzers in Applications Information Engine and Diesel Testing www.eurotron.co.kr Thousands of internal combustion engines are located throughout the world. They range in size from small
CALCIUM LOOPING PROCESS FOR CLEAN FOSSIL FUEL CONVERSION. Shwetha Ramkumar, Robert M. Statnick, Liang-Shih Fan. Daniel P. Connell
 CALCIUM LOOPING PROCESS FOR CLEAN FOSSIL FUEL CONVERSION Shwetha Ramkumar, Robert M. Statnick, Liang-Shih Fan William G. Lowrie Department of Chemical and Biomolecular Engineering The Ohio State University
Chapter 10. In Chap. 9 we discussed gas power cycles for which the VAPOR AND COMBINED POWER CYCLES. Objectives
 Chapter 0 VAPOR AND COMBINED POWER CYCLES In Chap. 9 we discussed gas power cycles for which the working fluid remains a gas throughout the entire cycle. In this chapter, we consider vapor power cycles
16 th NATIONAL CERTIFICATION EXAMINATION FOR ENERGY MANAGERS & ENERGY AUDITORS September, 2015
 Regn No: Name : (To be written by the candidate) 16 th NATIONAL CERTIFICATION EXAMINATION FOR ENERGY MANAGERS & ENERGY AUDITORS September, 2015 PAPER 2: Energy Efficiency in Thermal Utilities Date: 19.09.2015
Chapter Two. The Rankine cycle. Prepared by Dr. Shatha Ammourah
 Chapter Two The Rankine cycle Prepared by Dr. Shatha Ammourah 1 The Ideal Rankine Cycle Schematic Diagram of ideal simple Rankine 2 Superheater Economizer line 3 Heat Addition Types In The Steam Generator
Performance Analysis of Cement manufacturing Industry
 www.ijecs.in International Journal Of Engineering And Computer Science ISSN:2319-7242 Volume 4 Issue 3 March 2015, Page No. 10937-10941 Performance Analysis of Cement manufacturing Industry Neeraj Pandagre
S.E. (Mechanical) (First Semester) EXAMINATION, 2012 APPLIED THERMODYNAMICS (2008 PATTERN) Time : Three Hours Maximum Marks : 100
 (First Semester) EXAMINATION, 2012 APPLIED THERMODYNAMICS (2008 PATTERN) Time : Three Hours Maximum Marks : 100") Total No. of Questions 12] [Total No. of Printed Pages 8 Seat No. [4162]-111 S.E. (Mechanical) (First Semester) EXAMINATION, 2012 APPLIED THERMODYNAMICS (2008 PATTERN) Time : Three Hours Maximum Marks
Total No. of Questions 12] [Total No. of Printed Pages 8 Seat No. [4162]-111 S.E. (Mechanical) (First Semester) EXAMINATION, 2012 APPLIED THERMODYNAMICS (2008 PATTERN) Time : Three Hours Maximum Marks
19 th NATIONAL CERTIFICATION EXAMINATION FOR ENERGY MANAGERS & ENERGY AUDITORS SEPTEMBER, 2018 PAPER 2: ENERGY EFFICIENCY IN THERMAL UTILITIES
 Paper 2 Set A 19 th NATIONAL CERTIFICATION EXAMINATION FOR ENERGY MANAGERS & ENERGY AUDITORS SEPTEMBER, 2018 PAPER 2: ENERGY EFFICIENCY IN THERMAL UTILITIES Section I: OBJECTIVE TYPE Marks: 50 x 1 = 50
Chapter 8. Vapor Power Systems
 Chapter 8 Vapor Power Systems Introducing Power Generation To meet our national power needs there are challenges related to Declining economically recoverable supplies of nonrenewable energy resources.
SUBSTITUTION OF COAL BY REFUSE DERIVED FUELS (RDF) IN THE PRECALCINER OF A CEMENT KILN SYSTEM
 IN THE PRECALCINER OF A CEMENT KILN SYSTEM") Energy and Sustainability VII 411 SUBSTITUTION OF COAL BY REFUSE DERIVED FUELS (RDF) IN THE PRECALCINER OF A CEMENT KILN SYSTEM AMILA CHANDRA KAHAWALAGE, MORTEN C. MELAAEN, LARS-ANDRÉ TOKHEIM Department
Energy and Sustainability VII 411 SUBSTITUTION OF COAL BY REFUSE DERIVED FUELS (RDF) IN THE PRECALCINER OF A CEMENT KILN SYSTEM AMILA CHANDRA KAHAWALAGE, MORTEN C. MELAAEN, LARS-ANDRÉ TOKHEIM Department
17 th NATIONAL CERTIFICATION EXAMINATION FOR ENERGY MANAGERS & ENERGY AUDITORS September, PAPER 2: Energy Efficiency in Thermal Utilities
 Regn No: Name : (To be written by the candidate) 17 th NATIONAL CERTIFICATION EXAMINATION FOR ENERGY MANAGERS & ENERGY AUDITORS September, 2016 PAPER 2: Energy Efficiency in Thermal Utilities Date: 24.09.2015
Robust flue gas probes for industrial emissions measurements.
 Robust flue gas probes for industrial emissions measurements. For reliable measurements using testo 340 and testo 350, even in the harshest of conditions. Robust flue gas probes for industrial emissions
NATIONAL CERTIFICATION EXAMINATION 2004 FOR ENERGY MANAGERS
 NATIONAL CERTIFICATION EXAMINATION 2004 FOR ENERGY MANAGERS PAPER EM2: Energy Efficiency in Thermal Utilities Date: 22.05.2004 Timings: 1400-1700 HRS Duration: 3 HRS Max. Marks: 150 General instructions:
Thermodynamic analysis on post combustion CO 2 capture of natural gas fired power plant
 Thermodynamic analysis on post combustion CO 2 capture of natural gas fired power plant Abstract Zeinab Amrollahi, 1 Ivar S. Ertesvåg, Olav Bolland Department of Energy and Process Engineering, Norwegian
OUTCOME 2 TUTORIAL 2 STEADY FLOW PLANT
 UNIT 47: Engineering Plant Technology Unit code: F/601/1433 QCF level: 5 Credit value: 15 OUTCOME 2 TUTORIAL 2 STEADY FLOW PLANT 2 Be able to apply the steady flow energy equation (SFEE) to plant and equipment
Industrial Thermal Utilities
 Industrial Thermal Utilities Engr. Adnan Qamar Lecturer adnan@uet.edu.pk WEEK_06 Introduction What is Waste Heat? Dumped heat that can still be reused Value (quality) more important than quantity Waste
Chapter 9: Vapor Power Systems
 Chapter 9: Vapor Power Systems Table of Contents Introduction... 2 Analyzing the Rankine Cycle... 4 Rankine Cycle Performance Parameters... 5 Ideal Rankine Cycle... 6 Example... 7 Rankine Cycle Including
Chapter 4.3: Cogeneration, Turbines (Gas, Steam)
") Short type questions Chapter 4.3: Cogeneration, Turbines (Gas, Steam) 1. What could be the range of energy saving potential from co-generation systems? Co-generation offers energy savings in the range
Short type questions Chapter 4.3: Cogeneration, Turbines (Gas, Steam) 1. What could be the range of energy saving potential from co-generation systems? Co-generation offers energy savings in the range
NEW TECHNOLOGIES IN COAL-FIRED THERMAL POWER PLANTS FOR MORE EFFECTIVE WORK WITH LESS POLLUTION
 UDK 621.311.22:502.174 Dip.el.eng. Igor SEKOVSKI NEW TECHNOLOGIES IN COAL-FIRED THERMAL POWER PLANTS FOR MORE EFFECTIVE WORK WITH LESS POLLUTION Abstract Today people make a lot of analysis, of work of
WSA-DC NEXT GENERATION TOPSØE WSA TECHNOLOGY FOR STRONGER SO 2 GASES AND VERY HIGH CONVERSION. Helge Rosenberg Haldor Topsoe
 WSA-DC NEXT GENERATION TOPSØE WSA TECHNOLOGY FOR STRONGER SO 2 GASES AND VERY HIGH CONVERSION Helge Rosenberg Haldor Topsoe Up to now, Topsøe WSA (Wet gas Sulphuric Acid) plants have been in operation
ADECOS II. Advanced Development of the Coal-Fired Oxyfuel Process with CO 2 Separation
 Fakultät Maschinenwesen Institut für Energietechnik, Professur für Verbrennung, Wärme- & Stoffübertragung ADECOS II Advanced Development of the Coal-Fired Oxyfuel Process with CO 2 S. Grahl, A. Hiller,
Design and distribution of air nozzles in the biomass boiler assembly
 TRANSACTIONS OF THE INSTITUTE OF FLUID-FLOW MACHINERY No. 125, 2013, 13 28 KAROL RONEWICZ, TOMASZ TURZYŃSKI, DARIUSZ KARDAŚ Design and distribution of air nozzles in the biomass boiler assembly The Szewalski
Design Features of Combined Cycle Systems
 Design Features of Combined Cycle Systems 1.0 Introduction As we have discussed in class, one of the largest irreversibilities associated with simple gas turbine cycles is the high temperature exhaust.
Cryogenic Carbon Capture
 Cryogenic Carbon Capture Sustainable Energy Solutions Sustainable Energy Solutions Sustainable Energy Solutions (SES) was founded in 2008 in response to a growing need for solutions to sustainability problems
Pinch Analysis for Power Plant: A Novel Approach for Increase in Efficiency
 Pinch Analysis for Power Plant: A Novel Approach for Increase in Efficiency S. R. Sunasara 1, J. J. Makadia 2 * 1,2 Mechanical Engineering Department, RK University Kasturbadham, Rajkot-Bhavngar highway,
Steam balance optimisation strategies
 Steam balance optimisation strategies Publicado en Chemical Engineering, Noviembre 2002 Background Optimising a steam balance in a plant with several steam mains pressures is not always a simple intuitive
Performance Improvement of Single-Flash Geothermal Power Plant Applying Three Cases Development Scenarios Using Thermodynamic Methods
 Proceedings World Geothermal Congress 2015 Melbourne, Australia, 19-25 April 2015 Performance Improvement of Single-Flash Geothermal Power Plant Applying Three Cases Development Scenarios Using Thermodynamic
PI Heat and Thermodynamics - Course PI 25 CRITERION TEST. of each of the following a. it
 Heat and Thermodynamics - Course PI 25 CRITERION TESTS PI 25-1 - 1. Define: heat temperature (c) enthalpy 2. State the applies to meaning water: of each of the following a. it saturation temperature subcooled
CERTIFICATES OF COMPETENCY IN THE MERCHANT NAVY MARINE ENGINEER OFFICER
 CERTIFICATES OF COMPETENCY IN THE MERCHANT NAVY MARINE ENGINEER OFFICER EXAMINATIONS ADMINISTERED BY THE SCOTTISH QUALIFICATIONS AUTHORITY ON BEHALF OF THE MARITIME AND COASTGUARD AGENCY STCW 95 CHIEF
National Cement Comp. LOGO
 Fac.Of Eng. LOGO National Cement Comp. LOGO WASTE HEAT RECOVERY SYSTEM (WHRS) FOR CEMENT INDUSTRY - A CASESTUDY FOR HADHRAMOUT CEMENT FACTORY, ARABIAN YEMEN CEMENT COMPANY LIMITED (AYCCL) MUKALLA HADHRAMOUT
MATHEMATICAL MODELLING OF THE CEMENT CLINKER BURNING PROCESS
 MATHEMATICAL MODELLING OF THE CEMENT CLINKER BURNING PROCESS Dr. sc. techn. G. Locher, Dipl.-Ing. H. Klein Verein Deutscher Zementwerke e. V., Tannenstraße 2, 40476 Düsseldorf, Germany Summary The mathematical
Practice Final Exam (A) Six problems. (Open-book, HW solutions, and notes) (Plus /minus 10 % error acceptable for all numerical answers)
 Six problems. (Open-book, HW solutions, and notes) (Plus /minus 10 % error acceptable for all numerical answers)") ME 3610 Practice Final Exam (A) Six problems. (Open-book, HW solutions, and notes) (Plus /minus 10 % error acceptable for all numerical answers) (18 points) 1. A gasoline engine operating on the ideal
ME 3610 Practice Final Exam (A) Six problems. (Open-book, HW solutions, and notes) (Plus /minus 10 % error acceptable for all numerical answers) (18 points) 1. A gasoline engine operating on the ideal
Boiler and. steadily increases while the supply decreases energy
 FEATURE ARTICLE by William G. Acker ENERGY SURVEYS FOR Stewart Cohen/Stone The efficient use of energy is fast becoming a top concern for industry. As business managers become more conscientious about
Eng Thermodynamics I - Examples 1
 Eng3901 - Thermodynamics I - Examples 1 1 pdv Work 1. Air is contained in a vertical frictionless piston-cylinder. The mass of the piston is 500 kg. The area of the piston is 0.005 m 2. The air initially
Concrete Technology. 1- Neville, AM and Brooks J.J." Concrete Technology" Second Edition, 2010.
 Syllabus. Introduction 2. Cement 3. Aggregate 4. Fresh Concrete 5. Strength of Concrete 6. Elasticity, Shrinkage and Creep 7. Concrete Durability 8. Concrete Mix Design 9. Special Concretes Text Book -
CHAPTER 1 BASIC CONCEPTS THEORY
 CHAPTER 1 BASIC CONCEPTS THEORY 1. Explain briefly the following terms with diagram (wherever necessary): a) Thermodynamic System, Surroundings & Boundary b) Control Volume & Control Surface c) Intensive
Energy Saving Measures in. Cement Industry
 CH2356 Energy Engineering Energy Saving Measures in Cement Industry Dr. M. Subramanian Associate Professor Department of Chemical Engineering Sri Sivasubramaniya Nadar College of Engineering Kalavakkam
CONTROL STRTEGIES FOR FLEXIBLE OPERATION OF POWER PLANT INTEGRATED WITH CO2 CAPTURE PLANT
 CONTROL STRTEGIES FOR FLEXIBLE OPERATION OF POWER PLANT INTEGRATED WITH CO2 CAPTURE PLANT Yu-Jeng Lin a, Chun-Cheng Chang a, David Shan-Hill Wong a Shi-Shang Jang a * and Jenq-Jang Ou b a National Tsing-Hua
Self-Aspirating Radiant Tube Burner
 Self-Aspirating Radiant Tube Burner Chanon Chuenchit and Sumrerng Jugjai * Combustion and Engine Research Laboratory (CERL), Department of Mechanical Engineering, Faculty of Engineering, King Mongkut s
Lecture No.1. Vapour Power Cycles
 Lecture No.1 1.1 INTRODUCTION Thermodynamic cycles can be primarily classified based on their utility such as for power generation, refrigeration etc. Based on this thermodynamic cycles can be categorized
COOLING TOWER DESIGN FOR CENTRAL GENERATORS OF CUET, BANGLADESH. Mohammad Sharif Khan, Golam Mainuddin, Abu Sadat Mohammad Sayem, Nadeem Nafis
 Proceedings of the 4 th BSME-ASME International Conference on Thermal Engineering 7-9 December, 008, Dhaka, Bangladesh COOLING TOWER DESIGN FOR CENTRAL GENERATORS OF CUET, BANGLADESH. Mohammad Sharif Khan,
Potential of Allam cycle with natural gas to reduce carbon dioxide emission in India
 The 6 th International Symposium-Supercritical CO2 Power Cycles, March 27-29, 2018, Pittsburgh, PA Potential of Allam cycle with natural gas to reduce carbon dioxide emission in India Amit Mulchand Nabros
Energy Integration in the cement industry
 Andrzej Kraslawski and Ilkka Turunen (Editors) Proceedings of the 23 rd European Symposium on Computer Aided Process Engineering ESCAPE 23 June 9-12, 2013, Lappeenranta, Finland, 2013 Elsevier B.V. All
Exergy in Processes. Flows and Destruction of Exergy
 Exergy in Processes Flows and Destruction of Exergy Exergy of Different Forms of Energy Chemical Energy Heat Energy Pressurised Gas Electricity Kinetic Energy Oxidation of Methane ΔH = -890.1 kj/mol ΔS
Superior Efficiency Reduced Costs Viable Alternative Energy Kalex Kalina Cycle Power Systems For Cement Kiln Waste Heat Applications
 Superior Efficiency Reduced Costs Viable Alternative Energy Kalex Kalina Cycle Power Systems For Cement Kiln Waste Heat Applications Copyright 2010, Kalex LLC. Kalex LLC's Kalina Cycle for Cement Kiln
Chapter 10 VAPOR AND COMBINED POWER CYCLES
 Thermodynamics: An Engineering Approach, 6 th Edition Yunus A. Cengel, Michael A. Boles McGraw-Hill, 2008 Chapter 10 VAPOR AND COMBINED POWER CYCLES Copyright The McGraw-Hill Companies, Inc. Permission
Eng Thermodynamics I - Examples 1
 Eng3901 - Thermodynamics I - Examples 1 1 pdv Work 1. Air is contained in a vertical frictionless piston-cylinder. The mass of the piston is 500 kg. The area of the piston is 0.005 m 2. The air initially
MODELING THERMODYNAMIC ANALYSIS AND SIMULATION OF ORGANIC RANKINE CYCLE USING GEOTHERMAL ENERGY AS HEAT SOURCE
 MODELING THERMODYNAMIC ANALYSIS AND SIMULATION OF ORGANIC RANKINE CYCLE USING GEOTHERMAL ENERGY AS HEAT SOURCE Colak L.* and Bahadir T. *Author for correspondence Department of Mechanical Engineering,
Stationary Combustion Systems Chapter 6
 Stationary Combustion Systems Chapter 6 Stationary combustion systems presently supply most of the earth s electricity. Conversion will take time, so study of these systems in order to improve them is
Scott Hume. Electric Power Research Institute, 1300 West WT Harris Blvd, Charlotte NC 28262
 The 5th International Symposium - Supercritical CO 2 Power Cycles March 28-31, 2016, San Antonio, Texas Performance Evaluation of a Supercritical CO 2 Power Cycle Coal Gasification Plant Scott Hume Electric
Reboiler heat energy recovery using integration process industries to increase their efficiency
 International Journal of Advanced Biotechnology and Research IJBR ISSN 0976-61, Online ISSN 78 599X, Vol-7, Special Issue-March, 016, pp306-313 http://www.bipublication.com Research Article Reboiler heat
Insert flexibility into your hydrogen network Part 2
 Insert flexibility into your hydrogen network Part 2 Fine-tuning utilities operation can conserve energy management and reduce operating costs N. PATEL, K. LUDWIG and P. MORRIS, Air Products and Chemicals,
Fluid Mechanics, Heat Transfer, Thermodynamics. Design Project. Production of Ammonia
 Fluid Mechanics, Heat Transfer, Thermodynamics Design Project Production of Ammonia Your assignment is to continue evaluating the details of a process to produce 50,000 tonne/y of ammonia from a syngas
R13. II B. Tech I Semester Regular/Supplementary Examinations, Oct/Nov THERMODYNAMICS (Com. to ME, AE, AME) Time: 3 hours Max.
 Time: 3 hours Max.") SET - 1 1. a) Discuss about PMM I and PMM II b) Explain about Quasi static process. c) Show that the COP of a heat pump is greater than the COP of a refrigerator by unity. d) What is steam quality? What
SET - 1 1. a) Discuss about PMM I and PMM II b) Explain about Quasi static process. c) Show that the COP of a heat pump is greater than the COP of a refrigerator by unity. d) What is steam quality? What
Theme 4. Energy Efficiency. I-Fundamentals. Nguyen Thi Anh Tuyet Hanoi University of Science and Technology
 Theme 4 Energy Efficiency I-Fundamentals Nguyen Thi Anh Tuyet Hanoi University of Science and Technology Energy types Contents - Primary energy - Secondary energy - The difference between power and energy
Hydrogen oxygen steam generator integrating with renewable energy resource for electricity generation
 Available online at www.sciencedirect.com Energy Procedia 29 (2012 ) 12 20 World Hydrogen Energy Conference 2012 Hydrogen oxygen steam generator integrating with renewable energy resource for electricity
Hamm MW Pyrolysis Plant. Integrated Pyrolysis into Power Plant Plant capacity 100,000 t/a Pre-processed Waste Materials
 Integrated Pyrolysis into Power Plant Plant capacity 100,000 t/a Pre-processed Waste Materials Schematic Flow sheet Integrated Pyrolysis for Power Plants Pyrolysis of high calorific solid recovered fuels
Cryogenic Carbon Capture University of Wyoming Bench Scale Project Final Executive Summary Report -Sponsor- Wyoming Department of Environmental
 Cryogenic Carbon Capture University of Wyoming Bench Scale Project Final Executive Summary Report -Sponsor- Wyoming Department of Environmental Quality Sustainable Energy Solutions Wyoming Bench-Scale
MECHANICAL ENGINEERING DEPARTMENT, OITM
 Sem.:4 th Subject: Energy Conversion Paper: ME-201E UNIT-1 Q1. Explain the seismometer with its working principle. (Important Question) (20) Q2. Classify the fuels and define calorific value of fuels.
1. To improve heat exchange between a gas & a liquid stream in a heat exchanger, it is decided to use fins. Correct the suitable option.
 1. To improve heat exchange between a gas & a liquid stream in a heat exchanger, it is decided to use fins. Correct the suitable option. a) Fins are generally attached on gas side. b) Fins are generally
IRISH CEMENT PLATIN INVESTING IN OUR FUTURE
 IRISH CEMENT PLATIN INVESTING IN OUR FUTURE INTRODUCTION Investing in our future. The next phase of investment in Platin will see further energy efficiency improvements with on site electricity generation
International Journal of Advance Engineering and Research Development
 Scientific Journal of Impact Factor (SJIF): 4.72 International Journal of Advance Engineering and Research Development Volume 4, Issue 9, September -2017 Review of Thermal Characteristics of Diesel Fired
THE ASSESSMENT OF A WATER-CYCLE FOR CAPTURE OF CO2
 THE ASSESSMENT OF A WATER-CYCLE FOR CAPTURE OF CO2 Report Number PH3/4 November 1998 This document has been prepared for the Executive Committee of the Programme. It is not a publication of the Operating
CaCO 3 CaO + CO 2 MgCO 3 MgO + CO 2 CaCO 3 MgCO 3 CaO MgO + 2 CO 2 FeCO 3 FeO + CO 2 FeO + CO Fe +CO 2
 A. Fundamentals 1. Introduction 1.1 Principle mechanism Shaft kilns and cupola furnaces are used for the mass conversion and melting of granular and coarse materials. The material is transported through
Sulfur Tail Gas Thermal Oxidizer Systems By Peter Pickard
 Sulfur Tail Gas Thermal Oxidizer Systems By Peter Pickard Introduction SRU s (Sulfur Recovery Units) are critical pieces of equipment in refineries and gas plants. SRUs remove sulfur compounds from certain
Estimation of Boil-off-Gas BOG from Refrigerated Vessels in Liquefied Natural Gas Plant
 International Journal of Engineering and Technology Volume 3 No. 1, January, 2013 Estimation of Boil-off-Gas BOG from Refrigerated Vessels in Liquefied Natural Gas Plant Wordu, A. A, Peterside, B Department
17 th NATIONAL CERTIFICATION EXAMINATION FOR ENERGY MANAGERS & ENERGY AUDITORS September, 2016 PAPER 1: GENERAL ASPECTS OF ENERGY MANAGEMENT & ENERGY
 17 th NATIONAL CERTIFICATION EXAMINATION FOR ENERGY MANAGERS & ENERGY AUDITORS September, 2016 PAPER 1: GENERAL ASPECTS OF ENERGY MANAGEMENT & ENERGY AUDIT Date: 24.09.2016 Timings: 0930-1230 HRS Duration:
EFFECT OF AMBIENT TEMPERATURE, GAS TURBINE INLET TEMPERATURE AND COMPRESSOR PRESSURE RATIO ON PERFORMANCE OF COMBINED CYCLE POWER PLANT
 EFFECT OF AMBIENT TEMPERATURE, GAS TURBINE INLET TEMPERATURE AND COMPRESSOR PRESSURE RATIO ON PERFORMANCE OF COMBINED CYCLE POWER PLANT Harendra Singh 1, Prashant Kumar Tayal 2 NeeruGoyal 3, Pankaj Mohan
SIMPACK - MODEL DEVELOPMENT PACKAGE FOR POWER PLANTS
 SIMPACK - MODEL DEVELOPMENT PACKAGE FOR POWER PLANTS 1.0 OVERVIEW SIMPACK is a totally integrated set of simulation software development modules for power plants. It is template based modeling tool and
Improvement of distillation column efficiency by integration with organic Rankine power generation cycle. Introduction
 Improvement of distillation column efficiency by integration with organic Rankine power generation cycle Dmitriy A. Sladkovskiy, St.Petersburg State Institute of Technology (technical university), Saint-
C. heating turbine exhaust steam above its saturation temperature. D. cooling turbine exhaust steam below its saturation temperature.
 P74 (B2277) Condensate depression is the process of... A. removing condensate from turbine exhaust steam. B. spraying condensate into turbine exhaust steam. C. heating turbine exhaust steam above its saturation