The Guanabara Bay Report Card. Bill Dennison 29 April 2016
|
|
|
- Edwina Cole
- 6 years ago
- Views:
Transcription
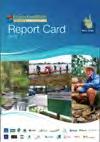
1 The Guanabara Bay Report Card Bill Dennison 29 April 2016


2 university of Maryland Center for environmental science and the integration and application Network UMCES formed in 1925 to provide practical environmental advice UMCES defines scholarship as discovery, integration, application, and teaching IAN was created in 2002 to address integration and application

3 Who are we? IAN s aim is to enable better communication to empower change.


4 IAN has three main focus areas Develop Science Communication products Environmental Report Cards Science Communication Training
5 Solving, not just studying environmental problems STUDY Dispassionate Embrace complexity Publish & funding via peer review Getting it right SOLVE Passionate Simplify Publish & funding via stakeholders Getting it done

6 Synthesizing information for less technical audiences Synthesis Visualization Context Synthesized data Illustrate key points So what?
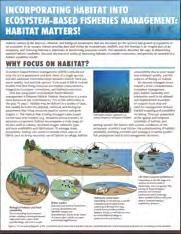
7 What is an ecosystem health Broad-level assessments of a region or system Communicate complex information Based on real data: transparent and defendable Provide accountability Engage communities report card?


8 Ecosystem health report cards are an effective communication tool Peer pressure is a powerful human motivator Educational report cards are a common experience Report cards synthesize large amounts of data


9 outcomes of ecosystem health report cards Well received and influential Comprehensive package goes beyond simple grading Visually appealing Being local sense of ownership Educational

10 Report cards address many Top tier = Report card 2 nd Tier = Newsletter, website 3 rd Tier = Technical reports, scientific literature Base = Data audiences

11 We have developed report cards in iconic regions around the world
12 Report cards are a five step process

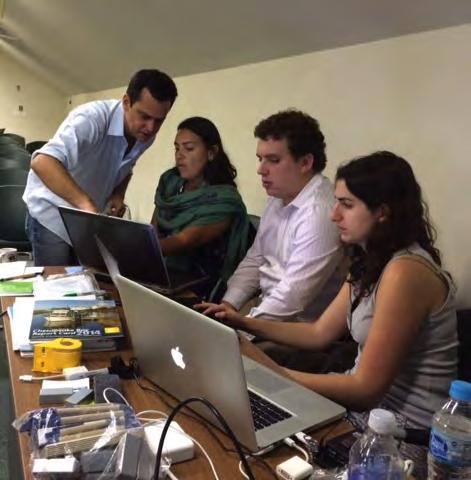
13 We use a partnership approach and want to engage you in this process

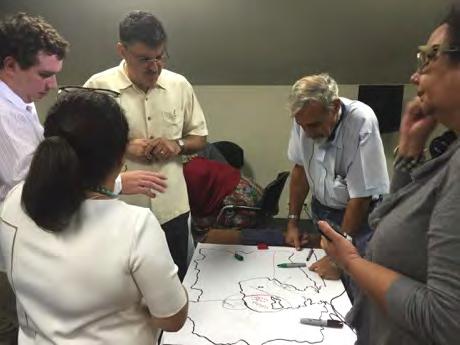
14 Conceptual mapping exercise
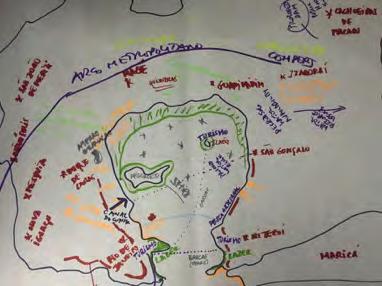
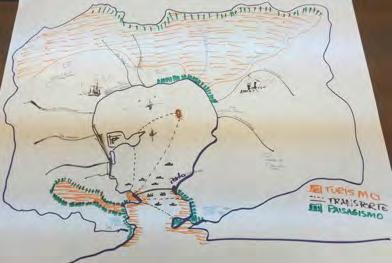
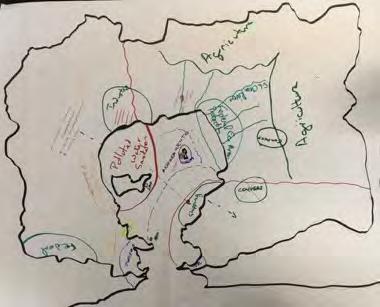
15 Initial Conceptual maps

16 Guanabara Bay key values & major threats


17 Reporting region discussion

18 Reporting regions: Guanabara Bay & river basin
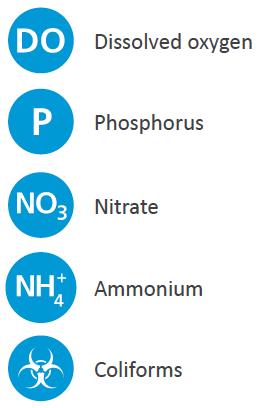
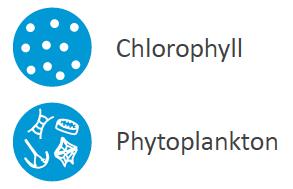
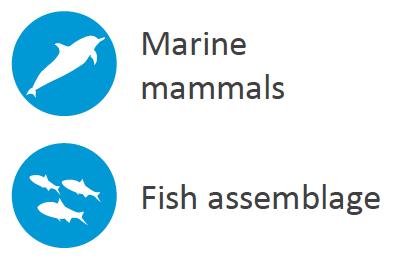
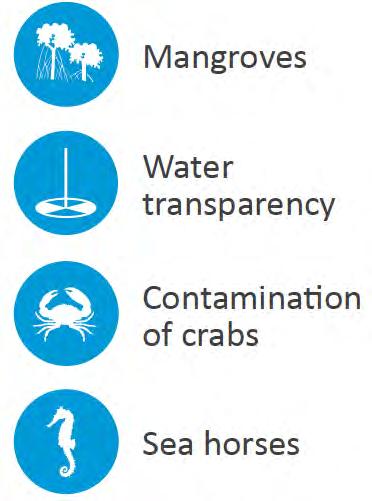
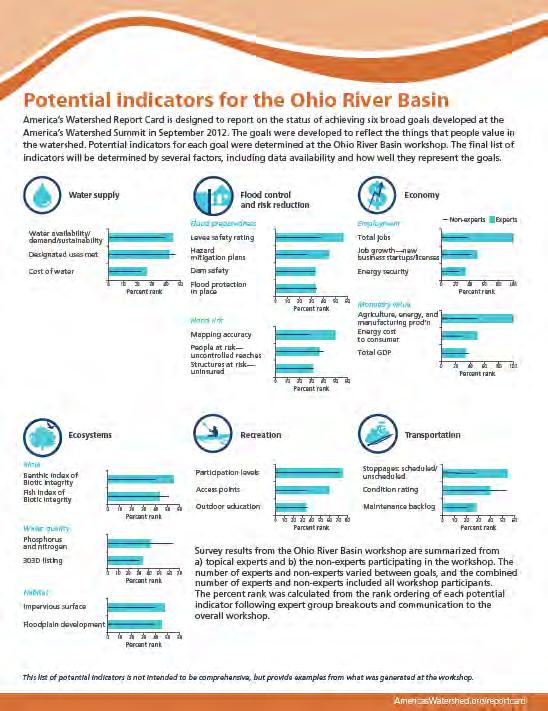
19 Potential indicators for guanabara bay


20 Potential indicators for the guanabara bay Basin Dissolved oxygen Biological oxygen demand Total phosphorus Turbidity Total dissolved solids Air/water temperature Nitrate Coliforms ph


21 Initial workshop newsletter will be discussed after lunch Globally iconic locaaon Pressing environmental problems Need for scienafically rigorous, transparent assessments to track restoraaon progress

22 We will produce a printed report card for guanabara bay (like chesapeake bay)
23 we also will add the guanabara bay report card to ecoreportcard.org
24 the website allows people to investigate the data
25 the website provides detailed explanations

26 the website provides the methodology
27 guanabara bay report card home page example guanabara- bay/ How healthy is your Guanabara Bay?
28 guanabara bay report card

29 Guanabara Bay basin report card


30 guanabara bay basin report card example Guapimirim- Macacu Basin Coliform: Dissolved oxygen: Nitrate: Overall Score:?


31 Guanabara Bay is an amazing place BeauAful natural harbor It alracts people to live, work, and play

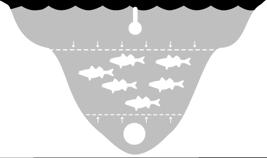
32 Guanabara Bay is vulnerable to human impact Restricted exchange with ocean Poor flushing where it is needed most

 Invisible (e.g.")
33 guanabara bay has some significant environmental impacts Visible (e.g. liler) Invisible (e.g. bacterial contaminaaon)


34 There is strong interest in improving Guanabara Bay (This is why we are all here today)

35 We have a unique opportunity to accelerate Guanabara Bay restoration


36 There is a strong scientific foundation for Guanabara Bay research and monitoring

37 We can build on this foundation to create a scientifically rigorous, transparent process for tracking restoration progress guanabara- bay/ How healthy is your Guanabara Bay?


38 We look forward to engaging with you in this process
39 Thank you

40 Developing a variety of science communication products Newsletters Science Journals Posters Reports Books

41 Report Card Examples

42 Report cards are a five step process


43 1. Conceptual framework 2. Indicators 3. Thresholds 4. Calculate scores 5. Communicate results Workshop to idenafy values and threats Brings together relevant experts and stakeholders in one place at one Ame Together develop content and structure of report card Builds consensus amongst different paraes IteraAve review and ediang during and aver workshop
44 1. Conceptual framework 2. Indicators 3. Thresholds 4. Calculate scores 5. Communicate results Chesapeake Bay Build conceptual diagrams

45 1. Conceptual framework 2. Indicators 3. Thresholds 4. Calculate scores 5. Communicate results Chesapeake Bay Indicators measure values and threats
46 1. Conceptual framework 2. Indicators 3. Thresholds 4. Calculate scores 5. Communicate results The method of assigning thresholds for each indicator can be based on either, or a combinaaon, of the following: Regulatory guidelines (e.g. local or regional water quality guidelines); Biological limits (e.g. dissolved oxygen requirements for protecaon of an important species); Socio/economic requirements (e.g. minimal fish stocks determined to be required for sustainable fishery); Reference condiaons (e.g. historical baseline or nearby system with condiaons that would like to be matched); Professional judgment
47 1. Conceptual framework 2. Indicators 3. Thresholds 4. Calculate scores 5. Communicate results Score CalculaAon Methods 1. Prepare Data : Calculate annual mean, median (or mula- year rolling mean or median) for each indicator 2. Assess data against thresholds % of measured or interpolated area that meets or does not meet threshold OR % of sites that meets or does not meet threshold


48 1. Conceptual framework 2. Indicators 3. Thresholds 4. Calculate scores 5. Communicate results Chesapeake Bay Methods Water quality BioAc Data integrated Compared to thresholds Combined into indices
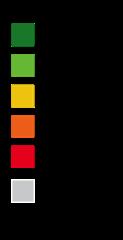
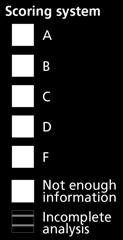
49 1. Conceptual framework 2. Indicators 3. Thresholds 4. Calculate scores 5. Communicate results Score % % Grade ExplanaAon A B All water quality and biological health indicators meet desired levels. Most water quality and biological health indicators meet desired levels % % 0-20 % C D F There is a mix of good and poor levels of water quality and biological health indicators. Some or few water quality and biological health indicators meet desired levels. Very few or no water quality and biological health indicators meet desired levels.


50 1. Conceptual framework 2. Indicators 3. Thresholds 4. Calculate scores 5. Communicate results Cover Values and threats Indicators and methods Scores/ Grades Trends Credits


51 1. Conceptual framework 2. Indicators 3. Thresholds 4. Calculate scores 5. Communicate results Keep evolving Chesapeake Bay: has new indicators is now reporang trends Includes flow weighted scores


52 RetrospecAve on A ecosystem report cards B C D F Chesapeake Bay, USA


53 Moreton Bay report A card B C D Gradual change ReAcence to change/sunset indicators Delay in reporang GraduaAon? F Moreton Bay, Australia


54 In summary: 1 IdenJfy values and threats 2 Choose indicators 3 IdenJfy thresholds 4 Calculate scores and grades 5 Communicate results

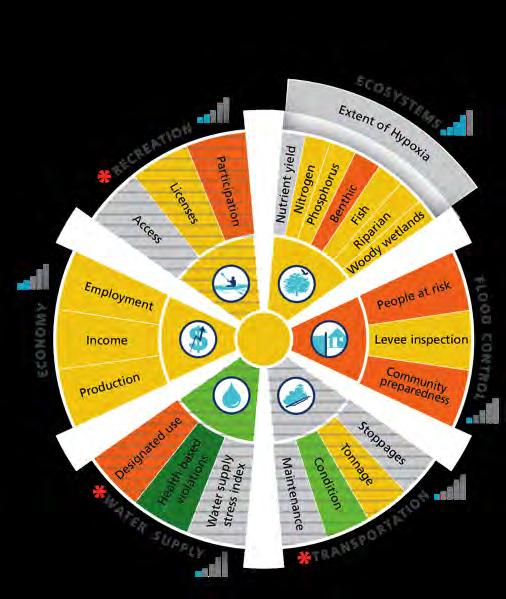
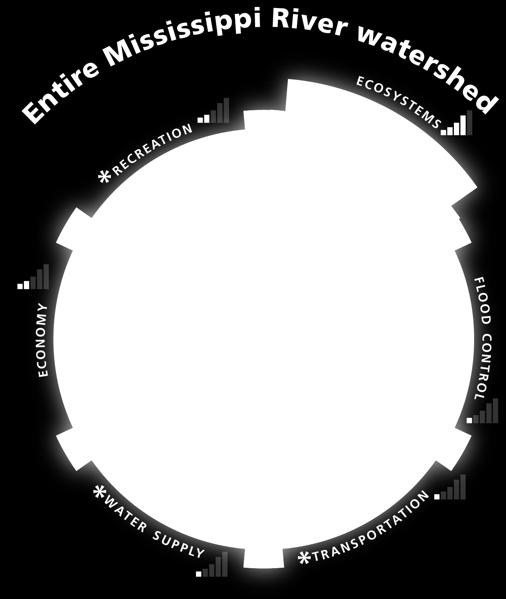
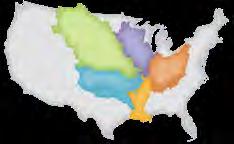
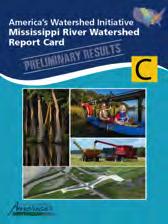
55 Mississippi River Watershed Report Card

56 Mississippi River Report Card


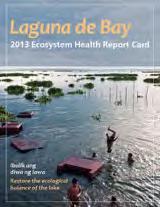
57 Laguna De Bay Report Card


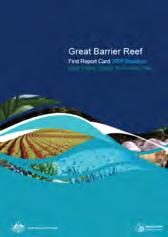
58 Great Barrier Reef Report Card EvoluAon of report cards to include pressure and response indicators


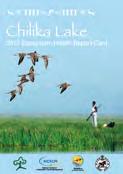
59 Chilika Lake Report Card


60 Gulf of Mexico Report Card DPSSIR framework MulAnaAonal effort
61 1. Conceptual framework 2. Indicators 3. Thresholds 4. Calculate scores 5. Communicate results Chesapeake Bay (Chesapeake 2000 Agreement) Values to protect Fisheries (fish, oysters and crabs) Recrea5on Tourism Threats Sewage Urban and agricultural runoff Overfishing Loss of habitat
62 1. Conceptual framework 2. Indicators 3. Thresholds 4. Calculate scores 5. Communicate results Report card indicators elsewhere Report Card Indicators Chesapeake Bay Pre 2012 = BIBI, PIBI, aquaac grasses, DO, Chlorophyll, water clarity, Chilika Lake Current = BIBI, aquaac grasses, DO, chlorophyll, water clarity, TN, TP, Blue Crabs, Bay Anchovy Water Quality = Chlorophyll, DO, water clarity, Biodiversity = Fisheries = Moreton Bay Bay = Rivers = Laguna de Bay???? Bird richness and abundance, dolphin abundance, benthic infauna diversity, total fish catch, fish diversity and fish size

63 1. Conceptual framework 2. Indicators 3. Thresholds 4. Calculate scores 5. Communicate results Chesapeake Bay Thresholds (can be seasonal and vary geographically)
2017 REPORT CARD. An annual reflection on social impacts, ecological outcomes, and partner engagement NETWORK INTEGRATION & APPLICATION
 INTEGRATION & APPLICATION NETWORK 2017 REPORT CARD An annual reflection on social impacts, ecological outcomes, and partner engagement IAN INDICATORS IN 2017 SOCIAL IMPACTS Total Reach is a measure of
Chesapeake Bay. report card
 Chesapeake Bay report card 2010 C- C Healthy water quality provides better habitat conditions for crabs, fish, and other aquatic species. issolved oxygen is essential to the survival of all these organisms;
2012 Chesapeake Bay Report Card
 212 hesapeake Bay Report ard New Fisheries Indicators Virginia Institute of Marine Science Blue rab A winter dredge survey is conducted throughout Maryland and Virginia to assess blue crab (allinectes
Building And Sustaining Integrated Networks: BASIN
 Building And Sustaining Integrated Networks: BASIN Bill Dennison 27 Feb 2014 BASIN webinar series Dec 2013; Case studies = Puget Sound & Great Lakes Jan 2014; Case studies = MARACOOS, Upper Mississippi,
Chesapeake Bay Report Card 2016
 hesapeake Bay Report ard 216 University of Maryland enter for Environmental Science Fun for you and your family Stewardship is defined as the responsible oversight and protection of something considered
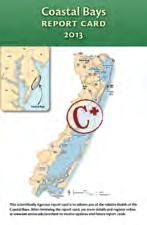
Coastal Bays. report card. Modeling nutrients, assessing climate vulnerabilities, and promoting environmental justice
 One of only 28 such programs nationwide, the goal of the Maryland Program is to protect and enhance the watershed, which includes, Pines and, and Assateague Island ational Seashore. The 175-square mile
Conservation Authority Watershed Report Cards and the Chesapeake Bay Experience. December 2, 2013 SOSMART
 Conservation Authority Watershed Report Cards and the Chesapeake Bay Experience December 2, 2013 SOSMART Overview of Conservation Authority Watershed Report Cards Series launched March 18, 2013 to celebrate
Redesign of Chesapeake Bay Program indicator structure and communication strategy: Goals, rationale and Products
 Redesign of Chesapeake Bay Program indicator structure and communication strategy: Goals, rationale and Products Indicator Redesign Taskforce draft briefing paper Ben Longstaff EcoCheck (NOAA-UMCES Partnership)
Guiding the Restoration of the Chesapeake Bay: The EPA Chesapeake Bay Program Partnership. Keely Clifford U.S. Embassy Paris
 Guiding the Restoration of the Chesapeake Bay: The EPA Chesapeake Bay Program Partnership Keely Clifford U.S. Embassy Paris PISCES Workshop June 14, 2011 1 Chesapeake Bay Watershed About 17 million people
the ability to manage for a stable and among the jurisdictions, and productive crab population and fishery by implement accountable monitoring
 Blue Crabs Add Bay-wide annual catch limits to Crab catch share included in Additional give predictability to fishermen, Issues for Consideration list. Blue Crab Management Outcome: Improve have an allocation
Protecting & Restoring Local Waters and the Chesapeake Bay
 Protecting & Restoring Local Waters and the Chesapeake Bay Restore America s Estuaries National Conference Gregory Barranco Chesapeake Bay Program Office November 2010 The Chesapeake Bay and Watershed
Fact Sheet. Chesapeake Bay Water Quality
 Fact Sheet Chesapeake Bay Water Quality Water quality is a critical measure of the Chesapeake Bay s health. For the Bay to be healthy and productive, the water must be safe for people and must support
Climate Change Impacts of Most Concern for CB Agreement Goal & Outcome Attainment
 Climate Change Impacts of Most Concern for CB Agreement Goal & Outcome Attainment Zoë P. Johnson, Climate Change Coordinator Chesapeake Bay Program STAC Workshop March 7-8, 2016 Climate Change: Real Consequences
Chesapeake Bay Report Card 2017
 University of Maryland enter for Environmental Science hesapeake Bay Report ard 217 Healthy fish populations in the Bay Health of Fisheries, 24 217 SORE (%) 1 9 8 7 6 5 4 3 2 1 ombined Fisheries Index
Assessing the ecological and human health status of Baltimore's Inner Harbor
 Assessing the ecological and human health status of Baltimore's Inner Harbor Caroline Wicks 1, Heath Kelsey 1, Laurie Schwartz 2, Bill Stack 3, Bill Dennison 4 1 EcoCheck (NOAA-UMCES Partnership), 2 Waterfront
Strategic Plan. artnership for the Delaware Estuary. Funding Support Provided by the William Penn Foundation
 Strategic Plan artnership for the Delaware Estuary 2007 2012 Funding Support Provided by the William Penn Foundation Partnership for the Delaware Estuary A National Estuary Program The Partnership is a
2008 at a glance. Indicators used in the report card. Total nitrogen. Coastal Bays health ranged from poor to good among reporting regions
 Plant a rain garden (www.co.worcester.md.us). Install a rain barrel (www.epa.gov). Use a programmable thermostat. Buy energy-efficient light bulbs. Plant a tree (www.trees.maryland.gov). Hold a neighborhood
Finalizing the Chesapeake Bay Health Index (BHI)
") Finalizing the Chesapeake Bay Health Index (BHI) Part 1: Water Quality Index Part 2: Biotic Index Bill Dennison Ben Longstaff, Michael Williams, Claire Buchanan, Roberto Llansó, and Peter Bergstrom On
Finalizing the Chesapeake Bay Health Index (BHI) Part 1: Water Quality Index Part 2: Biotic Index Bill Dennison Ben Longstaff, Michael Williams, Claire Buchanan, Roberto Llansó, and Peter Bergstrom On
Coastal Bays. report card. Gold stars for partnerships. Black skimmers are dependent on island habit in the Coastal Bays
 22 26 21 214 One of only 28 such programs nationwide, the goal of the Maryland Program is and Assateague Island ational Seashore. The 175-square mile watershed is home to the treasured resources of St.
Coastal Bays. report card. Gold stars for partnerships
 partners, and visitors, the Maryland between citizens, business, the Program, the Maryland Department of atural Resources, and the U.S. Fish & Wildlife Service has documented more than 113, spawning 212
Chesapeake Bay Restora/on Effort
 Chesapeake Bay Restora/on Effort Dave Nemazie Associate VP for External Affairs 15 April 2015 Leadership Maryland A Shallow Bay with a Large Watershed Watershed: 64,000 m 2 Ave Depth: 6 m Max Depth: 50
The Chesapeake Bay Blueprint:
 PHASE II The Chesapeake Bay Blueprint: THE BEST HOPE FOR RESTORING CLEAN WATER THIS NATION HAS EVER SEEN Peter McGowan/U.S. Fish and Wildlife Service Strategic Plan 2016-2020 The Chesapeake Bay Foundation
NATIONAL FISH AND WILDLIFE FOUNTDATION (NFWF) PHASE I
 PHASE I") ESCAMBIA COUNTY PROJECTS - DEEPWATER HORIZON OIL SPILL NATIONAL FISH AND WILDLIFE FOUNTDATION (NFWF) PHASE I PROJECT DESCRIPTION This project will construct the Government Street Regional Stormwater Pond
ESCAMBIA COUNTY PROJECTS - DEEPWATER HORIZON OIL SPILL NATIONAL FISH AND WILDLIFE FOUNTDATION (NFWF) PHASE I PROJECT DESCRIPTION This project will construct the Government Street Regional Stormwater Pond
Chesapeake Bay Watershed Agreement Final draft January 29, 2014
 Chesapeake Bay Watershed Agreement Final draft January 29, 2014 Public comment invited through March 17, 2014. Visit: www.chesapeakebay.net/watershedagreement 1 Preamble The Chesapeake Bay watershed is
Upper Mississippi River Conference 2016 Action Agenda: Raise the Grade
 Upper Mississippi River Conference 2016 Action Agenda: Raise the Grade December 16, 2016 On Oct. 13 14, 2016, a partnership of river stakeholders hosted the ninth annual Upper Mississippi River Conference,
Restoring the Chesapeake Bay Challenges & Opportunities
 Restoring the Chesapeake Bay Challenges & Opportunities Jeff Corbin Senior Advisor for Chesapeake Bay U.S. EPA May 29, 2014 A few things to talk about History of Bay Restoration How are we doing? What
Linking Ecosystem Indicators to Ecosystem Services
 Linking Ecosystem Indicators to Ecosystem Services Christine Davis* G. Van Houtven, C. Mansfield, M. Cutrofello, and M. O Neil *Health and Environmental Impacts Division, OAQPS U.S. Environmental Protection
Chapter 4.4. Development of a Water Quality Index for the Maryland Coastal Bays
 Chapter 4.4 Development of a Water Quality Index for the Maryland Coastal Bays Tim Carruthers 1 and Catherine Wazniak 2 1 Integration and Application Network, University of Maryland Center for Environmental
Planning Targets. For WQGIT Review Draft November 7, 2017
 Chesapeake Bay Program Partnership Development and Review of the Draft Phase III WIP Planning Targets On December 19-20, 2017, the Water Quality Goal Implementation Team (WQGIT) will be seeking the approval
Technical Cooperation Project: Overview of the Environmental State of Guanabara Bay Robert Summers April 29 th, 2016
 Technical Cooperation Project: Overview of the Environmental State of Guanabara Bay Robert Summers April 29 th, 2016 AGENDA Technical Cooperation Project Experience of Maryland with Chesapeake Bay Objectives
Slide 1: Welcome to today s The Nitrogen Cycle presentation, where we ll be talking to you about the importance of nitrogen in our environment.
 Slide 1: Welcome to today s The Nitrogen Cycle presentation, where we ll be talking to you about the importance of nitrogen in our environment. 1 Slide 2: Barnegat Bay, like many coastal areas in the country,
CHAPTER 15 WATER POLLUTION. INTO THE GULF Researchers try to pin down what s choking the Gulf of Mexico
 CHAPTER 15 WATER POLLUTION INTO THE GULF Researchers try to pin down what s choking the Gulf of Mexico SAVING THE BAY Teams of researchers try to pin down what s choking the Chesapeake Water pollution
Reducing Nitrogen, Phosphorus and Sediment Pollution Progress Update. Jeff Corbin, Senior Advisor to the EPA Administrator
 Reducing Nitrogen, Phosphorus and Sediment Pollution Progress Update Jeff Corbin, Senior Advisor to the EPA Administrator Reducing Pollution Briefing Package Overview 1. 29-11 Milestones 2. 211 Progress
Chesapeake Bay Updates. Agricultural Advisory Board June 18, 2014 Andy Zemba Interstate Waters Office
 Chesapeake Bay Updates Agricultural Advisory Board June 18, 2014 Andy Zemba Interstate Waters Office Updates Total Maximum Daily Load (TMDL) Chesapeake Bay Watershed Agreement Chesapeake Bay TMDL Progress
Dead-Zones and Coastal Eutrophication: Case- Study of Chesapeake Bay W. M. Kemp University of Maryland CES Horn Point Laboratory Cambridge, MD
 Dead-Zones and Coastal Eutrophication: Case- Study of Chesapeake Bay W. M. Kemp University of Maryland CES Horn Point Laboratory Cambridge, MD Presentation to COSEE Trends Orientation at UMCES HPL 4 August
Ecosystem Health Report Card a tool for monitoring nutrient and health of coastal ecosystem ; Chilika lake - a case study.
 Ecosystem Health Report Card a tool for monitoring nutrient and health of coastal ecosystem ; Chilika lake - a case study. A.K.PATTNAIK, Ph.D. Chief Executive, CDA Project Director ICZM Odisha Project
Phase III Watershed Implementation Plans
 Phase III Watershed Implementation Plans Including programmatic outcomes in your planning to provide co-benefits for your community and reduce pollution Rachel Felver Chesapeake Bay Program Director of
Chesapeake Bay Program Partnership s Scientific, Technical Assessment and Reporting (STAR) Team Briefing and Options Paper:
 Team Briefing and Options Paper:") Chesapeake Bay Program Partnership s Scientific, Technical Assessment and Reporting (STAR) Team Briefing and Options Paper: Addressing CBP Partnership s and Non-tidal Monitoring Network s 2013 Funding
Chesapeake Bay Program Partnership s Scientific, Technical Assessment and Reporting (STAR) Team Briefing and Options Paper: Addressing CBP Partnership s and Non-tidal Monitoring Network s 2013 Funding
Water Quality Monitoring:
 Water Quality Monitoring: Lesson Plan for Exploring Time Series Data Presenters: Janet Vail, Fallon Januska, Dirk Koopmans Lake Michigan Center in Muskegon, Michigan Home of Annis Water Resources Institute
Coastal Bays. report card. The Maryland Coastal Bays Program. Acknowledgements
 Dam project a success Without the assistance of our friends, students, partners, and visitors, the Maryland constructed Stream Restoration Project. It replaced the aged dam at yet maintained Maryland Department
Achieving Management and Conservation Goals through the Application of Ecosystem-based Management on the Central Coast of California
 Achieving Management and Conservation Goals through the Application of Ecosystem-based Management on the Central Coast of California WE CANNOT ADOPT THE WAY OF LIVING THAT WAS SATISFACTORY A HUNDRED YEARS
BACKGROUND. David Everett
 State of the James BACKGROUND Since the founding of the America on its banks 4 years ago, the James River has played a central and defining role in the development of Virginia. No other natural feature
Improved health of Chesapeake Bay in 2009
 hesapeake Bay report card 29 pennsylvania H Harrisburg 76 81 8 1 1 68 83 maryland 9 Baltimore Balt B a m al altim more 4 west virginia 7 11 Washington, Wash W ash hington, ng n,.... 2 2 97 66 delaware
TAMAR ESTUARY 2011 REPORT CARD ECOSYSTEM HEALTH ASSESSMENT PROGRAM. Working together for healthy waterways
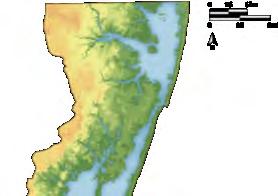
 TAMAR ESTUARY 2011 REPORT CARD ECOSYSTEM HEALTH ASSESSMENT PROGRAM Working together for healthy waterways TAMAR ESTUARY 2011 REPORT CARD RESULTS EHAP study area Tamar Estuary Tasmania This 2011 report
Lake Prespa Restoration Programme Challenges, Strategy and Achievements
 Lake Prespa Restoration Programme Challenges, Strategy and Achievements Source: SPP Prespa an ecosystem of global significance that has been facing with serious environmental challenges over the past decades
CHESAPEAKE BAY COMPREHENSIVE WATER RESOURCES AND RESTORATION PLAN. Habitat GIT Meeting 9 May 2017
 CHESAPEAKE BAY COMPREHENSIVE WATER RESOURCES AND 255 255 255 237 237 237 0 0 0 217 217 217 163 163 163 200 200 200 131 132 122 239 65 53 80 119 27 RESTORATION PLAN 110 135 120 252 174.59 112 92 56 62 102
Indicator Framework SUPPORTING THE CHESAPEAKE BAY PROGRAM INTO THE FUTURE. Management Board Meeting September 30, 2015
 Indicator Framework SUPPORTING THE CHESAPEAKE BAY PROGRAM INTO THE FUTURE Management Board Meeting September 30, 2015 Purpose of Today s Meeting RECOMMENDED DECISIONS Adopt recommended update of CBP Indicators
Sustainable Fisheries GIT: Fish Habitat
 Quarterly Progress Meeting - May 2017 Chesapeake Bay Program Science. Restoration Partnership. Sustainable Fisheries GIT: Fish Habitat Bruce Vogt, NOAA and Sustainable Fisheries GIT Coordinator Gina Hunt,
A Vision for a Healthy, Productive, and Sustainable Galveston Bay
 A Vision for a Healthy, Productive, and Sustainable Galveston Bay Bob Stokes, President Preserving, protecting, and enhancing Galveston Bay for 29 years A bit about our Bay Largest bay in Texas (660 square
Chesapeake Bay Water Quality Restoration:
 Chesapeake Bay Water Quality Restoration: The Transition to a Regulatory Approach Building on Decades of Cooperative Partnership Rich Batiuk Assoc. Director for Science Chesapeake Bay Program Office U.S.
Resource Significance CAMIE KNOLLENBERG 02 FEB 2017 PCOP WEBINAR
 Resource Significance CAMIE KNOLLENBERG 02 FEB 2017 PCOP WEBINAR Purpose & Objectives What Is It The Basics of Resource Significance Why It s Important How to Determine Significance What Is a Resource?
Dead Zones for Dinner
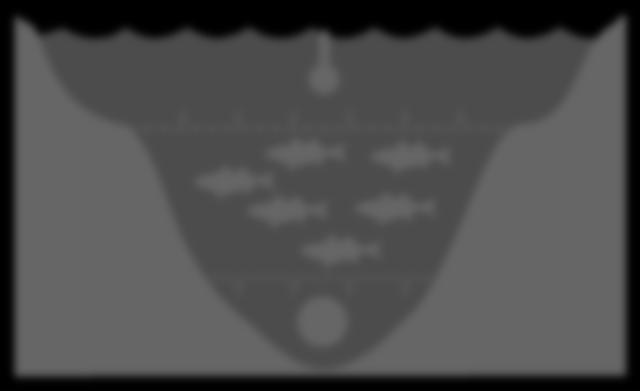
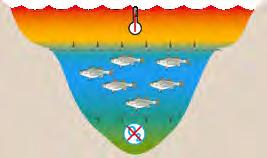
 STUDENT READING DEAD ZONES AND EUTROPHICATION: HOW FOOD WE EAT IS CONNECTED TO WATER POLLUTION Introduction Imagine scuba diving in an aquatic environment where life abounds--a place whose biological diversity
Healthy Waterways: Healthy Catchments. South East Queensland, Australia
 Healthy Waterways: Healthy Catchments Two decades of experience in South East Queensland, Australia Diane Tarte y November 2010 South East Queensland Catchments Moreton Bay Ramsar Site Population: 2.8
STATE OF THE BAY IN 2012
 9 10 11 STATE OF THE BAY IN 2012 Nitrogen &!Phosphorus Bay-wide nitrogen loads were similar to 2010, but phosphorus loads decreased. These loads are highly elated to river flows and stormwater runoff that
Gulf of Maine Council on the Marine Environment SWOT Analysis Summary from June 2014 Working Group Session v.2
 SWOT Analysis - Background At the June 2014 Council meeting, Council members took part in a strategic planning session and approved plans for an organizational assessment of Gulf of Maine Council to be
Norwalk Harbor Report Card
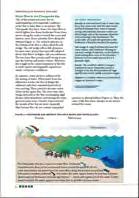
 Norwalk Harbor Report Card C+ Following the water s trail from your house, into the river, and to the Harbor The way land is used in a watershed has a significant effect on water quality. In areas where
Gulf of Mexico Program
 Gulf of Mexico Program Gulf of Mexico Program Mission Protect, restore, and maintain the Gulf of Mexico in ways consistent with the economic well-being of the region Committed to voluntary, non-regulatory
The Development Process and Methods for the Guanabara Bay Report Card
 The Development Process and Methods for the Guanabara Bay Report Card Prepared by: Integration and Application Network, University of Maryland Center for Environmental Science June 2017 The development
Findings of the IJC Nearshore Workshops
 Findings of the IJC Nearshore Workshops By John E. Gannon Great Lakes Regional Office International Joint Commission Windsor, Ontario For Loadings from Landscapes and Coastal Effects Workshop Toledo, OH
Quantifying Ecosystem Services of Restored Oyster Reefs
 Quantifying Ecosystem Services of Restored Oyster Reefs A Summary of Chesapeake Bay Research David Bruce NOAA Fisheries Office of Habitat Conservation Chesapeake Bay Office U.S. Department of Commerce
Nutrient Management Strategy for the International Red River Watershed. Collaborating Across Jurisdictions to Improve Water Quality
 Nutrient Management Strategy for the International Red River Watershed Collaborating Across Jurisdictions to Improve Water Quality Algal Blooms Across the international Red River watershed and in Lake
Setting the Context: Ecosystem Service Analysis
 Setting the Context: Ecosystem Service Analysis Lisa A. Wainger University of Maryland Center for Environmental Science STAC workshop on Ecosystem Goods and Services 3/28/17 Economic Value = Anything that
Is This a Healthy Body of Water?
 Overview This is a field based activity to collect data and samples from three different urban bodies of water. As students perform tests on the water samples in the field, they will make connections about
Chesapeake Bay Strategy Goals Framework
 Strategy For Protecting & Restoring the Chesapeake Bay DRAFT Chesapeake Bay Strategy Goals Framework March 19, 2010 1 Overview of Goals Framework Chesapeake Bay Executive On May 12, 2009, President Obama
Redwood Shores Lagoon November 2016 Monthly Water Quality Monitoring Report
 Redwood Shores Lagoon November 2016 Monthly Water Quality Monitoring Report Prepared for Redwood City Public Works Services Department 1400 Broadway Redwood City, CA 94063-2594 Prepared by Clean Lakes,
The Chesapeake Bay Program Biennial Strategy Review System: A Guide to Your Quarterly Progress Meeting
 The Chesapeake Bay Program Biennial Strategy Review System: A Guide to Your Quarterly Progress Meeting Table of Contents Executive Summary...2 Introduction...3 Quarterly Progress Meeting Template...4 Appendix
Redwood Shores Lagoon February 2019 Monthly Water Quality Monitoring Report
 Redwood Shores Lagoon February 2019 Monthly Water Quality Monitoring Report Prepared for Redwood City Public Works Services Department 1400 Broadway Redwood City, CA 94063-2594 Prepared by Clean Lakes,
Organizing Science in Large Scale River Restoration Programs
 Organizing Science in Large Scale River Restoration Programs Cliff Dahm Lead Scientist Delta Science Program Sacramento, California - USA (and) Professor University of New Mexico Albuquerque, New Mexico
LME 06 Southeast U.S. Continental Shelf
 LME 06 Southeast U.S. Continental Shelf Bordering countries: United States of America, Bahamas LME Total area: 303,029 km 2 List of indicators LME overall risk 2 Productivity Chlorophyll-A 2 2 Primary
Fishing and Boating: Past, Present, and Restoration Thoughts
 Fishing and Boating: Past, Present, and Restoration Thoughts West Branch Susquehanna River Douglas Austen Pennsylvania Fish and Boat Commission West Branch Basin Stream Resources Miles Category 1,249
6 TH. Most of the Earth Is Covered with Water (2) Most Aquatic Species Live in Top, Middle, or Bottom Layers of Water (1)
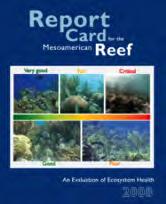
 Most Aquatic Species Live in Top, Middle, or Bottom Layers of Water (1)") A Healthy Coral Reef in the Red Sea MILLER/SPOOLMAN ESSENTIALS OF ECOLOGY 6 TH Chapter 8 Aquatic Biodiversity Fig. 8 1, p. 168 Most of the Earth Is Covered with Water (2) Aquatic life zones Saltwater life
A Healthy Coral Reef in the Red Sea MILLER/SPOOLMAN ESSENTIALS OF ECOLOGY 6 TH Chapter 8 Aquatic Biodiversity Fig. 8 1, p. 168 Most of the Earth Is Covered with Water (2) Aquatic life zones Saltwater life
Redwood Shores Lagoon May 2017 Monthly Water Quality Monitoring Report
 Redwood Shores Lagoon May 2017 Monthly Water Quality Monitoring Report Prepared for Redwood City Public Works Services Department 1400 Broadway Redwood City, CA 94063-2594 Prepared by Clean Lakes, Inc.
Lake & Watershed Resource Management Associates P O Box 65; Turner, ME
 Lake & Watershed Resource Management Associates P O Box 65; Turner, ME 207-336-2980 LWRMA@megalink.net 2008 Baseline Water Quality Monitoring and Assessment of Pemaquid and Biscay Ponds At the request
The Choice is Ours... Let s choose clean water
 The Choice is Ours... Let s choose clean water State of the James River 29 Background Since the founding of America on its banks 4 years ago, the James River has played a central and defining role in the
Coastal Ecosystems: Saving Chesapeake Bay. Note the highest pigment concentrations (red) in coastal regions, especially estuaries
 in coastal regions, especially estuaries") Coastal Ecosystems: Saving Chesapeake Bay Note the highest pigment concentrations (red) in coastal regions, especially estuaries Coastal Ecosystems: human impacts Humans severely impact the coastal zone
Coastal Ecosystems: Saving Chesapeake Bay Note the highest pigment concentrations (red) in coastal regions, especially estuaries Coastal Ecosystems: human impacts Humans severely impact the coastal zone
LEE COUNTY WATER QUALITY TOTAL MAXIMUM DAILY LOAD (TMDL) UPDATE
 UPDATE") LEE COUNTY WATER QUALITY TOTAL MAXIMUM DAILY LOAD (TMDL) UPDATE ROLAND OTTOLINI, PE, DIRECTOR, NATURAL RESOURCES DIVISION PRESENTED TO THE LEE COUNTY BOCC, WORKSHOP DECEMBER 5, 2017 TIMELINE MARCH 15,
LEE COUNTY WATER QUALITY TOTAL MAXIMUM DAILY LOAD (TMDL) UPDATE ROLAND OTTOLINI, PE, DIRECTOR, NATURAL RESOURCES DIVISION PRESENTED TO THE LEE COUNTY BOCC, WORKSHOP DECEMBER 5, 2017 TIMELINE MARCH 15,
2017 Midpoint Assessment: Year of Decision. October 19, 2017 PA Phase III WIP Steering Committee Meeting
 2017 Midpoint Assessment: Year of Decision October 19, 2017 PA Phase III WIP Steering Committee Meeting Today s Objectives Highlight of key midpoint assessment policy decisions to be considered by the
CHESAPEAKE BAY COMPREHENSIVE WATER RESOURCES AND RESTORATION PLAN
 CHESAPEAKE BAY COMPREHENSIVE WATER RESOURCES AND 255 255 255 237 237 237 0 0 0 217 217 217 163 163 163 200 200 200 131 132 122 239 65 53 80 119 27 RESTORATION PLAN 110 135 120 252 174.59 112 92 56 62 102
The Hypoxic Zone in the Gulf of Mexico
 The Hypoxic Zone in the Gulf of Mexico References Council Committee on Environmental and Natural Resources. 2003. An Assessment of Coastal Hypoxia and Eutrophication in U.S. Water. National Science and
Fish Habitat Outcome Management Strategy , v.1
 Management Strategy 2015 2025, v.1 I. Introduction Fish and shellfish in the Chesapeake Bay and its watershed rely on a variety of important habitats throughout the watershed. These habitats, which are
Marine Cumulative Effects
 Paul Nicklen/National Geographic Stock / WWF-Canada Marine Cumulative Effects Mike Ambach WWF-Canada: Prince Rupert Apr 17, 2014 Cathryn Clarke-Murray, PhD Marine Science Officer, WWF- Canada Adding On:
Little Bay Water Quality Report Card Spring 2014
 Little Bay Water Quality Report Card Spring 2014 Little Bay is a small, semi-enclosed estuary located in the heart of Rockport, Texas. Estuaries, where freshwater from rivers and streams mixes with salt
BAY BAROMETER. Health and Restoration. in the Chesapeake Watershed
 BAY BAROMETER 212-213 Health and Restoration in the Chesapeake Watershed AT A GLANCE 212-13 BAY HEALTH RESTORATION Water Quality Wetlands 29 percent of the Bay and its tidal rivers met overall conditions
Ocean Pollution. Ocean Pollution
 Ocean Pollution Ocean Pollution Some scientists believe that it is safer to dump sewage sludge into the deep ocean because it has the ability to dilute, disperse, and degrade large amounts of pollutants
Application of the Montreal Process Criteria & Indicators at National and Sub-national Scales
 Application of the Montreal Process Criteria & Indicators at National and Sub-national Scales International Seminar on Challenges of Sustainable Forest Management Tokyo, Japan, 08 March 2011 Peter Gaulke
Valuing nature s benefits for humans
 Valuing nature s benefits for humans Vision Nature s Value and Nature s Benefits receive the highest average scores. (Ranked by 7 very appealing; On a scale from 1-7 where 1 is not at all appealing and
Phosphorus Goal Setting Process Questions and Answers 2010
 Lake Winnipesaukee Watershed Management Plan Phase I: Meredith, Paugus, Saunders Bays 1. What is phosphorus? Phosphorus (P) is a naturally occurring element and a major nutrient required for biological
OCEAN POLLUTION. Pollution of coastal waters near heavily populated areas is a serious problem.
 Ocean Pollution Ocean Pollution Some scientists believe that it is safer to dump sewage sludge into the deep ocean because it has the ability to dilute, disperse, and degrade large amounts of pollutants
What s In Our Water Lesson Plan
 What s In Our Water Lesson Plan NGSS Standard: MS-LS2-4- Students can construct and argument supported by empirical evidence that changes to physical or biological components of an ecosystem affects populations.
APPENDIX A. Nutrient Trading Criteria Specific for the Chesapeake Bay Watershed
 Purpose: APPENDIX A Nutrient Trading Criteria Specific for the Chesapeake Bay Watershed The purpose of Appendix A is to provide additional program specific information regarding the use and incorporation
Quarterly Progress Meeting: Blue Crab
 8.08.17 Step 1: Summarize your outcome. Quarterly Progress Meeting: Blue Crab Outcome: Blue Crab Abundance: Maintain a sustainable blue crab population based on the current 2012 target of 215 million adult
STAC Workshop: Understanding and Explaining 30+ Years of Water Clarity Trends In the Bay s Tidal Waters. February 6-7 th, 2017
 Workshop goal/objective: STAC Workshop: Understanding and Explaining 30+ Years of Water Clarity Trends In the Bay s Tidal Waters February 6-7 th, 2017 University of Maryland Center for Environmental Science
Habitat Conservation and Fisheries
 Habitat Conservation and Fisheries Buck Sutter Director, Office of Habitat Conservation July 14, 2014 Habitat Mission Protect and restore coastal and marine habitat to support sustainable fisheries and
MARYLAND DEPARTMENT OF THE ENVIRONMENT 1800 Washington Boulevard Baltimore MD
 MARYLAND DEPARTMENT OF THE ENVIRONMENT 1800 Washington Boulevard Baltimore MD 21230 410-537-3000 1-800-633-6101 Martin O Malley Governor Anthony G. Brown Lieutenant Governor November 6, 2009 Shari T. Wilson
ITAT Workshop on Integrating Findings to Explain Water Quality Change
 ITAT Workshop on Integrating Findings to Explain Water Quality Change December 12-13, 2017 Annapolis, MD STAC publication 18-005 1 Workshop Purpose Interdisciplinary Dialogue To convene research synthesis
FY2016 GIT Funding Process. Chesapeake Bay Program Budget & Finance Workgroup Meeting February 28, 2017
 FY2016 GIT Funding Process Chesapeake Bay Program Budget & Finance Workgroup Meeting February 28, 2017 Overview 2016 EPA CBP funding available for key projects GITs and Workgroups are eligible Sub-awards
The Rouge River Fisheries Management Plan
 The Rouge River Fisheries Management Plan Draft 2010 Measuring Success Are We There Yet, Mom? Watershed Based FMP Development Partnership Toronto and Region Conservation (TRCA) and Ministry of Natural
Fisheries and Aquaculture in a Changing Climate
 Fisheries and Aquaculture in a Changing Climate Climate change impacts such as more frequent and severe floods and droughts will affect the food and water security of many people. The impact of climate
Full Title of Priority: Enhanced Analysis and Explanation of Water-Quality Data for the TMDL Mid-Point Assessment
 MIDPOINT ASSESSMENT PRIORITY WORK PLAN: ASSESS AND EXPLAIN WATER-QUALITY CHANGES LEAD: SCIENTIFIC, TECHNICAL ANALYSIS, AND REPORT (STAR) TEAM Full Title of Priority: Enhanced Analysis and Explanation of
EUTROPHICATION. Student Lab Workbook
 EUTROPHICATION Student Lab Workbook THE SCIENTIFIC METHOD 1. Research Background literature research about a topic of interest 2. Identification of a problem Determine a problem (with regards to the topic)