Boston Harbor Water Quality ( ) Massachusetts Water Resources Authority Environmental Quality Department Report
|
|
|
- Emily Hodge
- 6 years ago
- Views:
Transcription

1 Boston Harbor Water Quality ( ) Massachusetts Water Resources Authority Environmental Quality Department Report
2 Citation: Taylor, DI Boston Harbor Water Quality ( ). Boston: Massachusetts Water Resources Authority. Report p.
3 BOSTON HARBOR WATER QUALITY ( ) Prepared by David I. Taylor Environmental Quality Water and Wastewater Dept. Massachusetts Water Resources Authority 100 First Avenue, Charlestown Navy Yard, Boston MA August 2016 Technical Report No Acknowledgements: Kelly Coughlin, Laura Ducott, Eric Sanderson, Chris Goodwin, Caitlyn Chafee, Doug Hersh, Dillon Scott, Jianjung Wang
4 TABLE OF CONTENTS EXECUTIVE SUMMARY 1 1. INTRODUCTION NITROGEN AND PHOSPHORUS CONCENTRATIONS PHYTOPLANKTON BIOMASS 4 4. SUSPENDED SOLIDS, PARTICULATE ORGANIC MATTER TRANSPARENCY BOTTOM-WATER DISSOLVED OXYGEN PATHOGEN INDICATOR COUNTS RIVER DISCHARGES, AND HARBOR PHYSICAL CONDITIONS CONCLUSIONS REFERENCES. 8 APPENDIX.. 9 ii
5 EXECUTIVE SUMMARY The Massachusetts Water Resources Authority has monitored water quality in Boston Harbor since the early to mid-1990 s in support of the Authority s wastewater engineering projects, that have included among others, the Boston Harbor Project, the CSO Control Plan, TRAC pretreatment program, and programs to decrease infiltration into the sewer system. This report documents water quality in Boston Harbor during 2015, and compares it with water quality during the preceding 20 years (1994-). The aspects of water quality that were selected for examination are relevant to public use of the harbor (microbial pathogen counts, water column transparency) and to the health of the harbor ecosystem (nutrients concentrations, amounts of algae, particulate organic matter in the water, transparency dissolved oxygen concentrations). In the late 1980 s, the harbor ecosystem was severely degraded, and in many regions unsafe for human recreation use. Water quality in the harbor during the past 20 years has undergone significant changes (many of them improvements), that have been the net result of the engineering projects plus background changes in meteorology and river discharges to the harbor. Changes have included declines in water column nutrient (nitrogen and phosphorus) concentrations, declines in pathogen indicator (Enterococcus) counts and the amounts of microalgae in the water, and increases in bottom-water dissolved oxygen (DO) concentrations. For certain aspects of water quality, specifically concentrations of nitrogen, improvements coincided with the final Deer Island wastewater discharge diversion offshore, and values since then have remained relatively constant. For other variables, including concentrations of phosphorus, bottom-water DO concentrations, and Enterococcus counts, conditions have progressively improved since the early 1990 s, with the improvements continuing well after the Deer Island and Nut Island discharges to harbor were discontinued. Annual average harbor salinity has shown a gradual increase, suggesting the marine influence on the harbor has increased slightly during the past 20 years. This increased marine influence may have contributed to the continued phosphorus, Enterococcus and DO improvements seen since the discharges to the harbor were discontinued. Since 2011 the harbor has shown increases in phytoplankton biomass, total suspended solids and particulate organic carbon concentrations, and s a light decrease in transparency. River discharges to the harbor during three of the past four years during this period have been lower than average. The increased hydraulic residence time caused by the lowered river inflows may have contributed to these recent natural short-term changes. 1
, the combined sewer overflow (CSO) Control Plan (MWRA 2015), the TRAC pretreatment program, and programs to decrease")

6 INTRODUCTION MWRA has monitored water quality in Boston Harbor during the past 20 years in support of the Authority s wastewater engineering projects. The projects have included, among others, the Boston Harbor Project (BHP), the combined sewer overflow (CSO) Control Plan (MWRA 2015), the TRAC pretreatment program, and programs to decrease infiltration into the sewer system. The BHP was implemented from 1991 through, and the CSO Control Plan from to The Deer Island treatment facility, the cornerstone of the BHP is shown in Figure 1. indicator counts have declined. The harbor s soft-sediments (and associated invertebrate communities) have improved (Pembroke et al. 2015), and north harbor seagrass beds have expanded (Costello and Kenworthy 2011). Fig. 1. Deer Island wastewater treatment facility at the mouth of Boston Harbor In the late 1980 s Boston Harbor was viewed as one of the most degraded coastal bays in the USA. Figure 2 shows a conceptual model of the changes that occur to coastal aquatic ecosystems during degradation. Following the large decreases in wastewater nutrient, organic matter and microbial inputs brought about by the BHP and CSO Control Plan, this historic degradation of the harbor has been reversed. Nutrient (nitrogen and phosphorus) concentrations and the amounts of algae (and organic matter) in the water have decreased. Bottom-water dissolved oxygen concentrations have increased, and microbial pathogen Fig. 2. Conceptual model of the changes that occur to coastal aquatic ecosystems during their degradation and specifically overenrichment. This report documents harbor water quality in 2015, and compares it with water quality trends during prior years. It addresses three water quality aspects pertinent to harbor ecosystem health and to the health of the public using the harbor, specifically: system over-enrichment or eutrophication (measured as amounts of algae, nutrient concentrations and bottom-water dissolved oxygen), 2
. mouth and then offshore. Nitrogen concentrations since then have ranged between 18 and 22 µmol l -1, about two thirds of what they were during the discharges.")

7 water transparency (measured as total suspended solids and irradiance or light attenuation coefficients), and microbial pathogen indicator counts (measured as counts of the enteric bacterium, Enterococcus). mouth and then offshore. Nitrogen concentrations since then have ranged between 18 and 22 µmol l -1, about two thirds of what they were during the discharges. Total nitrogen (N) concentrations in 2015 averaged 20 µmol l -1. This report focuses on the main body of the harbor, where the effects of the input changes from multiple upstream sources are integrated. Changes to specific locations along the periphery of the harbor have been documented elsewhere (MWRA 2015). The data we present here were collected at 9 locations as part of MWRA s Boston Harbor Water Quality Monitoring (BHWQM) project (Fig. 3). Three locations were sampled in the Inner Harbor (137, 138 and 24), the other six locations were located in or at the mouth of the Outer Harbor (106, 124, 139, 1409, 141 and 142). Station coordinates are shown in Table A- 1. Most locations were sampled weekly or every two weeks. Sampling and analytical procedures have been described in Rex and Taylor (). All water samples collected from MWRA s sampling vessel, the Merganser (Fig. 4). All harbor-wide averages reported here are volumeweighted by region, as described in Taylor et al. (2011). Horizontal bars at the top of each graph show the 15 years since the discharges to the harbor were diverted offshore. Fig. 3. Boston Harbor showing the 9 sampling locations, and the Inner and Outer Harbor regions of the harbor. 2. NITROGEN (N) AND PHOSPHORUS (P) CONCENTRATIONS The BHP completed in 2001 caused harbor total nitrogen (N) and total phosphorus (P) concentrations to decrease (Fig. 5). The bulk of the N declines occurred between 1997/ and 2001, the three to four years that spanned the two wastewater diversions, first to the harbor Fig. 4. MWRA s sampling vessel, the Merganser. 3
8 Total phosphorus concentrations have shown a progressive decline since 1995, continuing to decline after the wastewater discharges to the harbor were diverted offshore. Total P concentrations in 2015 (1.2 µmol l -1 ) were the third lowest since monitoring started. N:P ANNUAL AVERAGE CONC. ( µmol L -1 ) AVERAGE TP CONC. ( µmol L -1 ) ANNUAL AVERAGE MOLAR TN:TP RATIO Total N Fig. 5. Annual average total N and total P concentrations and total N:total P concentration ratios, concentration ratios declined when the discharges were diverted offshore, but have progressively increased since then. The 2015 N:P Total P NON-NH 4 NH 4 N:P ratios averaged 16.5:1, similar to the Redfield Ratio (16:1), and only slightly greater than the average for the 15 post-diversion years. Approximately 90% of the total N concentration decline brought about by the BHP was contributed by an ammonium (NH 4 ) concentration decline. Ammonium was the N fraction that made up most of the wastewater total nitrogen discharged to the harbor pre After the final wastewater diversion accounted for 6% of the lowered total N. During the discharges, ammonium contributed 21% of water column total N. Declines in total N concentrations at all nine locations in Figure A-1 (Appendix A) were responsible for the overall harbor-wide average N concentration decline. Ammonium concentrations were also decreased at all nine locations. At the three Inner Harbor locations (137, 138 and 024), N concentrations have continued to decline post-diversion; the lowered concentrations at the Outer Harbor locations during the same period have shown no trend. 3. PHYTOPLANKTON BIOMASS Phytoplankton biomass in the harbor (measured here as concentrations of chl-a) has decreased during the past 20 years (Fig. 6). Biomass declined sharply when the wastewater discharges were diverted offshore in. Biomass has shown a series of fluctuations since then, when concentrations have exceeded or fell within the biomass range during discharge years. The first of the increases occurred two to three years post-diversion, and the other, seven to eight years later. The 2015 biomass values fell on the ebb side of the latter increase. The N input declines brought about by the BHP (Taylor ) were a major contributor to the biomass declines that followed the discharge diversion offshore. During neither of the post- 4
9 diversion increases were harbor nitrogen or phosphorus concentrations greater than during discharge years, suggesting processes other than increased nutrient inputs were responsible for the background biomass increases observed post-diversion. ANNUAL AVERAGE CHL-A CONC. ( µg L -1 ) Summer average chl-a conc. ( µg l -1 ) PHYTOPLANKTON BIOMASS (annual) Fig. 6. Annual (top) and summer (bottom) average phytoplankton biomass measured as chl-a, Summer = J,J,A and S. The phytoplankton declines in the harbor were evident at all except one of the nine sampling locations (Fig. A-2). Station 137 in the uppermost Inner Harbor was the exception. The phytoplankton increase was not consistent among stations, but the biomass increase later in the study was evident at all locations, including 137, in fact, it was the stations in the Inner Harbor (137, 138 and 24) and western harbor (140) where the more recent increases were observed. (summer) 4. SUSPENDED SOLIDS, PARTICULATE ORGANIC MATTER Harbor total suspended solids (TSS) concentrations increased during the period spanned by this study (Fig. 7). TSS concentrations, which averaged 6.9 mg l -1, were the second highest since monitoring started. The bulk of the increase started in 2007/, reaching a maximum in. All nine locations showed the TSS concentration increases (Fig. A- 3). Particulate organic C (POC) concentrations, like the TSS concentrations, increased during the second half of the study, but unlike for TSS, POC concentrations at the end of the study were lower than at the start. POC accounted for only a small fraction of harbor TSS. The percent POC content of TSS declined during the study, indicating the bulk of the TSS increase was caused by increased concentrations of suspended inorganic rather than organic material. 5. TRANSPARENCY Transparency, which in the harbor is high compared to many other coastal systems, has shown no trend during the past 20 years (Fig. 8). Transparency is reported here as attenuation coefficients (k). These measure the rates at which light attenuates as it passes through the water column. The k values are presented as reciprocal values, meaning the greater the value, the greater the transparency. background elevated TSS, POC and chl-a values observed during these years (and shown earlier) may have been contributing factors. 5
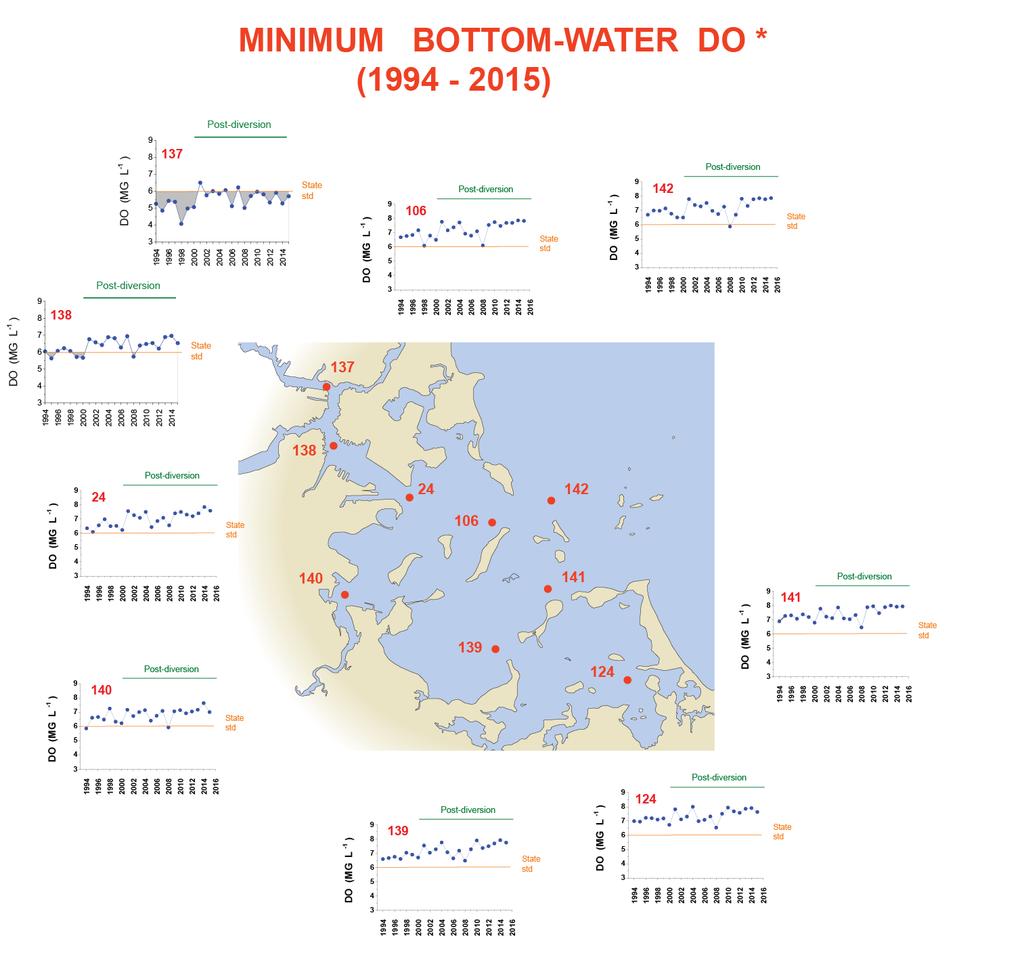
10 ANNUAL AVERAGE CONC. ( MG L -1 ) NON-POC POC TSS ANNUAL AVERAGE PAR ATTENUATION COEFFICIENTS ( M ) WATER CLARITY ANNUAL POC CONC. ( µmol L -1 ) ANNUAL POC as % TSS Fig. 7. POC, TSS and POC as % TSS (by weight), POC Transparency during the past three years (and especially during 2013 and ) has been slightly poorer than during many of the other years since the discharges to the harbor were discontinued. The POC as % TSS Fig. 8. Vertical light attenuation coefficients, a measure of transparency, BOTTOM-WATER DISSOLVED OXYGEN Summer bottom-water dissolved oxygen (DO) concentrations in the harbor have increased since the early 1990 s, and during 2015 the minimum monthly-average concentrations (7.6 mg l -1 ) were the highest since monitoring started (Fig. 9). During the final six years the harbor received the discharges the minimum monthly average DO concentrations fell below or approached the State Standard of 6 mg l -1. Since then, the values averaged harbor-wide have consistently met the standard. Minimum monthly bottom-water DO conc. ( MG L -1 ) Bottom-water DO Fig. 9. Lowest monthly average bottomwater DO concentrations observed each year, State std. 6
11 The DO increase during the period spanned by the report was evident at all nine locations (Fig. A-4). The baseline concentrations from which the increases occurred differed among locations. At station 137, bottom-water DO concentrations failed to meet the Standard during all of the final six years the harbor received the discharges. Since then, the standard has been met at this location five of the 15 years. At four of the locations, the standard was not met during only one of the 15 years; at the remaining four locations (three of them in the south harbor), the standard was met during all fifteen postdiversion years. 7. PATHOGEN INDICATOR COUNTS Harbor recreational use requires pathogen indicator bacteria be monitored (Fig. 10). Enterococcus counts in 2015 were the second lowest since 1994, and averaged 3 colony forming units 100 ml -1. Counts <35 colony forming units 100 ml -1 meet the State Standard for recreational marine waters counts at all nine locations were well below levels seen during the period the harbor received the wastewater discharges (Fig. A-5). GEOMETRIC MEAN COUNTS ( CFU 100 ML -1 ) Enterococcus Fig. 10. Annual average Enterococcus counts by year, RIVER DISCHARGES AND HARBOR PHYSICAL CONDITIONS Annual average river flows into the harbor during 2015 (1.5 x10 6 m 3 d -1 ) were the third lowest since 1990 (Fig. 11). Flows during three of the past four years (2015 included), have been the lowest since Salinities during 2015 were the highest since 1990 (Fig. 12) Fig. 11. Average river discharges, (data from USGS). SALINITY (PPT) ANNUAL AVERAGE RIVER FLOWS (x10 6 M 3 D -1 ) RIVER DISCHARGE Fig. 12. Average harbor salinities, From February through June water temperatures during 2015 were 2 o C to 5 o C lower than during the same months during all years since the discharges were discontinued (Fig. 13), though October temperatures were the warmest ever observed. SALINITY Long-term average including
12 MONTHLY AVERAGE TEMP. ( o C ) J WATER TEMPERATURE F M A M J J A S O Fig. 13. Average water temperatures by month. Red line shows 2015 data; blue lines shown 2001 to. 9. CONCLUSIONS Many of the harbor water quality improvements observed during the implementation of the BHP and the CSO Control Plan have been sustained into The ending of the wastewater discharges in caused harbor total nitrogen, total phosphorus, and particulate organic C concentrations, and phytoplankton biomass and Enterococcus counts to decline. During the 16 years since the discharges were discontinued, total P concentrations and Enterococcus counts have continued to decline. DO concentrations too have continued to increase post-discharge total P concentrations and Enterococcus counts were the lowest seen since 1994, and DO concentrations the highest. Certain variables have shown fluctuations during the years since the discharges were discontinued. Phytoplankton biomass, POC and TSS concentrations have all increase between about 1995/ (five to six years after the discharges to the harbor were discontinued) to 2013 or. N 2015 D discontinued TSS concentrations were the second highest since monitoring started chl-a and POC concentrations were elevated, but lower than during most post-diversion years. 10. REFERENCES Costello, CT, Kenworthy, WJ Twelveyear mapping and change analysis of eelgrass (Zostera marina) areal abundance in Massachusetts Bay (USA) identifies statewide declines. Estuaries and Coasts 34: MWRA Combined Sewer Overflow Control Plan: Annual Progress Report. Massachusetts Water Resources Authority, Boston. Pembroke A, Diaz R, Nestler EC Boston Harbor benthic monitoring report: results. Boston: Massachusetts Water Resources Authority. Report p. Rex A., Taylor D.I.,. Combined Work/Quality Assurance Project Plan (CW/QAPP) for Water Quality Monitoring and Combined Sewer Overflow Receiving Water Monitoring in Boston Harbor and Its Tributary Rivers. Boston: Massachusetts Water Resources Authority. Report -ms p. Taylor D.I.,. The Boston Harbor Project and large decreases in loadings of eutrophication-related materials to Boston Harbor. Marine Pollution Bulletin 60: Taylor et al Werme C, Keay KE, Libby PS, Wu D, Taylor DI, Codiga DL, Coughlin K Outfall monitoring overview. Boston: Massachusetts Water Resources Authority. Report p. Biomass, POC and TSS concentrations during 2015 were all higher than during most years since the discharges to the harbor were 8
13 APPENDIX Table A-1. Boston Harbor sampling locations Station Id Marine or freshwater 3 Description Coordinates Monitoring years Marine; Inner harbor mouth , Marine; Outer harbor, NE of Long Island , Marine; Hingham Bay, Crow Point flats , Marine; Mystic River mouth , Marine; Central inner harbor , Marine; l d b b Quincy Bay, SW of Hangman Island , Marine; Neponset River mouth/s. Dorchester Bay Marine; l d b b Outer harbor, NE of Peddocks Island , Marine; l d b b Outer harbor, President Roads, south channel ,

14 Fig. A-1. Annual total N concentrations partitioned into the non-ammonium and ammonium fractions at the nine sampling locations,
 at nine")
15 Fig. A-2. Summer average phytoplankton biomass (measured as chlorophyll-a) at nine harbor sampling locations, , Summer = J, J, A and S. 11
")
16 Fig. A-3. Annual total suspended solids (TSS) concentrations,
17 13

18 Fig. A-4. Lowest monthly average bottom-water DO concentrations, Shaded areas show years values failed to meet state Standard. Fig. A-5. Annual mean Enterococcus counts,

 242-6000 www.")
19 Massachusetts Water Resources Authority Charlestown Navy Yard 100 First Avenue Boston, MA (617)
Boston Harbor Water Quality Update Massachusetts Water Resources Authority Environmental Quality Department Report
 Boston Harbor Water Quality Update 1995-217 Massachusetts Water Resources Authority Environmental Quality Department Report 218-6 Citation: Taylor, DI. 218. Boston Harbor Water Quality Update, 1995-217.
Boston Harbor: a comparison of eutrophication-related waterquality before, and 36-months after offshore transfer
 Boston Harbor: a comparison of eutrophication-related waterquality before, and 36-months after offshore transfer Massachusetts Water Resources Authority Environmental Quality Department Report ENQUAD 2004-04
24 months after offshore transfer : an update of water quality improvements in Boston Harbor
 24 months after offshore transfer : an update of water quality improvements in Boston Harbor Massachusetts Water Resources Authority Environmental Quality Department Report ENQUAD 2003-04 24 months after
5 years after transfer of Deer Island flows offshore: an update of water-quality improvements in Boston Harbor
 5 years after transfer of Deer Island flows offshore: an update of water-quality improvements in Boston Harbor Massachusetts Water Resources Authority Environmental Quality Department Report ENQUAD 2006-16
List of proposed interim changes to MWRA s Effluent Outfall Ambient Monitoring Plan April 15, 2009
 LIST OF PROPOSED INTERIM CHANGES TO MWRA S EFFLUENT OUTFALL AMBIENT MONITORING PLAN APRIL 2009 Changes to the plan are based on data collected and technical reports written since the monitoring began,
2009 ANNUAL LIST OF PROPOSED CHANGES TO MWRA S EFFLUENT OUTFALL AMBIENT MONITORING PLAN OCTOBER 23, 2009
 2009 ANNUAL LIST OF PROPOSED CHANGES TO MWRA S EFFLUENT OUTFALL AMBIENT MONITORING PLAN OCTOBER 23, 2009 Proposed changes to the plan are based on data collected and technical reports written since the
CSO Annual Report for 2015
 CSO Annual Report for 2015 1 Last CSO Construction Milestones are Achieved On January 1, 2015: 32 of the 35 Projects in MWRA s Long Term CSO Control and Schedule Seven were complete. The last 3 CSO projects
Factsheet: Town of Deep River Water Quality and Stormwater Summary
 79 Elm Street Hartford, CT 06106-5127 www.ct.gov/deep Affirmative Action/Equal Opportunity Employer Factsheet: Town of Deep River Water Quality and Stormwater Summary This document was created for each
Factsheet: City of West Haven Water Quality and Stormwater Summary
 79 Elm Street Hartford, CT 06106-5127 www.ct.gov/deep Affirmative Action/Equal Opportunity Employer Factsheet: City of West Haven Water Quality and Stormwater Summary This document was created for each
Factsheet: Town of Trumbull Water Quality and Stormwater Summary
 79 Elm Street Hartford, CT 06106-5127 www.ct.gov/deep Affirmative Action/Equal Opportunity Employer Factsheet: Town of Trumbull Water Quality and Stormwater Summary This document was created for each town
Factsheet: Town of East Lyme Water Quality and Stormwater Summary
 79 Elm Street Hartford, CT 06106-5127 www.ct.gov/deep Affirmative Action/Equal Opportunity Employer Factsheet: Town of East Lyme Water Quality and Stormwater Summary This document was created for each
Factsheet: Town of Hamden Water Quality and Stormwater Summary
 79 Elm Street Hartford, CT 06106-5127 www.ct.gov/deep Affirmative Action/Equal Opportunity Employer Factsheet: Town of Hamden Water Quality and Stormwater Summary This document was created for each town
Update on MWRA s Fort Point Channel CSO Project
 Massachusetts Water Resources Authority Update on MWRA s Fort Point Channel CSO Project Frederick A. Laskey Executive Director August 6, 2003 The Boston Harbor Project: An Environmental Success Story In
Water Quality Monitoring Stations
 Water Quality Monitoring Stations Eastern Basin Race Narrows Western Basin Central Basin The CT Department of Environmental Protection (CT DEP) conducts a water quality CT DEP monitoring program for the
Little Bay Water Quality Report Card Spring 2014
 Little Bay Water Quality Report Card Spring 2014 Little Bay is a small, semi-enclosed estuary located in the heart of Rockport, Texas. Estuaries, where freshwater from rivers and streams mixes with salt
Lower Cape Fear River Basin Cape Fear DO Issues
 Lower Cape Fear River Basin Cape Fear DO Issues by Jim Bowen, Assoc. Professor Civil Engr. Dept., UNC Charlotte Cape Fear Basin TMDL Conference Raleigh, NC September 9, 2003 Outline of Talk 1. Water Quality
Overview of Beach Water Quality
 Overview of Beach Water Quality MDC Beach Monitoring Program MDC monitored Harbor beaches weekly during summer months since 1973; daily beginning in 1996 Samples analyzed for two indicator bacteria: fecal
Nutrients, Algal Blooms and Red Tides in Hong Kong Waters. Paul J. Harrison and Jie XU
 Nutrients, Algal Blooms and Red Tides in Hong Kong Waters Paul J. Harrison and Jie XU Division of Environment, Hong Kong University of Science & Technology 1. Introduction The Pearl River is China's second
Recovery of marine ecosystems: Regime shifts, resilience and shifting baselines
 Recovery of marine ecosystems: Regime shifts, resilience and shifting baselines Jacob Carstensen Dept. of Bioscience, Aarhus University Phase I eutrophicatio n model Source: Cloern (001) Mar.Ecol.Prog.Ser.
Water Quality Indicators
 Water Quality Indicators Ashley T. Slagle PVSC NJ Water Monitoring Council Meeting NJDEP Headquarters Trenton, NJ Wednesday, January 25, 2012 Who is the New Jersey Harbor Dischargers Group? 9 Sewerage
2016 Beach Water Quality Report Card for the 2015 Swimming Season
 2016 Water Quality Report Card for the 2015 Swimming Season Each year on Memorial Day Weekend Save the Harbor/ Save the Bay s releases an annual Boston Harbor Region Water Quality Report Card to help the
REPORT. Report No: 2013/0958 Prepared For: Natural Resources Committee Prepared By: Dean Olsen, Environmental Resource Scientist Date: 11 July 2013
 REPORT Document Id: A544088 Report No: 2013/0958 Prepared For: Natural Resources Committee Prepared By: Dean Olsen, Environmental Resource Scientist Date: 11 July 2013 Subject: Waianakarua River Water
Barnegat Bay-Little Egg Harbor: Ecosystem Condition. Michael J. Kennish Institute of Marine and Coastal Sciences Rutgers University
 Barnegat Bay-Little Egg Harbor: Ecosystem Condition Michael J. Kennish Institute of Marine and Coastal Sciences Rutgers University Coastal Lagoons Barnegat Bay- Little Egg Harbor ANTHROPOGENIC EFFECTS*
Receiver operating characteristic (ROC) curve analysis of antecedent rainfall and the Alewife/Mystic River receiving waters
 curve analysis of antecedent rainfall and the Alewife/Mystic River receiving waters") Receiver operating characteristic (ROC) curve analysis of antecedent rainfall and the Alewife/Mystic River receiving waters Massachusetts Water Resources Authority Environmental Quality Department Report
Receiver operating characteristic (ROC) curve analysis of antecedent rainfall and the Alewife/Mystic River receiving waters Massachusetts Water Resources Authority Environmental Quality Department Report
Water Quality. Report for State of the Bay Casco Bay Water Quality Report for State of the Bay 2010 Friends of Casco Bay, 2009
 Water Quality Report for State of the Bay 2010 Casco Bay Water Quality Report for State of the Bay 2010 Friends of Casco Bay, 2009 Muskie School of Public Service University of Southern Maine www.cascobayestuary.org
Pleasant Bay Alliance Water Quality Monitoring Program: Statistical Analysis of Water Quality Monitoring Data
 Pleasant Bay Alliance Water Quality Monitoring Program: Statistical Analysis of 2000-2014 Water Quality Monitoring Data July 2015 Prepared by: The Cadmus Group, Inc. Prepared for: Pleasant Bay Alliance
Shen Zhen. New Territories. Stonecutters Island Kowloon. Victoria Harbor WM4 VM2 VM5 SM10. Hong Kong SM6. South China Sea.
 Shen Zhen Pearl River Estuary Latitude ( o N) New Territories Stonecutters Island Kowloon Victoria Harbor WM4 VM7 SM VM VM Hong Kong Lantau Islannd SM9 WM Island EM3 South China Sea Longitude ( o E) Fig..
Combined Work/Quality Assurance Project Plan (CW/QAPP) for Nitrogen Monitoring in Deer Island Treatment Plant Waste Streams
 for Nitrogen Monitoring in Deer Island Treatment Plant Waste Streams") Combined Work/Quality Assurance Project Plan (CW/QAPP) for Nitrogen Monitoring in Deer Island Treatment Plant Waste Streams Massachusetts Water Resources Authority Environmental Quality Department Report
Combined Work/Quality Assurance Project Plan (CW/QAPP) for Nitrogen Monitoring in Deer Island Treatment Plant Waste Streams Massachusetts Water Resources Authority Environmental Quality Department Report
2009/2010 Water Column Overview, Red Tide Update, and Bay Eutrophication Model 2010 Results. OMSAP Meeting June 30, 2011.
 29/21 Water Column Overview, Red Tide Update, and Bay Eutrophication Model 21 Results OMSAP Meeting June 3, 211 Scott Libby Contributions from D. Anderson, D. Borkman, C.S. Chen, R. Geyer, and C. Oviatt
Little Bay Project Summary
 Little Bay Project Summary Mike Gill, Kim Jackson, and Sally Morehead Submitted by Ken Dunton, Professor UT Marine Science Institute Port Aransas, TX 78373 3 July 27 Introduction: Little Bay is a relatively
Application of the 3D model ELCOM CAEDYM to estimate phosphorus load reduction needs for Lake Wister, OK
 Application of the 3D model ELCOM CAEDYM to estimate phosphorus load reduction needs for Lake Wister, OK J. Thad Scott, Erin Grantz, and Steve Patterson @ScottBiogeochem Thad_Scott@baylor.edu Lake Wister
REND LAKE WATER QUALITY
 REND LAKE 1999-2002 WATER QUALITY REPORT U.S. ARMY CORPS OF ENGINEERS, ST. LOUIS DISTRICT ENVIRONMENTAL QUALITY SECTION - Water Quality Billy Arthur, Section Chief Theodore Postol, Environmental Engineer
2003 Annual benthic nutrient flux monitoring report
 3 Annual benthic nutrient flux monitoring report Massachusetts Water Resources Authority Environmental Quality Department Report ENQUAD 4-5 Citation: Tucker J, Kelsey S, Giblin A, and Hopkinson C. 4. 3
Chesapeake Bay. report card
 Chesapeake Bay report card 2010 C- C Healthy water quality provides better habitat conditions for crabs, fish, and other aquatic species. issolved oxygen is essential to the survival of all these organisms;
Qian Zhang (UMCES / CBPO) Joel Blomquist (USGS / ITAT)
 Joel Blomquist (USGS / ITAT)") CBP STAC Water Clarity Workshop Solomons, MD, 02/06/2017 Long-term Riverine Inputs from Major Tributaries to Chesapeake Bay Relevant to Water Clarity Qian Zhang (UMCES / CBPO) Joel Blomquist (USGS / ITAT)
CBP STAC Water Clarity Workshop Solomons, MD, 02/06/2017 Long-term Riverine Inputs from Major Tributaries to Chesapeake Bay Relevant to Water Clarity Qian Zhang (UMCES / CBPO) Joel Blomquist (USGS / ITAT)
SITES. Bull Shoals Lake. Seasonal Analysis
 Taney County and Ozark County SITES Seasonal Analysis Nutrient concentrations in the main lake sites (1, 2, & 7) and Site 8 (located in a tributary of the main lake) all displayed similar patterns during
2016 Summit Lake Water Quality Report Prepared by Thurston County Environmental Health Division
 ! 216 Summit Lake Water Quality Report Prepared by Thurston County Environmental Health Division PART OF TOTTEN INLET WATERSHED LENGTH OF LAKE: 2.2 miles SHORELINE LENGTH: 5.6 miles LAKE SIZE: 53 acres
A limnologist s approach to numerical lake modeling: A case study at Lake Wister, OK
 A limnologist s approach to numerical lake modeling: A case study at Lake Wister, OK J. Thad Scott, Associate Professor of Biology, Baylor University @ScottBiogeochem Thad_Scott@baylor.edu Lake models
7.9 Nitrogenous Nutrients and Plankton Production in Jamaica Bay, NY
 7.9 Nitrogenous Nutrients and Plankton Production in Jamaica Bay, NY Ray Sambrotto 7.9.1 SUMMARY Two blooms characterize phytoplankton growth in Jamaica Bay: the winter/spring bloom, between February and
Water Quality Assessment for the Town of Caswell Beach, 2008
 Water Quality Assessment for the Town of Caswell Beach, 2008 UNCW-CMS Report 08-02 Report to: Town of Caswell Beach 1100 Caswell Beach Rd. c/o Mr. Jim Carter, Town Administrator Caswell Beach, N.C. 28465
St. Lucie Estuary: Analysis of Annual Cycles and Integrated Water Column Productivity
 St. Lucie Estuary: Analysis of Annual Cycles and Integrated Water Column Productivity Tom Gallo, Malcolm Pirnie Inc. Clifton Bell, Malcolm Pirnie Inc. Peter Doering, South Florida Water Management District
Nitrogen Cycling, Primary Production, and Water Quality in the New River Estuary. Defense Coastal/Estuarine Research Program (DCERP)
") Nitrogen Cycling, Primary Production, and Water Quality in the New River Estuary Defense Coastal/Estuarine Research Program (DCERP) Introduction: A key theme of the ongoing DCERP program is monitoring
Nitrogen Cycling, Primary Production, and Water Quality in the New River Estuary Defense Coastal/Estuarine Research Program (DCERP) Introduction: A key theme of the ongoing DCERP program is monitoring
Pacific Coastal Ecology Branch Physical and Water Quality Data
 Pacific Coastal Ecology Branch Physical and Water Quality Data Data Contributors: Cheryl A. Brown, Peter Eldridge, Robert Ozretich, Anne Sigleo & David Specht CRUISES CTD profiles using (SBE 19 SEACAT)
Nutrient Response to Sewage Abatement in Hong Kong
 Nutrient Response to Sewage Abatement in Hong Kong Prof. Paul J. Harrison Atmospheric, Marine & Coastal Environment Program Institute for the Environment HK University of Science & Technology Outline Background
Mystic River Watershed. Baseline Index Report
 Mystic River Watershed Baseline Index Report 2001 2007 ABR049 ABR028 MIB001 Mill Brook WIB001 ABR006 UPL001 MYR071 MEB001 ALB006 Alewife Brook MAR036 Map of watershed with Mystic Monitoring Network baseline
Suspended Solids Concentrations at Adams Point
 Indicator: Concentrations in the Great Bay Estuary Question How have total suspended solids (TSS) in the Great Bay Estuary changed over time? Short Answer Suspended solids at Adams Point show a statistically
Cultural accelerated by anthropogenic activities
 EUTROPHICATION IMPLICATIONS OF N & P Intent of this lecture? Link our discussions of terrestrial N & P dynamics with its influences on receiving water bodies How the relative amounts of N & P can influence
TAMAR ESTUARY 2011 REPORT CARD ECOSYSTEM HEALTH ASSESSMENT PROGRAM. Working together for healthy waterways
 TAMAR ESTUARY 2011 REPORT CARD ECOSYSTEM HEALTH ASSESSMENT PROGRAM Working together for healthy waterways TAMAR ESTUARY 2011 REPORT CARD RESULTS EHAP study area Tamar Estuary Tasmania This 2011 report
Long-Term Volunteer Lake Monitoring in the Upper Woonasquatucket Watershed
 Long-Term Volunteer Lake Monitoring in the Upper Woonasquatucket Watershed Linda Green URI Watershed Watch 1-87-95, lgreen@uri.edu WATER QUALITY IS A REFLECTION OF THE ACTIVITIES IN THE LANDS AND WATERS
2017 Water column monitoring results. Massachusetts Water Resources Authority Environmental Quality Department Report
 2017 Water column monitoring results Massachusetts Water Resources Authority Environmental Quality Department Report 2018-04 Citation Libby PS, Borkman DG, Geyer WR, Turner JT, Costa AS, Wang J, Codiga
Chapter Seven: Factors Affecting the Impact of Nutrient Enrichment on the Lower Estuary
 Chapter Seven: Factors Affecting the Impact of Nutrient Enrichment on the Lower Estuary As presented in Chapter Six, the water quality data for the upper stations of the tidal freshwater Potomac Estuary
Long Island Sound Nitrogen Reduction Strategy Overview Public Webinar November 8, 2017
 Long Island Sound Nitrogen Reduction Strategy Overview Public Webinar November 8, 2017 Photo Credit: CTDEEP/Hammonasset Beach State Park, CT Presentation Overview Nitrogen strategy overview Outline technical
MODELING THE SPOKANE RIVER-LAKE ROOSEVELT SYSTEM
 MODELING THE SPOKANE RIVER-LAKE ROOSEVELT SYSTEM Chris J. Berger 1, Robert L. Annear, Jr. 2, Michael L. McKillip 3, Vanessa Wells 4 and Scott A. Wells, ASCE 5 1 Senior Research Associate, Department of
A Summary of NE State Coastal Monitoring Programs. in support of EPA required 305b/303d Integrated Reporting for the CWA
 A Summary of NE State Coastal Monitoring Programs in support of EPA required 305b/303d Integrated Reporting for the CWA Christopher Deacutis, Ph.D. Narragansett Bay Estuary Program September 2011 NE State
Eutrophication and the Saltwater Hudson River
 Eutrophication and the Saltwater Hudson River Part 1: Primary Production and Eutrophication in the Hudson Since the Industrial Revolution, the Hudson River has had problems with pollution, yet the challenges
PRESS RELEASE. LOUISIANA UNIVERSITIES MARINE CONSORTIUM August 4, 2013
 PRESS RELEASE LOUISIANA UNIVERSITIES MARINE CONSORTIUM August 4, 2013 The 2014 area of low oxygen, commonly known as the Dead Zone, measured 13,080 square kilometers (= 5,052 square miles) as of Aug 1,
Acidity and Alkalinity:
 Evaluation of Pollution Sources to Lake Glenville Quarterly Report December 2018 Kimberlee K Hall, PhD Environmental Health Program, Western Carolina University Summary Chemical and microbial analysis
Narrow River Water Quality: Trends and Findings Spanning a Quarter Century!
 Narrow River Water Quality: Trends and Findings Spanning a Quarter Century! By Annette DeSilva and Veronica Berounsky In 1992, NRPA kicked off their River Watch program and since that time volunteers have
Analysis of Seekonk River Water Quality Following the Fish Kill of May 2015
 Analysis of Seekonk River Water Quality Following the Fish Kill of May 2015 On May 25 th, 2015, the Rhode Island DEM began to receive notifications of a moderate fish kill of Atlantic menhaden (Brevoortia
Update on Straits Pond
 Update on Straits Pond Presented to the Board of Selectmen July 27, 2017 Issues of Concern raised by citizens along Straits Pond: Midges (?) Offensive odor Excessive Algae Background: Straits Pond is a
Data Required to Support Reservoir Water Quality Modeling
 Data Required to Support Reservoir ater Quality Modeling The recommendations contained within this document are intended to assist with developing field data collection programs that can support reservoir
Nitrogen, Phosphorus, and Suspended Solids Concentrations in Tributaries to the Great Bay Estuary Watershed in 2015
 University of New Hampshire University of New Hampshire Scholars' Repository PREP Publications Institute for the Study of Earth, Oceans, and Space (EOS) 5-16-2016 Nitrogen, Phosphorus, and Suspended Solids
Public Information Meeting Wastewater Master Plan Facilities Plan Update June 23, 2010
 Public Information Meeting Wastewater Master Plan - 201 Facilities Plan Update June 23, 2010 Agenda Introduction Wastewater Master Plan Background Completed Projects Projects Concurrent with the WMP Master
MASSACHUSETTS WATER RESOURCES AUTHORITY
 MASSACHUSETTS WATER RESOURCES AUTHORITY Charlestown Navy Yard 100 First Avenue, Building 39 Boston, MA 02129 Frederick A. Laskey Executive Director Telephone: (617) 242-6000 Fax: (617) 241-6070 TTY: 617
Seasonality of Enterococcus levels in Deer Island effluent. Massachusetts Water Resources Authority Environmental Quality Department Report
 Seasonality of Enterococcus levels in Deer Island effluent Massachusetts Water Resources Authority Environmental Quality Department Report 26-7 Citation: Wu D. 26. Seasonality of Enterococcus levels in
Dead-Zones and Coastal Eutrophication: Case- Study of Chesapeake Bay W. M. Kemp University of Maryland CES Horn Point Laboratory Cambridge, MD
 Dead-Zones and Coastal Eutrophication: Case- Study of Chesapeake Bay W. M. Kemp University of Maryland CES Horn Point Laboratory Cambridge, MD Presentation to COSEE Trends Orientation at UMCES HPL 4 August
FILLING THE GAP: DISSOLVED OXYGEN MONITORING IN NARRAGANSETT BAY
 FILLING THE GAP: DISSOLVED OXYGEN MONITORING IN NARRAGANSETT BAY Christopher F. Deacutis, Narragansett Bay Estuary Program, URI Coastal Institute Keywords: Narragansett Bay, intermittent hypoxia, volunteer
LONG-TERM AMBIENT WATER QUALITY MONITORING OF THE NEW JERSEY PORTION OF THE NY/NJ HARBOR by the NEW JERSEY HARBOR DISCHARGERS GROUP (NJHDG)
") LONG-TERM AMBIENT WATER QUALITY MONITORING OF THE NEW JERSEY PORTION OF THE NY/NJ HARBOR by the NEW JERSEY HARBOR DISCHARGERS GROUP (NJHDG) Ashley T. Pengitore - PVSC NJ Water Monitoring Council Meeting
LONG-TERM AMBIENT WATER QUALITY MONITORING OF THE NEW JERSEY PORTION OF THE NY/NJ HARBOR by the NEW JERSEY HARBOR DISCHARGERS GROUP (NJHDG) Ashley T. Pengitore - PVSC NJ Water Monitoring Council Meeting
GULF OF MEXICO - SEGMENT 2501
 GULF OF MEXICO - SEGMENT 2501 GULF OF MEXICO - SEGMENT 2501 LAND COVER BACTERIA CHLOROPHYLL A Impairment Concern No Impairments or Concerns GULF OF MEXICO - SEGMENT 2501 OTHER IMPAIRMENTS Bays & Estuaries
EUTROPHICATION. Student Lab Workbook
 EUTROPHICATION Student Lab Workbook THE SCIENTIFIC METHOD 1. Research Background literature research about a topic of interest 2. Identification of a problem Determine a problem (with regards to the topic)
Big Bend Model. Wayne Magley Watershed Evaluation and TMDL Section FDEP. March 7, 2016
 Big Bend Model Wayne Magley Watershed Evaluation and TMDL Section FDEP March 7, 2016 BACKGROUND As outlined in the EPA November 30, 2012 document Methods and Approaches for Deriving Numeric Criteria for
2016, 2017 Estuarine Water Quality and Modeling in the Royal and Cousins Rivers
 2016, 2017 Estuarine Water Quality and Modeling in the Royal and Cousins Rivers Angela Brewer and Robert Mohlar Division of Environmental Assessment Bureau of Water Quality Protecting Maine s Air, Land
Biscayne Bay. A Jewel in Jeopardy? Stephen Blair 1 and Sarah Bellmund 2
 Biscayne Bay A Jewel in Jeopardy? Stephen Blair 1 and Sarah Bellmund 2 1 Department of Regulatory and Economic Resources; Division of Environmental Resources Management (DERM), Miami, FL 2 National Park
Receiving Waters Monitoring Work Plan Guidance for the CSO Program. March, 2015
 Receiving Waters Monitoring Work Plan Guidance for the CSO Program March, 2015 Background In accordance with the United States Environmental Protection Agency s (USEPA s) Combined Sewer Overflow (CSO)
Chapter 4.4. Development of a Water Quality Index for the Maryland Coastal Bays
 Chapter 4.4 Development of a Water Quality Index for the Maryland Coastal Bays Tim Carruthers 1 and Catherine Wazniak 2 1 Integration and Application Network, University of Maryland Center for Environmental
2005 Annual benthic nutrient flux monitoring report
 5 Annual benthic nutrient flux monitoring report Massachusetts Water Resources Authority Environmental Quality Department Report ENQUAD 6-17 Citation: Tucker J, Kelsey S, Giblin A, and Hopkinson C. 6.
Redwood Shores Lagoon August Monthly Water Quality Monitoring Report
 Redwood Shores Lagoon August Monthly Water Quality Monitoring Report Prepared for Redwood City Public Works Services Department 1400 Broadway Redwood City, CA 94063-2594 Prepared by Clean Lakes, Inc. P.
Morro Bay Watershed Creek Health For Water Year 2017
 Morro Bay Watershed Creek Health For Water Year 201 Date Range: October 1, 201 to September 30, 201 Analytes: Dissolved oxygen, water temperature, nitrates as N, orthophosphates as P Background The Morro
3 Objectives 3 Ob jec tives
 3 Objectives 3 Objectives 3 Objectives 3 Objectives contents Objective number Page 3.1 Ki uta ki tai: mountains to the sea O1-O5 37 3.2 Beneficial use and development O6-O13 38 3.3 Māori relationships
Semiannual water column monitoring report
 Semiannual water column monitoring report February - June 21 Massachusetts Water Resources Authority Environmental Quality Department Report ENQUAD 22-1 Citation: Libby PS, McLeod LA, Mongin CJ, Keller
The influence of coastal oceans and seas on nutrient limitation in estuaries
 The influence of coastal oceans and seas on nutrient limitation in estuaries Robert Howarth Ecology & Evolutionary Biology, Cornell University and The Ecosystems Center, MBL, Woods Hole September 13, 2017
Baltimore City Department of Public Works
 Baltimore City Department of Public Works Back River WWTP Process and Construction Overview Michael F. Gallagher, Chief Wastewater Facilities Division Wastewater Treatment Chesapeake Bay Restoration Water
Livable Region Strategy Plan Review towards 2031
 Burrard Inlet Ambient Water Quality Report Presentation to: Environment and Energy Committee September 9, 2008 Presented by: John Brereton, PhD Ph.D., PE P.Eng. Senior Engineer Policy and Planning Department
Phosphorus Goal Setting Process Questions and Answers 2010
 Lake Winnipesaukee Watershed Management Plan Phase I: Meredith, Paugus, Saunders Bays 1. What is phosphorus? Phosphorus (P) is a naturally occurring element and a major nutrient required for biological
Estuaries and Catchments team, Water Wetlands and Coasts Science Branch, Science Division, Office of Environment and Heritage
 Impact assessment of Berkeley Vale subcatchment pollutant loads in nearshore zone of Tuggerah Lakes Rebecca Swanson, Aaron Wright, Peter Scanes and Angus Ferguson Estuaries and Catchments team, Water Wetlands
Water Quality Monitoring for Lake Erie and the Great Lakes Nutrient Initiative (GLNI)
") Water Quality Monitoring for Lake Erie and the Great Lakes Nutrient Initiative (GLNI) 2011-2016 Water Quality Monitoring and Surveillance Division Alice Dove, Sean Backus, Vi Richardson Issues Facing the
Water Quality Monitoring for Lake Erie and the Great Lakes Nutrient Initiative (GLNI) 2011-2016 Water Quality Monitoring and Surveillance Division Alice Dove, Sean Backus, Vi Richardson Issues Facing the
IMPROVEMENTS IN WATER QUALITY OF A DANISH ESTUARY FOLLOWING NUTRIENT REDUCTIONS
 IMPROVEMENTS IN WATER QUALITY OF A DANISH ESTUARY FOLLOWING NUTRIENT REDUCTIONS Peter Stæhr 1, Jeremy Testa 2, Jacob Carstensen 1 1 Dept. Bioscience,, Denmark 2 Chesapeake Biological Laboratory, Univ.
Massachusetts Water Resources Authority. MWRA Advisory Board March 22, 2013
 Massachusetts Water Resources Authority Mystic River Water Quality MWRA Advisory Board March 22, 2013 Water quality issues in the Mystic River watershed Eutrophication-excess nutrients Invasive species
Common Procedure for the Identification of the Eutrophication Status of the OSPAR Maritime Area. UK National Report
 Common Procedure for the Identification of the Eutrophication Status of the OSPAR Maritime Area UK National Report 1 Table of contents Table of contents 2 1 Introduction 4 2 Description of assessed areas
Management Modeling of Suspended Solids and Living Resource Interactions
 Management Modeling of Suspended Solids and Living Resource Interactions Carl Cerco 1, Mark Noel 1, Sung-Chan Kim 2 1 Environmental Laboratory, US Army ERDC, Vicksburg MS, USA 2 Coastal and Hydraulics
Modeling the impacts of water quality on SAV and other living resources in the tidal Chesapeake Bay
 Modeling the impacts of water quality on SAV and other living resources in the tidal Chesapeake Bay Bio-optics, Biogeochemistry & SAV Distribution Dick Zimmerman 1, Victoria Hill 1, Chuck Gallegos 2 Hydrodynamics
Quality Assurance Project Plan. for. Benthic Monitoring Massachusetts Water Resources Authority Technical Report
 Quality Assurance Project Plan for Benthic Monitoring 2014 2017 Massachusetts Water Resources Authority Technical Report 2014-03 MWRA Contract OP216B Page 1 of 92 Citation: Nestler E, Pembroke A, and Hasevlat
NUTRIENTS AND PARTICLES TERC.UCDAVIS.EDU
 NU T R I EN T S A N D PA R T I C L E S 9 Sources of clarity-reducing pollutants TAHOE: STATE OF THE L AKE REPORT 2014 Previous research has quantified the primary sources of nutrients (nitrogen and phosphorus)
CARLYLE LAKE WATER QUALITY REPORT. for
 CARLYLE LAKE WATER QUALITY REPORT for 1997 U.S. ARMY CORPS OF ENGINEERS, ST. LOUIS DISTRICT ENVIRONMENTAL QUALITY SECTION - Water Quality Ted Postol, Section Chief Tori Foerste, Environmental Engineer
Water Quality in the Upper Cohansey Watershed
 Slide 1 Water Quality in the Upper Cohansey Watershed Salvatore Mangiafico County Environmental and Resource Management Agent Cooperative Extension of Salem and Cumberland Counties This talk will present
2018 WATER QUALITY MONITORING BLUE MARSH RESERVOIR LEESPORT, PENNSYLVANIA
 2018 WATER QUALITY MONITORING BLUE MARSH RESERVOIR LEESPORT, PENNSYLVANIA U.S. Army Corps of Engineers Philadelphia District Environmental Resources Branch January 2019 2018 Water Quality Monitoring Blue
Inflow, water quality, and flushing of Lake Worth Lagoon
 Inflow, water quality, and flushing of Lake Worth Lagoon Christopher Buzzelli, Cassondra Thomas, Peter Doering* Coastal Ecosystems Section South Florida Water Management District Photo by C. Buzzelli OBJECTIVES
Tsulquate River Community Watershed Water Quality Objectives Attainment Report
 Tsulquate River Community Watershed Water Quality Objectives Attainment Report Environmental Quality Section Environmental Protection Division West Coast Region 2013 Report Prepared by: Clayton Smith.
KILROY TERMINOLOGY KILROY TERMINOLOGY DEFINITION UNITS NORMAL RANGE. Meter Feet Fathom = 6 feet (nautical) N/A. Page 1 of 7
 N/A. Page 1 of 7") KILROY TERMINOLOGY BACKGROUND: Kilroy is a water-quality system unlike any other. Kilroy systems monitor the physical, chemical and biological indicators of health in a particular body of water and it
KILROY TERMINOLOGY BACKGROUND: Kilroy is a water-quality system unlike any other. Kilroy systems monitor the physical, chemical and biological indicators of health in a particular body of water and it
Quality Assurance Project Plan. for. Benthic Monitoring Massachusetts Water Resources Authority Technical Report
 Quality Assurance Project Plan for Benthic Monitoring 2011 2014 Massachusetts Water Resources Authority Technical Report 2013-04 MWRA Contract OP142B Page 1 of 92 Citation: Nestler, EC, AE Pembroke, and