Master Level Thesis. Evaluation of a PVT Air Collector. European Solar Engineering School No. 200, August 2015
|
|
|
- Kristian Francis
- 6 years ago
- Views:
Transcription


1 Master Level Thesis European Solar Engineering School No. 200, August 2015 Evaluation of a PVT Air Collector Master thesis 15 hp, 2015 Solar Energy Engineering Author: Chadi Abd Alrahman Supervisors: Frank Fiedler, Désiréé Kroner Examiner: Ewa Wäckelgård Course Code: MÖ3031 Examination date: Dalarna University Energy and Environmental Technology
2
3 Abstract Hybrid Photovoltaic Thermal (PVT) collectors are an emerging technology that combines PV and solar thermal systems in a single solar collector producing heat and electricity simultaneously. The focus of this thesis work is to evaluate the performance of unglazed open loop PVT air system integrated on a garage roof in Borlänge. As it is thought to have a significant potential for preheating ventilation of the building and improving the PV modules electrical efficiency. The performance evaluation is important to optimize the cooling strategy of the collector in order to enhance its electrical efficiency and maximize the production of thermal energy. The evaluation process involves monitoring the electrical and thermal energies for a certain period of time and investigating the cooling effect on the performance through controlling the air mass flow provided by a variable speed fan connected to the collector by an air distribution duct. The distribution duct transfers the heated outlet air from the collector to inside the building. The PVT air collector consists of 34 Solibro CIGS type PV modules (115 W p for each module) which are roof integrated and have replaced the traditional roof material. The collector is oriented toward the south-west with a tilt of 29 ᵒ. The collector consists of 17 parallel air ducts formed between the PV modules and the insulated roof surface. Each air duct has a depth of 0.05 m, length of 2.38 m and width of 2.38 m. The air ducts are connected to each other through holes. The monitoring system is based on using T-type thermocouples to measure the relevant temperatures, air sensor to measure the air mass flow. These parameters are needed to calculate the thermal energy. The monitoring system contains also voltage dividers to measure the PV modules voltage and shunt resistance to measure the PV current, and AC energy meters which are needed to calculate the produced electrical energy. All signals recorded from the thermocouples, voltage dividers and shunt resistances are connected to data loggers. The strategy of cooling in this work was based on switching the fan on, only when the difference between the air duct temperature (under the middle of top of PV column) and the room temperature becomes higher than 5 C. This strategy was effective in term of avoiding high electrical consumption by the fan, and it is recommended for further development. The temperature difference of 5 C is the minimum value to compensate the heat losses in the collecting duct and distribution duct. The PVT air collector has an area of (A c =32 m 2 ), and air mass flow of kg/s m 2. The nominal output power of the collector is 4 kwp pv (34 CIGS modules with 115 Wp pv for each module). The collector produces thermal output energy of 6.88 kw th /day (0.21 kw th /m 2 day) and an electrical output energy of kwh el /day (0.42 kwh el /m 2 day) with cooling case. The PVT air collector has a daily thermal energy yield of 1.72 kwh th /kwp pv, and a daily PV electrical energy yield of 3.36 kwh el /kwp pv. The fan energy requirement in this case was 0.18 kwh/day which is very small compared to the electrical energy generated by the PV collector. The obtained thermal efficiency was 8 % which is small compared to the results reported in literature for PVT air collectors. The small thermal efficiency was due to small operating air mass flow. Therefore, the study suggests increasing the air mass flow by a factor of 25. The electrical efficiency was fluctuating around 14 %, which is higher than the theoretical efficiency of the PV modules, and this discrepancy was due to the poor method of recording the solar irradiance in the location. Due to shading effect, it was better to use more than one pyranometer. 1
4 Acknowledgment I am grateful to my supervisors, Dr. Frank Fiedler and M.Sc. Dipl. Desiree Kroner for guiding me and giving me, the encouragement, and the independence to achieve this work. Their advices and invaluable comments inspired me. I would also like to thank the research engineer Emmanouil Psimopoulos, who helped me with the preparation of the experimental setup and provided me with all required equipment and tools as fast as possible. I would like to express my gratitude to the PhD student Kaung Myat Win for helping me in choosing the right thermocouple sensors and calibrating them. Lastly, I want to address my deepest gratitude to my wife for her encouragement and support during the project period. 2
5 Contents 1. Introduction Motivation Aims Method Theoretical background and literature review Limitation of PV systems Basic concept of PVT collectors Parameters affecting PVT performance PVT cost compared to PV systems PVT water collectors PVT air collectors Experimental setup and measurements Description of the installed PVT air collector Description of the monitoring system Calibration of thermocouple sensors Pyranometer, wind and air velocity sensors Voltage dividers and shunt resistances Low pass filters Data acquisition Data analysis and results Data analysis Results Thermal performance Electrical performance Discussion and conclusions Results analysis Future work References Appendices Appendix I PV Solibro modules data sheet Appendix II Inverters datasheet AppendixIII Data logger s datasheet Appendix IV Pyranometer s datasheet Appendix V Wind speed senosr s datasheet Appendix VI Air velocity senosr s datasheet
6 Nomenclature and units A c PVT Collector area m 2 C Low pass filter capacitance F c p Specific heat capacity of air J/kg K D H Hydraulic air duct diameter m D op Optimum air duct depth m E c Thermal energy Wh f c Resonance frequency of low pass filter Hz G Solar irradiance W/m 2 I d1, I d2 Voltage divider currents A I pv PV current A I sc Short circuit current A L Air duct width m m. Air mass flow kg/s P el Electrical power W P th Thermal power W R Low pass filter resistance Ω R 1, R 2 Voltage dividers resistances Ω R s Shunt resistance Ω T in, T out Inlet and outlet air temperatures ᵒC T H, T M, T L Higher, middle and lower temperatures of PV colon ᵒC T F, T D, T amb Front, duct and ambient temperatures ᵒC V oc Open circuit voltage V V r1, V r2 Output voltages of the dividers V V s1, V s2 Voltages measured across the shunt resistance V W Air duct width m η el Electrical efficiency % η th Thermal efficiency % 4
7 1. Introduction Since the industrial revolution in eighteenth century, energy has been one of the greatest challenges facing mankind. Fossil fuels such as coal, petroleum, and natural gas have been the main energy resources for everything vital for human society (transportation, electricity, lightning, heating of buildings, cooking, etc.). However, fossil fuel resources are being rapidly depleted by excess exploration, and once they run out they can t be replenished. Furthermore, fossil fuels are expensive to retrieve from the earth and to use them, and these fuels create massive pollution in the environment. The promising alternative energy source is the sun, the most abundant energy resource available for human society. The total energy of solar radiation reaching the earth per year is approximately 5.46 x J. To have an idea of how much the sun energy is, it is enough to know that in the years , the annual global energy consumption was about 5 x J, Chen, (2011). That means 0.01 % of the annual solar energy reaching the earth can satisfy the energy needs of the entire world. Thanks to the intensive research and development, using of solar energy, especially solar photovoltaic (PV), is enjoying rapid progress. Therefore, it is expected that in the near future solar energy will become the primary energy source, surpassing all fossil fuel energy resources. Photovoltaic is a technology involving the direct conversion of solar radiation into electricity by using solar cells. A solar cell is essentially a specialized semiconductor diode with a large barrier layer which can convert a part of the incident light on the cell into DC electricity. Solar systems that harness solar energy could be classified into two main categories, PV systems and solar thermal collectors as shown in Fig.1. While PV systems convert solar energy to electricity, solar thermal collectors convert solar energy to thermal energy either for heating purpose or for generating electricity. A third category, PV thermal hybrid collectors (Fig.1), can be added to the previous classification combining both PV systems and solar thermal collectors. PV thermal collectors can produce thermal energy and electricity simultaneously from a single solar collector. Fig.1.1 Classification of solar energy systems. 5
8 1.1 Motivation Hybrid photovoltaic thermal (PVT) collectors are using photovoltaic (PV) modules both for electricity and heat production. These systems attract special interest among the solar energy applications due to their economic and energetic properties especially for domestic applications. The PV modules suffer from degradation of their conversion efficiency when their operating temperature increases. As the module temperature increases, the short circuit current (I sc ) slightly increases, while the open circuit voltage (V oc ) decreases considerably. Therefore, reducing the module temperature is a useful methodology in order to improve the electrical performance of PV modules. In PVT air collector, the inlet air (ambient air in our case) is enforced to pass on the back of the modules to reduce their temperature and thus increasing their efficiency. In meanwhile, the outlet air heated by the modules can be directed into a building for heating purpose. The PVT air systems are not widespread, and the evaluation of such systems is very important to enhance their performance and to make them more attractive for public use. 1.2 Aims The objective of the project is to evaluate the thermal and electrical performance of the installed PVT air collector. The evaluation shall be used to study if the cooling can be optimized in order to increase the electrical energy produced by the PV modules, and maximize the heat production. 1.3 Method The methodology of this work involves the following stages: - Designing and building a monitoring system to acquire the needed parameters - Measurements of main electrical and thermal parameter over a period of a few days in May. - Analysis of the measurement data and calculation of thermal and electrical performance based on energy balance model from Bambrook et al., (2012). The monitoring system is based on thermocouples (TCs), voltage dividers, shunt resistances, pyranometer, data loggers, and air, wind velocity sensors. For the thermal evaluation, the main parameters to be monitored are the inlet air temperature T in, the outlet air temperature T out, the room temperature T r, the ambient temperature T amb, the air duct temperature T D, the air mass flow rate driven by the fan m., and the temperatures of back and front of the PV modules. For electrical evaluation, the main parameters to measure are the output DC voltages (V pv ) and currents (I pv ) of the PV arrays. 6
9 2 Theoretical background and literature review In this chapter, the shortage in performance of PV modules, due to high operating temperature is explained, and the necessity of developing PVT collectors is pointed out. The concept of PVT collectors and their types are mentioned in details. A short literature review about the design and energetic balance of PVT collectors is presented. 2.1 Limitation of PV systems Each type of solar cells in the PV systems has a certain cut-off absorption wavelength corresponding to the cells band gap energy. Any incident photon with a wavelength longer than the cut-off wavelength will not be absorbed by the solar cells. That means photons of longer wavelength (their energy is below the band gap energy) do not generate electronhole pairs to produce electricity, but only dissipate their energy as heat in the cells. Most of PV cells convert 8 to 20 % of the incident solar radiations into electricity depending on the type of cells and the operating conditions, and more than 50 % of the incident solar energy is transferred to heat energy. As a result, the PV cells temperature may increase to more than 30 ᵒC above the ambient temperature depending on the later and the wind speed. Increasing the cells temperature leads to reducing V OC voltage and thus reducing the cells electrical efficiency. Figure 2.1 shows an example of an I-V curve of a PV module presenting the effect of cell temperature on the electrical performance of the module (arrangement of cells). For example, by increasing the silicon (mono-crystalline) based cell temperature from the ambient value of 25 ᵒC to 85 ᵒC, the V OC decreases by 18 % which negatively affects the electrical performance of solar system, Häberlin, Heinrich,Book p136, (2012). Fig.2.1 I-V curve of a PV module with different cell/modules temperatures and 1000 W/m 2 insolation. I sc increases slightly, while V OC decreases considerably with increasing the temperature. Red circles indicate V oc and I sc values, Cooling the PV modules with a fluid stream (coolant) is a good strategy to improve the modules performance. Conceptually the better design is to re-use the heat energy extracted by the fluid. Then the total energy yield per unit area of the modules can be considerably improved. These are the incentives leading to the evolvement of PVT hybrid solar technology. 7
10 2.2 Basic concept of PVT collectors PVT hybrid collectors can supply electrical and thermal energy simultaneously, and has merits of higher energy gain and effective utilization of installation area compared to only PV panels or solar thermal collectors with the same capacity. A PVT collector mainly consists of two layers: A glazed or unglazed PV layer at the top and a thermal absorber layer at the bottom which absorbs heat from the PV layer. The absorber layer has an inlet and outlet for fluid circulation. The fluid, which may be liquid (such as water or waterglycol mixture) or air, is circulated through the absorber material to extract heat from it. Fig.2.2 shows a simple structure of flat plate PVT collector. Fig.2.2 Main features of a flat-plate PVT collector, Chow, (2010). Extracted heat from the PV modules serves as a second benefit along with the increased performance of the PV modules. For low temperature applications such as domestic hot water heating, pool heating, and air heating in ventilation systems, PVT collectors are attractive in terms of efficiency and performance. Furthermore PVT collectors provide architectural uniformity at the building facade and are aesthetically better than the two separated arrays of PV and solar thermal collectors being placed side by side to get the same output of one PVT collector. There are several types of PVT collectors and they are classified with respect to the fluid used, shape of the collector and whether it s integrated into a building or not. Moreover, having glazing on the collector is another factor that distinguishes a PVT collector s characteristics. The main two types of PVT collectors, according to the shape, are flat plate PVT collectors, concentrating PVT collectors, and they can use either water (PVT water collectors) or air (PVT air collectors) as fluid. Flat plate PVT collectors are very similar to the well-known flat plate thermal collectors, but they have a PV layer above the thermal absorber as shown in Fig.2.2. In concentrating PVT collectors, concentrators are used to increase the irradiance level on PV modules which leads to use less PV panel area and hence reducing the total cost of the collector. A low concentrating PVT water collector of building integrated type of 50 m 2 glazed area (mono-crystalline Si solar cells) was investigated by Brogren et al., (2002), where low cost aluminum foil reflectors in parabolic shape were used with a concentration ratio of 4.3. The annual electricity production was considerably higher by about two times, and the thermal energy was higher by 3 to 4 times than the electrical energy produced by conventional PV systems, with no 8
11 concentration. The collector was installed in Stockholm, Sweden and was able to produce 800 kwh of heat and 200 kwh of electricity per m 2 solar cell area. The hot water had a temperature of about 50 ᵒC. Generally, air or water is used as a fluid to extract the heat from the PVT collector. Water and air are preferred coolants rather than refrigerants since the overall cost of the entire system increases due to the capital cost and maintenance cost for the refrigerant loop. Water is the most effective fluid to collect the heat from the PV panel and absorber due to its high heat capacity and thermal conductivity. 2.3 Parameters affecting PVT performance In PVT collectors, the electrical and the thermal efficiencies increase to certain extend as the mass flow rate of the fluid increases. However, increasing the mass flow rate results also in decreasing the outlet temperature of the fluid and increasing the required electrical energy for the pump or the fan that moves the fluid through the PVT system. Therefore, a good designing of a PVT collector requires choosing the right value of the fluid mass flow. There are additional fundamental parameter to be considered in the PVT collector design, such as collector area, the length to width ratio of the collector and the depth of cooling duct, which affect significantly the energetic performance of the collector (Brinkworth, 2006, Farshchimonfared et al., 2015). 2.4 PVT cost compared to PV systems The costs of PVT and PV systems depend on the developed technology and varying over time, but mostly, PVT collectors are more expensive compared to PV and thermal collectors. For example, Tripanagnostopoulos et al., (2002) conducted outdoors tests on both PVT air and water collectors of different design configurations for horizontalmounted applications. They found that PVT air collectors are around 5 % higher in production costs than the PV modules. This would be around 8 % for PVT water collectors with pc-si cells, and around 10 % when the entire system costs were considered. The outcome of their experimental tests gave a range of thermal efficiency from 38 % to 75 % for PVT air collectors and 55 % to 80 % for PVT water collectors, based on the steady state noon-hour measurements in the University of Patra (at 38.2ᵒ N) in Greece. During the experiment, the collectors were arranged in parallel rows and keeping a distance between rows to avoid shading, and then low-cost booster diffuse Aluminum reflectors (concentration ration = 1.5) were placed between the adjacent rows to increase the received radiation at collector surfaces. 2.5 PVT water collectors In this type of PVT collectors, water or a mixture of water (i.e. water-ethylene-glycol) is circulated through the collector to extract heat from it. Using a PVT water collector is advantageous if there is a demand for hot water. Flat structure of the collector allows simple design and convenient integration on a building, usually rooftops; therefore PVT flat water collectors are more popular compared to concentrating PVT water collectors. Furthermore, in PVT water collectors, hot water may be stored in an external tank for a period of time which imposes drawback of leakage and freezing that may occur in extreme conditions, Arif Hasan et al., (2010). However, these can be prevented by robust construction and by using water-ethylene-glycol mixture. PVT water collectors may either be glazed or unglazed. An extra layer of glass on top of the PV cells results in less heat losses and greater thermal performance, whereby reducing electrical performance by some extent due to the reason that PV cells perform worse in higher temperatures. Unglazed PVT collectors have higher electrical performance and lower thermal performance compared to glazed ones because of greater heat losses resulting in lower operating temperatures, Ramos, (2010). 9
 provides the simplest way to construct a PVT collector by integrating a standard PV panel to a thermal collector without any modification.")
12 PVT water collectors have been presented in the literature with different design depending on the cooling method. Fig.2.3 shows the cross sectional views of common PVT water collector designs. The sheet-and-tube design (Fig.2.3.a) provides the simplest way to construct a PVT collector by integrating a standard PV panel to a thermal collector without any modification. Even, the annual efficiency of this design is about 2 % worse compared to other designs; it can be a good choice due to its simplicity. The cooling channel below transparent PV design (Fig.2.3.c) gives the best efficiency, Zondag, (2003). The configuration of a channel PVT collector with the channel on top of the PV (Fig.2.3.d) imposes constraints on the choice of the collector fluid; so that the absorption spectrum of the fluid should be sufficiently different from the PV absorption spectrum in order to allow the PV to receive the incoming radiation. The effect of spraying water upon the PV cells is investigated in terms of cells temperature variation and reflection losses showing an increase in cells efficiency on average of 3.26 %, (Amery and Abdolizadeh, 2009). Fig.2.3 Cross-sections of some common PVT water collector designs, Chow, (2010). The thermal efficiency of PVT water systems is generally in the range of % for unglazed to glazed panel designs. 10
; Bambrook et al.")
13 2.6 PVT air collectors In PVT air collectors, air is circulated through the collector instead of water. This type of collectors is attractive for applications where heated air is required. PVT air collectors provides some advantages such as they are cheaper and less complex compared to PVT water collectors [Arcuri, (2014); Bambrook et al., (2012)], where a simple fan can be used instead of a water pump. Moreover, there is no risk of freezing, or boiling at extreme weather conditions. On the other hand, PVT air collectors suffer from some major disadvantages such as having lower thermal performance characteristics compared to water types due to lower heat capacity and thermal conductivity of air compared to water. Furthermore, low density of air causes the transfer volume to be significantly higher than that of PVT water types. Thus, pipes with higher volume and greater bulk are needed which is not suitable for applications with low available area and is not aesthetically likable. Despite these disadvantages, PVT air collectors are suitable choices for hot air applications thanks to their lower cost. Fig.2.4 shows a single pass flat plate PVT collector, where the air is circulated in a duct at the back of PV modules to extract the heat. PVT air collectors can also be uncovered or glass covered, where a covered collector has an additional glass cover over the PV modules to reduce heat loss from the top of the collector, Tonui et al., (2007). Variety of PVT air collector designs including single pass or double-pass, wall-mounted or roof mounted have been reported in the literature. Fig.2.4 Single pass PVT air collector, M. Farshchimonfared et al., (2015). A number of experimental and analytical studies have been reported on PVT air collectors [Tonui et al., (2007), Chen et al., (2010), Mei et al., (2009), Candanedo et al., (2010)]. Tonui et al. (2007) investigated low cost improvements for PVT air collectors to enhance the heat extraction from the PV modules. The design contains two modifications involving the interposing of a thin (flat) metallic sheet at the middle of the air duct or channel (TMS configuration in Fig.2.5) and attaching rectangular fins, oriented parallel to the flow direction, at the back wall of the channel (FIN configuration in Fig.2.5), to enhance heat transfer from the channel walls to airflow. The PVT collector consisted of two identical polycrystalline pc-si PV panels, of length 1 m, aperture area 0.4 m 2 and rated power of 46 W p, as absorber plates. The air channel had a depth of 15 cm attached at the rear surface of each module. The air duct casings were constructed from a thermal insulator board of thickness 5 cm on the backside and the edges with a thin aluminum sheet as inner lining. Small inlet and outlet vents of diameter 5 cm (to fit to the flexible tubes from the air pump) were provided at the top and bottom of the air channels, respectively. The fins height and spacing distance was each equal to 4 cm. Fig.2.5 displays the three PVT designs developed by Tonui et al. (2007). 11

14 Fig.2.5 Cross-sectional view of PVT air collector models. Flow direction is perpendicular to the page, Tonui et al. (2007). REF: presents the PVT air collector without modification, TMS: presents the modified collector with thin metalic layer at the middle of the duct, FIN: presents the modified collector with fins in the duct. Their results showed that the thermal efficiency was 25, 28, and 30 % for REF (collector without modifications), TMS, and FIN configurations, respectively. They mentioned that the modifications increased the thermal efficiency of the PVT air collectors by 12 % and 20 % for TMS and FIN designs, respectively compared to the REF design for both natural and forced airflow. In forced flow, the air flow rate was 60 m 3 h -1 corresponding to air velocity of 0.25 m/s. While in natural flow, the flow rate was 12.5 m 3 h -1 corresponding to air velocity of 0.06 m/s. The module temperature measured without air circulation for all the PVT air configurations was about ᵒC at ambient temperature of about 30 ᵒC and insolation level of W/m 2. With the air circulation, the measured PV module temperatures range from 45 to 65 ᵒC depending on the flow rate, weather conditions and time of the day. Testing of an experimental building integrated PVT (BIPVT) air system is done by Bazilian et al. (2001), where an air gap between the PV module and the building is used for circulating air to cool PV modules and the pre-heated air can be used for building thermal needs. Chen et al. (2010) investigated another type of BIPVT system thermally coupled with a ventilated concrete slab in a low energy solar house located in the cold climate of Quebec, Canada. The used BIPVT system consisted of 21 amorphous silicon 136 W p PV modules bonded directly to metal roofing which covers an area of (6.2 m width x 10.4 m length). A shallow air duct with a depth of m runs underneath the metal roofing and the back of the channel is composed of plywood and insulation. The use of low air flow rates ( kg/s m 2 ) enables large temperature increases between the inlet and outlet air of the order of 40 ᵒC for a sunny day in winter. The PV modules were shown to be operating at high temperatures around ᵒC under these conditions. A typical thermal efficiency of 20 % for the BIPVT system was reported. More PVT air collector designs have been presented in the literature with some of the main features implemented being single-pass or double-pass air flow, and using the PVT concept as either a building wall facade or a roof mounted unit. Hegazy (2000) performed an extensive investigation of the thermal, electrical, hydraulic and overall performance of four types of flat-plate PVT air collectors including one cooling channel above PV as Mode I (Fig.2.6.a), one channel below PV as Mode II (Fig.2.6.b), PV between single-pass channels as Mode III (Fig.2.6.c), and finally the double-pass design as Mode IV (Fig.2.6.d). 12
15 Fig.2.6. Longitudinal cross-sections of some common PVT air collector designs, Chow, (2010). The numerical analysis showed that while Mode (I) has the lowest performance, the other three have comparable energy yields. The thermal efficiency of the PVT collector increased with increasing the air mass flow regardless of the collector configuration. The increment in the thermal efficiency was high before the air mass flow reached 0.02 kg/sm 2, while the increment became weak after the air mass flow over passed 0.02 kg/s m 2 as shown in (Fig.2.7). The thermal efficiency was 50 % at air mass flow of 0.02 kg/sm 2. Fig.2.7 Daily thermal efficiency performance of flat plate PVT air collector configurations (I IV) analyzed by Hegazy, (2000). 13
16 The temperature difference between the inlet and outlet air of the collector decreased with increasing the air mass flow as shown in Fig.2.8. The temperature difference was 25 ᵒC at air mass flow of 0.02 kg/sm 2. Fig.2.8 Variation of maximum air temperature rise with air mass rate for PVT air collector configurations (I IV) analyzed by Hegazy, (2000). Fig.2.9 Hourly values of solar insolation and ambient temperature used in the computations, Hegazy, (2000). Performance comparisons had been performed employing the hourly data of solar insolation and ambient temperature shown in Fig.2.9. These climate data were recorded at Minia University, Egypt for the summer day 24 June 1998, during which the prevailing wind speeds varied between 0.5 and 1.5 m/s. Brinkworth, (2006) studied the optimization of the geometry of naturally ventilated PV cooling ducts to minimize the loss of PV modules efficiency. The outcome of this study determined that the optimum ratio of the duct length (L) to its hydraulic diameter (D H ) is 14
17 around 20 (or D H /L=0.05), but this value could not be used for a PVT air collector as the thermal energy output and fan power have not been investigated in the study. Recently, Farshchimonfared et al., (2015) studied PVT air collectors to optimize the cooling channel depth, the air mass flow rate per unit collector area and the air distribution duct diameter considering the whole system performance. The optimization process aimed to maximizing the thermal energy output per unit collector area delivered to the building at a fixed value of the temperature rise (T out -T in = 10 ᵒC), and for different values of PVT air collector area A c (10, 15, 25, 30 m 2 ) and L/W ratio (0.5, 1, 1.5, 2), where W is the air duct width in m. The collector was linked to an air distribution system of a typical residential building in a climate with a mild winter (e.g. Sydney). The optimum value of air mass flow was almost constant and approximately equal to kg/s m 2 (Fig.2.10). The optimum depth (D opt ) value varies between 0.09 and m (Fig.2.11) and the optimum air distribution duct varies between 0.3 and 0.5 m (Fig.2.12). The optimum depth increases as the collector L/W ratio and the collector area increase. Fig.2.10 Optimum air mass flow rate per unit collector area as a function of the length to width ratio (L/W) for collectors of area 10, 15, 25 and 30 m 2, Farshchimonfared et al., (2015). Fig Optimum depth as a function of the length to with ratio (L/W) for collectors of area 10, 15, 25 and 30 m 2, Farshchimonfared et al., (2015). 15
18 Fig.2.12 Variation of the air distribution duct diameter as a function of the length to width ratio (L/W) for collectors of area 10, 15, 25 and 30 m 2, Farshchimonfared et al., (2015). Fig.2.13 Variation of the optimum depth to length ratio of the PVT air collectors, Farshchimonfared et al., (2015). Fig.2.13 illustrates the variation of the optimum depth to length (D opt /L) of PVT air collectors. The value (D opt /L) was not constant and varied between 3.4 x 10⁻³ to 4 x 10⁻³ depending on the value of L/W and the collector area. Bambrook et al. (2012) demonstrated a thermal energy output of around 15 kwh th /day (2.41 kwh th /m 2 day), and an electrical output of 3.28 kwh el /day (0.53 kwh el /m 2 day), on a sunny winter s day in Sydney. The electrical and thermal outputs were generated by using a PVT air collector with an area of (A c =6.22 m 2 ), and air mass flow of kg/s m 2. The PVT air collector consisted of six PV modules with total output power of 0.66 kwp. The non-ventilated PVT air collector had a midday electrical efficiency of 10.6 % in sunny winter weather conditions. At 12:00 pm, the air cooled collector produced an electrical efficiency of 12.2 %, representing a relative electrical efficiency increase of 15%. The PVT air system had a daily thermal energy yield of 22.7 kwh th /kwp pv, and a daily PV electrical energy yield of 4.97 kwh el /kwp pv. The fan energy requirement in that case was 0.15 kwh/day, which is smaller than the additional energy generated by the PV modules (0.25 kwh) due to the ventilation and operation at a lower temperature. The reference electrical energy output used for that case is the electrical energy output of the non-ventilated PVT system which is 3.03 kwh and corresponds to a PV electrical energy yield of
19 kwh el /kwp pv (These values of electrical energy, with ventilation and without ventilation, were adjusted for an average Sydney sunny day solar insolation of 5.75 kwh/ m 2 day). Chan et al. (2010) demonstrated a heat output of 9.7 kw, and an electrical output of 2.41kW, produced by 64.5 m 2 residential BIPVT with air flow rate of kg/s m 2. The fan power was 0.4 kw. The unventilated case generated an electrical output of 2.31 kw and no thermal output. That means an increase of 100 W in electrical output and 9.7 kw heat output of the BIPVT air system came at a price of 400 W for the fan power. 17
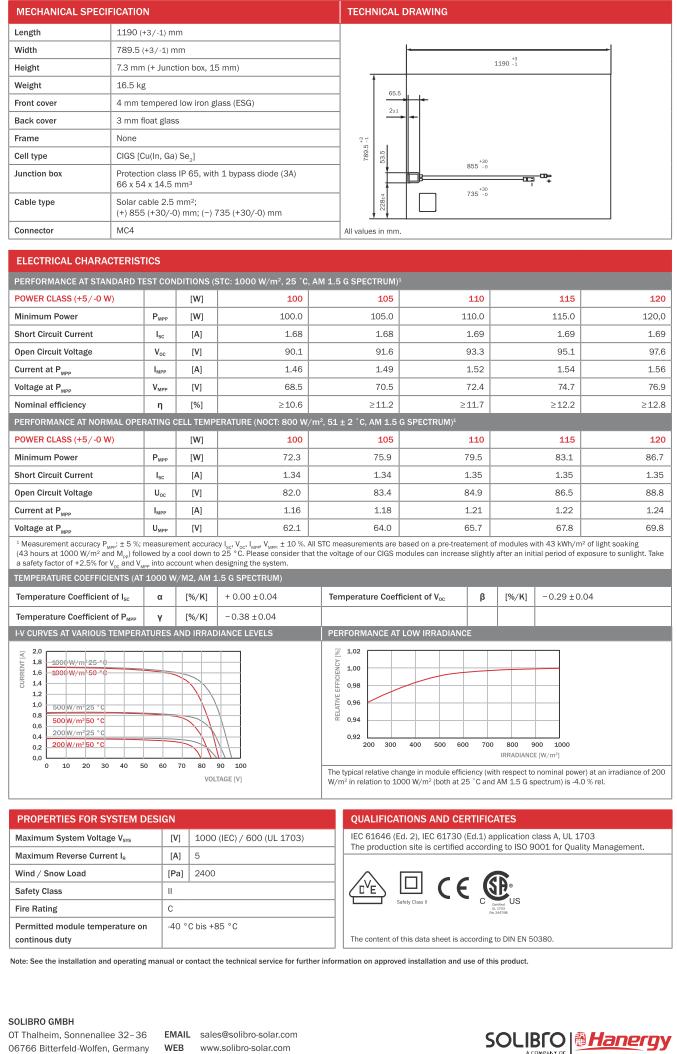
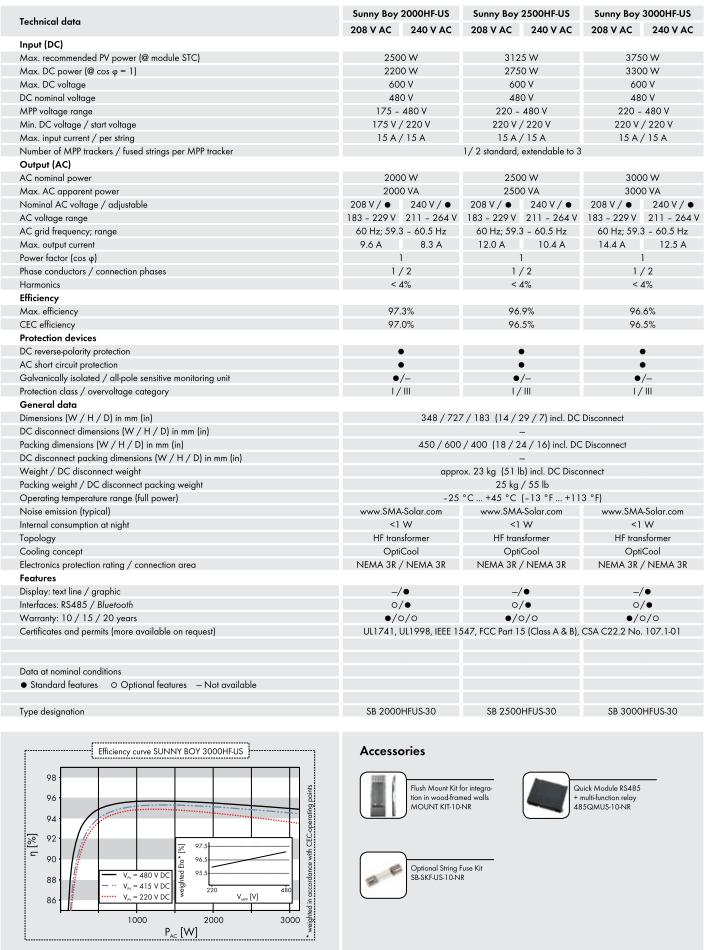
20 3 Experimental setup and measurements In this chapter, detailed information about the installed PVT air collector is discussed, and the developed monitoring system is carefully described. Moreover, a full explanation of the measurement procedure and data acquisition is given. 3.1 Description of the installed PVT air collector The PVT air collector consists of 34 Solibro CIGS type PV modules (115 W p for each module, see Appendix I). Fig.3.1 shows the IV curve of one PV CIGS module at 45 ᵒC and for different solar irradiance values (1000 W/m 2, 800 W/m 2, 600 W/m 2, 400 W/m 2, and 200 W/m 2 ) to show the electrical performance of such modules. Fig.3.1 I-V curve of one PV module at 45 ᵒC, under different solar irradiance values, simulated by PVsyst software. Voltage and current at maximum power (white circle) is 70 V, 1.6 A at 1000 W/m 2. The PV modules are roof integrated and have replaced the traditional roof material (Fig.3.2). The collector is oriented toward the south-west with a tilt of 29ᵒ. Two rows of the modules are formed: the upper row contains 17 modules, and the lower row contains also 17 modules to occupy the half of roof area of 32 m 2 (length of 13.6 m x width of 2.38 m). The arrangement of the module strings is chosen to minimize the shading effect caused by two houses and few trees in the surroundings as shown in the drawing (Fig.3.3) below simulated by PVsyst software. The modules arrangement contains two PV arrays (Array 1 and Array 2 shown in Fig.3.4): the first array has 4 strings in parallel (each string consists of 4 modules connected in series), which are connected to one solar inverter type, (SMA SB2000 of 2kW, see Appendix II), while the second array has 3 strings in parallel (each string consists of 6 modules connected in series), which are connected to another solar inverter (SMA SB2000 of 2kW). The PVsyst simulation was done with and without shading for the two PV arrays separately. The result of the simulations yields that shading losses per year for array 1 is 14 % which is equal to 525 kwh (14 % of totally produced energy 3775 kwh when there is no shading). Shading losses per year for array 2 is 12.6 % which is equal to 475 kwh (12.6 % of totally produced energy 3775 kwh when there is no shading). 18


21 Fig.3.2. Installed PVT air system. The modules are arranged in two rows to occupy half of the roof area. Fig.3.3 3D simulation of the PV field and its surrounding shading scene, simulated by PVsyst software. In Fig.3.4, every two vertical modules form one PV column, and columns 3, 10 are used in the study. Fig.3.4. Arrangement of the modules (a), and the strings configuration and connections (b), where each color presents one string. Columns 3, 10 (in yellow) are used in the study to measure their back temperatures at different locations. 19
 are formed in parallel (Fig.3.5). The air ducts under the modules are connected to a rectangular collecting duct through holes.")
22 Cooling is provided by air passing under the bottom edge to the top edge of the modules. Seventeen rectangular cooling air ducts or channels (each air duct has a depth of 5 cm, a width W of 0.79 m and a length L of 2.38 m) are formed in parallel (Fig.3.5). The air ducts under the modules are connected to a rectangular collecting duct through holes. An opening in the middle of the collecting duct leads the air via a 100 mm pipe (delivery duct or distribution duct) into the building, where the fan is located. The fan is operated at volume flow rate of 187 m 3 /h, with power consumption of 25 W. Fig.3.5 top view of the PVT collector with the air ducts, delivery duct opening and rectangular collecting duct. First PV colon, a colon in the middle and two last colons are illustrated in the PV panel. 3.2 Description of the monitoring system The monitoring system is designed and mounted in the garage room. This system is used to measure the required parameters for thermal and electrical analysis of the collector. The part of the monitoring system related to the thermal evaluation consists of 12 T-type thermocouples (TCs). T-type TCs are attached on the front and back of few modules. The locations of the TCs are shown in Fig.3.6. TCs are used to measure the back side temperature of the PV modules at six different points distributed on two PV columns 3 and 10 (Upper temperature T H, temperature middle T M, temperature lower T L are considered for each column) located in two different places on the roof as illustrated in Fig.3.4. Two TCs are used to measure the front temperatures T F of the two columns, another two TCs are used to measure the air duct temperatures T D just behind the two columns in the middle position. The outlet air temperature T out, the inlet air temperature T in and the ambient air temperature T amb are measured by the same TCs type. The temperatures (T in, T L, T M, T H, T out, T F, T D, T amb ) are presented in numbered circles (Fig.3.6) 1, 2, 3, 4, 5, 6, 7, 8, respectively. The twelve TCs are connected directly to one data logger (EdgeboxV12 of 12 channels, resolution of 16 bits, See Appendix III). The temperature values are read directly from the data logger which is adapted with such kind of T-type TCs. Accurate temperature measurement is required in such experiment; therefore calibration of the thermocouples is needed. 20

23 Fig.3.6. Side view of the PVT system with the air duct, delivery duct, fan, pyranometer, wind speed sensor, air velocity sensor. T in, T L, T M, T H, T out, T F, T D, T amb are presented in numbered black circles 1, 2, 3, 4, 5, 6, 7, 8, respectively. A T-type thermocouple is inserted in the plastic tube at distance of 0.5 m from the fan (Fig.3.7) to measure the outlet air temperature (the heated air). Above the mentioned thermocouple by 0.01m, a velocity sensor is mounted in the plastic tube to measure the air velocity. Fig.3.7. Variable speed fan with the delivery duct, temperature based controller, air velocity sensor, and outlet air thermocouple. 21
24 Calibration of thermocouple sensors A reference thermometer was used to calibrate the thermocouples in the temperature range of 14 C to 75 C. The tolerance of the reference thermometer was 0.1 ᵒC. The calibration procedure was done as follows: Clean tap water was boiled and inversed into a deep cylindrical container to fill 75 % of the container volume. The container is positioned in the center of an insulating box with a thick insulated cover to prevent heat exchange with the ambient in order to avoid rapid temperature reduction. The reference thermometer probe and the 12 T-type TCs were mounted on a ring through holes made in the ring itself. The ring was inserted inside the container so the sensing areas of all sensors were completely submerged in the hot water at the same height, but the TCs probes did not touch the bottom or sides of the container. The whole closed box was left for few hours to get homogenous temperature distribution in the box. Cold water was regularly mixed with the hot water to get the desired temperature. Stirring the mixture was done by a DC motor rotating a metallic rod passes from the cover and the center of the ring to reach a position under the probes inside the container. The rod ends with 4 thin fins to ensure good stirring effect. All the TCs were connected to a data logger (EdgeBoxV12, 12 channels, resolution of 16 bits) to record their temperatures every minute, and the reference thermometer values were recorded manually. The temperature range was varied from 75 ᵒC to 14 C. The tolerance of T-type TCs was 0.70 C before the calibration and improved after the calibration to be better than 0.16 C. A second order polynomial is used to fit the measured temperature values for each TC to the reference temperature values and the polynomial coefficients are used to calculate the calibrated temperature values for each TC. Fig.3.8 and Fig.3.9 show a temperature deviation between the reference thermometer and the first set of TCs (TC1 to TC6), before the calibration and after the calibration, respectively. The performance of the second set of TCs (TC7 to TC12) is quite similar to the first set. Fig.3.8. Temperature deviation between the reference thermometer (T ref ) and the first set of thermcouples (TC1 to TC6) before the calibration. 22
 is used to measure the solar irradiance.")
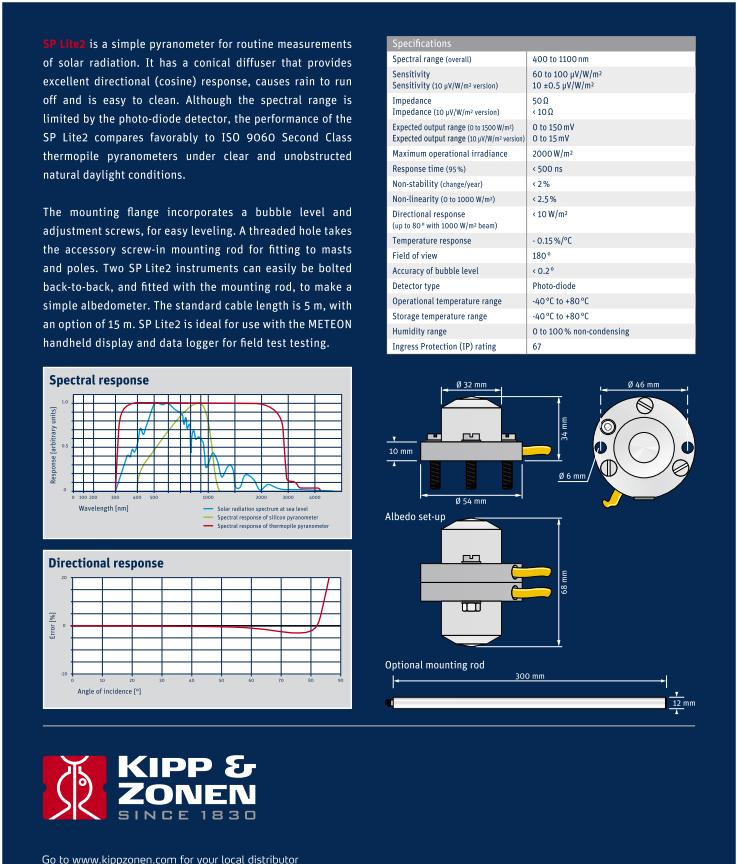
25 Fig.3.9 Temperature deviation between the reference thermometer (T ref ) and the first set of thermcouples (TC1 to TC6) after the calibration Pyranometer, wind and air velocity sensors A pyranometer type SP lite2 (see appendix IV) is used to measure the solar irradiance. The spectral range of the pyranometer is 400 nm to 1100 nm with a sensitivity of 73.7 μv/wm -2 and the total output signal ranges between 0 to 150 mv corresponding to irradiance between 0 and 1500 W/m 2. Figure 3.10 shows a picture of the pyranometer. The response time of this instrument is better than 0.5 s, therefore, a 30 second measurement interval is safely used in the experiment. Fig Right, SP lite2 Silicon pyranometer, Left, The pyranometer mounted on the PVT collector. A Thies CLIMA compact wind speed sensor (see Appendix V) is used to measure the wind velocity during the monitoring time. Fig.3.11 shows the wind speed sensor. The sensor measures a wind speed in the range of 0.5 to 50 m/s. with a corresponding output signal of 0 to 2 V. The output signals of the pyranometer, and wind sensor are directly connected to the data logger. 23
 is used to measure the air velocity just before the fan at distance of 60 cm.")

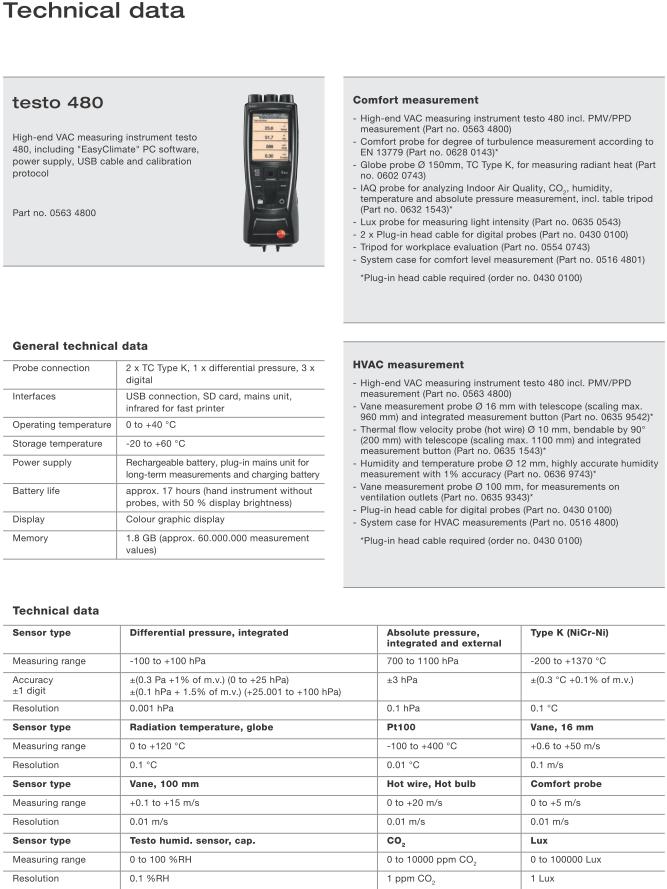
26 Fig Right, Wind speed sensor, Thies CLIMA type, Left, The wind speed sensor mounted on the PVT collector. A Testo 480 air velocity sensor (see Appendix VI) is used to measure the air velocity just before the fan at distance of 60 cm. The sensor with a hot wire probe can measure a velocity between 0 to 20 m/s with a resolution of 0.01 m/s within a temperature range between -20 ᵒC to 70 ᵒC. Fig.3.12 Shows the air velocity sensor. Fig.3.12, Air velocity sensor (right) with its hot wire probe (left) Voltage dividers and shunt resistances The part of the monitoring system related to the electrical measurements consists of two voltage dividers and two shunt resistances, and two AC energy meters. One voltage divider and one shunt resistance (10 A, 60 mv) are used to measure the output voltage and the output current of one PV array, respectively. Fig.3.13 shows a schematic diagram of the one voltage divider, shunt resistance, AC energy meter with one data logger, connected together with one PV array. Each voltage divider consists of two resistances R 1, R 2 with a tolerance of 5 % of its nominal value. The output voltages of the dividers V r1 and V r2 (V r as seen in Fig.3.13) are measured across R 2 for each divider and sent directly to the data logger. The values of R 1, R 2 are chosen to have voltage values V r1 and V r2 less than 2.5 V and divider currents I d1 and I d2 (I d as seen in Fig.3.13) less than 1 ma which are the maximum voltage and current values allowed by the data loggers. Table.1 presents the measured values for (R 1, R 2 ) and the calculated values of (V r1, V r2 ) and (I d1, I d2 ) for the maximum output voltage and current of each PV array. 24
27 Fig A schematic diagram of one voltage divider including (R 1,R 2 ), and shunt resistance R s, AC energy meter, and the data logger. Table.1 Summary of the calculated values of the voltage divider resistances, R 1, R 2, and the corresponding voltages and currents (V r1, V r2 ) and (I d1, I d2 ) besides to the shunt resistance voltages (V s1, V s2 ). Configuration Max voltage V pv,max Max current I pv,max PV array V 6.2 A PV array V 4.7 A Component R 1 (kω) R 2 (kω) V r, max (V) I d, max (ma) Voltage divider Voltage divider Component V S, max (mv) Shunt resistance voltage 1 38 Shunt resistance voltage 2 29 It is worthy to point out that V pv, max, and I pv, max, for each PV array, were calculated at 25 ᵒC and under solar irradiance of 1000 W/m 2. The resistance R 1 =467 kω was formed of 10 resistance of 46.7 kω for each. The resistance R 2 =665 kω was formed of 10 resistance of 66.5 kω for each. Using 10 resistances of small values instead of using one of big value was done to ensure low self-heating effect for each resistance. The values (V r1, max, V r2, max ) are calculated by the following relation: R R R ) V, i 1, 2 Vr, max, i 2, i ( 1 2 i pv, max, i Equ. 3.1 The previous equation was also used to calculate V pv of the corresponding PV array. The values (I d, max1, I d, max2 ) are calculated by the following relation: V ( R R2), i 1, 2 Id, max, i pv,max, i 1 i Equ. 3.2 The current of the PV array can be obtained from the shunt resistance by the following relation: I pv, i V s, i Rs, i, i 1, 2 Equ. 3.3 The previous equation was also used to calculate I pv current for each PV array. 25

28 Fig.3.14 shows a picture of the monitoring system connected to the inverters, the power distribution, and the junction boxes. Fig.3.14 a picture of the monitoring system connected to the inverters, junction boxes, and the power distribution box. Table.2 Main properties of the components used in the monitoring system. Table.2 Summary of the main properties of the components used in the monitoring system. Input Output Component Type accuracy sensitivity range range Pyranometer SP lite mv < 2.5 % 73.7 V/Wm W/m 2-2 Compact wind speed sensor Air speed velocity Thies CLIMA Model.No: m/s mv Testo m/s 0-20 m/s ± 3% measured value ± 5 % Measured value Thermocouple T-type ᵒC ᵒC 0.2 ᵒC Data logger EdgeBoxV mv mv 0.03 % of full scale < 1 m/s < 0.1 m/s Low pass filters It had been observed that the values of voltage dividers were slightly fluctuating, and the shunt resistance voltages V s were highly fluctuating around an average value which extremely affected the recorded values of V s. It is believed that the main raison of this fluctuation is the AC electrical interference at 50 Hz caused by the inverters. To minimize this fluctuation as much as possible, well shielded cables are used to connect the output voltages (V r1,v r2 ) of the voltage dividers and the shunt resistance voltages (V s1,v s2 ) to the data logger, and 4 RC low pass filters are used to filter the 4 signals (V r1,v r2, V s1,v s2 ) at the entrance of the data loggers. It is important to say these data loggers have no internal 26
 of RC low pass filter (Heinz Schmidt-Walter, 2007) is given by: 1 (2 R C) Equ. 3.4 f c Where R is the resistance and C is the capacitance of the filter.")
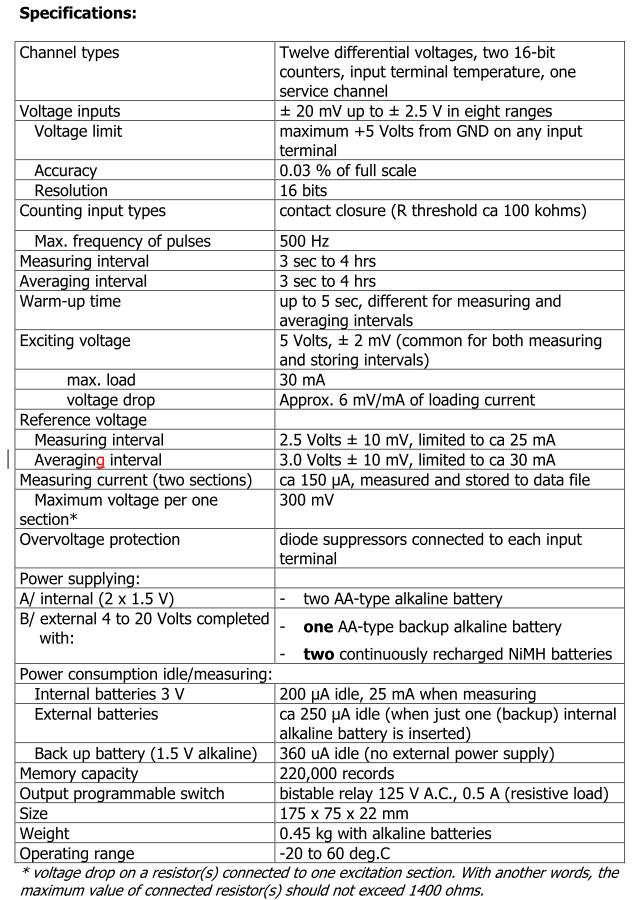
29 filters. Fig.3.15 shows the schematic diagram of RC low pass and its frequency response. The cut-off frequency (resonance frequency) of RC low pass filter (Heinz Schmidt-Walter, 2007) is given by: 1 (2 R C) Equ. 3.4 f c Where R is the resistance and C is the capacitance of the filter. The transfer function (Heinz Schmidt-Walter, 2007) of the filter is given by: V out X c Z Vin Equ. 3.5 Where X c 1 (2 f C), is the capacitor impedance, and impedance of the filter. Z R 2 2 X c is the total Fig.3.15 RC low pass filter (a), and its transfer function (b), Heinz Schmidt-Walter, p197, (2007). For R, C calculation, it is needed to suppose a value of C (or R) and calculate the R (or C) value to get f c of 50 Hz. There will be many solutions of R, C values but it is needed to choose the R, C values which lead to the desired attenuation factor (as small as possible). Table.3 presents the chosen values of R, C and the attenuation factor ( V / V ) of the AC signal at 50 Hz. Table.3 R, C values of the filter and the attenuation factor. f R (MΩ) C (nf) V out /V in After using the RC filters, a good stabilization level is achieved. Here, the output voltages of the dividers (V r1, V r2 ) are affected by total impedance of the filter and a conversion factor (C V =V r /V r, V r is the measured value with the filter connected) is measured to be C V =0.84 for each divider Data acquisition Three data loggers were used. Twelve thermocouples corresponding to (2T L, 2T M, 2T H, 2T F, 2T D, T r, T amb ) were connected to the first data logger (Fig.3.13). The wind speed sensor, pyranometer voltage signals, the inlet and outlet air thermocouples were connected to the second data logger (Fig.3.13). The output voltages of the dividers and shunt resistance voltages were connected to the third data logger (Fig.3.13). It has been observed a disturbance in the readings of the thermocouples or other sensors when these sensors had been connected to the data logger of the voltage dividers and shunt signals. That is why the voltage dividers outputs were connected separately to one data logger. The AC energy meters of inverters were connected to the count channels of the third data logger. The channels of each data logger were programmed by using a PC to specify the signal type for each channel and the measurement range. The measurement time and the averaging time had been set before starting the experiment. The experiments operated for more than two weeks continuously. The PV array voltages, PV currents, temperature of modules, temperature of inlet and outlet, wind speed and solar irradiation of sunlight were measured each 30 second and summed up to an average value of 5 minutes. 27 out in
30 4 Data analysis and results This chapter describes the thermal and electrical analysis based on the experimental data obtained on 13 th of May 2015, which was chosen due to the high performance and stable weather related to that day. The data analysis model including is based on the theoretical model described in Bambrook et al., (2012). 4.1 Data analysis For the thermal analysis, the thermal power and thermal efficiency are calculated for each measurement point. The thermal power P th in (W) is calculated by Equ.4.1: P th. m c ( T T ) Equ. 4.1 p out Where, m. is the air mass flow in (kg/s), c p is the specific heat capacity of air in (J/kg K), T out is the outlet air temperature and T amb is the inlet air temperature in (K). The thermal efficiency η th is calculated by Equ.4.2: Pth th Equ. 4.2 Ac G Where A c is the collector area in m 2, G is the solar irradiance in (W/m 2 ). The thermal efficiency for the whole day can be calculated by: amb Pthdt th day Equ. 4.3 A Gdt c For the electrical analysis, the electrical power, and the electrical efficiency are calculated based on the AC energy measured at the output of each inverter. The electrical power P el in (W) is given by: Ec Peldt Equ. 4.4 Where, E c is the AC energy in (Wh). The electrical efficiency η el is calculated by: Pel el Equ. 4.5 Ac G The electrical efficiency η el-day for the whole day can be calculated by: Peldt el day Equ. 4.6 A Gdt The total efficiency η tot of the PVT air collector is given by: tot th c el Equ

 and G variation for 13 th of May 2015, with cooling.")
31 4.2 Results Thermal performance For thermal performance, parameters like inlet and outlet air temperatures, temperature of PV panel at different locations, are very significant. The meteorological conditions such as ambient temperature, wind speed and solar irradiance play a major role in the obtained thermal power. Fig.4.1 shows T in, T out, T amb and the solar irradiance G as a function of time over the whole day (13 May 2015) when the fan was on. Fig.4.1 Temperature profiles of (T in, T out, T amb ) and G variation for 13 th of May 2015, with cooling. The above figure shows the potential performance of the PVT air collector, because it presents how much the collector can increase the air temperature compared to the ambient temperature. T out temperature reaches its maximum of 38 ᵒC which is higher than T amb temperature by 23 ᵒC, while T in temperature reaches its maximum of 32 ᵒC which is higher than T amb by 16 ᵒC, when G gets its maximum of 650 W/m 2. From Fig. 4.1 it can be seen that, the maximum solar irradiance occurs around 3:00 pm and the fluctuation of G was due to the clouds in the sky. It is important to mention that the measured wind speed was less than 1.5 m/s during the test day as shows in Fig.4.2, therefore the cooling effect by wind can be neglected to certain extend. Fig.4.2 Wind speed variations for 13 th of May. 29
32 Fig.4.3 shows the PV air collector temperature T coll as a function of the solar irradiance over the whole day (13 th May 2015) when the fan was on. T col value is calculated as T col = (T in +T out )/2. The collector temperature follows the solar irradiance and the maximum temperature of 35 ᵒC was attained corresponding to maximum solar irradiance on 13 th of May. The collector temperature is linearly proportional to the irradiance, and it increases by 4.4 ᵒC for every 100 W/m 2, increment of G with cooling case. Fig.4.3. Collector temperature T col as function of solar irradiance G with cooling (13 th of May 2015). Fig.4.4 (a, b) shows the temperatures profile of T H, T M, T L, T D, T F, T amb related to PV column number 3 (Fig.3.4, Fig.3.6). The T D temperature can give an idea about the effectiveness of heat transfer from the PV modules to the air in the duct. The front temperature T F of the column was recorded at the middle part of the column. The T F temperature can help to calculate the heat losses from the front glass of the PV modules to the ambient. The ambient temperature was plotted at the bottom of the figure. All temperature profiles had the same tendency, and they increased from the lower part to the higher part as expected. The temperatures T D (in green), T F (in rose) deviated from each other over the whole day due to the heat transfer from the front surface caused by the wind. Fig.4.4 Temperatures profile (T H, T M, and T L ) of the back of column (3) at different locations (a), besides to T D, T F, T amb (b) for 13 th of May, with cooling. 30
33 Fig.4.5 shows the temperatures profile of T L and T H of column 3 and column 10 (See Fig.3.3). The temperature profiles of column 3 match very well the temperatures profile of column 10 at the specific locations, which indicates that both columns are exposed to the same volume flow rate leading to homogenous air distribution at least for these two columns. Fig.4.5 Comparison of temperature profiles (T H, T L ) of column (3) and column (10) for 13 th of May 2015, with cooling. Fig.4.6 show the temperature difference ΔT= T out T amb as function of G. ΔT has approximately a linear trend and it increases by 2.8 ᵒC for each increment of G of 100 W/m 2. Fig.4.6 ΔT as function of G for 13 th of May
34 Fig.4.7 illustrates the thermal power P th, calculated by Equ.4.1, together with G over the whole day 13 th of May. The thermal power follows G variations over time, and reaches a maximum value of 1400 W, when G gets its maximum (650 W/m 2 ) at 3:15 pm. In calculation of P th, the air mass flow of kg/s (corresponds to air velocity of 6.65 m/s), provided by the fan, is considered, which corresponds to PVT air mass flow of kg/s m 2. In fact, the PVT air mass flow is frequently used to compare the thermal performance of different PVT air collectors, and it is equal to the ratio of air mass flow to the collector area (A c =32 m 2 ). The thermal energy output of the collector over the whole day is 6.88 kwh th /day. From Fig. 4.7, it can be seen that the thermal power follows the solar irradiance with a delay in time due to the large thermal capacity of the collector. After 16:30 and due to the shading effect, the measured G value is different from the real G value incident on the PV panel which leads to appearing that the thermal power didn t follow the plotted solar irradiance. Fig.4.7 Thermal power P th and solar radiation variations G for 13 th of May 2015 with cooling. P th is calculated for air mass flow of kg/s. It is worthy to notify that the air velocity sensor measures air velocity of 1.92 m/s, when the fan is operated at maximum speed of 187 m 3 /h (This fan speed can give an air velocity of 6.65 m/s). The measured air speed of 1.92 corresponds to air mass flow of kg/s, which is less than the maximum value (0.063 kg/s) by a factor of 3.5, and hence the thermal power can be less by the same factor. The real air mass flow value was not confirmed and the error in calculation of the thermal power can be more than 100 % due to the fact that the thermal power is proportional to the air mass flow. Fig.4.8 illustrates the thermal efficiency η th, calculated by Equ.4.2, together with G over the whole day (13 th of May). The thermal efficiency fluctuates slightly around 8 % from 11:30 to 16:30. The values of thermal efficiency after 16:30 is not displayed due to the fact that the real G values are different from the measured ones due the big shading effect after that time. 32

35 Fig.4.8 Thermal efficiency η th and solar radiation variations G for 13 th of May, with cooling Electrical performance Fig.4.9 shows the electrical power P el1, P el2 generated by the PV array 1 and PV array 2, respectively on 13 th of May The solar irradiance is plotted together with the electrical power. P el1, P el2 are proportional to G values over the whole test day. The P el1 values reach a maximum of 1450 W, and P el2 values reach a maximum of 1600 W, when G approaches its maximum around 3:00 pm. After 3:00 pm, P el1 decreases faster than P el2 ; because of PV array 1 was exposed to shading effect more than PV array 2 as it is expected. The AC electrical energy E AC1 (at the output of inverter 1), produced by PV array 1, is 5.75 kwh el /day, and the AC energy E AC2 (at the output of inverter 2), produced by PV array 2, is 7.71 kwh el /day for the test day. Fig.4.9 Electrical power P el and solar radiation variations G over the whole day (13 th of May) with cooling. P el1 (blue circles) is the electrical power of PV array 1, P el2 (red triangle) is the electrical power of PV array 2. G is presented in black solid line. For the same amount of G, the PV array 1 should produce less AC electrical energy by a factor of RMN (ratio of modules number in array 1 to modules number in array 2 =16/18=0.89) compared to PV array 2, because the PV array 1 contains 16 modules, while PV array 2 contains 18 modules. From PV array 1, it is supposed to get (7.71*0.89=6.86 kwh el /day, to consider RMN factor), but due to shading effect 1.11 kwh el /day was lost, 33
36 and this loss presents 16 % of E AC1. The total AC energy produced by the PV arrays is (E AC1 + E AC2 =13.46 kwh el /day) for total solar insolation of 2.73 kwh/m 2 day. Fig.4.10 shows the electrical efficiencies η el1, η el2 (on 13 th of May 2015) of PV array 1 and PV array 2, respectively, they match each other before 5:00 pm, and they fluctuate slightly around 14 % between 9:00 and 5:00 pm (collector temperature is less than 25 ᵒC before noon, and higher than 25 ᵒC afternoon, See Fig.4.3). After 5:00 pm and due to shading effect, η el1 appears to drop rapidly but this is not real. In fact, the measured G values, used in Equ.4.5 to calculate the efficiency, were higher than the real G values incident on the PV array 1 which justifies the drop in η el1. The same problem of shading effect makes the η el1 appears to increase rapidly but this is due to having measured G values smaller than the real G values incident on the PV array 2. Fig.4.10 Electrical efficiency η el and solar radiation variations G for 13 th of May, with cooling. η el1 (blue circles) is the electrical efficiency of PV array 1, and η el2 (red triangles) is the electrical efficiency of PV array 2. G is presented in black solid line. The electrical efficiency of this type of PV modules is rated to be 12 % at STC (Standard Test Conditions, G=1000 W/m 2, and T=25 ᵒC). The calculated η el is the electrical efficiency for the whole PV system including the inverter efficiency (95 %). The η el should fluctuates slightly around the rated value of 12 %, but the calculated η el value was around 14 % and this difference is caused by the errors in measuring G on each PV array, due to the shading effect, and the clouds. However, the obtained η el is not so far from the theoretical values and it can be enhanced by more accurate measuring of G by using several pyranometers at different locations of the PV panel. To summary the results: The PVT air collector investigated in this current work has an area of (A c =32 m 2 ), and air mass flow of kg/s m 2. The nominal output power of the collector is 4 kwp pv (34 CIGS modules with 115 Wp pv for each module). The collector produces thermal output energy of 6.88 kw th /day (0.21 kw th /m 2 day) and an electrical output energy of kwh el /day (0.42 kwh el /m 2 day) with cooling case. The PVT air collector has a daily thermal energy yield of 1.72 kwh th /kwp pv, and a daily PV electrical energy yield of 3.36 kwh el /kwp pv. The fan energy requirement in this case was 0.18 kwh/day which is very small compared to the electrical energy generated by the PV collector. 34
37 5 Discussion and conclusions In this chapter, evaluating of the obtained results and comparing them with that reported in the literature are done. Suggestion of the future development to achieve better results is given. 5.1 Results analysis Indeed, the low thermal efficiency (8 %) of the collector is due to use very small PVT air mass flow of kg/s m 2. Bambrook et al. (2012) studied the effect of air mass flow rate on the instantaneous electrical and thermal efficiencies, and the results are displayed in Fig The thermal efficiency increases with air mass flow rate until reaching a saturated value between 50 to 60 % at PVT air mass flow of 0.1 kg/s m 2. However, increasing the air mass flow will increase the thermal efficiency but it will decrease the T out temperature at the same time, which causes a risk of getting T out below the desired value. In the work of Bambrook et al. (2012), they operated their system at PVT air mass flow of kg/s m 2 and they got a maximum thermal efficiency of 40 % (Red circle in Fig.4.12) at noon, when G got its maximum. The obtained thermal efficiency (8 %, blue circle in Fig.4.12) in the current work agrees well with the experimental thermal efficiency curve in Fig kg/s m kg/s m 2 Fig.4.12 Effect of air mass flow rate on the instantaneous electrical and thermal efficiency values (17 th of July 2010 at 12:00, provided by Bambrook et al. (2012)). Red circle corresponds to the operating point of the reference; Blue circle corresponds to the operating point of the current work. A comparison between the results obtained in this work to those obtained by the Bambrook et al. (2012), indicates that the performance of the PVT air system under test has less performance in term of area normalized energy. The normalized thermal energy in this work is 0.21 kwh th /m 2 day, which is less than that obtained by Bambrook et al. (2012) by a factor of [(2.41/0.21) x (115/165) x (2.73/5.75)=3.6)]. The value (2.41/0.21) is the ratio of normalized thermal energies, the value (115/165) is the ratio of the PV module powers in W p, and the value (2.73/5.75) is the ratio of solar insolation per day. Bold values are concerning the work of Bambrook et al. (2012). The low thermal performance is due to using very small PVT air mass flow rate of kg/s m 2. To enhance the thermal performance of the collector under test, the air mass flow can be increased to kg/s m 2. Then, thermal efficiency can be increased from 8 % to 40 % (See Fig.4.12), and the normalized thermal energy can be improved approximately by a factor of (40/8=5). The electrical performance can also be slightly enhanced by increasing the air mass flow as well. To get the increment in air mass flow from kg/s m 2 to 0.05 kg/s m 2, the required air 35
38 mass flow is 1.76 kg/s. The required fan (with diameter of 0.1 m) should has an air volume rate of 5224 m 3 /h instead of the used one with 187 m 3 /h of air volume flow ate and diameter of 0.1 m. If the tube diameter of the required fan chosen to be 0.2 m instead of 0.1 m, then the air volume rate should be less by a factor 4 to be (5224/4= 1306 m 3 /h) according to the relation [Air mass flow (kg/s)= air density (kg/m 3 ) x air velocity (m/s) x area of fan tube (m 2 )]. The electrical power consumption will be increased as well but it will be interesting to compare the fan energy consumption to the thermal and electrical energy gain due to the cooling. The strategy of cooling control in this work was based on switching the fan on, when the difference between the air duct temperature (under the top of PV column) and the room temperature becomes higher than 5 C. This strategy was effective in term of avoiding high electrical energy consumption by the fan, and it is recommended for further development. The temperature difference of 5 C is the minimum value to compensate the heat losses in the air duct and distribution duct. At the end of this section, it is important to point out the weakness of the obtained results as follows: - The interference of the inverters on the data loggers affects the accuracy of the measured data. - The wind speed sensor measurement was doubtful. It was expected that the real wind speed was higher than the measured one. This issue should be confirmed by a calibrated sensor. The cooling by the wind should be carefully considered as the collector is unglazed, and then the wind speed is needed to be measured accurately. - The fan was providing only two different air velocities, which limits the choice of the correct air velocity. - The air velocity sensor measurement was doubtful. It needs to measure the air velocity by another calibrated sensor. - Using one pyranometer instead of several pyranometers affects the measured G values due to the shading effect. 5.2 Future development: The voltages and currents of the PV arrays can be monitored by voltage transducers to avoid the interference effect of the inverters on the data loggers which helps to obtain more reliable data. Mounting a variable speed fan providing wide range of air velocity, according the controlled voltage of the fan, is highly recommended to test the effect of the air velocity on the whole performance. The PV collector can be splitted into two independent collectors, the first one contains PV array 1 which is subjected to cooling effect and the second one contains PV array 2 which is not subjected to cooling. This step can help to measure the electrical energy with and without cooling and compare the gained electrical energy due to cooling to the consumed energy by the fan. Finally, a thermal camera is highly suggested to measure the front temperature of different PV modules which give an indication about the homogeneity of air distribution under the PV modules. 36
39 References AMERY, M., ABDOLIZADEH, M., (2009). Improving the effectiveness of a photovoltaic water pumping system by spraying water over the front of photovoltaic cells. Renewable Energy 34, ARIF HASAN, M., SUMATHY, K., (2010). Photovoltaic thermal module concepts and their performance analysis: A review. Renewable and Sustainable Energy Reviews 14, BAMBROOK, S.M., SPROUL A.B., (2012). Maximizing the energy output of a PVT air system. Solar Energy 86, BROGREN, M., KARLSSON, B., (2001). Low-concentrating water-cooled PV thermal hybrid systems for high latitudes, 17th EUPVSEC, BRINKWORTH, B.J, (2006). Optimum depth for PV cooling ducts. Solar Energy 80, ). CHEN, Y., ATHIENITIS, A.K., GALAL, K., (2010). Modeling, design and thermal performance of a BIPV/T system thermally coupled with a ventilated concrete slab in a low energy solar house: Part 1, BIPV/T system and house energy concept. Solar Energy, (Corrected Proof). CHEN, C. JULIAN, (2011). Book, Physics of Solar Energy. Hoboken, NJ, USA: John Wiley & Sons. CANDANEDO, L., ATHIENITIS, A.K., CANDANEDO, J., O BRIEN, W., CHEN, Y., (2010). Transient and steady state models for open-loop air-based BIPV/T systems. ASHRAE Transactions. CHOW, (2010). A review on photovoltaic/thermal hybrid solar technology. Applied Energy 87, FARSHCHIMONFARED, M., BILBAO, J.I, SPROUL, A.B, (2015). Channel depth, air mass flow rate and air distribution duct diameter optimization of photovoltaic thermal (PV/T) air collectors linked to residential buildings. Renewable Energy 76, HEGAZY, A.A., (2000). Comparative study of the performances of four Photovoltaic/thermal solar air collectors. Energy Conversion and Management 41 (8), HEGAZY, A.A., (2000). Thermoelectric numerical modeling and experimental testing of a modular building integrated photovoltaic cogeneration system. PhD thesis. UNSW. HEINZ SCHMIDT-WALTER, AND KORIES RALF, (2007). Electrical engineering: A Pocket reference. Norwood, MA02062, USA: Artech House, HÄBERLIN, HEINRICH, (2012). Book: Photovoltaics system design and practice. Hoboken, NJ, USA, John Wiley & Sons. KRAUTER, (2004). Increased electrical yield via water flow over the front of photovoltaic panels. Solar Energy Mater. Solar Cells 82, MEI, L., INfiELD, D.G., GOTTSCHALG, R., LOVEDAY, D.L., DAVIES, D., BERRY, M., (2009). Equilibrium thermal characteristics of a building integrated photovoltaic tiled roof. Solar Energy 83 (10), NATALE ARCURI, FRANCESCO REDA, MARILENA DE SIMONE, (2014). Energy and thermo-fluid-dynamics evaluations of photovoltaic panels cooled by water and air. Solar Energy
40 RAMOS, FIGUEIREDO, (2010). Hybrid photovoltaic-thermal Collectors: A Review. Emerging trends in technological innovation Book Series: IFIP Advances in information and communication technology volume: 314 Pages: SKOPLAKI, E., PALYVOS, J.A., (2009). On the temperature dependence of photovoltaic module electrical performance. A review of efficiency and power correlations. Sol Energy 83: TONUI, J.K., TRIPANAGNOSTOPOULOS, Y., (2007). Improved PV/T solar collectors with heat extraction by forced or natural air circulation. Renewable Energy 32, TRIPANAGNOSTOPOULOS, Y., NOUSIA, T.H., SOULIOTIS,M., YIANOULIS, P., (2002). Hybrid photovoltaic/thermal solar systems. Sol Energy;72 (3): ZONDAG, H.A., DE VRIES, D.W., VAN HELDEN, W.G.J., VAN ZOLINGEN, R.J.C., VAN STEENHOVEN, A.A., (2003). The yield of different combined PV-thermal collector designs. Solar Energy, 74(3):

41 Appendices Appendix I: PV Solibro modules data sheet. 39
42 40

43 Appendix II: Inverters datasheet. 41
44 42

45 Appendix III: Data logger s data sheet. 43
46 44

47 Appendix IV: Pyranometer s data sheet. 45
48 46

49 Appendix V: Wind speed sensor s datasheet. 47
50 48

51 Appendix VI: Air velocity sensor s datasheet. 49
52 50
Electrical/thermal performance of hybrid PV/T system in Sharjah, UAE
 International Journal of Smart Grid and Clean Energy Electrical/thermal performance of hybrid PV/T system in Sharjah, UAE Amna A. Alzaabi a, Nadine K. Badawiyeh a, Hind O. Hantoush a, A. K. Hamid b* a
Solar Flat Plate Thermal Collector
 Solar Flat Plate Thermal Collector 1 OBJECTIVE: Performance Study of Solar Flat Plate Thermal Collector Operation with Variation in Mass Flow Rate and Level of Radiation INTRODUCTION: Solar water heater
A Systematic Literature Review of Photovoltaic Thermal Systems: Investigating Demand-Side Determinants of PV/T Performance.
 Proceedings of 3rd Conference: People and Buildings held at Westminster University, School of Architecture and the Built Environment, London, UK, 20th September 2013. Network for Comfort and Energy Use
Study of Performance of Solar Photovoltaic Thermal Collector at Different Temperatures
 International Journal of Scientific and Research Publications, Volume 5, Issue 11, November 2015 266 Study of Performance of Solar Photovoltaic Thermal Collector at Different Temperatures Mahesh Khatiwada
PERFORMANCE OF A SINGLE PASS AIR BASE PHOTOVOLTAIC/THERMAL SOLAR COLLECTOR WITH AND WITHOUT HEXAGONAL HONEYCOMB HEAT EXCHANGER
 PERFORMANCE OF A SINGLE PASS AIR BASE PHOTOVOLTAIC/THERMAL SOLAR COLLECTOR WITH AND WITHOUT HEXAGONAL HONEYCOMB HEAT EXCHANGER F. Hussain Z.Anuar S. Khairuddin National Metrology Laboratory, SIRIM Berhad,
EXPERIMENTAL DEVELOPMENT TO DETERMINE TIME CONSTANT FOR POLYMER COLLECTOR
 EXPERIMENTAL DEVELOPMENT TO DETERMINE TIME CONSTANT FOR POLYMER COLLECTOR M. A. M. Rosli 1,2, S. Mat 2, K. Sopian 2, E. Salleh 2 and M. K. A. Sharif 3 1 Green and Efficient Energy Technology, Research
Figure 1: Uncovered and covered PVT collectors
 Low energy cooling of buildings with radiative cooling using hybrid PVT collectors Ursula Eicker, Antoine Dalibard, Simon Büttgenbach, Sebastian Fiedler, Jan Cremers University of Applied Sciences HFT
The Potential and Challenges of Solar Boosted Heat Pumps for Domestic Hot Water Heating
 The Potential and Challenges of Solar Boosted Heat Pumps for Domestic Hot Water Heating Stephen Harrison Ph.D., P. Eng., Solar Calorimetry, Dept. of Mechanical and Materials Engineering, Queen s University,
Performance Evaluation of an Integrated Hybrid Photovoltaic/Thermal (PV/T) Greenhouse
 Greenhouse") 12 EAAS & ARF. All rights reserved Performance Evaluation of an Integrated Hybrid Photovoltaic/Thermal (PV/T) Greenhouse Shahana Parveen 1, Dr. Qamar Parvez Rana 2 Jamia Hamdard, India Shahanaparveen_amu@gmail.com
12 EAAS & ARF. All rights reserved Performance Evaluation of an Integrated Hybrid Photovoltaic/Thermal (PV/T) Greenhouse Shahana Parveen 1, Dr. Qamar Parvez Rana 2 Jamia Hamdard, India Shahanaparveen_amu@gmail.com
DEVELOPMENT OF A SOLAR COLLECTOR/SOLAR WATER HEATING SYSTEM TEST CENTER IN IRAN
 DEVELOPMENT OF A SOLAR COLLECTOR/SOLAR WATER HEATING SYSTEM TEST CENTER IN IRAN Farzad Jafarkazemi 1, Hossein Abdi 1, Arash Asadzadeh Zargar 1 and Abdollah Hassani 1 1 Solar Energy Research Group, Islamic
Available online at ScienceDirect. Energy Procedia 91 (2016 ) 20 26
 20 26") Available online at www.sciencedirect.com ScienceDirect Energy Procedia 91 (2016 ) 20 26 SHC 2015, International Conference on Solar Heating and Cooling for Buildings and Industry Evaluating the thermal
Available online at www.sciencedirect.com ScienceDirect Energy Procedia 91 (2016 ) 20 26 SHC 2015, International Conference on Solar Heating and Cooling for Buildings and Industry Evaluating the thermal
AGENDA. I. Photovoltaics Basics: What is really going on in a Solar Cell?
 AGENDA I. Photovoltaics: Semiconductor Basics II. Grid Connected Photovoltaic Systems III. Instantaneous and Average Power in the Wind IV. Extracting Energy from the Wind I. Photovoltaics Basics: What
The Potential and Challenges of Solar Boosted Heat Pumps for Domestic Hot Water Heating
 The Potential and Challenges of Solar Boosted Heat Pumps for Domestic Hot Water Heating Stephen Harrison Ph.D., P. Eng., Solar Calorimetry, Dept. of Mechanical and Materials Engineering, Queen s University,
Basics of Solar Photovoltaics. Photovoltaics (PV) Lecture-21
 Lecture-21") Lecture-21 Basics of Solar Photovoltaics Photovoltaics (PV) Photovoltaics (PV) comprise the technology to convert sunlight directly into electricity. The term photo means light and voltaic, electricity.
Lecture-21 Basics of Solar Photovoltaics Photovoltaics (PV) Photovoltaics (PV) comprise the technology to convert sunlight directly into electricity. The term photo means light and voltaic, electricity.
Experimental investigation of photovoltaic-thermal hybrid solar collector
 Agronomy Research Biosystem Engineering Special Issue 1, 7-34, 01 Experimental investigation of photovoltaic-thermal hybrid solar collector V. Zagorska, I. Ziemelis, L. Kancevica and H. Putans Latvia University
PV+THERMAL SYSTEMS Design and performance aspects for building integration Yiannis TRIPANAGNOSTOPOULOS
 PV+THERMAL SYSTEMS Design and performance aspects for building integration Yiannis TRIPANAGNOSTOPOULOS Assoc. Professor in Physics Department University of Patras, Greece Tel: +30 2610 997472, e-mail:
Green Star Photovoltaic Modelling Guidelines
 Green Star Photovoltaic Modelling Guidelines September 2013 Contents Contents... 2 Change Log... 2 Introduction... 3 How to use this document... 3 Reporting guidelines... 4 System information... 4 Site
Sustainable Building Façade and Advanced Fenestration Systems
 Workshop on Potential Technological Developments for Zero Carbon Buildings 16-17 Oct 2013 Sustainable Building Façade and Advanced Fenestration Systems Tin-Tai Chow Building Energy & Environmental Technology
Performance of a Solar Heating System with Photovoltaic Thermal Hybrid Collectors and Heat Pump
 Performance of a Solar Heating System with Photovoltaic Thermal Hybrid Collectors and Heat Pump Mark Dannemand, Technical University of Denmark, Department of Civil Engineering, Denmark Simon Furbo, Technical
Numerical Study on the Characteristics of a Specially Designed Rectangular Tube Absorber Photovoltaic Thermal Collector (PVT)
") Numerical Study on the Characteristics of a Specially Designed Rectangular Tube Absorber Photovoltaic Thermal Collector (PVT) Ali Najah Al-Shamani 1,2*, Sohif Mat 1, M. H. Ruslan 1, Azher M. Abed 1, K.
Numerical Study on the Characteristics of a Specially Designed Rectangular Tube Absorber Photovoltaic Thermal Collector (PVT) Ali Najah Al-Shamani 1,2*, Sohif Mat 1, M. H. Ruslan 1, Azher M. Abed 1, K.
BASIC EUROPEAN GLAZED COLLECTORS & SOLAR DOMESTIC
 ISO 98061 ISO 98O62 ISO 9459-2 BASIC EUROPEAN AND INTERNATIONAL STANDARDS ON SOLAR THERMAL GLAZED COLLECTORS & SOLAR DOMESTIC HOT WATER SYSTEMS A brief review addressed to: Manufacturers, Retailers, Promoters,
Building Applied and Back Insulated Photovoltaic Modules: Thermal Models. Jaewon Oh
 Building Applied and Back Insulated Photovoltaic Modules: Thermal Models by Jaewon Oh A Thesis Presented in Partial Fulfillment of the Requirements for the Degree Master of Science in Technology Approved
Solar Energy Technologies
 1 Solar Energy Technologies ME 430 Queen s University The Solar Energy Resource Varies over day and year, (i.e., intermittent) Generally non-dispatchable Ottawa average for year ~4 kwh/m 2 per day e.g.,
Performance evaluation of hybrid solar parabolic trough concentrator systems in Hong Kong
 Performance evaluation of hybrid solar parabolic trough concentrator systems in Hong Kong Huey Pang* 1, Edward W.C. Lo 1, TS Chung 1 and Josie Close 2 * 1 Department of Electrical Engineering, The Hong
Experimental Studies on Water based Photovoltaic Thermal Collector (PVT)
") Experimental Studies on Water based Photovoltaic Thermal Collector (PVT) ADNAN IBRAHIM*, MOHD YUSOF OTHMAN, MOHD HAFIDZ RUSLAN, SOHIF MAT, AZAMI ZAHARIM AND KAMARUZZAMAN SOPIAN Solar Energy Research Institute,
Experimental Studies on Water based Photovoltaic Thermal Collector (PVT) ADNAN IBRAHIM*, MOHD YUSOF OTHMAN, MOHD HAFIDZ RUSLAN, SOHIF MAT, AZAMI ZAHARIM AND KAMARUZZAMAN SOPIAN Solar Energy Research Institute,
ASSESSMENT AND DESIGN OF ROOFTOP SOLAR PV SYSTEM. Click to begin
 ASSESSMENT AND DESIGN OF ROOFTOP SOLAR PV SYSTEM Click to begin TOPICS Solar Energy Systems Types of solar energy systems Solar Energy Terminologies Solar PV system Types of Solar PV systems Solar PV System
SOLAR COOLING: STATE OF THE ART, TECHNICAL ANALYSIS AND FIRSTS APPLICATIONS
 SOLAR COOLING: STATE OF THE ART, TECHNICAL ANALYSIS AND FIRSTS APPLICATIONS F. Asdrubali, G. Baldinelli, A. Presciutti, M. Caporali University of Perugia - Industrial Engineering Department, Via G. Duranti
THERMAL AND ELECTRICAL PERFORMANCES OF A NEW KIND AIR COOLED PHOTOVOLTAIC THERMAL SYSTEM FOR BUILDING APPLICATION
 THERMAL AND ELECTRICAL PERFORMANCES OF A NEW KIND AIR COOLED PHOTOVOLTAIC THERMAL SYSTEM FOR BUILDING APPLICATION R.S. Adhikari, F. Butera, P. Caputo, P. Oliaro and N. Aste Department of Building Environment
MEASUREMENTS AND BENCHMARK OF PV-T COLLECTORS ACCORDING TO EN12975 AND DEVELOPMENT OF A STANDARDIZED MEASUREMENT PROCEDURE
 MEASUREMENTS AND BENCHMARK OF PV-T COLLECTORS ACCORDING TO EN12975 AND DEVELOPMENT OF A STANDARDIZED MEASUREMENT PROCEDURE P.Hofmann 1, P. Dupeyrat 1,2*, K.Kramer 1, M.Hermann 1 and G. Stryi-Hipp 1 1 Fraunhofer
THEORETICAL ANALYSIS AND MATHEMATICAL MODELLING OF PARABOLIC TROUGH CONCENTRATING PHOTOVOLTAIC THERMAL SYSTEM
 THEORETICAL ANALYSIS AND MATHEMATICAL MODELLING OF PARABOLIC TROUGH CONCENTRATING PHOTOVOLTAIC THERMAL SYSTEM Sankaranarayanan V ABSTRACT The electricity and heat produced simultaneously in a photovoltaic
A Solar Wall System Utilized in Rural Houses of Northeast China
 A Solar Wall System Utilized in Rural Houses of Northeast China Tiantian Zhang and Yufei Tan in rural buildings, for instance, only 16.4% of the investigated houses employ solar energy to produce hot water
WATER BASED PHOTOVOLTAIC THERMAL (PVT) COLLECTOR WITH SPIRAL FLOW ABSORBER: AN ENERGY AND EXERGY EVALUATION
 COLLECTOR WITH SPIRAL FLOW ABSORBER: AN ENERGY AND EXERGY EVALUATION") Equatorial Journal of Engineering (2018) 51-58 Journal Homepage: www.erjournals.com ISSN: 0184-7937 WATER BASED PHOTOVOLTAIC THERMAL (PVT) COLLECTOR WITH SPIRAL FLOW ABSORBER: AN ENERGY AND EXERGY EVALUATION
Equatorial Journal of Engineering (2018) 51-58 Journal Homepage: www.erjournals.com ISSN: 0184-7937 WATER BASED PHOTOVOLTAIC THERMAL (PVT) COLLECTOR WITH SPIRAL FLOW ABSORBER: AN ENERGY AND EXERGY EVALUATION
BUILDING INTEGRATION OF RENEWABLE ENERGY SYSTEMS TOWARDS ZERO OR NEARLY ZERO ENERGY BUILDINGS
 BUILDING INTEGRATION OF RENEWABLE ENERGY SYSTEMS TOWARDS ZERO OR NEARLY ZERO ENERGY BUILDINGS S. A. Kalogirou Department of Mechanical Engineering and Materials Science and Engineering, Cyprus University
Computer Modelling and Experimental Validation of a Photovoltaic Thermal (PV/T) Water Based Collector System
 Water Based Collector System") 2012 2nd International Conference on Power and Energy Systems (ICPES 2012) IPCSIT vol. 56 (2012) (2012) IACSIT Press, Singapore DOI: 10.7763/IPCSIT.2012.V56.14 Computer Modelling and Experimental Validation
2012 2nd International Conference on Power and Energy Systems (ICPES 2012) IPCSIT vol. 56 (2012) (2012) IACSIT Press, Singapore DOI: 10.7763/IPCSIT.2012.V56.14 Computer Modelling and Experimental Validation
SKALA ARCHITECTS PANELS
 SKALA ARCHITECTS PANELS APPLICATIONS AND TECHNICAL SPECIFICATIONS ENGLISH THE AVANCIS ARCHITECTS PANEL SKALA The AVANCIS SKALA solar panel is the architectural PV module series designed as a premium component
EELE408 Photovoltaics Lecture 18 Photovoltaic Arrays & Modules
 EELE08 Photovoltaics Lecture 18 Photovoltaic Arrays & Modules Dr. Todd J. Kaiser tjkaiser@ece.montana.edu Department of Electrical and Computer Engineering Montana State University - Bozeman Photovoltaic
Case Study of Performance of Hybrid Solar Photovoltaic- Thermal Water Heating System in Sokoto, Nigeria
 IOSR Journal of Applied Physics (IOSR-JAP) e-issn: 2278-4861.Volume 7, Issue 3 Ver. II (May. - Jun. 2015), PP 101-107 www.iosrjournals.org Case Study of Performance of Hybrid Solar Photovoltaic- Thermal
Solar Power. Technical Aspects and Environmental Impacts. 6 th March 2011 Sustainable Energy Options (UAU212F) - University of Iceland
 - University of Iceland") Solar Power Technical Aspects and Environmental Impacts 1 Solar Power 1. Introduction 2. Passive Solar Energy utilization 3. Solar Thermal Heat Utilization 4. Solar thermal power plants 5. Photovoltaic
Solar Power Technical Aspects and Environmental Impacts 1 Solar Power 1. Introduction 2. Passive Solar Energy utilization 3. Solar Thermal Heat Utilization 4. Solar thermal power plants 5. Photovoltaic
ANALYSIS AND MITIGATION OF THERMAL EFFECTS ON A LARGE FACADE-MOUNTED PV ARRAY
 ANALYSIS AND MITIGATION OF THERMAL EFFECTS ON A LARGE FACADE-MOUNTED PV ARRAY A. Driesse 1, S. J. Harrison 2, Q. Lin 2 1 Queen's University, Integrated Learning Center, Kingston, ON, Canada; 2 Queen's
Technical Talk on HK s Largest Solar Power System at Lamma Power Station
 15 June 2011 Technical Talk on HK s Largest Solar Power System at Lamma Power Station for HKIE EV Division by C.K. Lau Agenda Fundamentals of PV Project Background Feasibility Study and Site Selection
SOLAR MODULES FOR ROOFTOP SYSTEMS AND SOLAR PARKS ENGLISH
 SOLAR MODULES FOR ROOFTOP SYSTEMS AND SOLAR PARKS ENGLISH CIS PREMIUM CLASS PHOTOVOLTAICS Our product brand PowerMax represents CIS modules designed and made in Germany to fulfill not only the highest
COMPARISON STUDY OF AIR-BASED PHOTOVOLTAIC/THERMAL (PV/T) COLLECTOR WITH DIFFERENT DESIGNS OF HEAT EXCHANGER
 COLLECTOR WITH DIFFERENT DESIGNS OF HEAT EXCHANGER") COMPARISON STUDY OF AIR-BASED PHOTOVOLTAIC/THERMAL (PV/T) COLLECTOR WITH DIFFERENT DESIGNS OF HEAT EXCHANGER F. Hussain Z.Anuar S. Khairuddin National Metrology Laboratory, SIRIM Berhad, 43900 Sepang,
COMPARISON STUDY OF AIR-BASED PHOTOVOLTAIC/THERMAL (PV/T) COLLECTOR WITH DIFFERENT DESIGNS OF HEAT EXCHANGER F. Hussain Z.Anuar S. Khairuddin National Metrology Laboratory, SIRIM Berhad, 43900 Sepang,
Feasibility study of a roof top Solar room heater
 Feasibility study of a roof top Solar room heater Tejinder Kumar Jindal Assistant Professor Aerospace Engineering Department PEC University of Technology Chandigarh Abstract: The present work describes
SOME PRELIMINARY RESULTS OF A BUILDING INTEGRATED PHOTOVOLTAIC (BIPV) SYSTEM INSTALLED AT YASAR UNIVERSITY, IZMIR, TURKEY
 SYSTEM INSTALLED AT YASAR UNIVERSITY, IZMIR, TURKEY") SOME PRELIMINARY RESULTS OF A BUILDING INTEGRATED PHOTOVOLTAIC (BIPV) SYSTEM INSTALLED AT YASAR UNIVERSITY, IZMIR, TURKEY Arif Hepbasli Yasar Unıversıty, Turkey Emrah Biyik Yasar Unıversıty, Turkey Mustafa
SOME PRELIMINARY RESULTS OF A BUILDING INTEGRATED PHOTOVOLTAIC (BIPV) SYSTEM INSTALLED AT YASAR UNIVERSITY, IZMIR, TURKEY Arif Hepbasli Yasar Unıversıty, Turkey Emrah Biyik Yasar Unıversıty, Turkey Mustafa
Hybrid solution for photovoltaic and photothermal conversion
 European Association for the Development of Renewable Energies, Environment and Power Quality (EA4EPQ) International Conference on Renewable Energies and Power Quality (ICREPQ 12) Santiago de Compostela
Digging Deeper SOLAR ENERGY. Forms of Solar Energy
 a) Is the wind speed the same in the morning; the afternoon; the evening? b) Move your anemometer to another location. Is it windier in other places? c) Do trees or buildings block the wind? 7. Back in
Solar Water Heater with Rotating Reflectors and Light Dependent Resistor (LDR)
") International OPEN ACCESS Journal Of Modern Engineering Research (IJMER) Solar Water Heater with Rotating Reflectors and Light Dependent Resistor (LDR) Harshil Sinha 1, Deepesh Yadav 2 1,2 B. tech, Mechanical
International OPEN ACCESS Journal Of Modern Engineering Research (IJMER) Solar Water Heater with Rotating Reflectors and Light Dependent Resistor (LDR) Harshil Sinha 1, Deepesh Yadav 2 1,2 B. tech, Mechanical
Investigating the Shading Impact of Rail on the Energy Output of a PV System in Hong Kong
 Investigating the Shading Impact of Rail on the Energy Output of a PV System in Hong Kong Jinqing Peng a, b, Lin Lu b,*, Hongxing Yang b, Tao Ma b, KM HO c, Peter Law c a College of Civil Engineering,
Grid-Tied PV System with Energy Optimization
 International Journal of Engineering Works Kambohwell Publisher Enterprises Vol. 4, Issue 10, PP. 184-189, October 2017 www.kwpublisher.com Grid-Tied PV System with Energy Optimization Maryam Shahjehan,
This is an electronic reprint of the original article. This reprint may differ from the original in pagination and typographic detail.
 This is an electronic reprint of the original article. This reprint may differ from the original in pagination and typographic detail. Author(s): Agar, David; Korppi-Tommola, Jouko Title: Standard testing
SOLAR ENGINEERING OF THERMAL PROCESSES
 SOLAR ENGINEERING OF THERMAL PROCESSES Second Edition JOHN A. DUFFIE Emeritus Professor of Chemical Engineering WILLIAM A. BECKMAN Professor of Mechanical Engineering Solar Energy Laboratory University
The Novel Solar Water Heating by Means of Thermoelectric Modules
 International Journal of Renewable Energy, Vol. 3, No. 2, July 2008 The Novel Solar Water Heating by Means of Thermoelectric Modules Somchai Maneewan a*, Sirinuch Chindaruksa a and Jompob Waewsak b a Physics
Fabrication and Computational Analysis of a Building Integrated Photovoltaic Thermal Roofing Panel
 Fabrication and Computational Analysis of a Building Integrated Photovoltaic Thermal Roofing Panel Viswath Satheesh, Devanand C N Dept. of Mechanical Engineering, Model Engineering College, Thrikkakkara
SIZING, POSITIONING AND AIR DUCTING ANALYSIS FOR SOLAR-BASED CAR VENTILATOR
 SIZING, POSITIONING AND AIR DUCTING ANALYSIS FOR SOLAR-BASED CAR VENTILATOR Rosmiwati Mohd-Mokhtar and Asirah Roslan School of Electrical & Electronic Engineering, Universiti Sains Malaysia, Engineering
THERMAL ANALYSIS OF A FACADE-MOUNTED PV ARRAY
 SESCI 23 CONFERENCE Queen's University Kingston, Ontario, Canada August 18 to 2, 23 THERMAL ANALYSIS OF A FACADE-MOUNTED PV ARRAY S. J. Harrison 1, A. Driesse 2, Q. Lin 1 1 Queen's University, Solar Calorimetry
Thermal Analysis of Solar Flat Plate Collector
 Thermal Analysis of Solar Flat Plate Collector # Yakoob Kolipak,Associate Professor, ME Dept, E-mail:yakoob.cjits @gmail.com # Kranthi Kumar Guduru,Assistant Professor,ME Dept, E-mail: kranthicjits1@gmail.com
Research Article Comparison of Electrical and Thermal Performances of Glazed and Unglazed PVT Collectors
 Photoenergy Volume 212, Article ID 957847, 7 pages doi:1.1155/212/957847 Research Article Comparison of Electrical and Thermal Performances of and PVT Collectors Jin-Hee Kim 1 and Jun-Tae Kim 2 1 Green
Improvement of Photovoltaic Panel Efficiency using Nanofluid
 Int. J. of Thermal & Environmental Engineering Volume 14, No. 2 (2017) 143-151 Improvement of Photovoltaic Panel Efficiency using Nanofluid M. A. Hamdan *, K. K. Kardasi The University of Jordan, Amman,
Research Article Experimental Study of Thermal Performance of One-Ended Evacuated Tubes for Producing Hot Air
 Solar Energy Volume 213, Article ID 524715, 6 pages http://dx.doi.org/1.1155/213/524715 Research Article Experimental Study of Thermal Performance of One-Ended Evacuated Tubes for Producing Hot Air Ashish
Performance Study of Solar Air Heater with Baffled Duct
 IOSR Journal of Mechanical and Civil Engineering (IOSR-JMCE) ISSN: 2278-1684 Volume 4, Issue 5 (Nov - Dec 2012), PP 52-56 Performance Study of Solar Air Heater with Baffled Duct BK Maheshwari 1, Rajendra
Performance of a Single Pass Air Base Photovoltaic/Thermal Solar Collector with and without Hexagonal Honeycomb Heat Exchanger
 Performance of a Single Pass Air Base Photovoltaic/Thermal Solar Collector with and without Hexagonal Honeycomb Heat Exchanger By: Faridah Hussain Senior Metrologist Background Problem to be solved: Major
AR No. # - Solar Thermal
 AR No. # - Solar Thermal Recommendation We recommend installing a solar thermal array on the building roof. This will provide an alternative source for 10% of the facilities energy consumption and reduce
Performance Testing of A Parabolic Trough Collector Array
 Performance Testing of A Parabolic Trough Collector Array İbrahim Halil Yılmaz *, Hakan Hayta, Recep Yumrutaş, Mehmet Sait Söylemez Department of Mechanical Engineering University of Gaziantep, 27310 Gaziantep,
Energy Efficient Solar Milk Chiller
 Energy Efficient Solar Milk Chiller Muneeb Bin Muzzamal Abstract: Life stock is the major sector of agriculture which is of great importance for Pakistan. It has a major contribution towards the economy
Temperature Dependences on Various Types of Photovoltaic (PV) Panel
 Panel") IOP Conference Series: Materials Science and Engineering PAPER OPEN ACCESS Temperature Dependences on Various Types of Photovoltaic (PV) Panel Recent citations - Zahratul Laily Edaris et al To cite this
IOP Conference Series: Materials Science and Engineering PAPER OPEN ACCESS Temperature Dependences on Various Types of Photovoltaic (PV) Panel Recent citations - Zahratul Laily Edaris et al To cite this
Evaluation of efficiency and collector time constant of a solar flat plate collector
 Evaluation of efficiency and collector time constant of a solar flat plate collector Abhijit Devaraj 1, Abhishek Hiremath 2, Akshay R Patil 3, Krushik B N 4 Department of Mechanical Engineering, BMS College
Draft proposals for Test methods for close-coupled solar water heating systems - Reliability and safety
 IEA/SHC Task 57, Subtask B Draft proposals for new test procedures B4: Final Draft Draft proposals for Test methods for close-coupled solar water heating systems - Reliability and safety HE Zinian Beijing
Performance assessment of various BIPV concepts
 Performance assessment of various BIPV concepts Wiep Folkerts, Roland Valckenborg, Menno van den Donker, Corry de Keizer, Chris Tzikas, Minne de Jong and Kostas Sinapis SEAC Eindhoven, The Netherlands,
International Journal of Mechanical Civil and Control Engineering. Vol. 1, Issue. 3, June 2015 ISSN (Online):
:") Evaluation of efficiency and collector time constant of a solar flat plate collector at various intensities of light and constant wind speed by using forced mode circulation of water Abhijit Devaraj 1
Evaluation of efficiency and collector time constant of a solar flat plate collector at various intensities of light and constant wind speed by using forced mode circulation of water Abhijit Devaraj 1
WATER COOLING OF PHOTOVOLTAIC PANELS FROM PASSIVE HOUSE LOCATED INSIDE THE UNIVERSITY POLITEHNICA OF BUCHAREST
 U.P.B. Sci. Bull., Series C, Vol. 75, Iss. 3, 2013 ISSN 2286-3540 WATER COOLING OF PHOTOVOLTAIC PANELS FROM PASSIVE HOUSE LOCATED INSIDE THE UNIVERSITY POLITEHNICA OF BUCHAREST Ana-Maria CROITORU 1, Adrian
X-RAY Contents lists available at
 ISSN 1115-7976 X-RAY Contents lists available at Journal of Association of Radiographers of Nigeria Journal homepage: www.jarn-xray.org X-RAYS Vol. 21 The Effects of Solar Panel Temperature on the Power
Basic technical information on solar PV
 Basic technical information on solar PV Agenda 1. Solar Thermal Systems 2. How Does Solar PV Work? 3. What are the Main Components of a PV System? 4. What are the Solar PV Mounting Options? Types of Solar
PHOTOVOLTAICS HISTORY OF PHOTOVOLTAICS
 DEPARTMENT OF PLANNING AND NATURAL RESOURCES VIRGIN ISLANDS ENERGY OFFICE 45 ESTATE MARS HILL FREDERIKSTED, VIRGIN ISLANDS 00840 TELEPHONE 340 773-1082 STX * FAX 340 772-0063 340 774-3320 STT * FAX 340
Development and Validation of Flat-Plate Collector Testing Procedures
 Development and Validation of Flat-Plate Collector Testing Procedures Report for September October, 2006 Focus on Energy (FOE) supports solar thermal systems that displace conventional fuels by offering
Basic technical information on solar PV
 Basic technical information on solar PV Agenda 1. Solar Thermal Systems 2. How Does Solar PV Work? 3. What are the Main Components of a PV System? 4. What are the Solar PV Mounting Options? Types of Solar
Design, Fabrication and Experimental Study of a Novel Loopheat-pipe based Solar Thermal Facade Water Heating System
 Available online at www.sciencedirect.com ScienceDirect Energy Procedia 75 ( 2015 ) 566 571 The 7 th International Conference on Applied Energy ICAE2015 Design, Fabrication and Experimental Study of a
NTT DOCOMO Technical Journal. Design and Evaluation of Thermal-photovoltaic Hybrid Power Generation Module for More Efficient Use of Solar Energy
 Photovoltaic Power Generation Light Concentration Technology Combined Heat and Power Design and Evaluation of Thermal-photovoltaic Hybrid Power Generation Module for More Efficient Use of Solar Energy
Basic technical information on solar PV. Welcome and introduction.
 Basic technical information on solar PV Welcome and introduction. 1 Agenda 1. Solar Thermal Systems 2. How Does Solar PV Work? 3. What are the Main Components of a PV System? 4. What are the Solar PV Mounting
Hybrid Photovoltaic Thermal (PV/T) Air and Water Based Solar Collectors Suitable for Building Integrated Applications
 Air and Water Based Solar Collectors Suitable for Building Integrated Applications") American Journal of Environmental Sciences 5 (5): 618-624, 2009 ISSN 1553-345X 2009 Science Publications Hybrid Photovoltaic Thermal (PV/T) Air and Water Based Solar Collectors Suitable for Building Integrated
American Journal of Environmental Sciences 5 (5): 618-624, 2009 ISSN 1553-345X 2009 Science Publications Hybrid Photovoltaic Thermal (PV/T) Air and Water Based Solar Collectors Suitable for Building Integrated
Exergy analysis of a flat plate solar collector
 Exergy analysis of a flat plate solar collector Sunil Chamoli GRDIMT Dehradun, Uttarakhand, India Abstract In this study, exergetic performance analysis of flat plate solar collector has been carried out
COMPARATIVE STUDIES ON THERMAL EFFICIENCY OF SINGLE AND DOUBLE GLAZED FLAT PLATE SOLAR WATER HEATER
 COMPARATIVE STUDIES ON THERMAL EFFICIENCY OF SINGLE AND DOUBLE GLAZED FLAT PLATE SOLAR WATER HEATER J. Manikandan and B. Sivaraman Department of Mechanical Engineering, Annamalai University, Chidambaram,
Modeling and analyzing solar cooling systems in Polysun
 Modeling and analyzing solar cooling systems in Polysun Seyed H. Rezaei (seyed.rezaei@velasolaris.com) 1 Andreas Witzig (andreas.witzig@velasolaris.com) 1 Michael Pfeiffer (michael.pfeiffer@velasolaris.com)
Effect of Cooling on Solar Panel Performance
 International Proceedings of Chemical, Biological and Environmental Engineering, V0l. 100 (2017) DOI: 10.7763/IPCBEE. 2017. V100. 18 Effect of Cooling on Solar Panel Performance Rehan Ali and Serdar Celik
Performance enhancement of a photovoltaic thermal (PVT) and ground-source heat pump system
 and ground-source heat pump system") Performance enhancement of a photovoltaic thermal (PVT) and ground-source heat pump system Mohammad Abu-Rumman*, Mohammad Hamdana, Osama Ayadi Mechanical Engineering Department, The University of Jordan,
Performance enhancement of a photovoltaic thermal (PVT) and ground-source heat pump system Mohammad Abu-Rumman*, Mohammad Hamdana, Osama Ayadi Mechanical Engineering Department, The University of Jordan,
Photovoltaic Module Performance Analysis of Aluminum and Zinc Thin Metal Sheet Attached With Direct Current Brushless Fans Cooling System
 Photovoltaic Module Performance Analysis of Aluminum and Zinc Thin Metal Sheet Attached With Direct Current Brushless Fans Cooling System M.Irwanto 1,2, W.Z.Leow 2, Y.M.Irwan,3, A.R.Amelia 2 and I.Safwati
Monitoring of 20 kwp photovoltaic system
 Monitoring of 20 kwp photovoltaic system Milan Belik ABSTRACT The document describes influence of basic meteorological value to proposition of photovoltaic arrays. Results from 3 years long measurements
Performance analysis of PV panel under varying surface temperature
 Performance analysis of PV panel under varying surface temperature Tripathi Abhishek Kumar 1, Murthy Ch. S. N 1 and Aruna Mangalpady 1 1 Department of Mining Engineering, National Institute of Technology
Available online at ScienceDirect. Procedia Engineering 121 (2015 )
") Available online at www.sciencedirect.com ScienceDirect Procedia Engineering 121 (2015 ) 1413 1419 9th International Symposium on Heating, Ventilation and Air Conditioning (ISHVAC) and the 3rd International
Available online at www.sciencedirect.com ScienceDirect Procedia Engineering 121 (2015 ) 1413 1419 9th International Symposium on Heating, Ventilation and Air Conditioning (ISHVAC) and the 3rd International
Chapter 7. Passive Solar Contents
 Chapter 7. Passive Solar Contents 7.1 Introduction 7.2 Types of Passive Solar Systems 7.3 Advantages and Disadvantages 7.4 General Design Principles 7.5 Design Information for Direct System 7.6 Design
FIRST LARGE-SCALE SOLAR SEASONAL BOREHOLE THERMAL ENERGY STORAGE IN CANADA
 FIRST LARGE-SCALE SOLAR SEASONAL BOREHOLE THERMAL ENERGY STORAGE IN CANADA W.P. Wong, J.L. McClung Science Applications International Corporation (SAIC Canada) Ottawa, ON Canada Tel: 1-613-563-7242 bill.wong@saiccanada.com
PV PERFORMANCE IMPROVEMENT BY APPLYING DIFFUSE REFLECTORS
 PV PERFORMANCE IMPROVEMENT BY APPLYING DIFFUSE REFLECTORS University of Patras, Physics Dept, Patra 26500, Greece Meltiani Belekoukia Physicist Dimitra Sygkridou Electrical & Computer Engineer Innovation
SOLTRAIN II SOLAR WATER HEATING SYSTEM TEST AND DEMONSTRATION FACILITY
 SASEC2015 Third Southern African Solar Energy Conference 11 13 May 2015 Kruger National Park, South Africa SOLTRAIN II SOLAR WATER HEATING SYSTEM TEST AND DEMONSTRATION FACILITY Silinga C.* *Author for
ARCHITECTS PANELS APPLICATIONS AND TECHNICAL SPECIFICATIONS ENGLISH
 ARCHITECTS PANELS APPLICATIONS AND TECHNICAL SPECIFICATIONS ENGLISH SKALA THE AVANCIS ARCHITECTS PANEL The AVANCIS SKALA solar panel is the architectural PV module series designed as a premium component
Research Article Performance Analysis of a Photovoltaic-Thermal Integrated System
 Photoenergy Volume 2009, Article ID 732093, 6 pages doi:10.1155/2009/732093 Research Article Performance Analysis of a Photovoltaic-Thermal Integrated System Ewa Radziemska Chemical Faculty, Gdansk University
Performance Analysis of Glazed Liquid Photovoltaic-thermal Collector with Use of Detail Model
 Performance Analysis of Glazed Liquid Photovoltaic-thermal Collector with Use of Detail Model Nikola Pokorny 1,2, Tomas Matuska 1,2 1 CTU in Prague, Faculty of Mechanical Engineering, Department of Environmental
Photovoltaic Fundamentals, Technology and Practice Dr. Mohamed Fawzy Aboud Sustainable Energy Technologies center (SET)
") Photovoltaic Fundamentals, Technology and Practice Dr. Mohamed Fawzy Aboud Sustainable Energy Technologies center (SET) The Greenhouse Effect 270 ppm carbon dioxide (CO 2 ) in the atmosphere absorbs outgoing
Photovoltaic Fundamentals, Technology and Practice Dr. Mohamed Fawzy Aboud Sustainable Energy Technologies center (SET) The Greenhouse Effect 270 ppm carbon dioxide (CO 2 ) in the atmosphere absorbs outgoing
EFFICIENT SOLAR COOLING
 EFFICIENT SOLAR COOLING Heather Poiry Kevin Balkoski Lun Jiang Roland Winston University of California, Merced 4200 N.Lake Rd, Merced CA 95348 heatherpoiry@gmail.com kbalkoski@gmail.com ljiang2@ucmerced.edu