August 22, 2014 FIRE ISLAND WIND
|
|
|
- Amelia Rice
- 6 years ago
- Views:
Transcription


1 August 22, 2014 FIRE ISLAND WIND


2 Phase 1 Summary: Performance Project Performance: Benefits realized: 93,500 MWh LTD >875,000 MCF of NG burn avoided ~$6.5 MM in NG purchases avoided 55,000 tons of CO2 not emitted Total production 2013: 49,531 MWh vs. 51,180 budget Turbine Availability 98.5% - including planned maintenance outages Need photo here
3 Month MWh 2013 MWh 8,000 Fire Island Phase Production MWh 60,000 7,000 50,000 6,000 5,000 40,000 4,000 30,000 3,000 20,000 2,000 1,000 10,000 0 January February March April May June July August September October November December Actual Budget Cum. Actual Cum. Budget 0 Description Actual Budget Variance Production 49,530 51,180 (3.2)%


4 Actual curtailment vs. Expected CEA Curtailment of 25% 63% less curtailment than CEA anticipated Actual Expected DGE Actual 4,780 MWh 2013 Expected DGE 12,795 MWh
5 Phase 1 Summary: Energy Produced as Expected Integration Successful Curtailment well below expectations Impact on CEA frequency and reliability has been acceptable CEA Q status report to the RCA: "Chugach is not aware of any electrical system operational issues as a result of Chugach receiving energy from the Project. CEA April 2013 Final RCA Report: Chugach's generation and transmission assets have not experienced any negative impacts as a result of energy generated by the Project, and Chugach is not aware of any such impacts on the generation or transmission assets of any interconnected Railbelt utility. Construction and Operation of Phase 1 is a Success
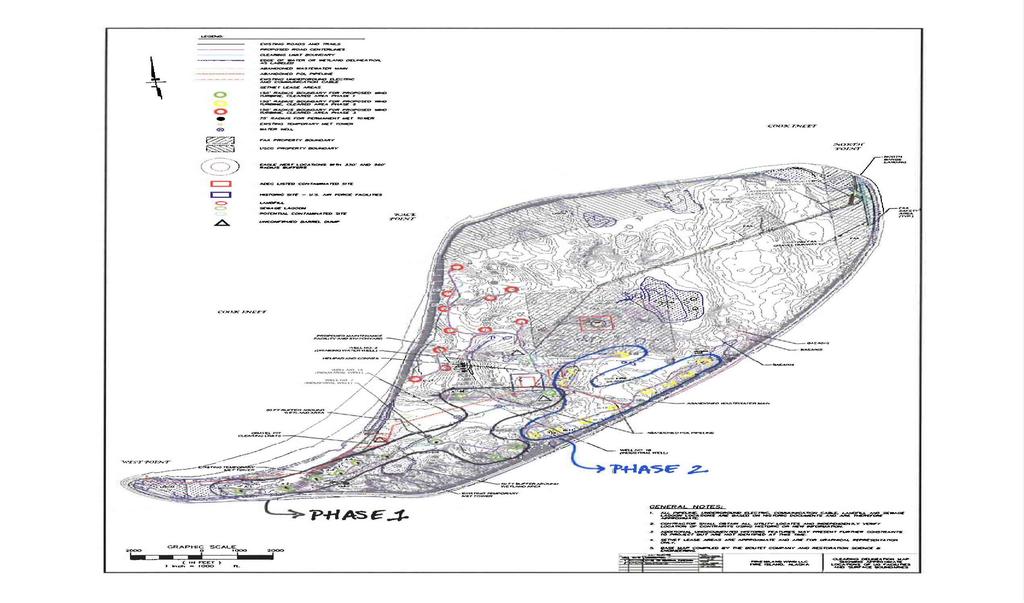
6 Fire Island Wind Project Proposed Phase 2
7 Fire Island Wind, Phase MW project B String flanks the east ridgeline of island 11 General Electric 1.85 MW XLE wind turbines 29.7% Net Capacity Factor (NCF) P50 = 52,900 MWh Simplified transmission interconnection Shovel-ready project All material permits in-hand
8 Combined Production Phase 1 and Phase 2 14,000 12,000 Fire Island Wind Project Monthly Combined Production MWh 6,242 5,740 10,000 4,904 5,142 4,655 4,735 5,359 8,000 4,063 6,000 4,000 5,555 4,746 4,977 3,932 4,506 3,243 3,185 3,139 3,082 2,211 3,423 3,313 4,582 5,187 6,042 2,000 2,140 - Jan Feb Mar Apr May Jun Jul Aug Sep Oct Nov Dec MWh P50 - Phase I MWh P50 - Phase II
9 Phase 2 Project Timeline ASAP Oct Dec Negotiate PPA Approval of PPA by RCA Construction RFP TSA contract Construction contract Close Financing NTP for contractors May start construction September completion September commissioning October - COD Time is of the essence! Qualified for 30% ITC worth ~ $40/MWh on Price
10 So, Why Hasn t The Project Moved Forward??? Buyer Needed Economic Hurdle Operational Hurdle Overcoming the Status Quo
11 Advantages of Expansion Overcoming the Economics Reduced capital requirement for Phase 2: Utilizes existing roads Switchgear O & M Facility Project Labor and Equipment Optimize Transmission Assets Much simpler contracting: PPA template previously approved by RCA Revise Interconnection Turbine supply Financing Much Lower Pricing

12 Phase 2 Project Energy Expect 52,900 MWh/year Price Phase 1: $0.0970/kWh for 25 years Phase 2 Price: $.07988/kWh for PPA 25 years $.06270/kWh escalating 25 years Phase 2 price is 18% lower (utilizes significant existing infrastructure)
13 Elements for Phase 2 Success Present Now: Shovel Ready Achievable Schedule Power Off-take: GVEA, CEA, or MEA Pricing is comparable to low depending on buyer Future tax savings uncertain Optimizes state investment in transmission Helps AK comply with EPA Clean Power Plan Moves us closer to State s 50% renewable goal
14 EPA imposes new mandatory rules: : EPA s proposed Clean Power Plan will regulate carbon emissions from existing fossilfueled power plants using the agency s authority under the Clean Air Act Overall goal of power sector - CO2 emission reduction of 30% of 2012 levels by 2030 Draft rules to be finalized in 2015 AKDEC craft approach to cut greenhouse-gas emissions State implementation plans due in RPS, energy efficiency, and/or buy carbon credits
15 FIW Phase 2 Offsets CO2 Emissions - Helps with compliance, EPA rule 111.d CO2 emission offsets will have significant future value one projection is below: Source: The Brattle Group
16 FIW Phase 2 Compares Favorably to Avoided Costs Current average avoided cost along with estimate of incremental avoided power cost in 2016, with and without effect of CO2 offsets. Avoided costs are compared to Phase 2 power plus wheeling.
17 Avg. Cost/MWh Net MWh GVEA Average Cost of Energy by Facility $1, ,000 $1,200 $1, ,000 $1,000 $ ,000 $800 $700 80,000 $600 $500 60,000 $400 $300 40,000 $200 $100 20,000 $0 0 Jun-13 Sep-13 Dec-13 Mar-14 Jun-14 North Pole Net MWh North Pole Exp. Net MWh CEA Net MWh FIW P2 Net MWh Avoided Cost Avg./MWh North Pole Avg. Cost/MWh North Pole Exp. Avg./MWh CEA Avg./MWh FIW P2 Avg./MWh
18 So, Why Doesn t The Project Move Forward??? Buyer Needed Economic Hurdle Operational Hurdle Changing the Status Quo Hurdle
19 Power Integration Typical Electric Utility Daily Load Shape 4 Balancing Areas System Operator: Supply = Demand, At lowest cost Source: U.S. DOE, 20% Wind Energy by 2030 (2008)

20 Megawatts Thermal plus Hydro Plenty of Capacity to Integration of Phase Installed Thermal and Hydro Generation vs. Peak Load by Utility CEA MLP GVEA MEA HEA hydro thermal peak load
21 Megawatts Integration with existing resources: There is capacity available to integrate FIWP Phase 2 2,500 Railbelt Installed Capacity vs. Peak Monthly Load Estimates 2,000 1,500 1,000 1,220 1,110 1, Installed Capacity excludes Units announced for retirement ,030 1,130 1, January February March April May June July August September October November December Railbelt 2016 peak estimate Installed Capacity
22 Integration - CAPACITY Railbelt Generation: Perfect for Integrating Wind 2012: Southcentral Power Plant: 3X1 CC LM : ML&P LM : ML&P Plant 2: 2X1 CC LM GE : MEA: 10 X 17.1 MW Wartsila 18V50DF Bradley Lake Hydro Cooper Lake Eklutna Hydro

23 Wartsila designed for flexibility

24 Source: Wartsila cycling flexibility

25 Integration ENERGY: Railbelt Energy Hydro-electric Natural gas Gas flexibility CINGSA Generous Imbalance allowances with pipelines Wind farm control system parameters Inertia Ramp rate control Curtailment of wind
26 MW wind different from forecast Integration how much gas flex is needed: FIW Phase 2 - MW of Wind Unplanned vs. MMBtu Fuel worst case/24 hour 8,000 HR Short gas imbalance MMBtu/day worst case Long gas imbalance Conservative: assumes no intra-day gas nom changes. Imbalance quantity still acceptable
27 Gas System Flexibility is Proven: Can accommodate unplanned start or shut down of a thermal unit if needed for wind integration Hilcorp tariff provides for significant imbalance Imbalance tolerance will work as the spring to enable unplanned gas burn or storage as needed Will be fully implemented November 1, 2014 Enstar operations 2014: unplanned start or shut down of a Beluga or similar unit is noise would not cause gas system reliability or curtailment issues. Imbalance provision exists today
28 Elements for Phase 2 Success Present Now: Integration Generation Capacity Operational flexibility Future Optimization Expanding Balancing Area Economic dispatch Bi-lateral cross-utility agreements
29 So, Why Doesn t The Project Move Forward??? Buyer Needed Economic Hurdle Operational Hurdle Overcoming the Status Quo


30 Combined Production Fire Island Phase 1 and Phase 2 as compared to Railbelt total sales Where there is a will, there is a way! Phase 2 energy is not a material amount compared to total Railbelt sales. There are ways and means to integrate Phase 2 smoothly. FIW Phase 2 as part of the total Railbelt Railbelt Total Sales FIW Phase 1 FIW Phase 2 Fire Island Wind total phase 1 plus phase 2 is approx. 2% of Railbelt energy. This is a very modest amount of wind compared to other regions of the country. 1% 1% 98%

31 Renewable Integration in Hawaii: Hawaii is an electrically islanded grid, similar to Railbelt. In 2012 renewable energy was 13.7% of statewide total. Source: Hawaii Energy Facts and Figures June 2013 Hawaii State Energy Office


32 Wind Integration in ERCOT: ERCOT is an electrically islanded grid, similar to Railbelt. In 2013 renewable energy was 9.9 % of ERCOT total example day below: Source: ERCOT Grid Operations

33 Wind Integration in ERCOT: ERCOT is a less flexible system than Railbelt no hydro and less natural gas to flex but still able to 10% wind energy. Source: ERCOT Grid Operations May 2014


34 Renewable Integration in BPA: Total wind capacity in BPA system is over 4,500 MW. During last week of July 2014 wind was nearly 1/3 of all generation serving load in BPA. Wind is nearly 30% of load and nearly equal to thermal generation in some periods Source:
35 01/01/14 00:00 01/01/14 04:55 01/01/14 09:50 01/01/14 14:45 01/01/14 19:40 01/02/14 00:35 01/02/14 05:30 01/02/14 10:25 01/02/14 15:20 01/02/14 20:15 01/03/14 01:10 01/03/14 06:05 01/03/14 11:00 01/03/14 15:55 01/03/14 20:50 01/04/14 01:45 01/04/14 06:40 01/04/14 11:35 01/04/14 16:30 01/04/14 21:25 01/05/14 02:20 01/05/14 07:15 01/05/14 12:10 01/05/14 17:05 01/05/14 22:00 01/06/14 02:55 01/06/14 07:50 01/06/14 12:45 01/06/14 17:40 01/06/14 22:35 01/07/14 03:30 01/07/14 08:25 01/07/14 13:20 01/07/14 18:15 01/07/14 23:10 01/08/14 04:05 01/08/14 09:00 01/08/14 13:55 01/08/14 18:50 01/08/14 23:45 01/09/14 04:40 01/09/14 09:35 01/09/14 14:30 01/09/14 19:25 01/10/14 00:20 01/10/14 05:15 01/10/14 10:10 01/10/14 15:05 01/10/14 20:00 Renewable Integration in BPA: Total wind capacity in BPA system is over 4,500 MW. Significant wind integration issues have been dealt with the Railbelt can do this as well! BPA wind generation vs total load January 1 through January 10, 2014 TOTAL WIND GENERATION IN BPA CONTROL AREA (MW) TOTAL BPA CONTROL AREA LOAD (MW) Source:
36 Development Options: Chugach, MEA or GVEA Diversifies supply portfolio Stabilizes prices for consumers Get ahead of the curve on new EPA rules Chugach wheels power in all cases MEA provides regulation to others Lot of daylight between $63 and $115/MWh to pay for integration and wheeling
37 Conclusion & Summary FIW P2 is a small but important project Clean, abundant, and economic Privately funded stimulates the economy Environmental benefits + avoided CO2 emissions penalty Moves toward AK State Energy Goal Much lower price than Phase 1 No significant impediment to successful construction Time to act is now Time is very short ITC value is $40/MWh. PTC is $ 23 $0.00

38 Contact Information Suzanne Gibson Cook Inlet Region, Inc
39 Supporting Information
40


41 System Impacts EPS study results 8/27/10 Assumes larger 33 unit 53 MW project - integration solely by CEA. The addition of the FIWF does not have any effect on the stability of the Railbelt system due to transient disturbances. The transient analysis found no stability issues due to the addition of the FIWF to the Railbelt system. The addition of FIWF capacity to the Railbelt grid did not result in any negative impacts to the Railbelt grid within the scope of this study. Need photo here

42 Wind Farm Power Regulation Final Report 3/4/11 EPS Assumes larger project at 33 units = 53 MW This study was undertaken with the assumption that Chugach would provide all of the regulation required for FIWF in order to meet its control area obligation. Analyzing the wind data indicated that the Chugach thermal generation or its hydro resources have the technical capability of regulating the ramp rates predicted for the wind farm. Although both simple-cycle and combined cycle generation has the capability of providing regulation for the wind resources, the natural gas suppliers and transportation company do not have the ability to deliver resources to match the capability of the generation. No longer true!! Gas system not a constraint

43 Wind Farm Power Regulation Final Report cont d. Conclusions - among other things: The incorporation of the FIWF into the Railbelt system does not present overly difficult technical obstacles or issues. The technical issues can be overcome with revisions to the current utility practice and planning. In the future, the ability to provide accurate, reliable hourly forecasts of wind energy hours in advance could lessen the integration costs and risk associated with the project. The constraining factor does not appear to be the electrical system, but the gas supply and delivery system. No longer true!! Gas system not a constraint


44 Fire Island Wind is Popular with Railbelt Consumers: Over 90% of consumers in Railbelt either support or are indifferent. Over 75% willing to pay more for Fire Island wind power Source: Cracium Research, Inc Fire Island consumer survey update
Wind Update. Renewable Energy Integration Lessons Learned. March 28, 2012
 Wind Update Renewable Energy Integration Lessons Learned March 28, 212 Contents Summary Review of Historical Wind Growth and Output Impact of Wind on Operations Wind Curtailments Dispatchable Intermittent
California Independent System Operator Corporation. California ISO. Import resource adequacy. Department of Market Monitoring
 k California Independent System Operator Corporation California ISO Import resource adequacy September 10, 2018 Department of Market Monitoring Summary This report provides an update of analysis and trends
PGE s 2013 Integrated Resource Plan
 PGE s 2013 Integrated Resource Plan OPUC Public Meeting 2014 Portland General Electric. All rights reserved. Today s topics IRP public process Load-resource balance Assumptions and inputs E3 low-carbon
2011 RFP for All Generation Sources Proposal Conference
 2011 RFP for All Generation Sources Proposal Conference August 16, 2011 Agenda Welcome and introductory remarks Chris Bevil, Manager Resource Acquisition RFP for All Generation Sources ( All Source RFP
4. RAILBELT LOAD FORECASTS
 4. RAILBELT LOAD FORECASTS Much of the generation and transmission infrastructure of the Railbelt region of Alaska is aging and is at or near its time for replacement. The Railbelt is generally defined
Eugene Water & Electric Board. The Future of Utilities in the Pacific Northwest
 Eugene Water & Electric Board The Future of Utilities in the Pacific Northwest 1 Eugene Water & Electric Board The Future of Utilities in the Pacific Northwest Erin Erben Manager, Power & Strategic Planning
Results of California s Renewable Energy Program and Agricultural Biomass to Energy Program (SB704)
") 2 nd Annual California Biomass Collaborative Forum Results of California s Renewable Energy Program and Agricultural Biomass to Energy Program (SB704) Tony Gonçalves Program Lead Existing Renewable Facilities
2 nd Annual California Biomass Collaborative Forum Results of California s Renewable Energy Program and Agricultural Biomass to Energy Program (SB704) Tony Gonçalves Program Lead Existing Renewable Facilities
The Texas Experience: Implications of 8,000+ MW Wind Generation Resources In ERCOT. David Campbell CEO, Luminant 2009 Summer Seminar August 3, 2009
 The Texas Experience: Implications of 8,000+ MW Wind Generation Resources In ERCOT David Campbell CEO, Luminant 2009 Summer Seminar August 3, 2009 Growth of Wind Generation in ERCOT MW 12,000 10,000 8,000
A Bulk Energy Storage Resource Case Study with 40% RPS in 2024
 A Bulk Energy Storage Resource Case Study with 40% RPS in 2024 Shucheng Liu Principal, Market Development 2015-2016 Transmission Planning Process Stakeholder Meeting February 18, 2016 California ISO Public
Leading Insights into Solar
 Leading Insights into Solar Fong Wan Senior Vice President, Energy Procurement Pacific Gas and Electric Company CalSEIA - SolarTech Summit May 7, 2009 Agenda California s Clean Energy History Renewable
The Implications of Lower Natural Gas Prices for the Electric Generation Mix in the Southeast 1
 Highlights May 2009 Short Term Energy Outlook Supplement: The Implications of Lower Natural Gas Prices for the Electric Generation Mix in the Southeast 1 This supplement to the Energy Information Administration
Pathways to Integrate 175 Gigawatts of Renewable Energy into India s Electric Grid
 Greening the Grid Andhra Pradesh Pathways to Integrate 175 Gigawatts of Renewable Energy into India s Electric Grid State-specific results from Volume II, which includes all of India. The full reports
ERCOT Public LTRA Probabilistic Reliability Assessment. Final Report
 ERCOT Public 2016 LTRA Probabilistic Reliability Assessment Final Report November 21, 2016 Contents Summary... 1 Software Model Description... 3 Demand Modeling... 3 Controllable Capacity Demand Response
21,363 MW 22,774 MW ONTARIO ENERGY REPORT Q JULY SEPT 2014 ELECTRICITY. Electricity Highlights Third Quarter Ontario s Power Grid
 ONTARIO ENERGY REPORT Q3 Y T ELECTRICITY Electricity Highlights Third Quarter Electricity Generation Output by Fuel Type (Q3) Nuclear Ontario Peak Demand (Q3) 21,363 MW 25.0 TWh 65.7% Hydro 8.8 TWh 23.1%
PJM ENERGY PRICES 2005 Response to Howard M. Spinner Paper
 PJM ENERGY PRICES 2005 Response to Howard M. Spinner Paper Joseph Bowring PJM Market Monitor Response to Howard M. Spinner Paper Re: PJM Energy Prices 2005 A March 13, 2006 paper ( Spinner paper ) by Howard
General Session. Four Decades of Pursuing a Diversified Energy Portfolio at MIKE KOTARA. Senior Vice President
 General Session Four Decades of Pursuing a Diversified Energy Portfolio at CPS Energy SPEAKER MIKE KOTARA Senior Vice President CPS Energy CPS Energy Background Electric & Gas utility serving the greater
California ISO. Q Report on Market Issues and Performance. February 10, Prepared by: Department of Market Monitoring
 California Independent System Operator Corporation California ISO Q4 2013 Report on Market Issues and Performance February 10, 2014 Prepared by: Department of Market Monitoring Department of Market Monitoring
Renewable energy - the future is now
 University of Nevada, Las Vegas Digital Scholarship@UNLV UNLV Renewable Energy Symposium 2007 UNLV Energy Symposium Aug 15th, 9:00 AM - Jul 15th, 10:00 AM Renewable energy - the future is now Thomas Fair
For Bandon Utilities Commission
 For Bandon Utilities Commission July 12, 2017 Profile BPA, a component of the U.S. Department of Energy, is a non-profit and self-funded power marketing administration in the Pacific Northwest. Congress
Integrated Resource Planning at Tacoma Power. Ahlmahz Negash EE 500E Energy & Environment Seminar University of Washington
 Integrated Resource Planning at Tacoma Power Ahlmahz Negash EE 500E Energy & Environment Seminar University of Washington 11-8-2018 About Tacoma Public Utilities Public, cost-of-service organization; we
PORTFOLIO OPTIMIZATION MODEL FOR ELECTRICITY PURCHASE IN LIBERALIZED ENERGY MARKETS
 PORTFOLIO OPTIMIZATION MODEL FOR ELECTRICITY PURCHASE IN LIBERALIZED ENERGY MARKETS Edwin Castro CNEE Guatemala Viena, september 2009 What is the reason to develop this model? In our own electricity market
The Optimal Approach to Firming Windpower
 5735 Hollister Avenue, Suite B Goleta, California 93117 T 805.683.9659 F 805.683.9671 www.gravitypower.net The Optimal Approach to Firming Windpower Summary As many regions of the world are staging massive
Wind Workshop. Technical Characterization: Dependable Capacity & Firm Energy 10:00-10:30am
 Wind Workshop Technical Characterization: Dependable Capacity & Firm Energy 10:00-10:30am Objective of this session: Understand BC Hydro s definitions and calculation methodology of dependable capacity
Bidding Strategy I Day-Ahead Market 8 th February 2017 I New Delhi
 Bidding Strategy I Day-Ahead Market 8 th February 2017 I New Delhi Rajesh K Mediratta Business Development +91-9654125157 I rajesh.mediratta@iexindia.com 1 For office use In this presentation Type of Market
Wind Generation and Grid Operations: Experience & Perspective
 Wind Generation and Grid Operations: Experience & Perspective Yuri Makarov and David Hawkins California Independent Corporation Folsom, California, USA Participating Intermittent Resources Workshop March
TransCanada Power Market Update January 2018
 Forward Prices Table TransCanada Flat 7x24 ($/MWh) AB - 6x16 On Peak ($/MWh) AB - Off-Peak ($/MWh) AECO Gas ($/GJ) Heat Rate BOM $42. $49.56 $32.76 $1.78 23.6 February $39.75 $46.51 $31.1 $1.69 23.5 218
CCA Pilot Project Update
 CCA Pilot Project Update Santa Barbara, California July 13, 2007 Topics Project Overview Renewable Energy Supply: Highlighting Marin County s Current CCA Initiative Process & Timeline for CCA Implementation
CHAPTER 6 - Load Forecast & Resource Plan
 CHAPTER 6 - Load Forecast & Resource Plan Introduction This Chapter describes the electric resource portfolio that may be acquired to meet the energy requirements of MBCP customers. The following overarching
CCA Pilot Project Update
 CCA Pilot Project Update Petaluma, California October 10, 2007 Topics Project Overview Renewable Energy Supply: Highlighting Marin County s Current CCA Initiative Process & Timeline for CCA Implementation
Hetch Hetchy Integrated Resource Plan Commission Meeting May 23, 2017
 Hetch Hetchy Integrated Resource Plan Commission Meeting May 23, 2017 Today s Presentation 1. Introduction to IRP 2. IRP Applied to Hetch Hetchy Program 3. IRP Approach 4. IRP Results 5. Discussion SFPUC
Agenda. Natural gas and power markets overview. Generation retirements and in developments. Future resource mix including large hydro
 Agenda Natural gas and power markets overview Generation retirements and in developments Future resource mix including large hydro Balancing environmental, reliability and cost impacts 1 Northeast Utilities
Renewables Curtailment in China is there light at the end of the tunnel? Liutong Zhang
 Renewables Curtailment in China is there light at the end of the tunnel? Liutong Zhang Renewable curtailment in China All ready to generate but no place to go RE curtailment in China TWh 100 90 80 70 60
Renewables Review. Operations Committee December 9, 2015
 Renewables Review Operations Committee December 9, 2015 1 Presentation Intro to resource planning Decades review (1990s, 2000s, 2010s) Resource planning Historical perspective Evaluations, engineering
CO2, SO2 and NOX Emission Rates. March 15, 2018
 March 15, 2018 This page is intentionally left blank. PJM 2018 www.pjm.com 1 P age Introduction To support the efforts of regulators, stakeholders, and other interested parties as they work towards achieving
Self-Schedules Bid Cost Recovery Allocation and Lower Bid Floor
 Summary Self-Schedules Bid Cost Recovery Allocation and Lower Bid Floor Draft Final Proposal Comments by Department of Market Monitoring August 23, 2016 The ISO proposal to lower the energy bid floor from
Flexible Resource Adequacy Criteria and Must-Offer Obligation
 Flexible Resource Adequacy Criteria and Must-Offer Obligation February 13, 2014 Karl Meeusen, Ph.D. Market Design and Regulatory Policy Lead Stakeholder Meeting Agenda 2/13/14 Time Topic Presenter 12:30
On the Path to SunShot: Emerging Issues and Challenges in Integrating High Levels of Solar into the Electrical Generation and Transmission System
 On the Path to SunShot: Emerging Issues and Challenges in Integrating High Levels of Solar into the Electrical Generation and Transmission System Paul Denholm, Kara Clark, and Matt O Connell National Renewable
AEP Ohio. Combined Heat and Power (CHP) May 24 th, 2017 Steve Giles Vice President Alternative Energy Hull & Associates, Inc.
 May 24 th, 2017 Steve Giles Vice President Alternative Energy Hull & Associates, Inc.") AEP Ohio Combined Heat and Power (CHP) May 24 th, 2017 Steve Giles Vice President Alternative Energy Hull & Associates, Inc. OUR MARKET AREAS Shale Oil & Gas Waste Management PROJECT DEVELOPMENT AND ASSET
AEP Ohio Combined Heat and Power (CHP) May 24 th, 2017 Steve Giles Vice President Alternative Energy Hull & Associates, Inc. OUR MARKET AREAS Shale Oil & Gas Waste Management PROJECT DEVELOPMENT AND ASSET
PJM Wind Integration Initiatives
 PJM Wind Integration Initiatives West Virginia Wind Forum Davis, WV September 25, 2012 Ken Schuyler Renewable Services PJM Interconnection 1 26% of generation in Eastern Interconnection 28% of load in
ELECTRICITY TRADE AGREEMENT. An Assessment of the Ontario-Quebec Electricity Trade Agreement
 ELECTRICITY TRADE AGREEMENT An Assessment of the Ontario-Quebec Electricity Trade Agreement Spring 2018 About this Document Established by the Financial Accountability Officer Act, 2013, the Financial
Ten Years After Gas & Power in Perspective
 Regional Market Trends Forum Ten Years After Gas & Power in Perspective Richard Levitan, rll@levitan.com May 1, 2014 Agenda 2014 Polar Vortex v. 2004 Cold Snap Northeast Gas & Power 10 Years After Gas
Solar, Wind and Market Power in the New Zealand Electricity Market (and hydro lake dynamics) Mina Bahrami Gholami and Stephen Poletti
 Mina Bahrami Gholami and Stephen Poletti") Solar, Wind and Market Power in the New Zealand Electricity Market (and hydro lake dynamics) Mina Bahrami Gholami and Stephen Poletti University of Auckland Economic Paradox Energy Only Markets. Low-carbon
Solar, Wind and Market Power in the New Zealand Electricity Market (and hydro lake dynamics) Mina Bahrami Gholami and Stephen Poletti University of Auckland Economic Paradox Energy Only Markets. Low-carbon
Solving Climate: The Need for Zero Carbon On-Demand Power
 Solving Climate: The Need for Zero Carbon On-Demand Power Armond Cohen, Executive Director Clean Air Task Force National Coal Council 2016 Annual Spring Meeting April 20, 2016 STABILIZING CLIMATE MEANS
Keeyask Generation Project. Public Involvement. Supporting Volume. Environmental Impact Statement
 Keeyask Generation Project Environmental Impact Statement Supporting Volume Public Involvement June 212 The Manitoba Hydro System and its Operation Harold Surminski Power Supply December 15, 21 Broad Overview
FERC/RTO Training Session Institute for Policy Integrity New York University School of Law June 15, 2011
 FERC/RTO Training Session Institute for Policy Integrity New York University School of Law June 15, 2011 N. Jonathan Peress Conservation Law Foundation Clean Energy and Climate Change Program 1 It is change,
Load Shift Working Group. https://gridworks.org/initiatives/load-shift-working-group/
 Load Shift Working Group APRIL 18 10AM 2PM PST CPUC GOLDEN GATE ROOM https://gridworks.org/initiatives/load-shift-working-group/ Agenda 10:00 10:20am: Intro and Purpose (Gridworks) 10:20 12:00pm: Grid
Pacific Northwest Low Carbon Scenario Analysis
 Pacific Northwest Low Carbon Scenario Analysis Achieving Least-Cost Carbon Emissions Reductions in the Electricity Sector November 8, 2017 Arne Olson, Partner Nick Schlag, Sr. Managing Consultant Jasmine
Substantial Changes Ahead for MISO North Michigan Impacts 2018 MMEA Fall Conference
 Substantial Changes Ahead for MISO North Michigan Impacts 2018 MMEA Fall Conference Mike Zenker, Managing Director of Market Analysis NextEra Energy Resources September 13, 2018 2 3 The Following Information
2001 Annual Report on the New York Electricity Markets
 2001 Annual Report on the New York Electricity Markets Presented to: New York ISO Management Committee David B. Patton, Ph.D. Independent Market Advisor April 16, 2002 Conclusions and Recommendations The
Renewable Integration The California Experience
 Renewable Integration The California Experience Mark Rothleder Vice President, Market Quality and Renewable Integration New England Power Pool 2017 NEPOOL Participants Committee Summer Meeting June 28,
Wild Horse Solar Photovoltaic Project
 Wild Horse Solar Photovoltaic Project Steven J. St.Clair Manager Renewable Assets Phone: 425-462-3057 Email: steven.stclair@pse.com November 19, 2009 Agenda Introduction PSE Renewable Energy Facilities
Pathways to Integrate 175 Gigawatts of Renewable Energy into India s Electric Grid
 Greening the Grid Rajasthan Pathways to Integrate 175 Gigawatts of Renewable Energy into India s Electric Grid State-specific results from Volume II, which includes all of India. The full reports include
Utility Perspectives on Bioenergy for California
 California Biomass Collaborative Climate Change, Carbon Policies, Renewable Energy and the Role of Biomass Utility Perspectives on Bioenergy for California March 27, 2007 PG&E s 2005 Electric Delivery
Portland General Electric 2016 Integrated Resource Plan. OPUC Public Meeting December 20, 2016
 Portland General Electric 2016 Integrated Resource Plan OPUC Public Meeting December 20, 2016 Agenda Process and Compliance Approach and Summary Analysis Action Plan Next steps 2 2013 IRP Order Resource
TransCanada Power Market Update February 2018
 Forward Prices Table TransCanada Flat 7x24 ($/MWh) AB - 6x16 On Peak ($/MWh) AB - Off-Peak ($/MWh) AECO Gas ($/GJ) Heat Rate BOM $37.5 $44.25 $29.25 $1.85 2.3 March $38. $44.46 $29.64 $1.45 26.2 BOY $6.3
The consumer and societal benefits of wind energy in Texas
 The consumer and societal benefits of wind energy in Texas November 2014 Introduction Texas wind energy provides the state with $3.3 billion in societal benefits per year. These benefits include reducing
Electric Forward Market Report
 Mar-01 Mar-02 Jun-02 Sep-02 Dec-02 Mar-03 Jun-03 Sep-03 Dec-03 Mar-04 Jun-04 Sep-04 Dec-04 Mar-05 May-05 Aug-05 Nov-05 Feb-06 Jun-06 Sep-06 Dec-06 Mar-07 Jun-07 Sep-07 Dec-07 Apr-08 Jun-08 Sep-08 Dec-08
Valuing Energy Storage as a Flexible Resource. Final Phase 1 Report for Consideration in CPUC A
 Valuing Energy Storage as a Flexible Resource Final Phase 1 Report for Consideration in CPUC A. 14-02-006 June 19, 2014 Valuing Energy Storage as a Flexible Resource Final Phase 1 Report for Consideration
Zero Net Carbon Portfolio Analysis
 Zero Net Carbon Portfolio Analysis Prepared for: Platte River Power Authority December 12, 2017 www.paceglobal.com Agenda Background Methodology Assumptions Cases Findings and Recommendations Page 2 Background
Resource Adequacy Enhancements Straw Proposal - Part 1. Stakeholder Call January 23, 2019
 Resource Adequacy Enhancements Straw Proposal - Part 1 Stakeholder Call January 23, 2019 Agenda Time Topic Presenter 1:00 1:10PM Welcome and introduction Jody Cross 1:10 1:40PM Rules for Import RA Chris
Section 3 Characteristics of Credits Types of units. Economic Noneconomic Generation.
 Section 3 Operating Reserve Operating Reserve Day-ahead and real-time operating reserve credits are paid to market participants under specified conditions in order to ensure that resources are not required
California ISO. Q Report on Market Issues and Performance. November 1, Department of Market Monitoring
 California Independent System Operator Corporation California ISO Q3 2018 Report on Market Issues and Performance November 1, 2018 Department of Market Monitoring TABLE OF CONTENTS Executive summary...
Executive summary. Value of Smart Power Generation for utilities in Australia. A white paper by Wärtsilä and Roam Consulting
 Value of Smart Power Generation for utilities in Australia A white paper by Wärtsilä and Roam Consulting Executive summary This study analyses the potential of Smart Power Generation () power plants in
Transmission Expansion Advisory Committee
 Transmission Expansion Advisory Committee EPA's Clean Power Plan PJM Modeling Approach and Deliverables PJM Interconnection December 3, 2015 www.pjm.com Clean Power Plan Analysis Overview What is it? US
PWP 2015 IRP Update Energy Roadmap Event
 PWP 2015 IRP Update Energy Roadmap Event May 13, 2015 Can You Name These PWP Power Sources? 2 PWP Power Supplies 4 Energy Integrated Resource Plan (IRP) The IRP is a 20 year plan for meeting forecasted
PUBLIC DOCUMENT NOT PUBLIC DATA
 Appendix F: Strategist Modeling Assumptions PUBLIC DOCUMENT NOT PUBLIC DATA HAS BEEN EXCISED Appendix F: Strategist Modeling Assumptions PUBLIC DOCUMENT NOT PUBLIC DATA HAS BEEN EXCISED Table of Contents
Schedule 2 TECHNICAL INFORMATION
 Schedule 2 TECHNICAL INFORMATION This document is intended to provide context to the Haida Gwaii Request for Expressions of Interest (RFEOI) for the potential electricity supply opportunity for clean electricity
CO2, SO2 and NOX Emission Rates. August 21, 2015
 August 21, 2015 This page is intentionally left blank. PJM 2015 www.pjm.com 1 P age Introduction In recent years, federal and state environmental regulations have applied or will apply more stringent restrictions
Wyoming Pipeline Authority Happy Jack Wind Farm
 December 10, 2009 Wyoming Pipeline Authority Happy Jack Wind Farm 1 Black Hills Corporation An integrated and diversified energy company Utilities Gas Utilities Colorado Natural Gas Iowa Natural Gas Kansas
Appendix 13. Renewable Energy Market Potential
 Appendix 13. Renewable Energy Market Potential Briefing Paper for the SageCon Partners Estimates of Oregon Renewable Development through 2025 Phil Carver, Oregon Dept. of Energy January 22, 2014 Summary
Elliot Mainzer, BPA. NW Wind Integration Forum SC Meeting June 6, 2011
 Elliot Mainzer, BPA Ken Dragoon, g NWPCC NW Wind Integration Forum SC Meeting June 6, 2011 1. Review the fundamentals concerning our current wind fleet and the regulatory demand for renewables by 2020.
Outline of Talk. Dynamic vs. Time-of-use pricing. Dynamic vs. Time-of-use pricing
 Symmetric Treatment of Load and Generation: A Necessary Condition for Demand Response to Benefit Wholesale Market Efficiency and Manage Intermittency Frank A. Wolak Director, Program on Energy Sustainable
Pathways to Integrate 175 Gigawatts of Renewable Energy into India s Electric Grid
 Greening the Grid Tamil Nadu Pathways to Integrate 175 Gigawatts of Renewable Energy into India s Electric Grid State-specific results from Volume II, which includes all of India. The full reports include
Operations Report. Stephanie Monzon Manager, Markets Coordination Operating Committee July 10, PJM 2018
 Operations Report Stephanie Monzon Manager, Markets Coordination Operating Committee July 10, 2018 Forecast Error (Absolute %) Load Forecasting Error (Achieved 80% of the Time) 5.0 4.5 4.0 On-Peak Average
Preliminary Assumptions for On-Shore Wind Technologies. Gillian Charles GRAC October 2, 2014
 Preliminary Assumptions for On-Shore Wind Technologies Gillian Charles GRAC October 2, 2014 At the last meeting Discussed current status of wind development in PNW Reviewed recent trends in development
Operations Report. Stephanie Monzon Manager, Markets Coordination MC Webinar January 22, PJM 2018
 Operations Report Stephanie Monzon Manager, Markets Coordination MC Webinar January 22, 2019 Forecast Error (Absolute %) Load Forecasting Error (Achieved 80% of the Time) 4.0 3.5 On-Peak Average Off-Peak
Managing Risk and Volatility in Gas-Fired Generation
 Managing Risk and Volatility in Gas-Fired Generation The Institute for Regulatory Policy Studies May 1, 2008 Jay Dibble Director of Gas Regulatory Calpine Corporation TABLE OF CONTENTS CALPINE OVERVIEW
System Needs: An Energy Planning Perspective. Randy Reimann
 System Needs: An Energy Planning Perspective Randy Reimann TOPICS BCUC 2006 IEP/LTAP Decision 2008 LTAP Workplan Resource Options Update System Planning and Criteria 2 BCUC IEP/LTAP DECISION Key findings:
FLEXIBILITY HOW TO CONTRIBUTE TO THE STABILITY OF THE GRID THANKS TO THE FLEXIBILITY OF YOUR PRODUCTION PROCESSES?
 FLEXIBILITY HOW TO CONTRIBUTE TO THE STABILITY OF THE GRID THANKS TO THE FLEXIBILITY OF YOUR PRODUCTION PROCESSES? 1 The energy transition: decentralized power generation Past situation Current situation
Flexible Resource Adequacy Criteria and Must Offer Obligation Working Group Meeting
 Flexible Resource Adequacy Criteria and Must Offer Obligation Working Group Meeting Karl Meeusen, Ph.D. September 26, 2017 2017 CAISO - Public Page 1 FRACMOO 2 Working Group Meeting Agenda 9/26/2017 Time
Briefing Paper for the SageCon Partners Estimates of Oregon Renewable Development through 2025
 Briefing Paper for the SageCon Partners Estimates of Oregon Renewable Development through 2025 Phil Carver, Oregon Dept. of Energy January 23, 2014 Revisons based in PacifiCorp comments as of January 22
Western Energy Imbalance Market
 Western Energy Imbalance Market Monday, May 23, 2016 Peter Colussy, External Affairs Manager - Regional Copyright 2016 California ISO Energy Imbalance Market is an easily-scalable extension of real-time
UNITED STATES OF AMERICA FEDERAL ENERGY REGULATORY COMMISSION
 UNITED STATES OF AMERICA FEDERAL ENERGY REGULATORY COMMISSION California Independent System ) Docket Nos. ER12-1630 Operator Corporation ) ER14-971 Informational Report of the California Independent System
Operations Report. Hong Chen Senior Lead Engineer, Markets Coordination Members Committee October 22, PJM 2018
 Operations Report Hong Chen Senior Lead Engineer, Markets Coordination Members Committee October 22, 2018 Forecast Error (Absolute %) Load Forecasting Error (Achieved 80% of the Time) 4.0 3.5 On-Peak Average
Pathways to Integrate 175 Gigawatts of Renewable Energy into India s Electric Grid
 Greening the Grid Gujarat Pathways to Integrate 175 Gigawatts of Renewable Energy into India s Electric Grid State-specific results from Volume II, which includes all of India. The full reports include
Selected Findings from Scenario and Sensitivity Analysis Conducted To Date. August 6, 2015
 Selected Findings from Scenario and Sensitivity Analysis Conducted To Date August 6, 2015 Progress Since The July Council Meeting: All Planned Scenario Analysis Completed! RPM Systems 2 Progress Since
Electric Analysis PSE Integrated Resource Plan. Contents. Chapter 6: Electric Analysis
 6 2017 PSE Integrated Resource Plan Electric Analysis This chapter presents the results of the electric analysis. Contents 1. ANALYSIS OVERVIEW 6-3 2. RESOURCE NEED 6-5 Components of Physical (Peak) Need
Q2/2016 Quarterly Report
 April June 2016 July 29, 2016 Taking action to promote effective competition and a culture of compliance and accountability in Albertaʹs electricity and retail natural gas markets www.albertamsa.ca Table
Ancillary Service Markets
 Section 9 Ancillary Services Ancillary Service Markets The United States Federal Energy Regulatory Commission (FERC) defined six ancillary services in Order No. 888: 1) scheduling, system control and dispatch;
MISO Energy Storage Study DRAFT Scope
 MISO Energy Storage Study DRAFT Scope MISO Energy Storage Study DRAFT Scope July 19, 2011 MISO Page 1 Table of Contents 1. Introduction... 3 2. Study Objectives... 3 3. Study Drivers... 4 4. Study Description...
MARKET MATTERS HVDC UTILISATION REPORT OCTOBER 2018
 HVDC Utilisation In late 2016 we published a report covering what restricts HVDC north transfer 1. We are now publishing monthly updates on the market aspects that restricted HVDC north transfer, and some
Annual Renewable Energy Constraint and Curtailment Report 2016
 Annual Renewable Energy Constraint and Curtailment Report 2016 07/04/2017 Contents Executive Summary... 3 1 Introduction... 5 1.1 Context... 5 1.2 Reasons for Dispatch-Down... 5 1.3 Reporting Methodology...
The Confluence Model. Presentation to Modeling and Forecasting Working Group January 21, 2015
 The Confluence Model Presentation to Modeling and Forecasting Working Group January 21, 2015 Introductions Presenter: Gary Fiske Working Group Water Department staff Objective: Penetrate the Black Box
Hedging Coal Price Risk in a Deregulated Power Market
 Hedging Coal Price Risk in a Deregulated Power Market Ginny Farrow Manager Rail Car Fleet NCCI Spring Conference Greensboro, NC April 12, 2007 Safe Harbor Statement This Presentation contains forward-looking
OVERVIEW OF DESERT SOUTHWEST POWER MARKET AND ECONOMIC ASSESSMENT OF THE NAVAJO GENERATING STATION
 OVERVIEW OF DESERT SOUTHWEST POWER MARKET AND ECONOMIC ASSESSMENT OF THE NAVAJO GENERATING STATION ARIZONA CORPORATION COMMISSION APRIL 6, 2017 DALE PROBASCO MANAGING DIRECTOR ROGER SCHIFFMAN DIRECTOR
Draft 2011 Long-term Transmission Plan. Stakeholder Session June 20, 2011
 Draft 2011 Long-term Transmission Plan Stakeholder Session June 20, 2011 Agenda Highlights of draft 2011 Long-term Transmission Plan Discussion of project costs and rate impact Impact of transmission constraints
Western Energy Imbalance Market and Regional Initiatives
 Western Energy Imbalance Market and Regional Initiatives Presentation to mid-c Seminar Don Fuller Director Strategic Alliances July 27, 2016 Today s topics Renewable portfolio continues to grow Energy
Determining water allocations in the regulated Murrumbidgee Valley
 Determining water allocations in the regulated Murrumbidgee Valley September 2013 Introduction The NSW Office of Water (NOW) is responsible for sharing water between consumptive users and the environment
Briefing on the duck curve and current system conditions
 Briefing on the duck curve and current system conditions Clyde Loutan, Senior Advisor Market Surveillance Committee Meeting General Session July 15, 215 Original estimate of net-load as more renewables
Renewable Portfolio Standards
 Renewable Portfolio Standards Lisa Schwartz Presentation to Oregon State University Energy Economics Class Feb. 22, 2010 The Regulatory Assistance Project China EU India United States About the Regulatory