VOLUME 2 Environmental Assessment Report. Kestrel Extension #4
|
|
|
- Regina Rogers
- 6 years ago
- Views:
Transcription

1 VOLUME 2 Environmental Assessment Report Kestrel Extension #4 November 2012
2 riotinto.com VOLUME 1 Executive Summary Chapter 01 Chapter 02 Chapter 03 Chapter 04 Chapter 05 Chapter 06 Chapter 07 Chapter 08 Chapter 09 Chapter 10 Chapter 11 Chapter 12 Chapter 13 Chapter 14 Chapter 15 Chapter 16 Reference Abbreviations Appendix A Appendix B Appendix C Appendix D Introduction Description of existing operations Description of the proposed amendment Applicable legislation and approvals Land Surface water Groundwater Air Noise Visual amenity Nature conservation Waste management Decommissioning and rehabilitation Native title and cultural heritage Community Conclusion Environmental management plan Subsidence assessment Soil survey Surface water assessment VOLUME 2 Appendix E Appendix F Appendix G Appendix H Groundwater assessment Air quality assessment Noise assessment rrestrial ecology assessment

3 Appendix E Groundwater assessment
4

5 Kestrel Extension #4 Groundwater Assessment Final Report Prepared by: Prepared for: RPS AUSTRALIA EAST PTY LTD RIO TINTO COAL AUSTRALIA 743 Ann Street PO Box 1559 FORTITUDE VALLEY QLD 4006 T: F: E: W: Report Number: PR REP-001 Version / Date: Rev 0 / 26 June Albert Street BRISBANE QLD 4000 T: W: RPS Australia East Pty Ltd, ABN:
6 Kestrel Extension #4 Groundwater Assessment Final Report Important Note Apart from fair dealing for the purposes of private study, research, criticism, or review as permitted under the Copyright Act, no part of this report, its attachments or appendices may be reproduced by any process without the written consent of RPS Australia East Pty Ltd. All enquiries should be directed to RPS Australia East Pty Ltd. We have prepared this report for the sole purposes of Rio Tinto Coal Australia, Client, for the specific purpose only for which it is supplied. This report is strictly limited to the purpose and the facts and matters stated in it and does not apply directly or indirectly and will not be used for any other application, purpose, use or matter. In preparing this report we have made certain assumptions. We have assumed that all information and documents provided to us by the Client or as a result of a specific request or enquiry were complete, accurate and up-to-date. Where we have obtained information from a government register or database, we have assumed that the information is accurate. Where an assumption has been made, we have not made any independent investigations with respect to the matters the subject of that assumption. We are not aware of any reason why any of the assumptions are incorrect. This report is presented without the assumption of a duty of care to any other person, (other than the Client), ( Third Party ). The report may not contain sufficient information for the purposes of a Third Party or for other uses. Without the prior written consent of RPS Australia East Pty Ltd: This report may not be relied on by a Third Party; and RPS Australia East Pty Ltd will not be liable to a Third Party for any loss, damage, liability or claim arising out of or incidental to a Third Party publishing, using or relying on the facts, content, opinions or subject matter contained in this report. If a Third Party uses or relies on the facts, content, opinions or subject matter contained in this report with or without the consent of RPS Australia East Pty Ltd, RPS Australia East Pty Ltd disclaims all risk and the Third Party assumes all risk and releases and indemnifies and agrees to keep indemnified RPS Australia East Pty Ltd from any loss, damage, claim or liability arising directly or indirectly from the use of or reliance on this report. In this note, a reference to loss and damage includes past and prospective economic loss, loss of profits, damage to property, injury to any person, including death, costs and expenses incurred in taking measures to prevent, mitigate or rectify any harm, loss of opportunity, legal costs, compensation, interest and any other direct, indirect, consequential or financial or other loss. Document Status Version Purpose of Document Orig Review Review Date QA Review RPS Release Approval Issue Date Rev A Draft report PAE SG 31 March 2012 BN PAE 31 March 2012 Rev B Revised draft report PAE SG 10 May 2012 BN PAE 11 May 2012 PR REP-001; Rev 0 / 26 June 2012 Page ii
7 Kestrel Extension #4 Groundwater Assessment Final Report Rev 0 Final Report PAE SG 25 June 2012 BN PAE 26 June 2012 PR REP-001; Rev 0 / 26 June 2012 Page iii
8 Kestrel Extension #4 Groundwater Assessment Final Report Summary The Kestrel Mine is located approximately 30 km north east of Emerald in Central Queensland. Directly to the north and adjoining the Kestrel Mine leases, are leases held by BMA Coal for the Crinum underground coal mines and Gregory open cut coal mine. Rio Tinto Coal Australia wishes to modify and marginally expand its planned operations of the Kestrel Coal Mine. Rio Tinto Coal Australia propose to continue the mining of the Upper German Creek Coal Seam using long-wall mining methods and to extend this mining to the area of Kestrel Extension #4 which occupies MDLs 176, 345 and part of MDL182. Kestrel Extension #4 includes parts of the 500 series longwall panels previously assessed in A review of available geological data for the proposed mine area in Kestrel Extension #4 indicates that the thickness of inter-burden between the roof of the proposed extended underground mine workings and the base of the rtiary Age basal sand aquifer is greater than the critical m thickness range identified by Seedsman, 2002 & 2005, which is associated with the development of goaf induced fracture hydraulic connection. Effectively the thickness of the inter-burden is assessed to be sufficiently great that during and after mining, the existing vertical hydraulic connectivity between the Permian Age formations that host the proposed 500 series long wall panel workings within Kestrel Extension #4 and the overlying rtiary Age aquifer units will not change from its existing negligible state. Given that the proposed mine extension is assessed to not impact on the overlying rtiary Age aquifers, the hydrological impact of the mine extension will only be restricted to groundwater level impact within the Permian Age formations due to the inflow of groundwater to the long-wall workings and its removal to allow mining. The aquifers hosted by the Permian Age geological units in the vicinity of the Kestrel Mine are notable for low permeability, limited groundwater yields and very poor (brackish to saline) groundwater quality. Groundwater drawn from the Permian Age aquifers in this area are unsuitable for potable use, irrigation usage and are of marginal to unsuitable use for stock water. They constitute only a very minor groundwater resource of limited value. Matrix Plus Consultants (2006) previously reviewed hydrogeological assessment work undertaken for the broader Kestrel area by AGE Consultants (AGE, 2002) to support assessment of the 2006 Kestrel Extension Project (KMEP) and ascertain whether the 2006 proposal would change previous groundwater impact predictions. Matrix Plus Consultants (2006) noted that numerical modelling of the German Creek Seam for the 2003 proposal (encompassing the full development of the extension area to 2029) by AGE (2002) had been undertaken to provide an assessment of potential groundwater inflows to the mine workings and from the seam itself. Matrix Plus Consulting (2006) noted that predictive modelling for the 2003 proposal had indicated that inflow from the German Creek seam reached a relatively steady rate of about 8 L/s after approximately seven years of mining, although there would be an additional inflow from overlying PR REP-001; Rev 0 / 26 June 2012 Page iv
9 Kestrel Extension #4 Groundwater Assessment Final Report permeable Permian Age strata as a result of goafing. Matrix Plus Consulting (2006) also noted that a conservative assessment of the contribution of overlying Permian Age strata to the inflow rate had shown that if goafing was to intersect permeable strata, total inflow from the Permian Age units may increase to 25 L/s. Matrix Plus Consulting (2006) also noted that because the gateroads would generally be constructed well in advance of mining, significant dewatering of each of the long-wall panels would occur prior to mining. Matrix Plus Consulting (2006) suggested that from a hydrogeological perspective, the most significant impact resulting from the proposed Kestrel Mine Extension Project mine expansion activities would likely be the long-term dewatering of groundwater within the German Creek coal seam. Matrix Plus Consulting (2006) noted that predictive groundwater flow modelling had indicated that dewatering impacts in the Permian Age aquifer would likely occur up to 8 km from the mining panels, although the propagation of drawdown impact would likely be restricted by major faults. Matrix Plus Consulting (2006) stated that subsidence associated with the 500 series long-wall panels for the Kestrel Mine Extension Project was not likely to have a significant impact on groundwater users / aquifers, except for three water supply bores located immediately above the proposed Kestrel Mine Extension Project area. Matrix Plus Consultants (2006) concluded that because the realigned long-wall panels for the Kestrel Mine Extension Project were located through the same geology, same aquifers and same depth of cover as the previous 2003 mine layout, it was reasonable to assume that the potential for impacts associated with the revised 2006 Kestrel Mine Extension Project mine plan would be similar to those predicted in the 2003 studies. Matrix Plus Consulting (2006) indicated that undertaking additional modelling to reproduce the methodology and complexity of the AGE (2002) numerical model through incorporation of the 2006 revised mine plan would not result in any significant change to the outcomes previously presented. This is reasonable and given the relatively minor changes between the currently proposed footprint for the 500 series panels in the Kestrel Extension #4 area and the corresponding layout for 2006, additional numerical modelling to assess the incremental groundwater impact to the Permian Age units associated with the development of the 500 series panels within Kestrel Extension #4 is not warranted. The proposed 500 series long-wall panels within Kestrel Extension #4 should not induce groundwater impacts to the main aquifers of the area, namely the rtiary Age basalts and rtiary Age sand units. The impact to the Permian Age aquifer and its existing groundwater users associated with the currently proposed alignment of the 500 series panels within Kestrel Extension #4 should not be significantly greater than for the currently approved panel layout as assessed by Matrix Plus Consulting (2006) because of only limited changes (approximately 9.5% increase) to the footprint area of the overall (400 plus 500 series) panel area assessed in modelling by AGE (2002). In referring to alterations in panel layouts Matrix Plus (2007) indicated that changes to the orientation of the 500 series panels associated within Kestrel Extension #4 and the additional areas within MDL 182 are likely to be similar to previous assessments. The Environment Management Plan is considered to provide sufficient commitments for the management and mitigation of groundwater for Kestrel Extension #4. Given the negligible incremental impact associated with the currently proposed panel layout for Kestrel Extension #4, there would be no reason to alter the previously proposed mitigation strategies. With PR REP-001; Rev 0 / 26 June 2012 Page v
10 Kestrel Extension #4 Groundwater Assessment Final Report respect to these mitigation strategies Matrix Plus (2006) noted that bores tapping the Permian Age unit typically yield water quality that is brackish to saline and is commonly not suitable for stock or domestic use however if these bores are required for water supply and are impacted to an unacceptable level, additional bores may be required within other aquifers (i.e. rtiary Age aquifers) to maintain an acceptable water supply. This is a reasonable mitigation strategy but should be supported by systematic observation of groundwater levels in private bores. PR REP-001; Rev 0 / 26 June 2012 Page vi
11 Kestrel Extension #4 Groundwater Assessment Final Report Contents 1.0 INTRODUCTION Background Scope ASSESSMENT OF VERTICAL SEEPAGE RISK BENEATH SUBJECT PANELS KESTREL EXTENSION # Mine sequencing data for existing and proposed 500 series long-wall panels Overview of geological data for subject panels Kestrel Extension # Relevant geological data for area overlain by proposed Kestrel Extension # Likelihood of vertical seepage due to fracture propagation in the interburden ASSESSMENT OF INCREMENTAL IMPACT TO KEY GROUNDWATER BEARING FORMATIONS Assessment of incremental impact to rtiary Age sands Assessment of incremental impact to rtiary Age basalts Assessment of incremental impact to Permian Age formations CONCLUSIONS REFERENCES 29 PR REP-001; Rev 0 / 26 June 2012 Page vii
12 Kestrel Extension #4 Groundwater Assessment Final Report Tables Table 2.1 Simplified stratigraphy for the Kestrel Extension # Figures Figure 1.1 Location of Kestrel Mine Figure 1.2 Currently proposed alignment of 500 series long-wall panels compared to the alignment for the Kestrel Mine Extension project previously considered in 2006 and boundary of Kestrel Extension # Figure 2.1 Previous (2006) footprint for 500 series long-wall panels at Kestrel and boundary of Kestrel Extension # Figure 2.2 Currently proposed footprint for 500 series long-wall panels at Kestrel and boundary of Kestrel Extension # Figure 2.3 Surface geology of Kestrel Mine area Figure 2.4 Location of faults at Kestrel Figure 2.5 Thickness of inter-burden separating German Creek Coal Seam from base of rtiary Age units Figure 3.1 Groundwater elevation contours for composite of data from Permian Age units in Kestrel area for November PR REP-001; Rev 0 / 26 June 2012 Page viii
13 1.0 Introduction 1.1 Background Rio Tinto Coal Australia operate the Kestrel underground coal mine approximately 35 km north east of Emerald in Central Queensland (Figure 1.1). Directly to the north an adjoining the Kestrel Mine leases are leases held by BMA Coal for the Crinum underground coal mines and Gregory open cut coal mine. Rio Tinto Coal Australia wishes to further expand the Kestrel underground operations, and the currently proposed extension is referred to as Kestrel Extension #4. Kestrel Extension #4 includes parts of the 500 series long-wall panels previously assessed in 2006 that are located within what is currently Mineral Development Leases (MDLs) 176 and 345 to the south-west. In addition to the above, long term mine planning has identified economic coal resources to occur within MDL 182. The 500 series long-wall panels have been reviewed as part of the long term mine planning process resulting in realignment of the layout of the 500 series panels, extending panels 504 to 510 into part of MDL 182. Figure 1.2 illustrates the realignment of the 500 series long-wall panels compared to the alignment for the Kestrel Mine Extension project previously considered in Some re-alignment of the 400 panels are also a result of long-term mine planning, however these are within the footprint of the previous layout. The realignment of panels within the existing footprints within Mining Leases 70301, and are outside the scope of this Environment Authority amendment, as they would be managed under the existing Environmental Authority, Environment Management Plan and Plan of Operations (PoOps) for the relevant period. As part of the process for applying for a Mining Lease under the Mineral Resources Act 1989 over MDLs 176 and 345 and part of MDL 182, an application to amend Environmental Authority MIN under the Environment Protection Act 1994 is required. Long-wall panels 312 and 313 will be required to ensure continuation of mining until the extraction of coal from Kestrel Mine Extension reaches appropriate production levels. These panels will be subject to future Plan of Operations. To support the approval process for Kestrel Extension #4 Rio Tinto Coal Australia retained RPS to investigate the potential impacts to groundwater levels in the three main groundwater systems at Kestrel Mine. The Kestrel mine extracts coal from Permian Age sedimentary rocks of the German Creek Formation. At Kestrel Mine the Permian Age formations are overlain by rtiary Age formations including clay and sand and surficial basalts. The rtiary Age deposits host aquifers of variable productivity with this being strongly influenced by lithology. PR REP-001; Rev 0 / 26 June 2012

14 D CHIRNSIDE MONTROSE ROAD LEGEND Roads Locality MOUNT STUART ROAD YAN YAN ROAD GREGORY MINE FAIRHILL ROAD JUREMA AMAH FAIRHILLS ROAD KESTREL BULLERY GORDON ROAD KABLEBARA FAIRHILL LANGLEY DOWNS YAMBOYNA WYUNA ROAD BRIDGE FLATS ROAD FOLEY ROAD PR REP-001 Rev 0 June 2012 TYSON ROAD CAPRICORN HIGHWAY SELMA SELMA ROAD EMERALD CODENWARRA ROAD LOCHLEES ROAD BAUHINIAS ROAD DUCK PONDS ROAD 0 5 kilometers 10 Figure 1.1 LOCATION OF KESTREL MINE
15 LEGEND Historic Series Panel Layout kilometers 3 Current 500 Series Panel Layout Kestrel Extention #4 PR REP-001 Rev 0 June 2012 Figure 1.2 CURRENTLY PROPOSED ALIGNMENT OF 500 SERIES LONG-WALL PANELS COMPARED TO THE ALIGNMENT FOR THE KESTREL MINE EXTENTION PROJECT PREVIOUSLY CONSIDERED IN 2006 AND BOUNDARY OF KESTREL EXTENSION #4
16 Although there are significant thicknesses of rtiary Age clay, the rtiary Age deposits also host some more permeable sand deposits including some very productive palaeochannel fill sands and gravels. These are locally known as the Basal Sand aquifer. The surficial rtiary Age basalts are of variable yield, depending on lithology and jointing. The groundwater quality in the rtiary Age basalts is variable from moderately low salinity to moderately brackish groundwater. The rtiary Age basalt forms the most important aquifer in the area, although some deeper bores tap the Basal Sand aquifer where the basalts are poorly productive and the sands are present at depth. The Permian Age aquifer at Kestrel Mine generally hosts poorly productive aquifers with brackish to significantly saline groundwater. Groundwater is extracted from the Kestrel Mine area to allow mining operations to occur. Groundwater levels in the broader Crinum Mine Kestrel Mine area have historically been impacted by mining operations and significant depressions exist in the potentiometric surfaces of the three main groundwater systems. PR REP-001; Rev 0 / 26 June 2012
17 1.2 Scope The scope for RPS for this assessment has been to: Review available geological data for the proposed realignment of the 500 series long-wall panels and the extension of the 500 series panels for the Kestrel Extension #4; Interpret whether or not the inter-burden rock between the German Creek Coal Seam and the rtiary Age units is sufficiently thick in the area of the 500 series long-wall panels for the Kestrel Extension #4 to prevent the development of vertical fractures through the inter-burden to hydraulically connect the underground workings with the rtiary Age units in response to goaf induced subsidence; and Document any potential additional impacts to groundwater systems in the vicinity of the Kestrel Mine in response to the proposed realignment of the 500 series long-wall panels and the extension of the 500 series panels for Kestrel Extension #4 with reference to the groundwater impact assessment documented by Matrix Plus Consulting (2006). PR REP-001; Rev 0 / 26 June 2012
18 2.0 Assessment of vertical seepage risk beneath subject panels Kestrel Extension #4 2.1 Mine sequencing data for existing and proposed 500 series long-wall panels Rio Tinto Coal Australia propose to continue the mining of the Upper German Creek Coal Seam using long-wall mining methods and to extend this mining to the area of Kestrel Extension #4 which occupies MDLs 176 and 345. Kestrel Extension #4 includes parts of the 500 series long-wall panels previously assessed in Figure 2.1 indicates the previous footprint for the 500 series long-wall panels at Kestrel at 2006 together with the proposed boundary of Kestrel Extension #4. Figure 2.2 indicates the currently proposed footprint for the 500 series long-wall panels at Kestrel together with the proposed boundary of Kestrel Extension #4. Mining of the 500 series panels will begin with the mining of the panel 500 headgate in Mining of the 500 series will eventually consist of 10 panels. Mining of the 500 series panels will begin in the southeast and progress to the northwest. The headgates and tailgates will all be mined from the main entry separating the 400 and 500 panels; however, panels 506 to 510 will be mined from the distal end of the working but terminate prior to reaching the main entry. The proximal end of panel 510 will be mined separately from the distal end. PR REP-001; Rev 0 / 26 June 2012
19 500 Series Panels kilometers 3 LEGEND Kestrel Extension #4 Historic 2006 Panel Layout PR REP-001 Rev 0 June 2012 Figure 2.1 PREVIOUS (2006) FOOTPRINT FOR 500 SERIES LONG-WALL PANELS AT KESTREL
20 500 Series Panels kilometers 3 LEGEND Kestrel Extension #4 Current Panel Layout PR REP-001 Rev 0 June 2012 Figure 2.2 CURRENTLY PROPOSED FOOTPRINT FOR 500 SERIES LONG-WALL PANELS AT KESTREL
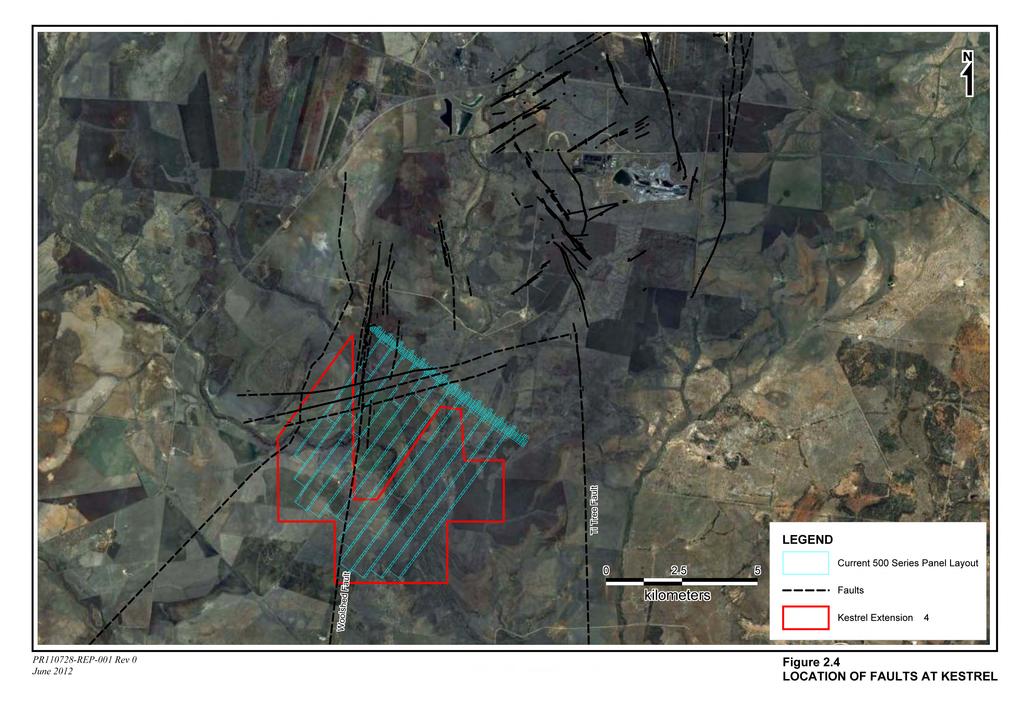
21 2.2 Overview of geological data for subject panels Kestrel Extension #4 The geological summary for this report is derived from the conceptual geological model developed by AGE (2002) and modified by Matrix Plus (2008). The surface geology of the Kestrel Extension #4 site is underlain by rtiary Age basalt (Figure 2.3 and Table 2.1). The basalt ranges from extremely weathered to fresh. Productive volumes of groundwater are found within the fractured fresh basalt. The basalt is underlain by contiguous and approximately 20 m thick rtiary Age fluvial clay. The clay is underlain by a variable thickness rtiary Age basal sand unit. Overall the basal sands are contiguous across the expansion site; however, the vertical sand sequence is interspersed with discontinuous and variable thickness clay and clayey sand beds. The basal sands are water-bearing. The basal sands are underlain by the Permian Age Blackwater Group. The contact between the basal sands and the Permian Age Blackwater Group is a regionally significant angular unconformity. To the east, the basal sands overlie the sandstones of the Fair Hill Formation and in the east the basal sands overly the finer grained siltstone and mudstones of the McMillan Formation. The contact between the basal sands and the Blackwater Group is irregular and is marked by a deep weathered zone in the upper portion of the Blackwater Group. The Blackwater Group is underlain by the coal-bearing Permian Age. The Back Creek Group is composed of sandstone, carbonaceous shale and seven named coal seams. At Kestrel Mine Rio Tinto Coal Australia extract coal from the lower most and thickest coal seam, the German Creek seam (Table 2.1). The angular unconformity separating the rtiary Age rocks and the Permian Age rocks also marks the transition from the relatively flat lying surface volcanics and the sediments form an asymmetric and gentle syncline in the Permian Age rocks. The syncline is bounded by the Woodshed Fault system to the west and the Ti Tree Fault system to the east (see Figure 2.4). The syncline is approximately 5 km wide and the syncline fold axis is located approximately 1.5 km west of the Ti Tree Fault. The asymmetry of the syncline means the dip of the eastern limb is greater than the dip of the western limb. The bounding faults have been mapped as cutting the Permian Age rocks and terminating at the unconformity. A cross section prepared by AGE (2002) suggests maximum vertical displacement of less than 20 m for both the Woodshed and Ti Tree Faults. The faults do not crosscut the rtiary Age sediments or volcanics and have not been mapped at the surface. However, the volcanics and sediments appear to thin over the Woodshed Fault system, which may be due to erosion. AGE (2002) considered the Woodshed and Ti Tree Faults to be groundwater flow barriers. Rio Tinto Coal Australia mapped additional east to west oriented fault systems. These fault systems traverse the Kestrel site from northern extent of panels 510 to 507 to southern extent of panels 410 to 413 and it is possible that the southern extension of the Woolshed Fault traverses the western panels in Kestrel Extension #4. PR REP-001; Rev 0 / 26 June 2012
22 PR REP-001 Rev 0 June 2012 Figure 2.3 SURFACE GEOLOGY OF KESTREL MINE AREA kilometers -ANAKIE -ANAKIE -ANAKIE -ANAKIE -ANAKIE -ANAKIE -ANAKIE -ANAKIE -ANAKIE -ANAKIE -ANAKIE -ANAKIE -ANAKIE -ANAKIE -ANAKIE -ANAKIE -ANAKIE -ANAKIE -ANAKIE -ANAKIE -ANAKIE -ANAKIE -ANAKIE -ANAKIE -ANAKIE -ANAKIE -ANAKIE -ANAKIE -ANAKIE -ANAKIE -ANAKIE -ANAKIE -ANAKIE -ANAKIE -ANAKIE -ANAKIE -ANAKIE -ANAKIE -ANAKIE -ANAKIE -ANAKIE -ANAKIE -ANAKIE -ANAKIE -ANAKIE -ANAKIE -ANAKIE -ANAKIE -ANAKIE -ANAKIE -ANAKIE -ANAKIE -ANAKIE -ANAKIE -ANAKIE -ANAKIE -ANAKIE -ANAKIE -ANAKIE -ANAKIE -ANAKIE -ANAKIE -ANAKIE -ANAKIE -ANAKIE -ANAKIE -ANAKIE -ANAKIE -ANAKIE -ANAKIE -ANAKIE -ANAKIE -ANAKIE -ANAKIE -ANAKIE -ANAKIE -ANAKIE -ANAKIE -ANAKIE -ANAKIE -ANAKIE -ANAKIE -ANAKIE -ANAKIE -ANAKIE -ANAKIE -ANAKIE -ANAKIE -ANAKIE -ANAKIE -ANAKIE -ANAKIE -ANAKIE -ANAKIE -ANAKIE -ANAKIE -ANAKIE -ANAKIE -ANAKIE (Baslt) -ANAKIE (Baslt) -ANAKIE (Baslt) -ANAKIE (Baslt) -ANAKIE (Baslt) -ANAKIE (Baslt) -ANAKIE (Baslt) -ANAKIE (Baslt) -ANAKIE (Baslt) -ANAKIE (Baslt) -ANAKIE (Baslt) -ANAKIE (Baslt) -ANAKIE (Baslt) -ANAKIE (Baslt) -ANAKIE (Baslt) -ANAKIE (Baslt) -ANAKIE (Baslt) -ANAKIE (Baslt) -ANAKIE (Baslt) -ANAKIE (Baslt) -ANAKIE (Baslt) -ANAKIE (Baslt) -ANAKIE (Baslt) -ANAKIE (Baslt) -ANAKIE (Baslt) -ANAKIE (Baslt) -ANAKIE (Baslt) -ANAKIE (Baslt) -ANAKIE (Baslt) -ANAKIE (Baslt) -ANAKIE (Baslt) -ANAKIE (Baslt) -ANAKIE (Baslt) -ANAKIE (Baslt) -ANAKIE (Baslt) -ANAKIE (Baslt) -ANAKIE (Baslt) -ANAKIE (Baslt) -ANAKIE (Baslt) -ANAKIE (Baslt) -ANAKIE (Baslt) -ANAKIE (Baslt) -ANAKIE (Baslt) -ANAKIE (Baslt) -ANAKIE (Baslt) -ANAKIE (Baslt) -ANAKIE (Baslt) -ANAKIE (Baslt) -ANAKIE (Baslt) -ANAKIE (Basalt) -ANAKIE (Basalt) -ANAKIE (Basalt) -ANAKIE (Basalt) -ANAKIE (Basalt) -ANAKIE (Basalt) -ANAKIE (Basalt) -ANAKIE (Basalt) -ANAKIE (Basalt) -ANAKIE (Basalt) -ANAKIE (Basalt) -ANAKIE (Basalt) -ANAKIE (Basalt) -ANAKIE (Basalt) -ANAKIE (Basalt) -ANAKIE (Basalt) -ANAKIE (Basalt) -ANAKIE (Basalt) -ANAKIE (Basalt) -ANAKIE (Basalt) -ANAKIE (Basalt) -ANAKIE (Basalt) -ANAKIE (Basalt) -ANAKIE (Basalt) -ANAKIE (Basalt) -ANAKIE (Basalt) -ANAKIE (Basalt) -ANAKIE (Basalt) -ANAKIE (Basalt) -ANAKIE (Basalt) -ANAKIE (Basalt) -ANAKIE (Basalt) -ANAKIE (Basalt) -ANAKIE (Basalt) -ANAKIE (Basalt) -ANAKIE (Basalt) -ANAKIE (Basalt) -ANAKIE (Basalt) -ANAKIE (Basalt) -ANAKIE (Basalt) -ANAKIE (Basalt) -ANAKIE (Basalt) -ANAKIE (Basalt) -ANAKIE (Basalt) -ANAKIE (Basalt) -ANAKIE (Basalt) -ANAKIE (Basalt) -ANAKIE (Basalt) -ANAKIE (Basalt) -ANAKIE (Basalt) -ANAKIE (Basalt) -ANAKIE (Basalt) -ANAKIE (Basalt) -ANAKIE (Basalt) -ANAKIE (Basalt) -ANAKIE (Basalt) -ANAKIE (Basalt) -ANAKIE (Basalt) -ANAKIE (Basalt) -ANAKIE (Basalt) -ANAKIE (Basalt) -ANAKIE (Basalt) -ANAKIE (Basalt) -ANAKIE (Basalt) -ANAKIE (Basalt) -ANAKIE (Basalt) -ANAKIE (Basalt) -ANAKIE (Basalt) -ANAKIE (Basalt) -ANAKIE (Basalt) -ANAKIE (Basalt) -ANAKIE (Basalt) -ANAKIE (Basalt) -ANAKIE (Basalt) -ANAKIE (Basalt) -ANAKIE (Basalt) -ANAKIE (Basalt) -ANAKIE (Basalt) -ANAKIE (Basalt) -ANAKIE (Basalt) -ANAKIE (Basalt) -ANAKIE (Basalt) -ANAKIE (Basalt) -ANAKIE (Basalt) -ANAKIE (Basalt) -ANAKIE (Basalt) -ANAKIE (Basalt) -ANAKIE (Basalt) -ANAKIE (Basalt) -ANAKIE (Basalt) -ANAKIE (Basalt) -ANAKIE (Basalt) -ANAKIE (Basalt) -ANAKIE (Basalt) -ANAKIE (Basalt) -ANAKIE (Basalt) -ANAKIE (Basalt) -ANAKIE (Basalt) -ANAKIE -ANAKIE -ANAKIE -ANAKIE -ANAKIE -ANAKIE -ANAKIE -ANAKIE -ANAKIE -ANAKIE -ANAKIE -ANAKIE -ANAKIE -ANAKIE -ANAKIE -ANAKIE -ANAKIE -ANAKIE -ANAKIE -ANAKIE -ANAKIE -ANAKIE -ANAKIE -ANAKIE -ANAKIE -ANAKIE -ANAKIE -ANAKIE -ANAKIE -ANAKIE -ANAKIE -ANAKIE -ANAKIE -ANAKIE -ANAKIE -ANAKIE -ANAKIE -ANAKIE -ANAKIE -ANAKIE -ANAKIE -ANAKIE -ANAKIE -ANAKIE -ANAKIE -ANAKIE -ANAKIE -ANAKIE -ANAKIE -ANAKIE -ANAKIE -ANAKIE -ANAKIE -ANAKIE -ANAKIE -ANAKIE -ANAKIE -ANAKIE -ANAKIE -ANAKIE -ANAKIE -ANAKIE -ANAKIE -ANAKIE -ANAKIE -ANAKIE -ANAKIE -ANAKIE -ANAKIE -ANAKIE -ANAKIE -ANAKIE -ANAKIE -ANAKIE -ANAKIE -ANAKIE -ANAKIE -ANAKIE -ANAKIE -ANAKIE -ANAKIE -ANAKIE -ANAKIE -ANAKIE -ANAKIE -ANAKIE -ANAKIE -ANAKIE -ANAKIE -ANAKIE -ANAKIE -ANAKIE -ANAKIE -ANAKIE -ANAKIE -ANAKIE -ANAKIE -ANAKIE -QLD -QLD -QLD -QLD -QLD -QLD -QLD -QLD -QLD -QLD -QLD -QLD -QLD -QLD -QLD -QLD -QLD -QLD -QLD -QLD -QLD -QLD -QLD -QLD -QLD -QLD -QLD -QLD -QLD -QLD -QLD -QLD -QLD -QLD -QLD -QLD -QLD -QLD -QLD -QLD -QLD -QLD -QLD -QLD -QLD -QLD -QLD -QLD -QLD -ANAKIE -ANAKIE -ANAKIE -ANAKIE -ANAKIE -ANAKIE -ANAKIE -ANAKIE -ANAKIE -ANAKIE -ANAKIE -ANAKIE -ANAKIE -ANAKIE -ANAKIE -ANAKIE -ANAKIE -ANAKIE -ANAKIE -ANAKIE -ANAKIE -ANAKIE -ANAKIE -ANAKIE -ANAKIE -ANAKIE -ANAKIE -ANAKIE -ANAKIE -ANAKIE -ANAKIE -ANAKIE -ANAKIE -ANAKIE -ANAKIE -ANAKIE -ANAKIE -ANAKIE -ANAKIE -ANAKIE -ANAKIE -ANAKIE -ANAKIE -ANAKIE -ANAKIE -ANAKIE -ANAKIE -ANAKIE -ANAKIE -QLD -QLD -QLD -QLD -QLD -QLD -QLD -QLD -QLD -QLD -QLD -QLD -QLD -QLD -QLD -QLD -QLD -QLD -QLD -QLD -QLD -QLD -QLD -QLD -QLD -QLD -QLD -QLD -QLD -QLD -QLD -QLD -QLD -QLD -QLD -QLD -QLD -QLD -QLD -QLD -QLD -QLD -QLD -QLD -QLD -QLD -QLD -QLD -QLD Rr Rr Rr Rr Rr Rr Rr Rr Rr Rr Rr Rr Rr Rr Rr Rr Rr Rr Rr Rr Rr Rr Rr Rr Rr Rr Rr Rr Rr Rr Rr Rr Rr Rr Rr Rr Rr Rr Rr Rr Rr Rr Rr Rr Rr Rr Rr Rr Rr Rewan Group Rewan Group Rewan Group Rewan Group Rewan Group Rewan Group Rewan Group Rewan Group Rewan Group Rewan Group Rewan Group Rewan Group Rewan Group Rewan Group Rewan Group Rewan Group Rewan Group Rewan Group Rewan Group Rewan Group Rewan Group Rewan Group Rewan Group Rewan Group Rewan Group Rewan Group Rewan Group Rewan Group Rewan Group Rewan Group Rewan Group Rewan Group Rewan Group Rewan Group Rewan Group Rewan Group Rewan Group Rewan Group Rewan Group Rewan Group Rewan Group Rewan Group Rewan Group Rewan Group Rewan Group Rewan Group Rewan Group Rewan Group Rewan Group Qr Qr Qr Qr Qr Qr Qr Qr Qr Qr Qr Qr Qr Qr Qr Qr Qr Qr Qr Qr Qr Qr Qr Qr Qr Qr Qr Qr Qr Qr Qr Qr Qr Qr Qr Qr Qr Qr Qr Qr Qr Qr Qr Qr Qr Qr Qr Qr Qr Qr-QLD Qr-QLD Qr-QLD Qr-QLD Qr-QLD Qr-QLD Qr-QLD Qr-QLD Qr-QLD Qr-QLD Qr-QLD Qr-QLD Qr-QLD Qr-QLD Qr-QLD Qr-QLD Qr-QLD Qr-QLD Qr-QLD Qr-QLD Qr-QLD Qr-QLD Qr-QLD Qr-QLD Qr-QLD Qr-QLD Qr-QLD Qr-QLD Qr-QLD Qr-QLD Qr-QLD Qr-QLD Qr-QLD Qr-QLD Qr-QLD Qr-QLD Qr-QLD Qr-QLD Qr-QLD Qr-QLD Qr-QLD Qr-QLD Qr-QLD Qr-QLD Qr-QLD Qr-QLD Qr-QLD Qr-QLD Qr-QLD d d d d d d d d d d d d d d d d d d d d d d d d d d d d d d d d d d d d d d d d d d d d d d d d d German Creek Formation German Creek Formation German Creek Formation German Creek Formation German Creek Formation German Creek Formation German Creek Formation German Creek Formation German Creek Formation German Creek Formation German Creek Formation German Creek Formation German Creek Formation German Creek Formation German Creek Formation German Creek Formation German Creek Formation German Creek Formation German Creek Formation German Creek Formation German Creek Formation German Creek Formation German Creek Formation German Creek Formation German Creek Formation German Creek Formation German Creek Formation German Creek Formation German Creek Formation German Creek Formation German Creek Formation German Creek Formation German Creek Formation German Creek Formation German Creek Formation German Creek Formation German Creek Formation German Creek Formation German Creek Formation German Creek Formation German Creek Formation German Creek Formation German Creek Formation German Creek Formation German Creek Formation German Creek Formation German Creek Formation German Creek Formation German Creek Formation Pwt Pwt Pwt Pwt Pwt Pwt Pwt Pwt Pwt Pwt Pwt Pwt Pwt Pwt Pwt Pwt Pwt Pwt Pwt Pwt Pwt Pwt Pwt Pwt Pwt Pwt Pwt Pwt Pwt Pwt Pwt Pwt Pwt Pwt Pwt Pwt Pwt Pwt Pwt Pwt Pwt Pwt Pwt Pwt Pwt Pwt Pwt Pwt Pwt Fair Hill Formation Fair Hill Formation Fair Hill Formation Fair Hill Formation Fair Hill Formation Fair Hill Formation Fair Hill Formation Fair Hill Formation Fair Hill Formation Fair Hill Formation Fair Hill Formation Fair Hill Formation Fair Hill Formation Fair Hill Formation Fair Hill Formation Fair Hill Formation Fair Hill Formation Fair Hill Formation Fair Hill Formation Fair Hill Formation Fair Hill Formation Fair Hill Formation Fair Hill Formation Fair Hill Formation Fair Hill Formation Fair Hill Formation Fair Hill Formation Fair Hill Formation Fair Hill Formation Fair Hill Formation Fair Hill Formation Fair Hill Formation Fair Hill Formation Fair Hill Formation Fair Hill Formation Fair Hill Formation Fair Hill Formation Fair Hill Formation Fair Hill Formation Fair Hill Formation Fair Hill Formation Fair Hill Formation Fair Hill Formation Fair Hill Formation Fair Hill Formation Fair Hill Formation Fair Hill Formation Fair Hill Formation Fair Hill Formation MOUNT STUART ROAD MOUNT STUART ROAD MOUNT STUART ROAD MOUNT STUART ROAD MOUNT STUART ROAD MOUNT STUART ROAD MOUNT STUART ROAD MOUNT STUART ROAD MOUNT STUART ROAD MOUNT STUART ROAD MOUNT STUART ROAD MOUNT STUART ROAD MOUNT STUART ROAD MOUNT STUART ROAD MOUNT STUART ROAD MOUNT STUART ROAD MOUNT STUART ROAD MOUNT STUART ROAD MOUNT STUART ROAD MOUNT STUART ROAD MOUNT STUART ROAD MOUNT STUART ROAD MOUNT STUART ROAD MOUNT STUART ROAD MOUNT STUART ROAD MOUNT STUART ROAD MOUNT STUART ROAD MOUNT STUART ROAD MOUNT STUART ROAD MOUNT STUART ROAD MOUNT STUART ROAD MOUNT STUART ROAD MOUNT STUART ROAD MOUNT STUART ROAD MOUNT STUART ROAD MOUNT STUART ROAD MOUNT STUART ROAD MOUNT STUART ROAD MOUNT STUART ROAD MOUNT STUART ROAD MOUNT STUART ROAD MOUNT STUART ROAD MOUNT STUART ROAD MOUNT STUART ROAD MOUNT STUART ROAD MOUNT STUART ROAD MOUNT STUART ROAD MOUNT STUART ROAD MOUNT STUART ROAD FOLEY ROAD FOLEY ROAD FOLEY ROAD FOLEY ROAD FOLEY ROAD FOLEY ROAD FOLEY ROAD FOLEY ROAD FOLEY ROAD FOLEY ROAD FOLEY ROAD FOLEY ROAD FOLEY ROAD FOLEY ROAD FOLEY ROAD FOLEY ROAD FOLEY ROAD FOLEY ROAD FOLEY ROAD FOLEY ROAD FOLEY ROAD FOLEY ROAD FOLEY ROAD FOLEY ROAD FOLEY ROAD FOLEY ROAD FOLEY ROAD FOLEY ROAD FOLEY ROAD FOLEY ROAD FOLEY ROAD FOLEY ROAD FOLEY ROAD FOLEY ROAD FOLEY ROAD FOLEY ROAD FOLEY ROAD FOLEY ROAD FOLEY ROAD FOLEY ROAD FOLEY ROAD FOLEY ROAD FOLEY ROAD FOLEY ROAD FOLEY ROAD FOLEY ROAD FOLEY ROAD FOLEY ROAD FOLEY ROAD YAN YAN ROAD YAN YAN ROAD YAN YAN ROAD YAN YAN ROAD YAN YAN ROAD YAN YAN ROAD YAN YAN ROAD YAN YAN ROAD YAN YAN ROAD YAN YAN ROAD YAN YAN ROAD YAN YAN ROAD YAN YAN ROAD YAN YAN ROAD YAN YAN ROAD YAN YAN ROAD YAN YAN ROAD YAN YAN ROAD YAN YAN ROAD YAN YAN ROAD YAN YAN ROAD YAN YAN ROAD YAN YAN ROAD YAN YAN ROAD YAN YAN ROAD YAN YAN ROAD YAN YAN ROAD YAN YAN ROAD YAN YAN ROAD YAN YAN ROAD YAN YAN ROAD YAN YAN ROAD YAN YAN ROAD YAN YAN ROAD YAN YAN ROAD YAN YAN ROAD YAN YAN ROAD YAN YAN ROAD YAN YAN ROAD YAN YAN ROAD YAN YAN ROAD YAN YAN ROAD YAN YAN ROAD YAN YAN ROAD YAN YAN ROAD YAN YAN ROAD YAN YAN ROAD YAN YAN ROAD YAN YAN ROAD WYUNA ROAD WYUNA ROAD WYUNA ROAD WYUNA ROAD WYUNA ROAD WYUNA ROAD WYUNA ROAD WYUNA ROAD WYUNA ROAD WYUNA ROAD WYUNA ROAD WYUNA ROAD WYUNA ROAD WYUNA ROAD WYUNA ROAD WYUNA ROAD WYUNA ROAD WYUNA ROAD WYUNA ROAD WYUNA ROAD WYUNA ROAD WYUNA ROAD WYUNA ROAD WYUNA ROAD WYUNA ROAD WYUNA ROAD WYUNA ROAD WYUNA ROAD WYUNA ROAD WYUNA ROAD WYUNA ROAD WYUNA ROAD WYUNA ROAD WYUNA ROAD WYUNA ROAD WYUNA ROAD WYUNA ROAD WYUNA ROAD WYUNA ROAD WYUNA ROAD WYUNA ROAD WYUNA ROAD WYUNA ROAD WYUNA ROAD WYUNA ROAD WYUNA ROAD WYUNA ROAD WYUNA ROAD WYUNA ROAD FAIRHILLS ROAD FAIRHILLS ROAD FAIRHILLS ROAD FAIRHILLS ROAD FAIRHILLS ROAD FAIRHILLS ROAD FAIRHILLS ROAD FAIRHILLS ROAD FAIRHILLS ROAD FAIRHILLS ROAD FAIRHILLS ROAD FAIRHILLS ROAD FAIRHILLS ROAD FAIRHILLS ROAD FAIRHILLS ROAD FAIRHILLS ROAD FAIRHILLS ROAD FAIRHILLS ROAD FAIRHILLS ROAD FAIRHILLS ROAD FAIRHILLS ROAD FAIRHILLS ROAD FAIRHILLS ROAD FAIRHILLS ROAD FAIRHILLS ROAD FAIRHILLS ROAD FAIRHILLS ROAD FAIRHILLS ROAD FAIRHILLS ROAD FAIRHILLS ROAD FAIRHILLS ROAD FAIRHILLS ROAD FAIRHILLS ROAD FAIRHILLS ROAD FAIRHILLS ROAD FAIRHILLS ROAD FAIRHILLS ROAD FAIRHILLS ROAD FAIRHILLS ROAD FAIRHILLS ROAD FAIRHILLS ROAD FAIRHILLS ROAD FAIRHILLS ROAD FAIRHILLS ROAD FAIRHILLS ROAD FAIRHILLS ROAD FAIRHILLS ROAD FAIRHILLS ROAD FAIRHILLS ROAD FAIRHILL ROAD FAIRHILL ROAD FAIRHILL ROAD FAIRHILL ROAD FAIRHILL ROAD FAIRHILL ROAD FAIRHILL ROAD FAIRHILL ROAD FAIRHILL ROAD FAIRHILL ROAD FAIRHILL ROAD FAIRHILL ROAD FAIRHILL ROAD FAIRHILL ROAD FAIRHILL ROAD FAIRHILL ROAD FAIRHILL ROAD FAIRHILL ROAD FAIRHILL ROAD FAIRHILL ROAD FAIRHILL ROAD FAIRHILL ROAD FAIRHILL ROAD FAIRHILL ROAD FAIRHILL ROAD FAIRHILL ROAD FAIRHILL ROAD FAIRHILL ROAD FAIRHILL ROAD FAIRHILL ROAD FAIRHILL ROAD FAIRHILL ROAD FAIRHILL ROAD FAIRHILL ROAD FAIRHILL ROAD FAIRHILL ROAD FAIRHILL ROAD FAIRHILL ROAD FAIRHILL ROAD FAIRHILL ROAD FAIRHILL ROAD FAIRHILL ROAD FAIRHILL ROAD FAIRHILL ROAD FAIRHILL ROAD FAIRHILL ROAD FAIRHILL ROAD FAIRHILL ROAD FAIRHILL ROAD MONTROSE ROAD MONTROSE ROAD MONTROSE ROAD MONTROSE ROAD MONTROSE ROAD MONTROSE ROAD MONTROSE ROAD MONTROSE ROAD MONTROSE ROAD MONTROSE ROAD MONTROSE ROAD MONTROSE ROAD MONTROSE ROAD MONTROSE ROAD MONTROSE ROAD MONTROSE ROAD MONTROSE ROAD MONTROSE ROAD MONTROSE ROAD MONTROSE ROAD MONTROSE ROAD MONTROSE ROAD MONTROSE ROAD MONTROSE ROAD MONTROSE ROAD MONTROSE ROAD MONTROSE ROAD MONTROSE ROAD MONTROSE ROAD MONTROSE ROAD MONTROSE ROAD MONTROSE ROAD MONTROSE ROAD MONTROSE ROAD MONTROSE ROAD MONTROSE ROAD MONTROSE ROAD MONTROSE ROAD MONTROSE ROAD MONTROSE ROAD MONTROSE ROAD MONTROSE ROAD MONTROSE ROAD MONTROSE ROAD MONTROSE ROAD MONTROSE ROAD MONTROSE ROAD MONTROSE ROAD MONTROSE ROAD GORDON ROAD GORDON ROAD GORDON ROAD GORDON ROAD GORDON ROAD GORDON ROAD GORDON ROAD GORDON ROAD GORDON ROAD GORDON ROAD GORDON ROAD GORDON ROAD GORDON ROAD GORDON ROAD GORDON ROAD GORDON ROAD GORDON ROAD GORDON ROAD GORDON ROAD GORDON ROAD GORDON ROAD GORDON ROAD GORDON ROAD GORDON ROAD GORDON ROAD GORDON ROAD GORDON ROAD GORDON ROAD GORDON ROAD GORDON ROAD GORDON ROAD GORDON ROAD GORDON ROAD GORDON ROAD GORDON ROAD GORDON ROAD GORDON ROAD GORDON ROAD GORDON ROAD GORDON ROAD GORDON ROAD GORDON ROAD GORDON ROAD GORDON ROAD GORDON ROAD GORDON ROAD GORDON ROAD GORDON ROAD GORDON ROAD GREGORY MINE GREGORY MINE GREGORY MINE GREGORY MINE GREGORY MINE GREGORY MINE GREGORY MINE GREGORY MINE GREGORY MINE GREGORY MINE GREGORY MINE GREGORY MINE GREGORY MINE GREGORY MINE GREGORY MINE GREGORY MINE GREGORY MINE GREGORY MINE GREGORY MINE GREGORY MINE GREGORY MINE GREGORY MINE GREGORY MINE GREGORY MINE GREGORY MINE GREGORY MINE GREGORY MINE GREGORY MINE GREGORY MINE GREGORY MINE GREGORY MINE GREGORY MINE GREGORY MINE GREGORY MINE GREGORY MINE GREGORY MINE GREGORY MINE GREGORY MINE GREGORY MINE GREGORY MINE GREGORY MINE GREGORY MINE GREGORY MINE GREGORY MINE GREGORY MINE GREGORY MINE GREGORY MINE GREGORY MINE GREGORY MINE YAMBOYNA YAMBOYNA YAMBOYNA YAMBOYNA YAMBOYNA YAMBOYNA YAMBOYNA YAMBOYNA YAMBOYNA YAMBOYNA YAMBOYNA YAMBOYNA YAMBOYNA YAMBOYNA YAMBOYNA YAMBOYNA YAMBOYNA YAMBOYNA YAMBOYNA YAMBOYNA YAMBOYNA YAMBOYNA YAMBOYNA YAMBOYNA YAMBOYNA YAMBOYNA YAMBOYNA YAMBOYNA YAMBOYNA YAMBOYNA YAMBOYNA YAMBOYNA YAMBOYNA YAMBOYNA YAMBOYNA YAMBOYNA YAMBOYNA YAMBOYNA YAMBOYNA YAMBOYNA YAMBOYNA YAMBOYNA YAMBOYNA YAMBOYNA YAMBOYNA YAMBOYNA YAMBOYNA YAMBOYNA YAMBOYNA BULLERY BULLERY BULLERY BULLERY BULLERY BULLERY BULLERY BULLERY BULLERY BULLERY BULLERY BULLERY BULLERY BULLERY BULLERY BULLERY BULLERY BULLERY BULLERY BULLERY BULLERY BULLERY BULLERY BULLERY BULLERY BULLERY BULLERY BULLERY BULLERY BULLERY BULLERY BULLERY BULLERY BULLERY BULLERY BULLERY BULLERY BULLERY BULLERY BULLERY BULLERY BULLERY BULLERY BULLERY BULLERY BULLERY BULLERY BULLERY BULLERY AMAH AMAH AMAH AMAH AMAH AMAH AMAH AMAH AMAH AMAH AMAH AMAH AMAH AMAH AMAH AMAH AMAH AMAH AMAH AMAH AMAH AMAH AMAH AMAH AMAH AMAH AMAH AMAH AMAH AMAH AMAH AMAH AMAH AMAH AMAH AMAH AMAH AMAH AMAH AMAH AMAH AMAH AMAH AMAH AMAH AMAH AMAH AMAH AMAH LANGLEY DOWNS LANGLEY DOWNS LANGLEY DOWNS LANGLEY DOWNS LANGLEY DOWNS LANGLEY DOWNS LANGLEY DOWNS LANGLEY DOWNS LANGLEY DOWNS LANGLEY DOWNS LANGLEY DOWNS LANGLEY DOWNS LANGLEY DOWNS LANGLEY DOWNS LANGLEY DOWNS LANGLEY DOWNS LANGLEY DOWNS LANGLEY DOWNS LANGLEY DOWNS LANGLEY DOWNS LANGLEY DOWNS LANGLEY DOWNS LANGLEY DOWNS LANGLEY DOWNS LANGLEY DOWNS LANGLEY DOWNS LANGLEY DOWNS LANGLEY DOWNS LANGLEY DOWNS LANGLEY DOWNS LANGLEY DOWNS LANGLEY DOWNS LANGLEY DOWNS LANGLEY DOWNS LANGLEY DOWNS LANGLEY DOWNS LANGLEY DOWNS LANGLEY DOWNS LANGLEY DOWNS LANGLEY DOWNS LANGLEY DOWNS LANGLEY DOWNS LANGLEY DOWNS LANGLEY DOWNS LANGLEY DOWNS LANGLEY DOWNS LANGLEY DOWNS LANGLEY DOWNS LANGLEY DOWNS FAIRHILL FAIRHILL FAIRHILL FAIRHILL FAIRHILL FAIRHILL FAIRHILL FAIRHILL FAIRHILL FAIRHILL FAIRHILL FAIRHILL FAIRHILL FAIRHILL FAIRHILL FAIRHILL FAIRHILL FAIRHILL FAIRHILL FAIRHILL FAIRHILL FAIRHILL FAIRHILL FAIRHILL FAIRHILL FAIRHILL FAIRHILL FAIRHILL FAIRHILL FAIRHILL FAIRHILL FAIRHILL FAIRHILL FAIRHILL FAIRHILL FAIRHILL FAIRHILL FAIRHILL FAIRHILL FAIRHILL FAIRHILL FAIRHILL FAIRHILL FAIRHILL FAIRHILL FAIRHILL FAIRHILL FAIRHILL FAIRHILL JUREMA JUREMA JUREMA JUREMA JUREMA JUREMA JUREMA JUREMA JUREMA JUREMA JUREMA JUREMA JUREMA JUREMA JUREMA JUREMA JUREMA JUREMA JUREMA JUREMA JUREMA JUREMA JUREMA JUREMA JUREMA JUREMA JUREMA JUREMA JUREMA JUREMA JUREMA JUREMA JUREMA JUREMA JUREMA JUREMA JUREMA JUREMA JUREMA JUREMA JUREMA JUREMA JUREMA JUREMA JUREMA JUREMA JUREMA JUREMA JUREMA KABLEBARA KABLEBARA KABLEBARA KABLEBARA KABLEBARA KABLEBARA KABLEBARA KABLEBARA KABLEBARA KABLEBARA KABLEBARA KABLEBARA KABLEBARA KABLEBARA KABLEBARA KABLEBARA KABLEBARA KABLEBARA KABLEBARA KABLEBARA KABLEBARA KABLEBARA KABLEBARA KABLEBARA KABLEBARA KABLEBARA KABLEBARA KABLEBARA KABLEBARA KABLEBARA KABLEBARA KABLEBARA KABLEBARA KABLEBARA KABLEBARA KABLEBARA KABLEBARA KABLEBARA KABLEBARA KABLEBARA KABLEBARA KABLEBARA KABLEBARA KABLEBARA KABLEBARA KABLEBARA KABLEBARA KABLEBARA KABLEBARA CHIRNSIDE CHIRNSIDE CHIRNSIDE CHIRNSIDE CHIRNSIDE CHIRNSIDE CHIRNSIDE CHIRNSIDE CHIRNSIDE CHIRNSIDE CHIRNSIDE CHIRNSIDE CHIRNSIDE CHIRNSIDE CHIRNSIDE CHIRNSIDE CHIRNSIDE CHIRNSIDE CHIRNSIDE CHIRNSIDE CHIRNSIDE CHIRNSIDE CHIRNSIDE CHIRNSIDE CHIRNSIDE CHIRNSIDE CHIRNSIDE CHIRNSIDE CHIRNSIDE CHIRNSIDE CHIRNSIDE CHIRNSIDE CHIRNSIDE CHIRNSIDE CHIRNSIDE CHIRNSIDE CHIRNSIDE CHIRNSIDE CHIRNSIDE CHIRNSIDE CHIRNSIDE CHIRNSIDE CHIRNSIDE CHIRNSIDE CHIRNSIDE CHIRNSIDE CHIRNSIDE CHIRNSIDE CHIRNSIDE CUDDENSEN CUDDENSEN CUDDENSEN CUDDENSEN CUDDENSEN CUDDENSEN CUDDENSEN CUDDENSEN CUDDENSEN CUDDENSEN CUDDENSEN CUDDENSEN CUDDENSEN CUDDENSEN CUDDENSEN CUDDENSEN CUDDENSEN CUDDENSEN CUDDENSEN CUDDENSEN CUDDENSEN CUDDENSEN CUDDENSEN CUDDENSEN CUDDENSEN CUDDENSEN CUDDENSEN CUDDENSEN CUDDENSEN CUDDENSEN CUDDENSEN CUDDENSEN CUDDENSEN CUDDENSEN CUDDENSEN CUDDENSEN CUDDENSEN CUDDENSEN CUDDENSEN CUDDENSEN CUDDENSEN CUDDENSEN CUDDENSEN CUDDENSEN CUDDENSEN CUDDENSEN CUDDENSEN CUDDENSEN CUDDENSEN LEGEND Current Panel Layout Kestrel Extension #4 Towns Roads Crinum Creek
23 #
24 Table 2.1 Simplified stratigraphy for the Kestrel Extension #4 Age Group Unit Description Average Thickness (m) Occurrence rtiary Volcanics Basalt Fresh to extremely weathered. Fresh basalt may be massive and highly fractured. 20 Two separate flows identified in the Crinum area and northern section of Kestrel leases. Flows separated by ~20 m clay bed(s). Sediments Clay Fluvial origin. 20 Contiguous across the mining lease Basal Sand Fine to coarse sand water bearing layer interbedded with clay to sandy clay beds. Variable 0 to 25 Basal sands and clay beds are contiguous across the site. However, individual beds have a variable thickness and are discontinuous. Permian Blackwater Group Fair Hill Formation Lithic and feldspathic labile sandstone, quartzose sublabile sandstone, siltstone, mudstone, calcareous and tuffaceous sandstone, volcanic conglomerate, carbonaceous mudstone and coal. 100 Restricted to small area at top of synclinal limb. Fault bounded. McMillan Formation Lithic and feldspathic sublabile mudstone, siltstone and sandstone. 45 Gentle synclinal structure between base of Fair Hill Formation and Back Creek Group. Back Creek Group German Creek Formation Quartzose to lithic sandstone, siltstone, carbonaceous shale, minor coal and sandy coquinite. Pleiades Upper Seam Pleiades Lower Seam Aquila Seam Tieri 1 Seam Tieri 2 Seam Corvus Seam German Creek Seam Fault bound. A gentle synclinal structure. PR REP-001; Rev 0 / 26 June 2012
25 #
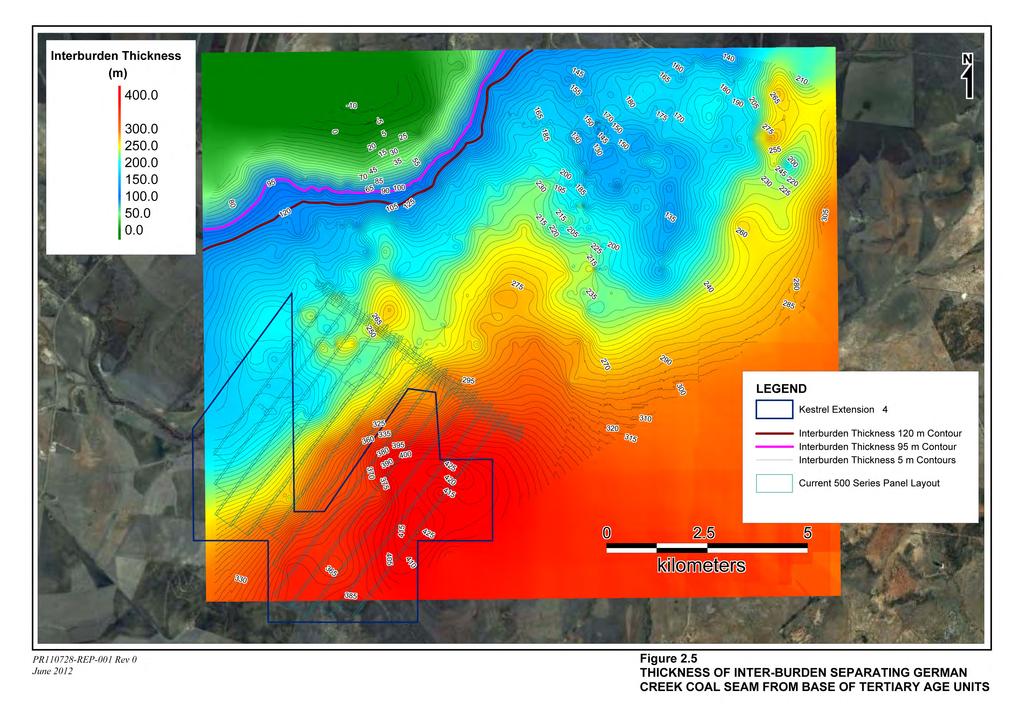
26 2.3 Relevant geological data for area overlain by proposed Kestrel Extension #4 The proposal to mine the 3 to 4 m thick German Creek Coal Seam, using the long-wall mining technique, will result in collapse goafing of the overlying strata as mining progresses. The collapsing strata will fracture the inter-burden separating the Permian Age coal-bearing strata from the water-bearing rtiary Age Basal Sand unit. Seepage of groundwater into the mine workings will occur if the goafing induced fractures connect the Basal Sands with the German Creek Coal Seam. Therefore, an understanding of the thickness, hydrogeology and fracturing properties is required to predict inflows in to the mine from the Basal Sands accurately. Fracturing of the Permian Age inter-burden is only anticipated to result in significant inflows into the mine workings from the Basal Sands where the inter-burden is thin (Section 2.4). The volume of the groundwater available to flow into the mine workings from the rtiary age units is largely a function of the saturated thickness of the Basal Sands and the lateral continuity of the individual water-bearing sand beds. Matrix Plus (2008) documented discontinuous clay beds within the Basal Sands that may inhibit vertical groundwater flow. The inter-burden thickness, which is the thickness of the Permian Age rocks that lie between the rtiary Age Basal Sands and the German Creek Coal Seam, varies considerably across the Kestrel Mine Expansion. From Figure 2.5 it is clear that the interburden thickness is in well excess of 160 m over the entirety of Kestrel Extension #4, and in excess of 400 m in the south eastern section of the proposed panels within Kestrel Extension # Likelihood of vertical seepage due to fracture propagation in the inter-burden Geotechnical studies of the Kestrel Mine Extension concluded that goaf induced fracturing could extend potentially up to 120 m above the mined coal seam. The data review also indicated that within the Kestrel Mine Extension area that groundwater levels in both the Permian Age and rtiary Age Basal Sand water-bearing units have been impacted by mining at Crinum with a substantial decline in groundwater levels in both aquifers in the northern part of the extension area adjoining Crinum. Seedsman (2002) indicated that an appropriate fracturing model for the Kestrel Mine Expansion would be: Fracturing extending 120 m upward from the seam; Fracturing extending 15 m downward from the surface; Groundwater inflow to the mine resulting from fractures extending up from the seam sufficient distance to intersect an aquifer; and Surface water inflow if fractures extend from the surface downward a sufficient distance to intersect the seam. Matrix Plus (2006) noted that Seedsman Geotechnical had subsequently confirmed that this fracturing model remained valid for the 2006 Kestrel Mine Extension Project. Seedsman (2005) also noted that "Experience from the Crinum long-wall area indicates that hydrogeologic interconnection occurs when the inter-burden thickness is m". PR REP-001; Rev 0 / 26 June 2012 Page 22
27 Seedsman (2007), indicated for the Crinum East underground mine that "Interconnection to the SA0 (basalt sand) at inter-burden thickness of less than 105 m can be expected over long-walls 16 to 20, and it is recommended that in a risk assessment context you also consider interconnection at 115 m". Previous modelling work undertaken by RPS has adopted critical inter-burden thicknesses of m for basal sands and up to 105 m for basalts. PR REP-001; Rev 0 / 26 June 2012 Page 23
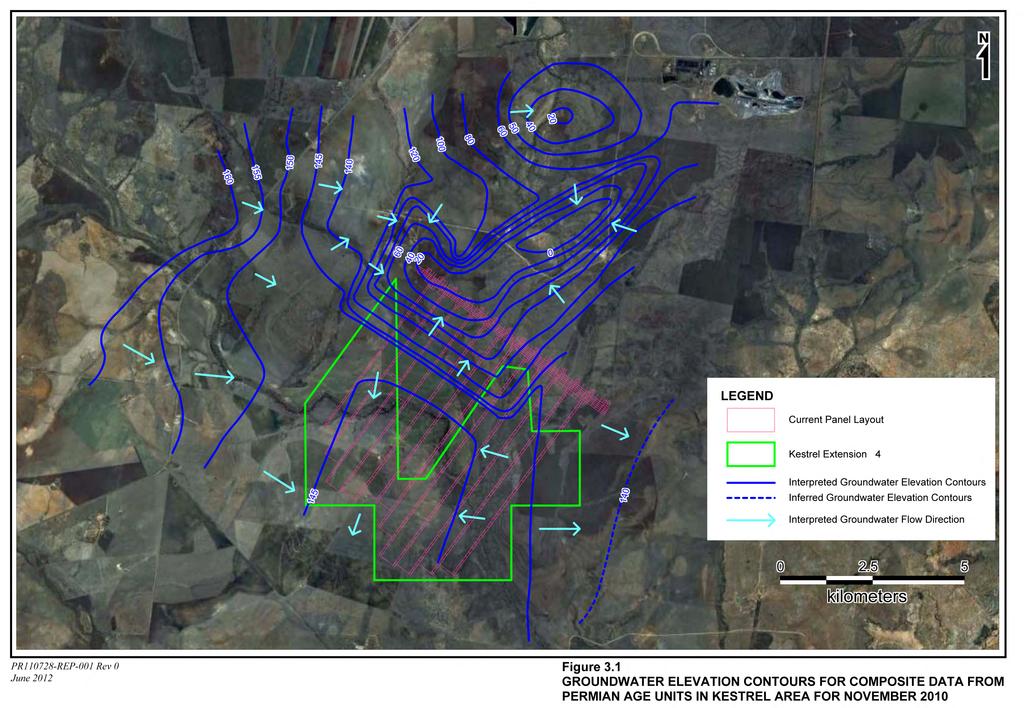
28 3.0 Assessment of incremental impact to key groundwater bearing formations 3.1 Assessment of incremental impact to rtiary Age sands Given that the minimum inter-burden thickness between the top of the German Creek Seam and the base of the rtiary age unit is not less than 160 m across the entire of the proposed footprint of the panels for Kestrel Extension #4 there should be no fracture enhanced vertical hydraulic connectivity between the Kestrel underground workings and the rtiary Age formations which host the significant aquifers of the Kestrel area. Because of this no additional / incremental groundwater impact should occur to the rtiary Age sands associated with the long-wall panels in Kestrel Extension # Assessment of incremental impact to rtiary Age basalts Similarly to the assessment for the rtiary age sands, there should be no fracture enhanced vertical hydraulic connectivity between the Kestrel underground workings for Kestrel Extension #4 and the rtiary Age formations which host the significant aquifers of the Kestrel area. Accordingly no additional / incremental groundwater impact should occur to the rtiary Age basalts associated with the long-wall panels in Kestrel Extension # Assessment of incremental impact to Permian Age formations Groundwater will be drawn from the German Creek Seam for advance mine dewatering and will enter the workings in Kestrel Extension #4 from the seam during operations. Groundwater entering the long-wall workings from the German Creek Seam will be initially pumped to the surface for re-use and management. On the longer-term at the cessation of mining the long-wall areas will be allowed to flood. Figure 3.1 indicates groundwater elevation contours for a composite of data from Permian Age units in the Kestrel area for November Although the pre-development groundwater flow pattern for the Permian age unit would have been generally in a southerly direction towards the Nogoa River Valley, it is clear from Figure 3.1 that the historical and current underground mining operations at Kestrel and Crinum Mines have appreciably impacted on groundwater levels in the Permian Age unit. Figure 3.1 indicates that there are significant pumping depressions in the north of the 400 series panels and to the north. These depressions are associated with the historical Crinum South operations, the Kestrel 300 series panels and current advance dewatering for the Kestrel Mine Extension operation. Matrix Plus Consultants (2006) previously reviewed hydrogeological assessment work undertaken for the broader Kestrel area by AGE Consultants (AGE, 2002) to support assessment of the 2006 Kestrel Mine Extension Project (KMEP) and ascertain whether the 2006 proposal would change previous groundwater impact predictions. Matrix Plus Consultants (2006) noted that numerical modelling of the German Creek Seam for the 2003 proposal (encompassing the full development of the extension area to 2029) by AGE (2002) had been undertaken to provide an assessment of potential groundwater inflows to the mine workings and from the seam itself. Matrix Plus Consulting (2006) noted that predictive modelling for the 2003 proposal had indicated that inflow from the German Creek seam reached a relatively steady rate of about 8 L/s after approximately seven years of mining, although there would be an additional inflow from overlying permeable Permian Age strata as a result of goafing. Matrix Plus Consulting (2006) also noted that a conservative assessment of the contribution of overlying Permian Age strata to the inflow rate had shown PR REP-001; Rev 0 / 26 June 2012 Page 24
29 that if goafing was to intersect permeable strata, total inflow from the Permian Age units may increase to 25 L/s. Matrix Plus Consulting (2006) also noted that because the gateroads would generally be constructed well in advance of mining, significant dewatering of each of the long-wall panels would occur prior to mining. Matrix Plus Consulting (2006) suggested that from a hydrogeological perspective, the most significant impact resulting from the proposed Kestrel Mine Extension Project mine expansion activities would likely be the long-term dewatering of groundwater within the German Creek coal seam. Matrix Plus Consulting (2006) noted that predictive groundwater flow modelling had indicated that dewatering impacts in the Permian Age aquifer would likely to occur up to 8 km from the mining panels, although the propagation of drawdown impact would likely be restricted by major faults. Matrix Plus Consulting (2006) stated that subsidence associated with the 500 series long-wall panels for the Kestrel Mine Extension Project was not likely to have a significant impact on groundwater users / aquifers, except for three water supply bores located immediately above the proposed Kestrel Mine Extension Project area. Matrix Plus Consultants (2006) concluded that because the realigned long-wall panels for the Kestrel Mine Extension Project were located through the same geology, same aquifers and same depth of cover as the previous 2003 mine layout, it was reasonable to assume that the potential for impacts associated with the revised 2006 Kestrel Mine Extension Project mine plan would be similar to those predicted in the 2003 studies. Matrix Plus Consulting (2006) indicated that undertaking additional modelling to reproduce the methodology and complexity of the AGE (2002) numerical model through incorporation of the 2006 revised mine plan would not result in any significant change to the outcomes previously presented. This is reasonable and given the relatively minor changes between the currently proposed footprint for the 500 series panels in the Kestrel Extension #4 area and the corresponding layout for 2006, additional numerical modelling to assess the incremental groundwater impact to the Permian Age units associated with the development of the 500 series panels within Kestrel Extension #4 is not warranted. Figure 1.2 indicates the previously proposed configuration over the currently proposed configuration for the 500 series long-wall panels. The impact to the Permian Age aquifer and its existing groundwater users associated with the currently proposed alignment of the 500 series panels within Kestrel Extension #4 should not be significantly greater than for the currently approved panel layout as assessed by Matrix Plus Consulting (2006) because of only limited changes (approximately 9.5% increase) to the footprint area of the overall (400 plus 500 series) panel area assessed in modelling by AGE (2002). In referring to alterations in panel layouts Matrix Plus (2007) indicated that changes to the orientation of the 500 series panels associated within Kestrel Extension #4 and the additional areas within MDL 182 are likely to be similar to previous assessments. The Environment Management Plan is considered to provide sufficient commitments for the management and mitigation of groundwater for Kestrel Extension #4. Given the negligible incremental impact associated with the currently proposed panel layout for Kestrel Extension #4, there would be no reason to alter the previously proposed mitigation strategies. With respect to these mitigation strategies Matrix Plus (2006) noted that bores tapping the Permian Age unit typically yield water quality that is brackish to saline and is commonly not suitable for stock or domestic use however if these bores are required for water supply and are impacted to an unacceptable level, additional bores may be required within other aquifers (i.e. rtiary Age aquifers) to maintain an acceptable water supply. This is a reasonable mitigation strategy but should be supported by systematic observation of groundwater levels in private bores. PR REP-001; Rev 0 / 26 June 2012 Page 25

30 #
31 4.0 Conclusions The following key conclusions are made: A review of available reporting indicates that enhanced vertically hydraulic connection between the rtiary age formations and the underground long-wall workings suggests that at Crinum South the critical minimum inter-burden thickness has been 95 to 100 m, the critical inter-burden thickness for Crinum East has been recommended to be 115 m, and for Kestrel Mine Expansion the critical interburden thickness has been 120 m. A review of the available geological data for the area underlain by the currently proposed 500 series long-wall panels for Kestrel Extension #4 indicate inter-burden thickness values from the top of the German Creek Seam to the base of the rtiary age units that range from in excess of 160 m to excess of 400 m. The rtiary Age sediments in the broader Kestrel Mine area form useful aquifers although of spatially heterogeneous nature and yield, and these sediments supply some groundwater supplies. Given that the minimum inter-burden thickness between the top of the German Creek Seam and the base of the rtiary age unit is not less than 160 m across the entire of the proposed footprint of the 500 series long-wall panels for Kestrel Extension #4 there should be no fracture enhanced vertical hydraulic connectivity between the Kestrel underground workings in Kestrel Extension #4 and the rtiary Age formations which host the significant aquifers of the Kestrel area. Because of this no additional / incremental groundwater impact should occur to the rtiary Age sediments associated with the 500 series long-wall panels in Kestrel Extension #4. The rtiary age basalts in the broader Kestrel Mine area form useful aquifers although of spatially heterogeneous nature and yield, and these rocks supply numerous small groundwater supplies. There should be no fracture enhanced vertical hydraulic connectivity between the underground workings in Kestrel Extension #4 and the rtiary Age formations which host the significant aquifers of the broader Kestrel area. Accordingly no additional / incremental groundwater impact should occur to the rtiary Age basalts associated with the 500 series long-wall panels in Kestrel Extension #4. Groundwater will be drawn from the German Creek Seam for advance mine dewatering and will enter the workings from the seam albeit at generally very low rates (typical reported inflows attributed solely to the Permian Age rocks have only been in the order of 4 to 5 L/s with Matrix Plus Consulting 2006 reporting predicted inflows in the order of 8 L/s to a potential conservative 25 L/s if goaf induced fracturing intersected permeable strata in the Permian Age sequence above the German Creek seam. Groundwater entering the long-wall workings from the German Creek Seam will be initially pumped to the surface for re-use and management. On the longer-term at the cessation of mining the long-wall areas will be allowed to flood. The impact to the Permian Age aquifer and its existing groundwater users associated with the currently proposed alignment of the 500 series panels within Kestrel Extension #4 should not be significantly greater than for the currently approved panel layout as assessed by Matrix Plus Consulting (2006) because of only limited increase (approximately 9.5%) to the footprint area of the overall (400 plus 500 series) panel area assessed in modelling by AGE (2002). In the area where there will be marginal change in groundwater level drawdown in the German Creek Coal Seam, the depth to the seam and the German Creek Formation is greater and water bores to tap the German Creek Seam would have to be very deep (i.e. 200 to 400 m deep). Shallower coal seams and formations in the Permian Age sequence will be available there and although there would be some incremental increase in groundwater level drawdown in the German Creek Seam in the south PR REP-001; Rev 0 / 26 June 2012 Page 27
32 and far south of the proposed 500 series long-way panels, the practical incremental impact to access to this minor water source of marginal to unusable quality would be negligible. In referring to alterations in panel layouts Matrix Plus (2007) indicated changes to the orientation of the 500 series panels associated within Kestrel Extension #4 and the additional areas within MDL 182 are likely to be similar to previous assessments. The Environment Management Plan is considered to provide sufficient commitments for the management and mitigation of groundwater for Kestrel Extension #4. Given the negligible incremental impact associated with the currently proposed panel layout for Kestrel Extension #4, there would be no reason to alter the previously proposed mitigation strategies. With respect to these mitigation strategies Matrix Plus (2006) noted that bores tapping the Permian Age unit typically yield water quality that is brackish to saline and is commonly not suitable for stock or domestic use however if these bores are required for water supply and are impacted to an unacceptable level, additional bores may be required within other aquifers (i.e. rtiary Age aquifers) to maintain an acceptable water supply. This is a reasonable mitigation strategy but should be supported by systematic observation of groundwater levels in private bores. PR REP-001; Rev 0 / 26 June 2012 Page 28
33 5.0 References Australasian Groundwater and Environmental Consultants, 2002, Report on Hydrogeological Study Kestrel Mine Extension, prepared for Pacific Coal Pty Ltd, September Matrix Plus Consulting, 2006 Hydrogeology Assessment, August 2006 Matrix Plus Consulting, 2007, Kestrel Mine Environmental Assessment Addendum Report, Final Version 2.4, August 2007 Matrix Plus Consulting, 2008, Rio Tinto Coal Australia and BHP Billiton Mitsubishi Alliance - Kestrel/Gregory-Crinum Regional Groundwater Report, Version 1.0, March Seedsman Geotechnics 2002 Subsidence Prediction for Kestrel Extended Draft, Pacific Coal Pty Ltd. Seedsman Geotechnics Pty Ltd, 2005, Crinum Mine Water Inflow Predictions for Crinum North, June Seedsman Geotechnics Pty Ltd, 2007, Initial Water Inflow Assessment for Long walls 16 to 20 at Crinum East, May Rio Tinto Coal Australia 2011 Initial Advice Statement - Kestrel Extension #4, September 2011 PR REP-001; Rev 0 / 26 June 2012 Page 29
34 This page has been intentionally left blank RP1
35 Appendix F Air quality assessment
36

 9874 2123 Fax: (02) 9874 2125 Email:")
37 AIR QUALITY IMPACT ASSESSMENT KESTREL MINE OPERATIONS KESTREL EXTENSION #4 Prepared for: EMGA Mitchell McLennan 1 July 2012 Job Number Prepared by Todoroski Air Sciences Pty Ltd Suite 2B, 14 Glen Street Eastwood, NSW 2122 Phone: (02) Fax: (02) info@airsciences.com.au
38 Air Quality Impact Assessment Kestrel Mine Operations Kestrel Extension #4 Author(s): Dr. Fardaus Rahaman Philip Henschke Position: Senior Engineer Atmospheric Physicist Signature: Date: 26/06/ /06/2012 DOCUMENT CONTROL Report Version Date Prepared by Reviewed by DRAFT /06/2012 F. Rahaman & P. Henschke A. Todoroski DRAFT /07/2012 P. Henschke A. Todoroski This report has been prepared in accordance with the scope of work between Todoroski Air Sciences Pty Ltd (TAS) and the client. TAS relies on and presumes accurate the information (or lack thereof) made available to it to conduct the work. If this is not the case, the findings of the report may change. TAS has applied the usual care and diligence of the profession prevailing at the time of preparing this report and commensurate with the information available. No other warranty or guarantee is implied in regard to the content and findings of the report. The report has been prepared exclusively for the use of the client, for the stated purpose and must be read in full. No responsibility is accepted for the use of the report or part thereof in any other context or by any third party.
39 EXECUTIVE SUMMARY The Kestrel Mine is an underground mining operation producing high quality coking coal and thermal coal for export using longwall mining technology. The mine is located approximately 30 kilometres (km) north-east of the town Emerald and 300km west of Rockhampton. This study provides a contemporary air quality impact assessment for the proposed Kestrel Extension #4 which makes minor amendments to the Kestrel mine. The study has been conducted to ensure that contemporary standards of environmental performance would be achieved. The baseline mine operation, the currently approved mine operation (underway) and the proposed Kestrel Extension #4 has been assessed. The assessment has also considered several other coal mining operations in the area, along with the estimated background levels of dust to examine potential total cumulative dust levels. The study finds that the baseline, approved and the Kestrel Extension #4 operations have minimal effect on the overall air quality in this area, and that overall there would be no impact above criteria at the sensitive receptor locations around the mine due to the proposed Kestrel Extension #4. The study also found that the proposed Kestrel Extension #4 does not result in any change in the level of air quality impact in comparison with the approved mine operations. It is concluded that the proposed Kestrel Extension #4 can operate without any adverse impacts arising at any receptor.
40 TABLE OF CONTENTS 1 INTRODUCTION PROJECT BACKGROUND Project description Project location AIR QUALITY ASSESSMENT CRITERIA Preamble Particulate matter Legislative Framework Queensland New South Wales Queensland Environmental Protection Act (1994), Section Permit Other air pollutants Adopted Project Goals for the Ambient Air Quality EXISITING ENVIRONMENT Local climate Local air quality MODELLING SCENARIOS Emission estimation for Kestrel Operation Emission estimation for Neighbouring Mines DISPERSION MODELLING APPROACH Introduction Modelling methodology CALMET meteorological modelling Dispersion modelling DISPERSION MODELLING RESULTS Baseline Scenario Current / Proposed Scenario DUST MITIGATION AND MANAGEMENT Dust Management Monitoring Network CONCLUSIONS REFERENCES Appendix A - Long-term Meteorological Analysis Appendix B - Emission Calculations Appendix C - Isopleth Diagrams
41 LIST OF TABLES Table 2-1: Sensitive receptors... 2 Table 3-1: EPP (Air) ambient air quality objectives... 6 Table 3-2: OEH air quality impact assessment criteria... 6 Table 3-3: Project goals for the ambient air quality... 7 Table 4-1: Monthly climate statistics summary - Emerald Airport... 8 Table 4-2: 24 hour average PM 10 monitoring data collected at NEPM North Toowoomba site... 9 Table 4-3: Estimated background level Table 5-1: Summary of estimated dust emissions for the modelling scenarios (kg of TSP / year) Table 5-2: Annual ROM production rate of surrounding mines Table 5-3: Estimated TSP emission from surrounding mines Table 6-1: Surface observation data Table 6-2: Distribution of particles Table 7-1: Modelled predictions for the Current Scenario Table 7-2: Modelled predictions for the Proposed Scenario LIST OF FIGURES Figure 2-1: Project location... 3 Figure 2-2: Representative three dimensional terrain of Project location... 4 Figure 4-1: Monthly climate statistics summary - Emerald Airport... 8 Figure 6-1: Annual and seasonal windroses from CALMET (Cell Ref 6861) Figure 6-2: Meteorological analysis of CALMET (Cell Ref 6861)... 15
42 1 1 INTRODUCTION This report has been prepared by Todoroski Air Sciences (TAS) for EMGA Mitchell McLennan on behalf of Rio Tinto Coal Australia. The report presents an air quality impact assessment (AQIA) for the approved Kestrel Mine and for the proposed amendment to the Kestrel Mine that forms Kestrel Extension #4. The assessment has been prepared to support the environmental assessment report for the authority amendment application for Environmental Authority (EA) MIN The purpose of the assessment is to provide a contemporary air quality impact assessment for the approved Kestrel Mine and the proposed Kestrel Extension #4. This report incorporates the following aspects: A background to the project and description of the Kestrel Extension #4 proposed operations; A review of the existing environment surrounding the project site; A description of the modelling approach used to assess impacts; Presentation of the predicted results; and An assessment of the potential air quality impacts. 2 PROJECT BACKGROUND 2.1 Project description Kestrel Mine is an existing underground mining operation producing high quality coking and thermal coal for export using longwall mining technology (100, 200 and 300 series panels). The mine is approved to produce an average of 7 million tonnes per annum (Mtpa) over the life of the mine of coking and thermal coal from 2013 through the development of 400 and 500 series panels. The approval includes the construction of surface infrastructure (administrative buildings, coal handling stackers, reclaimers, conveyors and temporary infrastructure) and two new drifts to be sunk from the natural ground surface to the German Creek coal seam and one ventilation shaft. Kestrel Extension #4 includes parts of the 500 series longwall panels previously assessed in 2006 that are located within what is currently MDLs 176 and 345 to the south-west. Rio Tinto s internal policies typically require Mining Leases (ML) to be in place five years in advance of mining activities. Long term mine planning indicates that gas drainage works are scheduled to occur in the vicinity of the 500 series longwall panels located in Mineral Development Licence (MDL) 176 and accordingly, a ML is required to be in place by In addition to the above, long term mine planning has identified economic coal resources to occur within MDL 182. The 500 series longwall panels have been reviewed as part of the long term mine planning process resulting in realignment of the layout of the 500 series panels, extending panels 504 to 510 into part of MDL 182. Some re-alignment of the 400 panels are also a result of long term mine planning, however these are within the footprint of the previous layout. FINAL_ _Kestrel_AQIA_120701
43 2 The realignment of panels within MLs 70301, and are outside the scope of this EA amendment, as they would be managed under the existing EA, Environmental Management Plan and Plan of Operations for the relevant period. As part of the process for applying for a ML under the Mineral Resources Act 1989 (MR Act) over MDLs 176 and 345 and part of MDL 182, an application to amend EA MIN under the Environment Protection Act 1994 (EP Act) is required. 2.2 Project location The Project site (see Figure 2-1) is located in central Queensland, approximately 30 kilometres (km) north-east of the town Emerald and 300km west of Rockhampton. It is situated within the Central Highlands Local Government Area and is located on the Gordon Downs property (owned by Rio Tinto Coal Australia and leased to The North Australian Pastoral Company Pty Limited (NAPCo)). The local land use surrounding the Project area is dominated by agricultural activities and coal mining. Figure 2-1 shows the neighbouring coal mining operations, (Crinum Mine and Gregory Mine), and privately-owned sensitive receptors located within a 5km radius of the Kestrel mine. Table 2-1 provides a detailed list of the sensitive receptors assessed in this report. Figure 2-2 shows a representative three-dimensional visualisation of the terrain in the general vicinity of the Project area. The general topography of the area is relatively flat with a gradual increase in elevation to the north of the Project area. Areas to the south have lower elevations which follow various river valleys. Table 2 1: Sensitive receptors Receptor ID Location Easting (m) Northing (m) R R R R R R R R R R R R FINAL_ _Kestrel_AQIA_120701
44 3 Figure 2 1: Project location FINAL_ _Kestrel_AQIA_120701

45 4 Figure 2 2: Representative three dimensional terrain of Project location FINAL_ _Kestrel_AQIA_120701
46 5 3 AIR QUALITY ASSESSMENT CRITERIA 3.1 Preamble Air quality criteria are benchmarks set to protect the general health and amenity of the community in relation to air quality. The sections below identify the potential air emissions generated by the proposed operation and the applicable air quality criteria. 3.2 Particulate matter Particulate matter consists of dust particles of varying size and composition. The total mass of all particles suspended in air is defined as the Total Suspended Particulate matter (TSP). The upper size range for TSP is nominally taken to be 30 micrometres (µm) as in practice particles larger than 30 to 50µm will settle out of the atmosphere too quickly to be regarded as air pollutants. The TSP is defined further into two sub-components. They are PM 10 particles, particulate matter with aerodynamic diameters of 10µm or less, and PM 2.5, particulate matter with aerodynamic diameters of 2.5µm or less. Mining activities generate particles in all the above size categories. The great majority of the particles generated are due to the abrasion or crushing of rock and coal and general disturbance of dusty material. These particulate emissions will be generally larger than 2.5µm as these fine particulates are often only generated through combustion processes. Combustion particulates can be more harmful to human health as the particles have the ability to penetrate deep into the human respiratory system and generally include acidic and carcinogenic substances. A study of the distribution of particle sizes near mining dust sources in 1986 conducted by the NSW State Pollution Control Commission (SPCC) found that the average of approximately 120 samples showed PM 2.5 comprised 4.7% of the TSP, and PM 10 comprised 39.1% of the TSP in the samples (SPCC, 1986). The emissions of PM 2.5 occurring from mining activities are small in comparison to the total dust emissions and in practice, the concentrations of PM 2.5 in the vicinity of mining dust sources are likely to be low. 3.3 Legislative Framework Queensland In Queensland, air quality is managed under the Environmental Protection Act 1994 (the Act), the Environmental Protection Regulation 2008 (the Regulation) and the Environmental Protection (Air) Policy 2008 (EPP (Air)). The purpose of the EPP is to achieve the objectives of the Act in relation to the environment. Schedule 1 of the EPP (Air) specifies the air quality objectives for enhancing or protecting environmental values applicable to: Health and well being; Aesthetic environment; Health and biodiversity of ecosystems; and FINAL_ _Kestrel_AQIA_120701
47 6 Agriculture. Table 3-1 summarises the air quality goals that are included in the EPP (Air) and are relevant to this study. Table 3 1: EPP (Air) ambient air quality objectives Pollutant Averaging Period Impact Criterion Jurisdiction Particulate Matter < 10µm (PM 10 ) 24 hours Total 50 µg/m 3 EPP (Air) Particulate Matter < 24 hours Total 25 µg/m 3 EPP (Air) 2.5 µm (PM 2.5 ) Annual Total 8 µg/m 3 EPP (Air) The EPP also outlines that where criteria for pollutants are not promulgated in QLD, then appropriate relevant criteria applied in other jurisdictions could be considered. In this case, the study has considered relevant criteria applied in NSW in addition to the EPP air quality objectives New South Wales Table 3-2 summarises the air quality goals that are relevant to this study as outlined in the Office of Environment and Heritage (OEH) document "Approved Methods for the Modelling and Assessment of Air Pollutants in NSW" (NSW DEC, 2005). The air quality goals for total impact relate to the total dust burden in the air and not just the dust from the project. Consideration of background dust levels needs to be made when using these goals to assess potential impacts. Table 3 2: OEH air quality impact assessment criteria Pollutant Averaging Period Impact Criterion Total suspended Annual Total 90µg/m 3 particulates (TSP) Particulate Matter < 10µm (PM 10 ) Deposited dust Source: NSW DEC, 2005 Annual Total 30µg/m 3 24 hours Total 50µg/m 3 Annual Incremental 2g/m 2 /month Total 4g/m 2 /month Queensland Environmental Protection Act (1994), Section Permit The approved Kestrel Mine operates per Permit Number MIN , issued under the Environmental Protection Act (1994), Section 299. Conditions at Part B of the Permit stipulate that compliance with the required level of performance can be demonstrated by monitoring to show that deposited dust levels are below 120 mg/m2 per day as a monthly average, and 24-hour average PM 10, levels are below 150 µg/m 3. The Permit criteria for deposited dust are specified as a daily value, monthly average. This value can only be measured on a monthly basis in actual practice, and is similar to the total annual dust deposition level specified in NSW guidelines, but may be less stringent than the NSW Incremental criteria for deposited dust in some circumstances. As neither criterion is specified in the EPP, and as it is not clear which criterion would be more stringent at any given time, both criteria have been applied in the assessment. It is noted that the EPP criteria for 24-hour average PM 10 levels are more stringent than the DERM Permit criteria, and therefore the EPP criteria have been adopted for this project assessment. FINAL_ _Kestrel_AQIA_120701
48 7 3.4 Other air pollutants Emissions of carbon monoxide (CO), sulphur dioxide (SO 2 ) and nitrogen dioxide (NO 2 ) will also arise from mining activities. These emissions are generally too low to generate any significant off-site concentrations because of underground mining activities, and have not been assessed further in this report. 3.5 Adopted Project Goals for the Ambient Air Quality The pollutants that are relevant to this project and their corresponding criteria are identified on the basis of the EPP (Air) objectives the NSW ambient air quality guidelines, as presented in Table 3-3. Table 3 3: Project goals for the ambient air quality Pollutant Averaging Period Impact Criterion Origin Particulate Matter < 10µm (PM 10 ) Particulate Matter < 2.5 µm (PM 2.5 ) Total Suspended Particulates (TSP) 24 hours Total 50 µg/m 3 EPP (Air) 24 hours Total 150 µg/ m3 * DERM Permit Condition B4 Annual Total 30 µg/m 3 OEH 24 hours Total 25 µg/m 3 EPP (Air) Annual Total 8 µg/m 3 EPP (Air) Annual Total 90µg/m 3 OEH Incremental 2g/m 2 /month OEH Annual Dust Deposition Total 4g/m 2 /month OEH Monthly Total 0.12 g/m 2 /day DERM Permit Condition B4 * Note that only the more stringent EPP condition is considered further 4 EXISITING ENVIRONMENT This section describes the existing climate and air quality in the area surrounding the Project. 4.1 Local climate Long-term climatic data from the closest Bureau of Meteorology (BoM) weather station at Emerald Airport (Site No ) characterise the local climate in the proximity of the Project. The Emerald Airport station is located approximately 40km southwest of the Project. A long-term meteorological analysis based on data collected at this site is presented in Appendix A. Table 4-1 and Figure 4-1 presents a summary of data from Emerald Airport collected over a 20-year period. The data indicate that January is the hottest month with a mean maximum temperature of 34.3ºC and July as the coldest month with a mean minimum temperature of 8.8ºC. Humidity levels exhibit some variability and seasonal flux across the year. Mean 9am humidity levels range from 53% in October to 68% in February. Mean 3pm humidity levels range from 30% in September to 45% in February. Rainfall peaks during the months of summer and declines during winter. The data indicates that December is the wettest month with an average rainfall of 92.9mm over 6.2 days and July is the driest month with an average rainfall of 11.8mm over 1.3 days. FINAL_ _Kestrel_AQIA_120701

49 8 Wind speeds during the colder months have a greater spread between the 9am and 3pm conditions compared to the warmer months. Mean 9am wind speeds range from 16.3km/h in October to 14.6km/h in July. Mean 3pm wind speeds range from 15.6km/h in March to 13.7km/h in May and July. Table 4 1: Monthly climate statistics summary Emerald Airport Parameter Jan Feb Mar Apr May Jun Jul Aug Sep Oct Nov Dec mperature Mean max. temperature (ºC) Mean min. temperature (ºC) Rainfall Rainfall (mm) Mean No. of rain days ( 1mm) am conditions Mean temperature (ºC) Mean relative humidity (%) Mean wind speed (km/h) pm conditions Mean temperature (ºC) Mean relative humidity (%) Mean wind speed (km/h) Source: (Bureau of Meteorology, 2012) Figure 4 1: Monthly climate statistics summary Emerald Airport FINAL_ _Kestrel_AQIA_120701
50 9 4.2 Local air quality The area surrounding the project site has several underground and open cut mines in addition to agricultural activities. Monitoring data for the project site and the wider area are not publically available. Therefore, it is not possible to accurately quantify the existing background level at this location and an estimate needs to be made. To do this, a desktop review of NEPM air quality monitoring data for all sites in Queensland was conducted. The review found that most of the monitoring sites are located in coastal areas either in built up urban areas or near ports. North Toowoomba and The Gap (Mt Isa) are the only sites that are inland locations. Historical data are not available for 'The Gap' site as this site was established in Therefore, monitoring data collected at the North Toowoomba site in ( ) period are presented in Table 4-2 and was used in estimating the background level for this assessment. Table 4 2: 24 hour average PM 10 monitoring data collected at NEPM North Toowoomba site Percentile Average 75th percentile th percentile As a conservative measure, it was assumed that measured 75th percentile data of 24-hour average PM 10 concentration is the representative background level that can be contributed from other nonmining sources (e.g. agriculture) and the measured 50th percentile data of 24-hour average PM 10 concentration is the representative for annual average PM 10 concentration. It is noted that use of this data as the background is likely to overestimate the cumulative (increment from mining activities + background level) impact. The above was necessary as only the 75th percentile and 50th percentile value of the QLD NEPM monitoring data are available to approximate the 70th percentile and annual average results. This is considered to be conservative as for example the Victorian EPA allow the use of a (lower) 70th percentile level as an appropriate estimate of background 24-hour values in modelling, and experience with monitoring data near coal mines shows that the annual average results are less than 50th percentile levels (as the majority of the data is in the lowest part of the measured range). No ambient monitoring data for PM 2.5, TSP and dust deposition are available for the North Toowoomba site. Therefore, conservative background PM 2.5, TSP and dust deposition were estimated based on the assumptions below, and the results are presented in Table 4-3. The assumptions below are considered to be conservative as the actual ratio of PM 2.5 to PM 10 and deposited dust and PM 10 measured in the air near coal mines would lead to lower levels being applied. 24-hour average PM 2.5 concentration of 25µg/m³ is equivalent to 24-hour average PM 10 concentration of 50µg/m³; Annual average PM 2.5 concentration of 8µg/m³ is equivalent to annual average PM 10 concentration of 30µg/m³; and Annual average dust deposition of 4g/m²/month is equivalent to annual average PM 10 concentration of 30µg/m³. FINAL_ _Kestrel_AQIA_120701
51 10 Table 4 3: Estimated background level Pollutants Averaging Period Units Background level 1 24 hour µg/m³ 18.7 PM 10 Annual µg/m³ hour µg/m³ 9.3 PM 2.5 Annual µg/m³ 3.5 TSP Annual µg/m³ 39.6 Dust Deposition Annual g/m²/month 1.76 FINAL_ _Kestrel_AQIA_120701
52 11 5 MODELLING SCENARIOS This assessment considers the following three mine operational scenarios to represent the likely change in dust impacts. Baseline Scenario - is based on the current operation with an average annual run-of-mine coal (ROM) production rate of 4,000,000tpa. This scenario is focused on assessing dust impact from the production of ROM coal from 100, 200 and 300 series underground panels; Current (Approved) Scenario - is based on the approved Kestrel Mine with an average annual production rate of 7,000,000tpa. This scenario is focused on assessing dust impact from the production of ROM coal from 400 and 500 series panel; and Proposed Scenario (Kestrel Extension #4) - is based on the approved operation with an average annual production rate of 7,000,000tpa with proposed changes in workings for the 400 and 500 series longwall panels. 5.1 Emission estimation for Kestrel Operation For each of the modelling scenarios assessed in this report, dust emission estimates have been estimated by analysing the various types of dust generating activities taking place and utilising appropriate emission factors. The emission factors applied are considered the most applicable and representative for determining dust generation rates for the proposed activities. The emission factors were sourced from both locally developed and US EPA developed documentation. Total dust emissions from all significant dust generating activities are presented in Table 5-1. Detailed emission inventories and emission estimation calculations are presented in Appendix B. Table 5 1: Summary of estimated dust emissions for the modelling scenarios (kg of TSP / year) Activity Baseline Scenario Current Scenario Proposed Scenario CL Unloading ROM to ROM Hopper 17,220 30,134 30,134 CL Unloading ROM to ROM Pad 19,133 33,483 33,483 CL conveying ROM to CHPP CL conveyor transfer point CL conveyor transfer point CHPP Dozer pushing ROM coal at Hopper 14,411 25,220 25,220 CHPP Rehandling ROM at CHPP 28,699 5,022 5,022 CHPP Loading Product coal to stockpile 896 1,565 1,565 CHPP Unloading Product coal from stockpile 896 1,565 1,565 CHPP Loading coal to trains 896 1,565 1,565 CHPP Hauling rejects 94, , ,455 WE ROM and product coal stockpiles 36,792 39,420 39,420 WE Tailing Dam 82,344 82,344 82,344 Upcast Ventilation Shafts 4,656 9,630 9,630 Total kg of TSP per year 283, , ,765 Table 5-1 indicates that the estimated dust emissions for the current (approved) Kestrel Mine and the proposed Kestrel Extension #4 scenarios are identical. This is occurs because the proposed changes FINAL_ _Kestrel_AQIA_120701
53 12 to the approved mine do not include changes to the surface infrastructure or coal handling and extractive activities which generate dust emissions at the surface. Due to this situation, and to prevent unnecessary duplication the scenario for the current (approved) Kesterel Mine and the scenario for the proposed Kestrel Extension #4 are treated as the same scenario from this point ion in the report. 5.2 Emission estimation for Neighbouring Mines Potential dust emissions from other major dust sources (i.e. mining) in the area were modelled to predict the cumulative impact (i.e. Kestrel + other mines). Two other mines are currently operating within 15km of Kestrel mine, the open cut Gregory mine and the underground Crinum mine. Annual ROM production rates for the Gregory and Crinum mines were sourced from coal statistics information for period, presented in Queensland Government: Mining and Safety website (Queensland Government, 2012) and are shown in Table 5-2. Mine Table 5 2: Annual ROM production rate of surrounding mines Annual ROM Production Rate (tpa) Gregory (Open cut) 2,001,583 Crinum (Underground) 5,019,940 Detailed data on the Gregory and Crinum mines were not available at the time of this assessment, and therefore the following assumptions were made to estimate potential dust emissions from these mines. Dust (TSP) per unit of ROM coal production for the Crinum underground mine is similar to that of Kestrel underground mine; and Dust (TSP) per unit of ROM coal production for the Gregory open cut mine is similar to that of Caval Ridge open cut mine. It should be noted that the recent EIS (BMA 2009) for the Caval Ridge mine presented information on two pits with different TSP/ROM ratios. The Horse pit has a TSP/ROM ratio of 1.59 kg/ tonne of ROM and the Heyford pit has a TSP/ROM ratio of 0.78 kg/ tonne. As a conservative measure to simulate the potential worst case cumulative impact scenario, a TSP/ROM ratio of 1.59 was applied in estimating potential dust emissions from Gregory open cut mine. Relative to other open cut mines where emissions modelling has been validated, a TSP to ROM ration of 1 kg/tonne is consistent with a dusty mine, and most mines operate at TSP/ ROM ratios near 0.7 kg/tonne. Therefore, it is likely that the estimated emissions for the Gregory mine may be overestimated by approximately 50 to 100%. The ratio of wind sensitive (WS), wind insensitive (WI) and wind erosion (WE) activities were considered to be similar to Kestrel for the Crinum mine, and similar to Caval Ridge Horse pit for the Gregory mine. Estimated potential worst case TSP emissions for the Gregory and Crinum mines are presented in Table 5-3. Potential dust source locations for these mines were identified based on the available aerial photography. FINAL_ _Kestrel_AQIA_120701
54 13 Table 5 3: Estimated TSP emission from surrounding mines ACTIVITY TSP emission (kg/y) Crinum WS 3,514 Crinum WI 214,351 Crinum WE 147,586 Gregory WS 320,253 Gregory WI 2,690,128 Gregory WE 192,152 6 DISPERSION MODELLING APPROACH 6.1 Introduction The following sections are included to provide the reader with an understanding of how the model and modelling approach is combined with the dust emission estimates for each of the assessed scenarios to predict potential dust levels. The CALPUFF model used is an advanced "puff" model that can deal with the effects of complex local terrain on the dispersion meteorology over the entire modelling domain in a three-dimensional (3D), hourly varying time step. 6.2 Modelling methodology Modelling was undertaken using a combination of the CALPUFF Modelling System and TAPM. The CALPUFF Modelling System includes three main components: CALMET, CALPUFF and CALPOST and a large set of pre-processing programs designed to interface the model to standard, routinely available meteorological and geophysical datasets. TAPM is a prognostic air model used to simulate the upper air data for CALMET input. The meteorological component of TAPM is an incompressible, non-hydrostatic, primitive equation model with a terrain-following vertical coordinate for three-dimensional simulations. The model predicts the flows important to local scale air pollution, such as sea breezes and terrain induced flows, against a background of larger scale meteorology provided by synoptic analysis. CALMET is a meteorological model that uses the geophysical information and observed/simulated surface and upper air data as inputs and develops wind and temperature fields on a threedimensional gridded modelling domain. CALPUFF is a transport and dispersion model that advects "puffs of material emitted from modelled sources, simulating dispersion processes along the way. It typically uses the three dimensional meteorological field generated by CALMET. CALPOST is a post processor used to process the output of the CALPUFF model and produce tabulations that summarise the results of the simulation CALMET meteorological modelling This section aims to guide the reader through the process of the CALMET modelling setup and provides a brief analysis of the meteorological output. FINAL_ _Kestrel_AQIA_120701
55 14 To generate a three-dimensional (3D) meteorological data field for the local region, CALMET requires, topographical and land use information, surface meteorological data (at 10m height) and upper air data. Although it is always preferable to use observed surface and upper air meteorological data, CALMET has the option to use simulated datasets from a prognostic model (such as TAPM) output as input in absence of any available observed meteorological data. The centre of analysis for the TAPM modelling used is 23.25deg south and 148.3deg east. The simulation involved four nesting grids of 100km, 30km, 10km and 3km with 35 vertical grid levels. CALMET modelling used a nested approach where the 3D wind field from the coarser grid outer domain is used as the initial guess (or starting) field for the finer grid inner domain. This approach has several advantages over modelling a single domain. Observed surface wind field data from the near field as well as from far field monitoring sites can be included in the model to generate a more representative 3D wind field for the modelled area. Off domain terrain features for the finer grid domain can be allowed to take effect within the finer domain, as would occur in reality, also the coarse scale wind flow fields give a better set of starting conditions with which to operate the finer grid run. The coarser grid domain was run on a 55 x 55km area with a 1.1km grid resolution. The available meteorological data for the 2009 calendar year from the Emerald Airport BOM meteorological monitoring station was included in this model simulation and supplemented with TAPM data. The 2009 calendar was chosen based on a long-term meteorological analysis presented in Appendix A. Table 6-1 outlines the parameters used from each station. 3D upper air data were sourced from the TAPM output. The finer grid domain was run on a 24.2 x 24.2km grid with a 0.2km grid resolution for the modelled year. Local land use and detailed topographical information were included to produce realistic fine scale flow fields (such as terrain forced flows) in surrounding areas. Weather station Emerald Airport BoM TAPM Table 6 1: Surface observation data Parameters Wind speed, Wind direction, Cloud cover, mperature, Humidity and Pressure Wind speed, Wind direction, Cloud height, mperature, Humidity and Pressure CALMET generated meteorological data were extracted from a point within the CALMET domain near the Project. These data are graphically represented in Figure 6-1 and Figure 6-2. Figure 6-1 presents the annual and seasonal windroses from the CALMET data. On an annual basis, winds from the east, east-northeast and northeast are most frequent. During summer, winds from the east-northeast dominate with a lesser portion of wind from the east to the northeast. In autumn, winds from the east and east-southeast are most predominate. The spring wind distribution is dominated by northeast winds. In winter, north-northeast winds dominate with a spread of winds ranging from the northeast to south-southeast being prevalent in the distribution. Figure 6-2 includes graphs of the temperature, wind speed, mixing height and stability classification over the modelling period and show sensible trends considered to be representative of the area. FINAL_ _Kestrel_AQIA_120701
56 15 Figure 6 1: Annual and seasonal windroses from CALMET (Cell Ref 6861) FINAL_ _Kestrel_AQIA_120701
")
57 15 Figure 6 2: Meteorological analysis of CALMET (Cell Ref 6861) FINAL_ _Kestrel_AQIA_120701
58 Dispersion modelling CALPUFF modelling is based on the application of three particle size categories Fine Particulates (FP), Coarse Matter (CM) and Rest (RE). The estimated emissions are presented in Section 6.1. The distribution of particles for each particle size category was derived from measurements made in the SPCC (1986) study and is presented in Table 6-2. Emissions from each activity in Table 5-1 were represented by a series of volume sources and were included in the CALPUFF model via an hourly varying emission file. Meteorological conditions associated with dust generation (such as wind speed) and levels of dust generating activity were considered in calculating the hourly varying emission rate for each source. It should be noted that as a conservative measure, the effect of the precipitation rate (rainfall) in reducing dust emissions has not been considered in this assessment. Table 6 2: Distribution of particles Particle category Size range Distribution Fine particulates (FP) 0 to 2.5 µm 4.68% of TSP Coarse matter (CM) 2.5 to 10 µm 34.4% of TSP Rest (RE) 10 to 30 µm 60.92% of TSP Each particle-size category is modelled separately and later combined to predict short-term and longterm average concentrations for PM 2.5, PM 10, and TSP. Dust deposition was predicted using the proven dry deposition algorithm within the CALPUFF model. Particle deposition is expressed in terms of atmospheric resistance through the surface layer, deposition layer resistance and gravitational settling (Slinn and Slinn, 1980 and Pleim et al., 1984). Gravitational settling is a function of the particle size and density, simulated for spheres by the Stokes equation (Gregory, 1973). CALPUFF is capable of tracking the mass balance of particles emitted into the modelling domain. For each hour CALPUFF tracks the mass emitted, the amount deposited, the amounts remaining in the surface mixed layer or the air above the mixed layer and the amount advected out of the modelling domain. The versatility to address both dispersion and deposition algorithms in CALPUFF, combined with the three-dimensional meteorological and land use field generally result in a more accurate model prediction compared to other Gaussian plume models (Pfender et al 2006). FINAL_ _Kestrel_AQIA_120701
59 17 7 DISPERSION MODELLING RESULTS The dispersion model predictions for each of the assessed years are presented in this section. The estimated maximum 24-hour and annual average PM 2.5 and PM 10 concentrations, annual average TSP concentrations and annual average dust (insoluble solids) deposition (DD) rates for the proposed operating scenarios in isolation (the incremental impact) and with other dust sources (the total (cumulative) impact) were assessed. It is important to note that when assessing impacts for maximum 24-hour average concentrations; the figures presented show the highest modelled predicted 24-hour average concentrations that occur at any point within the modelling domain for the worst day (a 24-hour period) in the modelling period. The figures showing 24-hour average levels represent every worst case day, at every point over the whole year combined into one plot, and do not represent a single worst case day snapshot. When trying to assess the total (cumulative) 24-hour average impacts based on model predictions, challenges arise as the predicted impacts are often overestimated due to several factors. The first is the use of a regulatory model which is specifically designed to not under predict any result when operated correctly. All regulatory models, therefore over predict results to some degree. Other factors include the model's inherent limitations in realistically considering spatial and temporal variability, especially over short time frames. Further issues are associated with identification and quantification of emissions from other non-modelled (background) sources over relatively short, 24- hour average periods. These factors should be taken into consideration whenever assessing impacts based on 24-hour average predictions. Each of the sensitive receptors identified in Figure 2-1 and detailed in Table 2-1 were assessed individually as discrete receptors with the predicted results presented in tabular form for each of the assessed modelling scenarios. Associated isopleth diagrams of the dispersion modelling results are presented in Appendix C. FINAL_ _Kestrel_AQIA_120701
60 Baseline Scenario This scenario is provided for context only. It represents an assessment of the operations prior to the Approved (Current) Kestrel Mine. Table 7-1 presents the model predictions at each of the discrete receptors. Figure C-1 to Figure C-12 in Appendix C present isopleth diagrams of the predicted modelling results for each of the assessed pollutants in the Current Scenario. The results in Table 7-1 indicate that all the sensitive receptors are predicted to experience levels below the relevant criterion. Receptor ID 24 hour average Table 7 1: Modelled predictions for the Current Scenario PM 2.5 PM 10 TSP (µg/m³) (µg/m³) (µg/m³) Annual average 24 hour average Annual average Annual average DD (g/m²/month) Annual average DD (g/m²/day) monthly Potential Incremental Impact (Kestrel mine alone) Air Quality Impact Criteria 2 R <0.001 R <0.001 R <0.001 R <0.001 R <0.001 R <0.001 R <0.001 R <0.001 R <0.001 R <0.001 R <0.001 R <0.001 Total Potential Impact (Kestrel mine, + other mines + background levels) Air Quality Impact Criteria R R R R R R R R R R R R FINAL_ _Kestrel_AQIA_120701
61 Current / Proposed Scenario As there is no difference in the dust emissions from the Approved (Current) Kestrel mine operation and the Proposed Kestrel Extension #4, it follows that there would also be no difference in the potential air quality impacts. Therefore this section represents a the results of a contemporary assessment of impacts from the Approved (Current) Kestrel mine operation and the Proposed Kestrel Extension #4. Table 7-2 presents the model predictions at each of the discrete receptors. Figure C-13 to Figure C-24 in Appendix C present isopleth diagrams of the predicted modelling results for each of the assessed pollutants in the Proposed Scenario. The results in Table 7-2 indicate that all the sensitive receptors are predicted to experience levels below the relevant criterion. Receptor ID 24 hour average Table 7 2: Modelled predictions for the Proposed Scenario PM 2.5 PM 10 TSP (µg/m³) (µg/m³) (µg/m³) Annual average 24 hour average Annual average Annual average DD (g/m²/month) Annual average DD (g/m²/day) monthly Potential Incremental Impact (Kestrel mine alone) Air Quality Impact Criteria 2 R <0.001 R <0.001 R <0.001 R <0.001 R <0.001 R <0.001 R <0.001 R <0.001 R <0.001 R <0.001 R <0.001 R <0.001 Total Potential Impact (Kestrel mine, + other mines + background levels) Air Quality Impact Criteria R R R R R R R R R R R R FINAL_ _Kestrel_AQIA_120701
62 20 8 DUST MITIGATION AND MANAGEMENT The proposed modifications to the mining activities associated with Kestrel Extension #4 will generate minimal levels of dust, no dust beyond that which occurs from the approved Kestrel Mine, and would also not lead to any exceedance of the criteria values. Nevertheless, so that the operations are managed to ensure these activities have only the minimal affect on the surrounding environment and sensitive receptors, all reasonable and practicable dust mitigation measures and management practices would be utilised. 8.1 Dust Management The Kestrel Mine air quality management program covers dust management practices that are implemented at the Kestrel Mine to reduce and manage any dust impacts. It is considered that the dust management measures employed at the Kestrel Mine are consistent with industry standards and are appropriate for managing dust emissions from the Project and the proposed modification. 8.2 Monitoring Network The Kestrel Mine ambient air quality monitoring network measures dust levels representative of the local area. This network provides information regarding the existing air quality levels and provides a basis in which to consider dust emission management practices. Monitoring of dust emissions is conducted with dust deposition gauges near the source of emissions and near sensitive receptors. FINAL_ _Kestrel_AQIA_120701
63 21 9 CONCLUSIONS This study has examined the potential dust impacts that may arise from the proposed Kestrel Extension #4 and the current (approved) Kestrel Mine. The study finds that the Kestrel Extension #4 would have the same impacts as the current (approved) Kestrel Mine and negligible effects on air quality. It was found that no sensitive receptor would be subject to any potential adverse air quality impacts above the relevant criteria due to the Kestrel Extension #4. The study found that total potential cumulative levels would be below criteria at all receptors even when conservative assumptions were applied to account for background levels and other mining activities in the area. The estimates made in this study that relate to other mines are conservative, and are likely to overstate the actual emissions and impacts from these mines. Thus it is concluded that the operation of the Kestrel Extension #4 would not have an adverse affect on the surrounding environment or at any sensitive receptor in terms of air quality for all the pollutants examined. FINAL_ _Kestrel_AQIA_120701
64 22 10 REFERENCES Bureau of Meteorology (2012) Climate Averages Australia, Bureau of Meteorology website. Gregory P. H. (1973) "The microbiology of the atmosphere", Halstead Press, New York. Katestone Environmental Pty Ltd (2010) "NSW Coal Mining Benchmarking Study: International Best Practice Measures to Prevent and/or Minimise Emissions of Particulate Matter from Coal Mining", Katestone Environmental Pty Ltd prepared for DECCW, NPI (2001) "Emission Estimation chnique Manual for Mining, Version 2.3", National Pollutant Inventory, December ISBN: NSW DEC (2005) "Approved Methods for the Modelling and Assessment of Air Pollutants in New South Wales", Department of Environment and Conservation (NSW), August PAEHolmes (2009) "Air Quality Impact Assessment: Bulli Seam Operations", Prepared by PAEHolmes, July 2009 Pfender W., Graw R., Bradley W., Carney M. And Maxwell L. (2006) "Use of a complex air pollution model to estimate dispersal and deposition of grass stem rust urendiniospores at landscape scale", Agriculture and Forest Meteorology, Vol 139. Pleim J., Venkatram A. and Yamartino R. J. (1984) "ADOM/TADAP model development program, Vol 4, The Dry Deposition Model", Ministry of the Environment, Rexdale, Ontario, Canada. Queensland Government (2012) Mining and Safety - Coal Statistics, Queensland Government website, sited on 13/06/ Slinn S. A. and Slinn W. G. N. (1980) "Predictions for particle deposition on natural waters", Atmospheric Environment, Vol 14. SPCC (1983) "Air Pollution from Coal Mining and Related Developments", State Pollution Control Commission. FINAL_ _Kestrel_AQIA_120701
65 23 SPCC (1986) "Particle size distributions in dust from opencut mines in the Hunter Valley", Report Number Prepared for the State Pollution Control Commission of NSW by Dames & Moore, 41 McLaren Street, North Sydney, NSW US EPA (1985 and updates) "Compilation of Air Pollutant Emission Factors", AP-42, Fourth Edition United States Environmental Protection Agency, Office of Air and Radiation Office of Air Quality Planning and Standards, Research Triangle Park, North Carolina FINAL_ _Kestrel_AQIA_120701
66 Appendix A Long-term Meteorological Analysis FINAL_ _Kestrel_AQIA_120701


67 A-1 A long-term meteorological analysis of meteorological parameters collected at the Emerald Airport BoM Station was conducted to determine the most appropriate year for use in dispersion modelling. A summary of the analysis is presented in Figure A-1 and indicates that the 2009 calendar year is most representative of the long-term meteorology for this site. Figure A 1: Long term meteorological analysis FINAL_ _Kestrel_AQIA_120701
68 Appendix B Emission Calculation FINAL_ _Kestrel_AQIA_120701
69 B-1 Kestrel Mine - Emission Calculation The Kestrel Mine mining schedule and mine plan designs provided by the Proponent have been combined with emissions factor equations that relate to the quantity of dust emitted from particular activities based on intensity, the prevailing meteorological conditions and composition of the material being handled. Emission factors and associated controls have been sourced from the US EPA AP42 Emission Factors (US EPA, 1985 and Updates), the National Pollutant Inventory document "Emission Estimation chnique Manual for Mining, Version 3.1" (NPI, 2012), the State Pollution Control Commission document "Air Pollution from Coal Mining and Related Developments" (SPCC, 1983) and the OEH document, "NSW Coal Mining Benchmarking Study: International Best Practise Measures to Prevent and/or Minimise Emissions of Particulate Matter from Coal Mining", prepared by Katestone Environmental (Katestone, 2010). The emission factor equations used for each dust generating activity are outlined in Table B-1 below. Detailed emission inventories for each modelled year are presented in Table B-2 to Table B-4. The estimated emissions generated from the upcast ventilation shafts were obtained from monitoring data collected at an underground coal mine in NSW (PAEHolmes, 2009). There are no potential for dust emissions from any of the downcast ventilation shafts and therefore have not been included in the emissions inventory. The dust emissions generated via wind erosion from the conveyor belts have been factored into the wind erosion estimates from the ROM and Product stockpile emissions. Mine rejects tend to have high moisture content levels are usually very wet resulting in no potential dust emissions and therefore have not been considered in the emissions inventory. FINAL_ _Kestrel_AQIA_120701
70 B-2 Table B 1: Emission factor equations Activity Emission factor equation Units Variables Control Source Loading / emplacing coal Dozer activity on coal EF = 0.58/M 1.2 EF = 35.6 x s 1.2 /M 1.3 kg/tonne kg/hour Material transfer EF = 0.74 x x ([U/2.2] 1.3 /[M/2] 1.4 ) kg/tonne Hauling EF = 1.38 x (s/12) 0.7 x (M x /3) 0.45 kg/vkt (VKT = vehicle kilometre travelled) M = moisture content of material handled (%) S = silt content of material handled (%) M = moisture content of material handled (%) U = wind speed (m/s) M = moisture content of material handled (%) S = silt content of haul road (%) M = average vehicle gross mass (tonnes) 90% control applied when unloading to enclosed transfer point. 50% control applied with Level 1 watering on haul road. US EPA, 1985 and Updates. Katestone, 2010 US EPA, 1985 and Updates. US EPA, 1985 and Updates. US EPA, 1985 and Updates. Katestone, 2010 Wind erosion EF = 0.4 kg/ha/hour 50% control applied with use of water sprays. SPCC, NPI, Katestone, 2010 FINAL_ _Kestrel_AQIA_120701
71 B-3 Table B 2: Emissions inventory Current Scenario ACTIVITY TSP emission Emission Intensity Units (kg/y) Factor Units Variable 1 Units Variable 2 Units Variable 3 Units Variable 4 Units Variable 5 Units Variable 6 Units CL - Unloading ROM to ROM Hopper 17, tonnes/year kg/t 8 moisture content in % 90 % Control CL - Unloading ROM to ROM Pad 19, tonnes/year kg/t 8 moisture content in % CHPP - Dozer pushing ROM coal at Hopper 14, hours/year kg/h 5 silt content in % 8 moisture content in % CHPP - Rehandling ROM at CHPP 28, tonnes/year kg/t 8 moisture content in % CHPP - Loading Product coal to stockpile tonnes/year kg/t Ave(WS/2.2)^1.3 [m/s] 7.7 moisture content in % CHPP - Unloading Product coal from stockpile tonnes/year kg/t Ave(WS/2.2)^1.3 [m/s] 7.7 moisture content in % CHPP - Loading coal to trains tonnes/year kg/t Ave(WS/2.2)^1.3 [m/s] 7.7 moisture content in % CHPP - Hauling rejects 94, tonnes/year kg/t 30.0 tonnes/load 3.0 km/return trip 2.6 kg/vkt 5.0 % silt content 41.6 Ave GMV (tonnes) 50 % Control WE - ROM and product coal stockpiles 36, ha 0.4 kg/ha/hr 50 % Control WE - Tailing Dam 82, ha 0.4 kg/ha/hr 50 % Control Upcast Ventilation Shaft 1 2, m³/s 0.42 mg/m³ Upcast Ventilation Shaft 2 2, m³/s 0.42 mg/m³ Total 283,269 Table B 3: Emissions inventory Approved / Proposed Scenario ACTIVITY TSP emission (kg/y) Intensity Units Emissio n Factor Units Variable 1 Units Variable 2 Units Variable 3 Units Variable 4 Units Variable 5 Units Variable 6 Units CL - Unloading ROM to ROM Hopper 30,134 6,300,000 tonnes/year kg/t 8 moisture content in % 90 % Control CL - Unloading ROM to ROM Pad 33, ,000 tonnes/year kg/t 8 moisture content in % CL- conveying ROM to CHPP ha 0.4 kg/ha/hr 75 % Control CL - conveyor transfer point ,000,000 tonnes/year kg/t Ave(WS/2.2)^1.3 [m/s] 8.0 moisture content in % 90 % Control CL - conveyor transfer point ,000,000 tonnes/year kg/t Ave(WS/2.2)^1.3 [m/s] 8.0 moisture content in % 90 % Control CL - Dozer pushing ROM coal at Hopper 25,220 1,533 hours/year kg/h 5 silt content in % 8.0 moisture content in % CHPP - Rehandling ROM at CHPP 5, ,000 tonnes/year kg/t 2 moisture content in % CHPP - Loading Product coal to stockpile 1,565 5,703,704 tonnes/year kg/t Ave(WS/2.2)^1.3 [m/s] 7.7 moisture content in % CHPP - Unloading Product coal from stockpile 1,565 5,703,704 tonnes/year kg/t Ave(WS/2.2)^1.3 [m/s] 7.7 moisture content in % CHPP - Loading coal to trains 1,565 5,703,704 tonnes/year kg/t Ave(WS/2.2)^1.3 [m/s] 7.7 moisture content in % CHPP - Hauling rejects 165,455 1,296,296 tonnes/year kg/t 30 tonnes/load 3.0 km/return trip 2.6 kg/vkt 5.0 % silt content 42 Ave GMV (tonnes) 50 % Control WE - ROM and product coal stockpiles 39, ha 0.4 kg/ha/hr 50 % Control WE - Tailing Dam 82, ha 0.4 kg/ha/hr 50 % Control Upcast Ventilation Shaft 1 2, m³/s 0.42 mg/m³ Upcast Ventilation Shaft 2 2, m³/s 0.42 mg/m³ Upcast Ventilation Shaft 3 (New) 2, m³/s 0.42 mg/m³ Upcast Ventilation Shaft 4 (New) 2, m³/s 0.42 mg/m³ Total 396,765 FINAL_ _Kestrel_AQIA_120701
72 Appendix C Isopleth Diagrams FINAL_ _Kestrel_AQIA_120701
73 C-1 Figure C 1: Predicted maximum 24 hour average PM 2.5 concentrations due to emissions from the Project Existing Scenario (µg/m³) FINAL_ _Kestrel_AQIA_120701
74 C-2 Figure C 2: Predicted maximum 24 hour average PM 2.5 concentrations due to emissions from the Project and other sources Existing Scenario (µg/m³) FINAL_ _Kestrel_AQIA_120701
75 C-3 Figure C 3: Predicted annual average PM 2.5 concentrations due to emissions from the Project Existing Scenario (µg/m³) FINAL_ _Kestrel_AQIA_120701
76 C-4 Figure C 4: Predicted annual average PM 2.5 concentrations due to emissions from the Project and other sources Existing Scenario (µg/m³) FINAL_ _Kestrel_AQIA_120701
77 C-5 Figure C 5: Predicted maximum 24 hour average PM 10 concentrations due to emissions from the Project Existing Scenario (µg/m³) FINAL_ _Kestrel_AQIA_120701
78 C-6 Figure C 6: Predicted maximum 24 hour average PM 10 concentrations due to emissions from the Project and other sources Existing Scenario (µg/m³) FINAL_ _Kestrel_AQIA_120701
79 C-7 Figure C 7: Predicted annual average PM 10 concentrations due to emissions from the Project Existing Scenario (µg/m³) FINAL_ _Kestrel_AQIA_120701
80 C-8 Figure C 8: Predicted annual average PM 10 concentrations due to emissions from the Project and other sources Existing Scenario (µg/m³) FINAL_ _Kestrel_AQIA_120701
81 C-9 Figure C 9: Predicted annual average TSP concentrations due to emissions from the Project Existing Scenario (µg/m³) FINAL_ _Kestrel_AQIA_120701
")
82 C-10 Figure C 10: Predicted annual average TSP concentrations due to emissions from the Project and other sources Existing Scenario (µg/m³) FINAL_ _Kestrel_AQIA_120701
83 C-11 Figure C 11: Predicted annual average dust deposition levels due to emissions from the Project Existing Scenario (g/m²/month) FINAL_ _Kestrel_AQIA_120701
84 C-12 Figure C 12: Predicted annual average dust deposition levels due to emissions from the Project and other sources Existing Scenario (g/m²/month) FINAL_ _Kestrel_AQIA_120701
85 C-13 Figure C 13: Predicted maximum 24 hour average PM 2.5 concentrations due to emissions from the Project Proposed Scenario (µg/m³) FINAL_ _Kestrel_AQIA_120701
86 C-14 Figure C 14: Predicted maximum 24 hour average PM 2.5 concentrations due to emissions from the Project and other sources Proposed Scenario (µg/m³) FINAL_ _Kestrel_AQIA_120701
87 C-15 Figure C 15: Predicted annual average PM 2.5 concentrations due to emissions from the Project Proposed Scenario (µg/m³) FINAL_ _Kestrel_AQIA_120701
88 C-16 Figure C 16: Predicted annual average PM 2.5 concentrations due to emissions from the Project and other sources Proposed Scenario (µg/m³) FINAL_ _Kestrel_AQIA_120701
89 C-17 Figure C 17: Predicted maximum 24 hour average PM 10 concentrations due to emissions from the Project Proposed Scenario (µg/m³) FINAL_ _Kestrel_AQIA_120701
90 C-18 Figure C 18: Predicted maximum 24 hour average PM 10 concentrations due to emissions from the Project and other sources Proposed Scenario (µg/m³) FINAL_ _Kestrel_AQIA_120701
91 C-19 Figure C 19: Predicted annual average PM 10 concentrations due to emissions from the Project Proposed Scenario (µg/m³) FINAL_ _Kestrel_AQIA_120701
92 C-20 Figure C 20: Predicted annual average PM 10 concentrations due to emissions from the Project and other sources Proposed Scenario (µg/m³) FINAL_ _Kestrel_AQIA_120701
93 C-21 Figure C 21: Predicted annual average TSP concentrations due to emissions from the Project Proposed Scenario (µg/m³) FINAL_ _Kestrel_AQIA_120701
94 C-22 Figure C 22: Predicted annual average TSP concentrations due to emissions from the Project and other sources Proposed Scenario (µg/m³) FINAL_ _Kestrel_AQIA_120701
95 C-23 Figure C 23: Predicted annual average dust deposition levels due to emissions from the Project Proposed Scenario (g/m²/month) FINAL_ _Kestrel_AQIA_120701
96 C-24 Figure C 24: Predicted annual average dust deposition levels due to emissions from the Project and other sources Proposed Scenario (g/m²/month) FINAL_ _Kestrel_AQIA_120701
97 Appendix G Noise assessment
98

99 EMM EMGA Mitchell McLennan Noise Impact Assessment Kestrel Extension # 4 Prepared for Rio Tinto Coal Australia 29 June 2012 Planning + Environment + Acoustics
100 This page has been intentionally left blank

101 Noise Impact Assessment Final Report J12030RP1 Prepared for Rio Tinto Coal Australia 29 June 2012 Prepared by Daniel Weston Approved by Najah Ishac Position Senior Acoustic Consultant Position Director Signature Signature Date 29 June 2012 Date 29 June 2012 This report has been prepared in accordance with the brief provided by the client and has relied upon the information collected at or under the times and conditions specified in the report. All findings, conclusions or recommendations contained in the report are based on the aforementioned circumstances. The report is for the use of the client and no responsibility will be taken for its use by other parties. The client may, at its discretion, use the report to inform regulators and the public. Reproduction of this report for educational or other non commercial purposes is authorised without prior written permission from EMM provided the source is fully acknowledged. Reproduction of this report for resale or other commercial purposes is prohibited without EMM s prior written permission. Document Control Version Date Prepared by Reviewed by V1 29 June 2012 D.Weston N. Ishac T +61 (0) F +61 (0) Ground Floor Suite Chandos Street St Leonards New South Wales 2065 Australia emgamm.com Planning + Environment + Acoustics J12030RP1
102 This page has been intentionally left blank Planning + Environment + Acoustics J12030RP1
103 Executive Summary EMGA Mitchell McLennan Pty Limited (EMM) has been commissioned by Rio Tinto Coal Australia Pty Ltd to undertake a noise assessment for the proposed Kestrel Extension # 4 Project. The assessment has been prepared to support the Environmental Assessment Report for the authority amendment application for EA MIN The purpose was to provide a contemporised assessment of noise impacts associated with the current approved Kestrel Mine Extension (referred to as Kestrel South) and the proposed mine modification, Kestrel Extension # 4. A review of quarterly compliance noise monitoring reports was carried out to identify the current mine noise contribution at nearest residential receptors. This process also provided context of the most dominant (audible) noise sources and formed the current operating scenario for assessment purposes. The measured noise levels are below the EA noise limits for day, evening and night scenarios. A contemporised noise model of Kestrel South operations was developed which included the operation of the overland conveyor from the surface infrastructure site to the CHPP. The assessment showed an increase in overall noise levels in comparison to current operations, however with all proposed mitigation measures in place, noise levels from the site were predicted below the EA noise limits during calm and prevailing weather conditions for day, evening and night periods. Kestrel Extension # 4 operations involve the adjustment and realignment of underground panels and will not change surface plant and equipment. Therefore noise levels will not change from Kestrel South operations. The mitigation considered in this assessment, including a conveyor wall (roof and Lilyvale Road side only) and conveyor drive enclosure, is understood to form part of the current mine design which is described in the Environmental Management Plan for Kestrel South. This assessment therefore qualifies that current mitigation is adequate in reducing noise from the site to acceptable levels. Overall, Kestrel South and proposed Kestrel Extension # 4 are expected to generate similar noise levels which are below the Environmental Authority noise limits and potential noise impacts at surrounding residential receptors are not considered a risk of the project. Planning + Environment + Acoustics J12030RP1 E.1
104 This page has been intentionally left blank Planning + Environment + Acoustics J12030RP1 E.2
105 Table of Contents Executive Summary E.1 Chapter 1 Introduction 1 Chapter 2 Project description Existing operation Support infrastructure Proposed amendment Surrounding residential receptors 4 Chapter 3 Existing acoustic environment Background and ambient noise levels Kestrel South operational noise levels 7 Chapter 4 Noise criteria Overview of noise criteria Environmental Authority 9 Chapter 5 Noise modelling method Meteorological effects on received noise levels Winds mperature Inversions Meteorological conditions considered in modelling Operational noise modelling scenarios Existing Kestrel Extension # 4 modifications Plant and equipment noise levels Noise mitigation 14 Chapter 6 Noise impact assessment Results Result summary 15 Chapter 7 Conclusion 17 Planning + Environment + Acoustics J12030RP1 i
106 Appendices A B Wind roses Plant and equipment sound power levels Tables 3.1 Summary of long term noise logging results Summary of quarterly noise monitoring reports Relevant site specific meteorological parameters Indicative operations plant and equipment sound power levels Prediction operational noise levels 15 B.1 Plant and equipment sound power level spectra B.1 Figures 2.1 Surrounding residential receptors Noise source locations 13 Planning + Environment + Acoustics J12030RP1 ii
107 1 Introduction EMGA Mitchell McLennan Pty Limited (EMM) has been commissioned by Rio Tinto Coal Australia Pty Ltd to undertake a noise assessment for the proposed Kestrel Extension # 4 Project. The assessment has been prepared to support the environmental assessment report for the authority amendment application for EA MIN The purpose was to provide a contemporised assessment of noise impacts associated with current approved operations and the proposed mine modification. Kestrel Mine is an existing underground mine, using a long wall continuous miner method. It is located in central Queensland, approximately 40 km north east of Emerald and 300 km west of Rockhampton. The proponent is seeking a modification to the Mining Lease (ML) at Kestrel Mine over Mineral Development Licences (MDLs) 176, 345 and part of MDL 182. This report references noise requirements listed in the Kestrel Mine Environmental Authority (EA) MIN issued under the Environmental Protection Act 1994 (EP Act) and relevant Department of Environmental and Heritage Protection (DEHP) policy and guidance on noise. Planning + Environment + Acoustics J12030RP1 1
108 This page has been intentionally left blank Planning + Environment + Acoustics J12030RP1 2
109 2 Project description 2.1 Existing operation Kestrel Mine commenced operations in Initial production at Kestrel Mine was from the 100 and 200 series of longwall panels. Production in these areas ceased in 2004 when production in the 300 series of longwall panels commenced. An Environmental Authority (EA M1559) for ML 1978 was obtained on 22 October 2001 (which later became MIN in August 2004). The 300 series longwall panels are currently being mined. The Kestrel Mine Extension project (hereafter referred to as Kestrel South), which originally involved the development of the 400, 500 and 600 series longwall panels, was granted Environmental Authority MIN in 2003 to operate on MLs and 70302, and ML application (now ML 70330). The project was subsequently reviewed in 2006 including: new surface infrastructure including surface to seam access drift, holding dam and administration building; and overland conveyor to convey the run of mine (ROM) coal to the coal handling and preparation plant (CHPP) for processing and subsequent rail transporting from site. A single Environmental Authority MIN was granted in October 2008 for the 100, 200, 300, 400 and 500 series longwall panels and associated infrastructure. Environmental Authority MIN replaced MIN on 19 March Support infrastructure i Coal processing and handling facilities Once mining of the coal is completed, the raw coal is delivered to the surface via conveyors. On the surface, coal is transferred to the raw coal stockpile before being conveyed to the coal handling and preparation plant (CHPP). Following washing of the coal in the CHPP, the washed coal is stockpiled. Coarse and fine rejects from the washing process are mixed and disposed of at the co disposal facility. ii Transport activities Coal is loaded onto trains via a rail loader on the rail loop and presently transported 365 km to the Port of Gladstone. 2.2 Proposed amendment Kestrel Extension # 4 includes parts of the 500 series longwall panels previously assessed in 2006 that are located within what is currently MDLs 176 and 345 to the south west. In addition, the 500 series longwall panels have been reviewed as part of the long term mine planning process resulting in realignment of the layout of the 500 series panels, extending panels 504 to 510 into part of MDL 182. Acoustically significant plant and equipment on the surface generally remains the same as that assessed in the Kestrel South Environmental Assessment Report (EAR) process (discussed further in Chapter 5). Planning + Environment + Acoustics J12030RP1 3
110 2.3 Surrounding residential receptors There are 12 residential receptors surrounding the mine site that were assessed during the EAR process. These receptors have been considered in the Kestrel Extension # 4 assessment and are provided in Figure 2.1. Planning + Environment + Acoustics J12030RP1 4
111 Ö S3 N Ö S5 Ö S4 ML ML ML D D 300 SERIES PANELS 100 SERIES PANELS 200 SERIES PANELS CUDDESDEN ROAD Ö S8 BELCONG CREEK Ö Ö S7 S6 Ö S12 Ö Ö S1 S2 CENTRAL DOMAIN 400 SERIES PANELS ML Kestrel Mine EMM F2.1 Rev A 4 June 2012 Integrated Design Solutions GORDONSTONE CREEK GORDON ROAD MDL 182 LARA LANE Ö S9 Ö Ö S11 S SERIES PANELS MDL 345 MDL 176 CRINUM CREEK WYUNA KEY Ö Residential receptors Current proposed mine Mining Leases (MLs) Mining Development Licenses (MDLs) km Source: Rio Tinto Surrounding residential receptors Kestrel Mine Extension Figure 2.1
112 This page has been intentionally left blank Planning + Environment + Acoustics J12030RP1 6
113 3 Existing acoustic environment 3.1 Background and ambient noise levels Long term background noise logging was undertaken during the EAR noise impact assessment process in 2006 for the Kestrel South project (Noise Mapping Australia report ref: D02_m, 4 August 2006,). Background noise levels were recorded at Gordon Downs Homestead (S12) and adjacent to Lilyvale Road (representative of S7 and S8) for an eight day period. The results of long term noise monitoring are provided in Table 3.1. Although the raw data has not been verified, the methodology adopted in devising the levels appears appropriate. Table 3.1 Summary of long term noise logging results Location Period 1 L 90 background noise level, db(a) Maximum L eq,1hour Noise Level, db(a) Gordon Downs Homestead Day Lilyvale Road (Set back 100 m from road) Evening Night Day Evening Night Note 1: Day 6.00 am to 6.00 pm, Evening 6.00 pm to pm, Night pm to 6.00 am. Overall the noise environment is characterised by low ambient noise levels, especially during the night time period, commensurate with a rural setting. For Lilyvale road, existing background noise levels during the evening and night were recorded below 25 dba (L 90 ). The default background noise level of 25 db(a) (L 90 ) in accordance with DEHP guidance has been assigned. 3.2 Kestrel South operational noise levels There is a history of regular compliance noise monitoring around the Kestrel South site. Monitoring is conducted at five locations on a quarterly basis which represent nearest noise receptors assessed during the EAR process. Recent compliance noise reporting reports (Quarter and Quarter , authored by Global Acoustics) were reviewed to determine the existing noise contribution from the site. A summary of contributions is provided in Table 3.2. Planning + Environment + Acoustics J12030RP1 7
114 Table 3.2 Summary of quarterly noise monitoring reports Compliance noise monitoring location 1 Representative assessment location 2 Estimated Kestrel South noise contribution L eq,15 Notes minute NM1 S6 and S7 20 Continuum from Kestrel South during night time only. NM2 S4 22 Engine and fan continuum during night time only. NM3 S1 and S2 Nil NM4 S5 22 Engine and fan continuum. Kestrel South impact and conveyor (from adjacent mine operation, not KME) audible on occasion during night time only. NM5 S12 Nil Kestrel mine CHPP audible but not measurable during night time only. Note 1: Location referred to in Global Acoustics quarterly compliance reports. Note 2: Location referred to in EAR and EAAR and further referred to in this assessment. Existing Kestrel South noise levels at nearest receptor locations consist of fan and engine noise (low level continuum noise), and intermittent noise. The most prominent noise from Kestrel South based on monitoring observations is low level continuum noise (engine and fan noise) which is noted at receivers to the west and north west of the site, typically during a south east wind. Noise from the CHPP was audible at NM5 (representative of S12) although was not measurable. In all cases noise emission from Kestrel South was recorded at relatively low levels and was often not measurable and is well below the EA noise limits (refer Section 4.2). For all other receivers that are distanced further from the mine (S3, S8, S9, S10 and S11) existing noise levels are expected to be less than those presented Table 3.2. Planning + Environment + Acoustics J12030RP1 8
115 4 Noise criteria 4.1 Overview of noise criteria Noise criteria derived for Kestrel South in the Environmental Assessment Report process is based on guidance provided in Ecoaccess Guideline Planning for Noise Control (DERM, 2004). This guideline was approved in 2004 by the Queensland Environmental Protection Authority (EPA) who administers noise regulation in Queensland. Kestrel Mine and Kestrel South now operate under Environmental Authority MIN issued on 19 March 2010, and contains noise criteria established using the abovementioned methods. 4.2 Environmental Authority Schedule D of the Environmental Authority (MIN ) prescribes conditions for the management of noise as follows: Noise Nuisance D1 D2 D3 D4 Subject to Conditions D2 and D3 noise from the mining activity must not cause an environmental nuisance, at any sensitive or commercial place. When requested by the administering authority, noise monitoring must be undertaken within a reasonable and practicable timeframe nominated by the administering authority to investigate any complaint (which is neither frivolous nor vexatious nor based on mistaken belief in the opinion of the authorised officer) of environmental nuisance at any sensitive or commercial place, and the results must be notified within 14 days to the administering authority following completion of monitoring. The method of measurement and reporting of noise levels must comply with the latest edition of the Department of Environment and Resource Management s Noise Measurement Manual. If the environmental authority holder can provide evidence through monitoring that the limits defined in Schedule D Table 1 (noise limits) attributable to mining activities, are not being exceeded then the holder is not in breach of Condition (D1 1). Monitoring must include: a) the level and frequency of occurrence of impulsive or tonal noise; and b) atmospheric conditions including wind speed and direction; and c) location, date and time of recording. D5 If monitoring indicates exceedence of the limits in Schedule D Table 1 (noise limits), then the environmental authority holder must: a) address the complaint including the use of appropriate dispute resolution if required; and b) Immediately implement noise abatement measures so that emissions of noise from the activity do not result in further environmental nuisance. Planning + Environment + Acoustics J12030RP1 9
116 Table D1 (Noise Limits) Period of Day Noise Limit, Gordon Downs Homestead (LAeq, 15 db(a)) Noise Limit, sensitive places non mining lease (LAeq, 15 db(a)) Day (6am to 6pm) 37 db(a) 33 db(a) Evening (6pm to 10pm) 33 db(a) 30 db(a) Night (10pm to 6pm) 28 db(a) 28 db(a) Planning + Environment + Acoustics J12030RP1 10
117 5 Noise modelling method This section presents the method and base parameters used to model noise emission from the Kestrel Extension # 4, including the effect of prevailing meteorological conditions on received noise levels. Noise predictions were carried out using the Environmental Noise Model (ENM) algorithms incorporated into Brϋel and Kjær Predictor Version 8.11 software. Predictor calculates total noise levels at receptors from the concurrent operation of multiple noise sources. The model considers factors such as the lateral and vertical location of plant, source to receptor distances, ground effects, atmospheric absorption, topography of the mine and surrounding area and applicable meteorological conditions. 5.1 Meteorological effects on received noise levels The Ecoaccess Guideline Planning for Noise Control provides procedures for identifying prevailing noise enhancing meteorological conditions at a site Winds During certain wind conditions, noise levels at residences may increase or decrease compared with noise during calm conditions. This is due to refraction caused by the varying speed of sound with increasing height above ground. The received noise level increases when the wind blows from the source to the receiver, and conversely, decreases when the wind blows from the receiver to the source. Winds of up to 3 m/s must be considered in noise predictions when they occur for greater than 30% of the time during day, evening or night periods mperature Inversions mperature inversions (ie where atmospheric temperature increases with altitude) typically occur during the night time period in the winter months and can also increase (ie focus) mine noise levels at surrounding residences. mperature inversions are to be assessed when they are found to occur for 30% of the time (about two nights per week) during the winter months. Drainage flow winds (ie localised cold air travelling in a direction of decreasing altitude) can occur during temperature inversion conditions. The increase of noise levels caused by a drainage flow wind needs consideration if a development (or noise source) is at a higher altitude to surrounding residences Meteorological conditions considered in modelling Site specific data was obtained from Emerald airport (approximately 35 km from the site) for 2009 calendar year and analysed to determine the presence of prevailing winds or temperature inversions in the area. Data from Kestrel Mine onsite weather station was also available however the data set did not contain the samples required to determine common occurrence of prevailing weather conditions for a full 12 month period. Appendix A provides the analysed data in the form of wind roses. A summary of calm and identified prevailing weather conditions that were considered in the noise modelling are provided in Table 5.1. This was determined as required by the noise guidelines. Planning + Environment + Acoustics J12030RP1 11
118 Table 5.1 Relevant site specific meteorological parameters Assessment condition Period mperature Wind speed/ direction Relative humidity Calm Day 20 C nil 70% nil Evening 15 C nil 90% nil Night 10 C nil 90% nil Prevailing winds Night 10 C 2.5 m/s / SE (135 o ) 90% nil F class temperature inversion 2.5 m/s / E (90 o ) 2.4 m/s / ESE (122.5 o ) mperature gradient Night 10 C nil 90% 3 o /100 m The area surrounding the site is generally flat with noise sources typically at a similar elevation to surrounding receptors. The potential for source to receiver drainage flow winds to occur is therefore not relevant and has not been considered in the assessment. 5.2 Operational noise modelling scenarios Two scenarios were considered in the noise impact assessment to provide a comparison between current noise levels and those predicted to occur with the addition of the proposed amendment for Kestrel Extension # Existing The first scenario was based on the current operations at Kestrel South. Noise level contributions noted during regular compliance monitoring were taken as the base noise emission from the site and representative of the existing noise levels in Table 3.2. This method, whereby using measurements to establish the existing mine contribution rather than modelled results, provides a more accurate representation of current noise emissions and therefore a best practice approach Kestrel Extension # 4 modifications The second scenario was based on the 2006 mine plan for Kestrel South and the current mine plan for Kestrel South which includes the proposed amendment for Kestrel Extension #4. The primary difference between the 2006 mine plan and the current mine plan is the adjustment and realignment of underground longwall panels. EMM considered the noise emissions from the two scenarios to be the same. Therefore, for the noise assessment the two plans were considered as a single scenario. This scenario was modelled to determine noise levels from the site representative of Kestrel South including the proposed amendment for Kestrel Extension #4. Noise levels from the combined operation of all acoustically significant plant and equipment was predicted to surrounding residential locations during worst case prevailing meteorological conditions. The scenario assumes five fans, two conveyor drive motors and conveyor are operating simultaneously and at full duty throughout the 15 minute assessment period. Maintenance activities are assumed to occur intermittently, equivalent to approximately half the 15 minute assessment period. Modelled noise source locations are provided in Figure 5.1. Planning + Environment + Acoustics J12030RP1 12
 represents a line source. Figure 5.1 Noise source locations 5.")
119 Conveyor Ventilation fans Maintenance activities Conveyor drive motors Ventilation fan Notes: Red star (ventilation fans, maintenance activities and conveyor drive motors) represents a point source. Red line (conveyor) represents a line source. Figure 5.1 Noise source locations 5.3 Plant and equipment noise levels Acoustically significant plant and equipment considered in the model includes the conveyor and associated drives, ventilation fans and maintenance activities. Plant items such a light vehicles have not been considered as continuous noise from the before mentioned sources will dominate overall noise levels from the site during day, evening and night periods. Sound power level data used in the model has been taken from an EMM database which has been developed from acoustic measurements at similar Rio Tinto Coal Australia sites. Sound power level data used in the previous noise impact assessment report prepared for Kestrel South has also been used where suitable. Table 5.2 summarises the main operational noise sources and associated sound power levels. Single octave sound power levels are provided in Appendix B. Planning + Environment + Acoustics J12030RP1 13
120 Table 5.2 Indicative operations plant and equipment sound power levels Item Lw, L eq(15 min), db(a) Conveyor 79 (per meter) Conveyor drive motor 112 Maintenance activities 112 Ventilation fan Noise mitigation Further to the sound power level data provided in Table 5.2, the following noise mitigation has been included in the noise model: The conveyor is enclosed on the Lilyvale Road side and roof providing a minimum 5 db(a) of noise reduction; and An enclosure is installed around the conveyor drive motors providing a minimum reduction of 10 db(a). The above mitigation measures are understood to form part of the current design and are consistent with measures in the Environmental Management Plan for Kestrel South. Planning + Environment + Acoustics J12030RP1 14
121 6 Noise impact assessment 6.1 Results The predicted noise levels at receptors for all meteorological conditions for all modelling scenarios are provided in Table 6.1. Table 6.1 Prediction operational noise levels Receptor Period Noise Level, L eq,15 min, db(a) Noise Limit, Existing Predicted 2006 and 2012 L eq,15 min, db(a) Measured 1 Calm Winds mp. Inv. S1 S3 Day < 20 < Evening < 20 < Night < 20 < 20 < 20 < S4 Day 22 < Evening 22 < Night S5 Day 22 < Evening 22 < Night 22 < S6 Day 20 < Evening 20 < Night 20 < 20 < 20 < S7 Day 20 < Evening 20 < Night 20 < 20 < 20 < S8 S11 Day < 20 < Evening < 20 < Night < 20 < 20 < 20 < S12 Day < 20 < Evening < 20 < Night < 20 < Notes: 1. Existing contribution taken from Table Result summary Existing noise levels from the site comply with the EA noise limits during all meteorological scenarios for day, evening and night periods. The contemporary noise model results show noise levels from the site will increase as a result of all plant proposed for Kestrel South operating. Notwithstanding, with noise mitigation measures in place, noise levels are predicted to comply with day, evening and night EA noise limits during calm and identified prevailing weather conditions for the 2006 and 2012 scenario. There will be no change in noise levels between Kestrel South and Kestrel Extension # 4 operations. Planning + Environment + Acoustics J12030RP1 15
122 This page has been intentionally left blank Planning + Environment + Acoustics J12030RP1 16
123 7 Conclusion EMM has conducted a noise impact assessment of the Kestrel Extension # 4 Project. The assessment was prepared to support the Environmental Assessment Report. The purpose was to provide a contemporised assessment of noise impacts associated with the proposed mine modifications. A review of quarterly compliance noise monitoring reports was carried out to identify the current mine noise contribution at nearest residential receptors. This process also provided context of the most dominant (audible) noise sources and formed the current operating scenario for assessment purposes. The measured noise levels are below the EA noise limits for day, evening and night scenarios. A contemporised noise model of Kestrel South operations was developed which included the operation of the overland conveyor from the surface infrastructure site to the CHPP. Noise levels are higher as a result of the conveyor, however with all proposed mitigation measures in place, noise levels from the site were predicted below the EA noise limits during calm and prevailing weather conditions for day, evening and night scenarios. Kestrel Extension # 4 operations will not change surface plant and equipment and therefore noise levels at receivers will not change from Kestrel South operations. The mitigation considered in this assessment is understood to form part of the current mine design which is described in the Environmental Management Plan for Kestrel South. This assessment therefore qualifies that current mitigation is adequate in reducing noise from the site to acceptable levels. Overall, Kestrel South and proposed Kestrel Extension # 4 are expected to generate similar noise levels which are below the Environmental Authority noise limits and potential noise impacts at surrounding residential receptors are not considered a risk of the project. Planning + Environment + Acoustics J12030RP1 17
124 This page has been intentionally left blank Planning + Environment + Acoustics J12030RP1 18
125 Appendix A Wind roses Planning + Environment + Acoustics J12030RP1
126 Day Summer Spring North North 30% 30% Winter Autumn North North 30% 30% < The segments of each arm represent the six valid wind speed classes, with increasing windspeed from the centre > 3 outwards. The length of each arm represents the vector components (for each direction) of wind speeds 3m/s or below as a proportion of the total time for the period. Data Source: Emerald Airport The circle represents the 30% occurrence threshold. Data Range: Hourly, to
127 Evening Summer Spring North North 30% 30% Winter Autumn North North 30% 30% < > 3
128 Night Summer Spring North North 30% 30% Winter Autumn North North 30% 30% < > 3
129 Night - Combined Wind and Inversions Summer Spring North North 30% 30% Winter Autumn North North 30% 30% < > 3
130 This page has been intentionally left blank Planning + Environment + Acoustics J12030RP1
131 Appendix B Plant and equipment sound power levels Planning + Environment + Acoustics J12030RP1
132 Table B.1 Plant and equipment sound power level spectra Noise Source Linear Frequency (Hz), db Total db(a) Conveyor (per meter) Conveyor drive motor Maintenance activities Ventilation fan Planning + Environment + Acoustics J12030RP1 B.1
133 This page has been intentionally left blank Planning + Environment + Acoustics J12030RP1 B.2

134 EMM EMGA Mitchell McLennan SYDNEY
WAMBO COAL PTY LTD REPORT 2 NORTH WAMBO UNDERGROUND MINE EXTRACTION PLAN LONGWALLS 8 TO 10A GROUNDWATER IMPACT ASSESSMENT REVIEW
 WAMBO COAL PTY LTD NORTH WAMBO UNDERGROUND MINE EXTRACTION PLAN LONGWALLS 8 TO 10A REPORT 2 GROUNDWATER IMPACT ASSESSMENT REVIEW Date: To: From: Re: Ref: 9 April 2015 Micheal Alexander Director Projects
Environmental Impact Statement. Avoca Tank Project
 ABN 88 100 095 494 Environmental Impact Statement for the Avoca Tank Project Prepared by: R.W. CORKERY & CO. PTY. LIMITED July 2014 This page has intentionally been left blank ABN 88 100 095 494 Environmental
11 HYDROLOGY, HYDROGEOLOGY AND DRAINAGE
 11 HYDROLOGY, HYDROGEOLOGY AND DRAINAGE 11.1 introduction 11.1.1 The objective of this section and the statements presented is to assess the existing hydrological and hydrogeological conditions to understand
working with you to develop practical water resources and environmental solutions
 working with you to develop practical water resources and environmental solutions LAKE MAITLAND WATER SUPPLY INTERIM REPORT Document Status Revision Date Revision Description a 21/12/2006 Interim Report
Potential effects evaluation of dewatering an underground mine on surface water and groundwater located in a rural area
 Potential effects evaluation of dewatering an underground mine on surface water and groundwater located in a rural area ITRODUCTIO Michel Mailloux* Eng. M.Sc, Vincent Boisvert, M.Sc, Denis Millette, Eng.,
Environmental Effects of Dewatered Open Pit Mines
 Environmental Effects of Dewatered Open Pit Mines By Dr R. Jambrik Associate Professor, Head of the Department of Hydrogeology and Engineering Geology, University ofmiskolc ABSTRACT Before the initial
Advice to decision maker on coal mining project
 . Advice to decision maker on coal mining project IESC 2015-063: West Muswellbrook Project New Development Requesting agency The New South Wales Mining and Petroleum Gateway Panel Date of request 27 January
ATTACHMENT 2. Aquifer Interference Policy Considerations and Water Licensing COWAL GOLD OPERATIONS MINE LIFE MODIFICATION
 ATTACHMENT 2 Aquifer Interference Policy Considerations and Water Licensing COWAL GOLD OPERATIONS MINE LIFE MODIFICATION Environmental Assessment 2016 TABLE OF CONTENTS A2 AQUIFER INTERFERENCE POLICY CONSIDERATIONS
Groundwater 3/16/2010. GG22A: GEOSPHERE & HYDROSPHERE Hydrology
 GG22A: GEOSPHERE & HYDROSPHERE Hydrology Definitions Groundwater Subsurface water in soil or rock that is fully saturated. Aquifer Contains enough saturated material to yield significant quantities of
IN-SITU PERMEABILITY TESTING RESULTS
 APPENDIX F IN-SITU PERMEABILITY TESTING RESULTS Document/Report Control Form DOCUMENT / REPORT CONTROL FORM File Location Name: Project Name: Roma Flood Levee - Geotechnical Investigation Project
ATTACHMENT 5 AQUIFER INTERFERENCE POLICY AND WATER LICENSING ADDENDUM
 ATTACHMENT 5 AQUIFER INTERFERENCE POLICY AND WATER LICENSING ADDENDUM COWAL GOLD MINE EXTENSION MODIFICATION TABLE OF CONTENTS A5 AQUIFER INTERFERENCE POLICY CONSIDERATIONS AND WATER LICENSING ADDENDUM
Subsidence Peer Review
 I Subsidence Peer Review BYLONG COAL PROJECT Environmental Impact Statement BYLONG COAL PROJECT EIS I 22 December 2014 Rory Gordon WorleyParsons L11 12/141 Walker Street North Sydney NSW 2060 Dear Rory
Numerical Groundwater Flow Model Report. Caloosa Materials, LLC 3323 Gulf City Road Ruskin, Florida 33570
 Numerical Groundwater Flow Model Report Caloosa Materials, LLC 3323 Gulf City Road Ruskin, Florida 33570 GHD 2675 Winkler Ave Suite 180 Fort Myers, FL 33901 11138224 Report July 27, 2017 Table of Contents
APPENDIX 11. Subsidence Assessment (MSEC)
") APPENDIX 11 Subsidence Assessment (MSEC) Austar Coal Mine Pty Limited REPORT on THE PREDICTION OF SUBSIDENCE PARAMETERS AND THE ASSESSMENT OF MINE SUBSIDENCE IMPACTS ON NATURAL FEATURES AND SURFACE INFRASTRUCTURE
APPENDIX 11 Subsidence Assessment (MSEC) Austar Coal Mine Pty Limited REPORT on THE PREDICTION OF SUBSIDENCE PARAMETERS AND THE ASSESSMENT OF MINE SUBSIDENCE IMPACTS ON NATURAL FEATURES AND SURFACE INFRASTRUCTURE
Groundwater basics. Groundwater and surface water: a single resource. Pore Spaces. Simplified View
 Groundwater and surface water: a single resource Santa Cruz River, Tucson Groundwater basics Groundwater is water found within the pore spaces of geologic material beneath the surface of the Earth. It
General Groundwater Concepts
 General Groundwater Concepts Hydrologic Cycle All water on the surface of the earth and underground are part of the hydrologic cycle (Figure 1), driven by natural processes that constantly transform water
Moolarben Coal Complex UG1 Optimisation Modification. Environmental Assessment APPENDIX F SURFACE WATER ASSESSMENT REVIEW
 Moolarben Coal Complex UG1 Optimisation Modification Environmental Assessment APPENDIX F SURFACE WATER ASSESSMENT REVIEW Moolarben Coal Complex UG1 Optimisation Modification Surface Water Assessment Review
SUCCESSFUL INFILL DRILLING CAMPAIGN COMPLETED
 31 Ord Street, West Perth WA 6005 PO Box 1941, West Perth WA 6872 +61 8 9322 1003 australianpotash.com.au @OzPotash ABN 58 149 390 394 13 November 2018 SUCCESSFUL INFILL DRILLING CAMPAIGN COMPLETED DEEP
Spur Hill Underground Coking Coal Project. Groundwater Assessment for Gateway Application. Tuesday 16 June 2015
 Spur Hill Underground Coking Coal Project Groundwater Assessment for Gateway Application Tuesday 16 June 2015 HydroSimulations 2 Track record in groundwater assessment and modelling for water resources,
Groundwater and surface water: a single resource. Santa Cruz River, Tucson
 Groundwater and surface water: a single resource Santa Cruz River, Tucson 1942 1989 1 Groundwater basics Groundwater is water found within the pore spaces of geologic material beneath the surface of the
Whiskey Creek. Groundwater Supply Assessment
 Whiskey Creek Groundwater Supply Assessment August 2012 GW Solutions Inc. 3591 Ranch Point Road Nanaimo, BC V9R 6W9 phone: (250) 756-4538 cell: (250) 713-4538 email: gwsolutions@shaw.ca RDN Whiskey Creek
Lorena Mine Project. Preliminary Mine Plan - Water Supply
 Lorena Mine Project Preliminary Mine Plan - Water Supply Prepared for: Prepared by: September 2013 i TABLE OF CONTENTS Table of Contents... i 1 INTRODUCTION... 1 2 WATER DEMANDS... 2 3 WATER SOURCES...
Evaluation of Void Water intercepted by Werris Creek Coal Mine Operations
 Evaluation of Void Water intercepted by Werris Creek Coal Mine Operations Prepared for: Werris Creek Coal Pty Ltd Prepared by: Australia Pty Ltd Date: 10 April 2014 Project Number: 10 April 2014 Prepared
6. Hydrogeological zones and groundwater resources balance baseflow map of the Czech Republic. Jiri Sima
 6. Hydrogeological zones and groundwater resources balance baseflow map of the Czech Republic Jiri Sima General content Regional hydrogeological units Groundwater resources assessment Water balancing background
8 Geology, Hydrology, Hydrogeology
 Camster II Wind Farm Scoping Report 50 8 Geology, Hydrology, Hydrogeology 8.1 Introduction The EIA will consider the potential issues arising from the construction, operation and decommissioning of the
in brief corrs Policy What it means for developments in april 2012
 corrs in brief april 2012 Delivery of the Strategic Regional Land Use Policy What it means for developments in regional areas The NSW Government has recently released a number of draft plans, policies
TORO ENERGY LAKE MAITLAND DEWATERING AND WATER BALANCE REVIEW
 DATE 9 June 2015 PROJECT No. TO John Baines Toro Energy Ltd CC FROM Greg Hookey, Geneviève Marchand EMAIL ghookeyr@golder.com.au TORO ENERGY LAKE MAITLAND DEWATERING AND WATER BALANCE REVIEW 1.0 INTRODUCTION
Background. Much of the CA is directly underlain by the Walloon Coal Measures (WCM) which are the target of proposed coalbed methane (CBM) development
 which are the target of proposed coalbed methane (CBM) development") WaterTech 2016 Banff, Canada April 8, 2016 A Multi-Disciplinary Assessment of Hydrogeological Connectivity between Coal Measures and an Overlying Water Supply Aquifer, and Potential Impacts of Coalbed
WaterTech 2016 Banff, Canada April 8, 2016 A Multi-Disciplinary Assessment of Hydrogeological Connectivity between Coal Measures and an Overlying Water Supply Aquifer, and Potential Impacts of Coalbed
MR. & MRS. HERBERT DAY 5595 Hartnell Road Site 7A - 5, R.R. 8 VERNON, B.C. V1T 8L6
 EVALUATION OF WATER SUPPLY FOR A PkOPOSED SUBDIVISION LOCATED NORTHWEST OF THE INTERSECTION OF HARTNELL ROAD AND DAY ROAD, AT VERNON, B.C. Prepared for MR. & MRS. HERBERT DAY 5595 Hartnell Road Site 7A
Comet Ridge s Galilee Basin Extended Production Test Project Galilee Basin Coal & Energy Conference 2013 Tor McCaul, Managing Director 25 November
 Comet Ridge s Galilee Basin Extended Production Test Project Galilee Basin Coal & Energy Conference 2013 Tor McCaul, Managing Director 25 November 2013 Introduction Comet Ridge Limited Strategic CSG assets
Groundwater Stratification and Impact on Coal Mine Closure
 Groundwater Stratification and Impact on Coal Mine Closure Andrew Johnstone 1, Ingrid Dennis 2, Norman McGeorge 3 Abstract 1 GCS (Pty) Ltd, PO Box 2597, Rivonia, 2128 South Africa. andrewj@gcs-sa.biz 2
Movement and Storage of Groundwater The Hydrosphere
 Movement and Storage of Groundwater The Hydrosphere The water on and in Earth s crust makes up the hydrosphere. About 97 percent of the hydrosphere is contained in the oceans. The water contained by landmasses
ORLANDO SANFORD INTERNATIONAL AIRPORT OUTPARCEL 1 SANFORD, FLORIDA
 PRELIMINARY GEOTECHNICAL STUDY ORLANDO SANFORD INTERNATIONAL AIRPORT OUTPARCEL 1 SANFORD, FLORIDA November 9, 2015 Prepared For: Ms. Diane H. Crews, A.A.E. Sanford Airport Authority 1200 Red Cleveland
ORLANDO SANFORD INTERNATIONAL AIRPORT OUTPARCEL 6 SANFORD, FLORIDA
 PRELIMINARY GEOTECHNICAL STUDY ORLANDO SANFORD INTERNATIONAL AIRPORT OUTPARCEL 6 SANFORD, FLORIDA November 9, 2015 Prepared For: Ms. Diane H. Crews, A.A.E. Sanford Airport Authority 1200 Red Cleveland
Carmichael Mine Project Protecting the Doongmabulla Springs
 Carmichael Mine Project Protecting the Carmichael Mine Project Protecting the About the The are located in central Queensland and are home to a variety of native plant and animal species that are dependent
Statement of evidence of Jonathan Williamson (hydrogeology) for the New Zealand Transport Agency
 for the New Zealand Transport Agency") Before a Board of Inquiry under: the Resource Management Act 1991 in the matter of: applicant: Notices of requirement for designation and resource consent applications by the New Zealand Transport Agency
Before a Board of Inquiry under: the Resource Management Act 1991 in the matter of: applicant: Notices of requirement for designation and resource consent applications by the New Zealand Transport Agency
Office of Land and Water Evaluations of Groundwater Resources of Southern Mississippi
 Office of Land and Water Evaluations of Groundwater Resources of Southern Mississippi Virtually all of the water used for public and domestic drinking water supplies in southern Mississippi is derived
Groundwater Stratification and Impact on Coal Mine Closure
 Golden CO; USA Reliable Mine Water Technology IMWA 2013 Groundwater Stratification and Impact on Coal Mine Closure Andrew Johnstone¹, Ingrid Dennis², Norman McGeorge³ ¹ GCS (Pty) Ltd, PO Box 2597, Rivonia,
Aquifer Characterization and Drought Assessment Ocheyedan River Alluvial Aquifer
 Aquifer Characterization and Drought Assessment Ocheyedan River Alluvial Aquifer Iowa Geological Survey Water Resources Investigation Report 10 Aquifer Characterization and Drought Assessment Ocheyedan
15% Increase in JORC Inferred Coal Resource to 1.36 Billion Tonnes
 ASX/Media Announcement 10 September 2012 Level 12, 301 Coronation Drive, Milton QLD 4064 Australia PO Box 2118, Toowong DC QLD 4066 Australia phone + 61 (0) 7 3337 9944 fax + 61 (0) 7 3337 9945 Carbon
William Wilmot Matrix Solutions Inc. 118, Avenue S.W., Calgary, Alberta, Canada
 Hydrogeologic Assessment in Support of the Development of the Peace River Oil Sands Deposit: A Case Study Concerning a Pilot-Scale in-situ SAGD Operation William Wilmot Matrix Solutions Inc. 118, 319-2
8 Geology, Hydrology & Hydrogeology
 Inverneill Wind Farm Scoping Report Page 42 8 Geology, Hydrology & Hydrogeology 8.1 Introduction The EIA will consider the potential issues arising from the construction, operation and decommissioning
The Study of Reservoir Immersion of a Hydropower Station
 2017 2 nd International Conference on Architectural Engineering and New Materials (ICAENM 2017) ISBN: 978-1-60595-436-3 The Study of Reservoir Immersion of a Hydropower Station Shi You Zhang, Ai Guo Li
WELLHEAD PROTECTION DELINEATION REPORT FOR THE VILLAGE OF BEAR LAKE DECEMBER 2002
 WELLHEAD PROTECTION DELINEATION REPORT FOR THE VILLAGE OF BEAR LAKE DECEMBER 2002 Prepared by: Gosling Czubak Engineering Sciences, Inc. 1280 Business Park Drive Traverse City, Michigan 48686 Telephone:
Pattle Delamore Partners Limited
 INVESTIGATION Hutt Valley Aquifer PROJECT Drinking Water Supply Protection Zones CLIENT Wellington Water PROJECT NO C02857504 CLIENT CONTACT Geoff Williams PREPARED BY Katy Grant CLIENT WORK ORDER NO/
3. MINING SYSTEM AND RESOURCE RECOVERY
 3. MINING SYSTEM AND RESOURCE RECOVERY (SMP Guideline Section 6.1) 3.1. MINING METHOD Longwalls 705 to 710 will be extracted using a longwall retreating system of mining, an established method of coal
Groundwater Earth 9th Edition Chapter 17 Mass wasting: summary in haiku form Importance of groundwater Importance of groundwater
 1 2 3 4 5 6 7 8 9 10 11 Groundwater Earth 9 th Edition Chapter 17 Geology 100 Mass wasting: summary in haiku form The grass is greener over the septic system said Erma Bombeck. Importance of groundwater
APPENDIX F GEOTECHNICAL INVESTIGATION UPDATE CITY OF SANTA CRUZ D RAFT EIR L A B AHIA H OTEL JANUARY 2014
 GEOTECHNICAL INVESTIGATION UPDATE. CITY OF SANTA CRUZ D RAFT EIR L A B AHIA H OTEL JANUARY 2014 October 5, 2013 Project No. SCR-0720 SANTA CRUZ SEASIDE COMPANY Craig French 911 Center Street, Suite B Santa
Assessment of the Groundwater Quantity Resulting from Artificial Recharge by Ponds at Ban Nong Na, Phitsanulok Province, Thailand
 Research article erd Assessment of the Groundwater Quantity Resulting from Artificial Recharge by Ponds at Ban Nong Na, Phitsanulok Province, Thailand SIRIRAT UPPASIT* Faculty of Technology, Khon Kaen
Landscapes & Industries
 K N O W L E D G E Landscapes & Industries Groundwater Flow Systems Framework ESSENTIAL TOOLS FOR PLANNING SALINITY MANAGEMENT Summary Report Glen Walker, Mat Gilfedder, Ray Evans, Phil Dyson & Mirko Stauffacher
Information Request 11
 Information Request 11 Information Request 11 11-1 Responses to Information Request 11 Response to Information Request 11a Response to Information Request 11b 11-2 11-6 Federal Review Panel Information
Shallow Cover Tunnel Under Heritage Listed Brick Buildings: Brisbane Boggo Road Busway Tunnel
 Shallow Cover Tunnel Under Heritage Listed Brick Buildings: Brisbane Boggo Road Busway Tunnel by Ted Nye, Tunnel Designer Manager, Sinclair Knight Merz and Max Kitson, Senior Geotechnical Engineer, Sinclair
OUTLINE OF PRESENTATION
 GROUNDWATER?? OUTLINE OF PRESENTATION What is groundwater? Geologic investigation Definitions: aquifer and aquitard, unconfined and semi-confined Water level and interpretation of water level data Well
Debrob Investments Limited FUNCTIONAL SERVICING REPORT DRAFT PLAN OF SUBDIVISION, CITYVIEW DRIVE CITY OF GUELPH
 JULY 2013 DOCUMENT CONTROL Client: Project Name: Report Title: IBI Reference: 25528 Cityview Drive Version: JULY 2013 Digital Master: Originator: Reviewer: Authorization: [File Location] Scott MacDonald,
4.5 GEOTECHNICAL, SUBSURFACE, AND SEISMIC HAZARDS
 4.5 GEOTECHNICAL, SUBSURFACE, AND SEISMIC HAZARDS This section discusses the geology, soils, seismicity, hazardous materials, and subsurface obstructions along Flower Street, and evaluates their potential
The groundwater study is relevant to both the MLP and EIS.
 1 2 3 Iron Road has been engaging with the community for a number of years now and water, particularly water security, has been a common theme raised by Eyre Peninsula residents in many forums. Rather
A Risk Analysis Subsidence Approach for the Design of Coal Refuse Impoundments Overlying Mine Workings
 A Risk Analysis Subsidence Approach for the Design of Coal Refuse Impoundments Overlying Mine Workings M. Karmis Department of Mining and Minerals Engineering, Virginia Polytechnic Institute and State
Research on Sustainable Utilization of Shallow Geothermal Resources in Beijing, China
 Proceedings World Geothermal Congress 2015 Yu Yuan, China, 19-25 April 2015 Research on Sustainable Utilization of Shallow Geothermal Resources in Beijing, China Yu Yuan, Zheng Jia and Zou Yuanlin China
CHAPTER 13 OUTLINE The Hydrologic Cycle and Groundwater. Hydrologic cycle. Hydrologic cycle cont.
 CHAPTER 13 OUTLINE The Hydrologic Cycle and Groundwater Does not contain complete lecture notes. To be used to help organize lecture notes and home/test studies. Hydrologic cycle The hydrologic cycle is
DEVELOPMENT OF AQUIFER TESTING PLANS. Brent Bauman, P.G. / Erin Lynam, Aquatic Biologist
 DEVELOPMENT OF AQUIFER TESTING PLANS Brent Bauman, P.G. / Erin Lynam, Aquatic Biologist DEVELOPMENT OF AQUIFER TESTING PLANS Goals of Aquifer Testing What questions are we trying to answer Staff review
Innovation in the mining industry Derisking access to underground mines using Tunnel Boring Machines
 Innovation in the mining industry Derisking access to underground mines using Tunnel Boring Machines GHD Energy & Resources Brendan Henry Manager, Tunnels and Underground Spaces Safety Commitment Safety
Monitoring Program Groundwater
 Procedure Document No. 2791 Document Title Monitoring Program Groundwater Area HSE Issue Date 23 August 2017 Major Process Environment Sub Process Checking Authoriser Jacqui McGill Asset President Version
A SAFE MINE IS AN EFFICIENT MINE. END OF STORY. TO GROUT OR NOT TO GROUT?
 FEBRUARY 2013 - VOLUME 22 NUMBER 02 TO GROUT OR NOT TO GROUT? Brad Crenshaw, P.E. P.G., Ground Engineering Contractors, Scott Langley, White Oak Resources LLC, Vic Daiber, P.E. P.L.S., Pittman Mine Services
DEPARTMENT OF ENVIRONMENTAL RESOURCES REVIEW NOTICE
 DEPARTMENT OF ENVIRONMENTAL RESOURCES REVIEW NOTICE This report, prepared by outside consultants, has been reviewed by the Department of Environmental Resources and approved for publication. The contents
Category 1 Waste Rock Stockpile Groundwater Containment System
 Memorandum To: Jennifer Saran, Poly Met Mining Inc. Project: 23690862.00-042-008 1.0 Introduction The Co-Lead Agencies have requested a summary of the four containment systems that are planned for the
Hydrogeology 101 3/7/2011
 Hydrogeology 101 W. Richard Laton, Ph.D., PG, CPG Associate Professor of Hydrogeology California State University, Fullerton Department of Geological Sciences 1 Hydrogeology 101 The objective is to obtain
Introduction to Longwall Mining and Subsidence
 Introduction to Longwall Mining and Subsidence Prepared by Mine Subsidence Engineering Consultants Level 1 / 228 Victoria Avenue Chatswood NSW 2067 PO Box 3047 Willoughby North NSW 2068 Tel. (02) 9413
Witness Statement - Amendment C207 to the Hume Planning Scheme (Sunbury South Precinct Structure Plan)
") Witness Statement - Amendment C207 to the Hume Planning Scheme (Sunbury South Precinct Structure Plan) 1. Name and Address Mr Slavko Kacavenda c/- GHD 180 Lonsdale Street Melbourne 2. Qualifications and
Witness Statement - Amendment C207 to the Hume Planning Scheme (Sunbury South Precinct Structure Plan) 1. Name and Address Mr Slavko Kacavenda c/- GHD 180 Lonsdale Street Melbourne 2. Qualifications and
Case Studies in the Application of Influence Functions to Visualising Surface Subsidence
 University of Wollongong Research Online Coal Operators' Conference Faculty of Engineering and Information Sciences 23 Case Studies in the Application of Influence Functions to Visualising Surface Subsidence
United Wambo Open-Cut Coal Mine Project Groundwater Impact Assessment
 Australasian Groundwater and Environmental Consultants Pty Ltd (AGE) Report on United Wambo Open-Cut Coal Mine Project Groundwater Impact Assessment Prepared for Umwelt Australia Pty Ltd Project No. G1733
NOTE ON WELL SITING AT CORNER OF CASTLE VALLEY DRIVE AND SHAFER LANE FOR TOWN OF CASTLE VALLEY, GRAND COUNTY, UTAH
 NOTE ON WELL SITING AT CORNER OF CASTLE VALLEY DRIVE AND SHAFER LANE FOR TOWN OF CASTLE VALLEY, GRAND COUNTY, UTAH Authors: Dr. Kenneth E. Kolm, Hydrologic Systems Analysis, LLC., Golden, Colorado and
Environmental Assessment
 Tarrawonga Coal Project Environmental Assessment APPENDIX R CONCEPT DESIGN FOR LOW PERMEABILITY BARRIER AND PERMANENT GOONBRI CREEK ALIGNMENT Tarrawonga Coal Pty Ltd TARRAWONGA COAL PTY LTD TARRAWONGA
Arrow Energy EIS GROUNDWATER IMPACT ASSESSMENT. April 2012
 Arrow Energy SURAT GAS PROJECT EIS GROUNDWATER IMPACT ASSESSMENT Jeroen van Dillewijn April 2012 FIRST A REFRESHER... Groundwater occurs in pores and fractures in rock and soil. Aquifers are layers that
CHAPTER 4 GEOTECHNICAL SITE CHARACTERIZATION
 CHAPTER 4 GEOTECHNICAL SITE CHARACTERIZATION Chapter Organization 4.1 Introduction... 4-1 4.2 Applicability... 4-1 4.3 Minimimum Requirements... 4-2 4.3.1 Geotechnical Site Characterization Report... 4-3
Groundwater in Anne Arundel County, Maryland
 Groundwater in Anne Arundel County, Maryland Presented to Fort George G. Meade Restoration Advisory Board March 15, 2012 David W. Bolton Maryland Geological Survey Physiographic Provinces and Aquifer Types
CCR RULE 40CFR LOCATION RESTRICTIONS CRITERIA CERTIFICATION REPORT ASH DISPOSAL FACILITY COMANCHE STATION PUEBLO, COLORADO
 CCR RULE 40CFR 257.60 64 LOCATION RESTRICTIONS CRITERIA CERTIFICATION REPORT ASH DISPOSAL FACILITY COMANCHE STATION PUEBLO, COLORADO Prepared For: Public Service Company of Colorado (PSCo) Prepared by:
Capital Area Ground Water Conservation Commission
 Capital Area Ground Water Conservation Commission Purpose and Scope Plan for Management of the Southern Hills Aquifer System in the Baton Rouge Area September 19, 2017 The Southern Hills Aquifer System
For personal use only
 13 October 2016 First test production bores successfully installed First two of four planned test production bores successfully installed Next two test production bores will be installed over coming weeks
Drainage Strategy Report
 CONSULTING ENGINEERS Report No: Date: C1014 Aug 2017 Project: Drainage Strategy Report Danygraig Works, Risca Client: P.D. Edenhall This report is provided for the benefit only of the party to whom it
ENGINEERING HYDROLOGY
 ENGINEERING HYDROLOGY Prof. Rajesh Bhagat Asst. Professor Civil Engineering Department Yeshwantrao Chavan College Of Engineering Nagpur B. E. (Civil Engg.) M. Tech. (Enviro. Engg.) GCOE, Amravati VNIT,
Monitoring Program Groundwater
 Procedure Document No. 2791 Document Title Area Shared Services Issue Date 27 July 2018 Major Process Environment Sub Process Environment Authoriser Jacqui McGill Asset President Version Number 16 TABLE
Groundwater Flow Evaluation and Spatial Geochemical Analysis of the Queen City Aquifer, Texas
 Groundwater Flow Evaluation and Spatial Geochemical Analysis of the Queen City Aquifer, Texas Abstract The Queen City Aquifer is a saturated sandstone unit in the coastal plain of East Texas. The goals
Modelling approach to predict peak inflows at the Argyle block cave mine, Western Australia
 Modelling approach to predict peak inflows at the Argyle block cave mine, Western Australia Geoff Beale 2, Toddy Syaifullah 1, Dadang Saepulloh 1, Stuart Daley 2 1 Argyle Diamond Mine, Rio Tinto, Perth,
SUBMISSION NUMBER 13 SUNWATER BYERWEN COAL PTY LTD BYERWEN COAL PROJECT
 SUBMISSION NUMBER 13 SUNWATER BYERWEN COAL PTY LTD BYERWEN COAL PROJECT AIEIS for the 13. SUBMISSION NUMBER 13 SUNWATER 13.1 Issue Number 13.1 Section 3.2 of the Byerwen Coal project Terms of Reference
For personal use only
 Initial JORC Reserves Estimate for Bluff Project HIGHLIGHTS Initial JORC Reserves Estimate of 11 Mt mineable for Bluff Project In-fill drilling program completed to support further Resources and Reserves
Capital Area Ground Water Conservation Commission
 Capital Area Ground Water Conservation Commission Purpose and Scope Plan for Management of the Southern Hills Aquifer System in the Baton Rouge Area April 8, 2014 The Southern Hills Aquifer System (aquifer
The SADC Hydrogeological Map & Atlas: Towards an improved understanding of groundwater regimes in Southern Africa
 The SADC Hydrogeological Map & Atlas: Towards an improved understanding of groundwater regimes in Southern Africa K. Pietersen 1, N. Kellgren 2, O. Katai 3 and M. Roos 4 (1) Water Geosciences Consulting,
A risk based assessment to rockfall mitigation
 Parkes, C.J. (2017) A risk based assessment to rockfall mitigation Proc. 20 th NZGS Geotechnical Symposium. Eds. GJ Alexander & CY Chin, Napier A risk based assessment to rockfall mitigation C J Parkes
1.0 INTRODUCTION. 28 th November Hawke s Bay Project Management Limited 1139 Maraekakaho Road RD5 Hastings, 4175.
 28 th November 2016 Hawke s Bay Project Management Limited 1139 Maraekakaho Road RD5 Hastings, 4175 Attn: John Roil RE: IRONGATE INDUSTRIAL AREA WATER SUPPLY 1.0 INTRODUCTION Industrial development is
4. Groundwater Resources
 4. Groundwater Resources 4-1 Majority (97 %) of unfrozen fresh water on earth exists as groundwater. In comparison to surface water, - groundwater is available all year around - groundwater is mostly invisible
Appendix I Stage 1 groundwater monitoring bore pumping tests
 Appendix I Stage 1 groundwater monitoring bore pumping tests Aquifer Testing Report Stage 1 Groundwater Monitoring Wells Rev [B] [March 212] Uncontrolled when printed GROUNDWATER PROJECT Groundwater Project
ASSESSMENT OF UTILIZABLE GROUNDWATER RESOURCES IN A COASTAL SHALLOW AQUIFER
 ASSESSMENT OF UTILIZABLE GROUNDWATER RESOURCES IN A COASTAL SHALLOW AQUIFER V. S. SINGH AND V. K. SAXENA National Geophysical Research Institute, Uppal Rd, Hyderabad, 500 007, India In the recent years
Dewatering Fly Ash for Remediation: Two Approaches
 2015 World of Coal Ash (WOCA) Conference in Nasvhille, TN - May 5-7, 2015 http://www.flyash.info/ Dewatering Fly Ash for Remediation: Two Approaches Gregory M. Landry, P.E. Moretrench American Corporation,
Overview. Students will...
 Overview Students will... Understand the interaction between ground water and surface water. Observe the difference between a permeable layer and an impermeable layer in an aquifer. See how water is stored
Hume Project: Sutton Forest Coal Exploration Licence EL 349. Groundwater Study
 Hume Project: Sutton Forest Coal Exploration Licence EL 349 Groundwater Study April 2014 Table of Contents 1. Groundwater Study: Background and Synopsis Southern Highlands Coal Action Group, 23 March 2014
Protecting Water, Producing Gas
 FACT Protecting SHEET Water Producing Gas THE IMPACT OF NATURAL GAS & COALBED METHANE ON GROUNDWATER IN ALBERTA Protecting Water, Producing Gas How the production of natural gas, including coalbed methane,
Groundwater. Groundwater Movement. Groundwater Movement Recharge: the infiltration of water into any subsurface formation.
 On March 22, 2014, a major landslide occurred near Oso, Washington. Death toll currently at 30, with 15 still missing. Groundwater Before and After Swipe http://bit.ly/pen1jt N. Fork Stillaguamish River
Coal mine goaf gas predictor (CMGGP)
") University of Wollongong Research Online Coal Operators' Conference Faculty of Engineering and Information Sciences 2010 Coal mine goaf gas predictor (CMGGP) Les Lunarzewski Lunagas Pty Ltd Publication
University of Wollongong Research Online Coal Operators' Conference Faculty of Engineering and Information Sciences 2010 Coal mine goaf gas predictor (CMGGP) Les Lunarzewski Lunagas Pty Ltd Publication
9.1 Introduction. 9.2 Issues
 9 Groundwater 9.1 Introduction Groundwater is the water that occupies or moves through openings, cavities or spaces in geological formations under the ground. It is an important resource to many of Otago
Addendum to Groundwater Flow Modeling Conducted for Simulation of Rosemont Copper's Proposed Mine Supply Pumping Sahuarita, Arizona
 November 11, 2010 REPORT ADDENDUM Addendum to Groundwater Flow Modeling Conducted for Simulation of Rosemont Copper's Proposed Mine Supply Pumping Sahuarita, Arizona Prepared for: Prepared by: Errol L.