Outer Cove Brook Network
|
|
|
- Veronica Rodgers
- 6 years ago
- Views:
Transcription


1 Real Time Water Quality Report Outer Cove Brook Network Deployment Period May 3 to June 4, 2013 Government of Newfoundland & Labrador Department of Environment and Conservation Water Resources Management Division
2 Prepared by: Kyla Brake Environmental Scientist Water Resources Management Division Department of Environment & Conservation 4th Floor, Confederation Building, West Block PO Box 8700, St. John's NL A1B 4J6 Ph. No.: (709) Fax No.: (709)


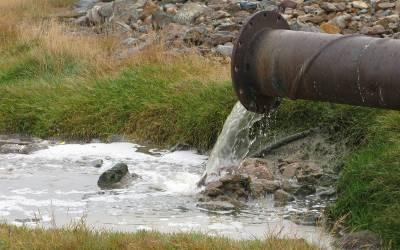
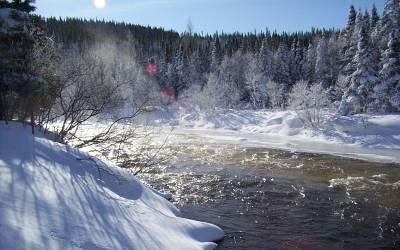
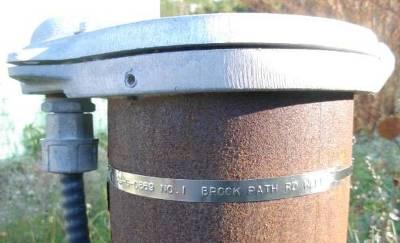
3 General The Water Resources Management Division (WRMD), in partnership with the City of St. John s and Environment Canada, maintain two real-time water quality and water quantity monitoring stations along Outer Cove Brook. This deployment report discusses water quality related events occurring at the stations: Outer Cove Brook below Airport and Outer Cove Brook at Clovelly Golf Course in St. John s. WRMD staff monitors the real-time web pages regularly. The City of St. John s will be notified of any water quality issues that arise so mitigative measures can be taken. The purpose of these real-time stations is to monitor, process and publish hydrometric (water quantity) and real-time water quality data at the real-time stations. Outer Cove Brook is in the vicinity of the Torbay Road North Commercial Development Area and the real-time stations allow for assessment and management of the water body. This report covers the 31-day period from deployment on May 3, 2013 until removal on June 4, Figure 1: Outer Cove Brook Real-Time Water Quality and Quantity Stations. 3
4 Quality Assurance and Quality Control As part of the Quality Assurance and Quality Control protocol (QA/QC), an assessment of the reliability of data recorded by an instrument is made at the beginning and end of the deployment period. The procedure is based on the approach used by the United States Geological Survey. At deployment and removal, a QA/QC Sonde is temporarily deployed alongside the Field Sonde. Values for temperature, ph, conductivity, dissolved oxygen and turbidity are compared between the two instruments. Based on the degree of difference between the parameters on the Field Sonde and QA/QC Sonde at deployment and at removal, a qualitative statement is made on the data quality (Table 1). Table 1: Instrument Performance Ranking classifications for deployment and removal Rank Parameter Excellent Good Fair Marginal Poor Temperature ( C) <=+/-0.2 >+/-0.2 to 0.5 >+/-0.5 to 0.8 >+/-0.8 to 1 <+/-1 ph (unit) <=+/-0.2 >+/-0.2 to 0.5 >+/-0.5 to 0.8 >+/-0.8 to 1 >+/-1 Sp. Conductance (μs/cm) <=+/-3 >+/-3 to 10 >+/-10 to 15 >+/-15 to 20 >+/-20 Sp. Conductance > 35 μs/cm (%) <=+/-3 >+/-3 to 10 >+/-10 to 15 >+/-15 to 20 >+/-20 Dissolved Oxygen (mg/l) (% Sat) <=+/-0.3 >+/-0.3 to 0.5 >+/-0.5 to 0.8 >+/-0.8 to 1 >+/-1 Turbidity <40 NTU (NTU) <=+/-2 >+/-2 to 5 >+/-5 to 8 >+/-8 to 10 >+/-10 Turbidity > 40 NTU (%) <=+/-5 >+/-5 to 10 >+/-10 to 15 >+/-15 to 20 >+/-20 It should be noted that the temperature sensor on any sonde is the most important. All other parameters can be divided into subgroups of: temperature dependant, temperature compensated and temperature independent. Due to the temperature sensor s location on the sonde, the entire sonde must be at a constant temperature before the temperature sensor will stabilize. The values may take some time to climb to the appropriate reading; if a reading is taken too soon it may not accurately portray the water body. Deployment and removal instrument performance rankings for Outer Cove Brook below Airport for the period of May 3, 2013 through to June 4, 2013 are summarized in Table 2. Table 2: Instrument performance rankings for Outer Cove Brook below Airport May 3, 2013 June 4, 2013 Station Below Airport Date Action Comparison Ranking Temperature ph Conductivity Dissolved Oxygen Turbidity May Deployment Good Excellent Fair Excellent Excellent June Removal Good Fair Poor Poor Poor 4
5 At the Outer Cove Brook below Airport station at the point of deployment, the turbidity, ph and dissolved oxygen sensors ranked excellent while temperature ranked good. The conductivity sensor ranked fair, likely due to the QA/QC sonde or field sonde reading being taken before the probe had stabilized or sediments being resuspended between the QAQC and field readings. At removal, temperature ranked as good. ph ranked as fair while conductivity, dissolved oxygen and turbidity ranked as poor, as was to be expected after observing a constant rise in turbidity values over the month, reaching the maximum and error value of 3000#, indicative of sensor blockage. When the sonde was removed, heavy growth of a brown fur-like slime substance again coated the sonde casing and the sensors, as in the previous deployment periods. Deployment and removal instrument performance rankings for Outer Cove Brook at Clovelly Golf Course for the period of May 3, 2013 through to June 4, 2013 are summarized in Table 3. Table 3: Instrument performance rankings for Outer Cove Brook at Clovelly Golf Course May 3, 2013 June 4, 2013 Station Clovelly Golf Course Date Action Comparison Ranking Temperature ph Conductivity Dissolved Oxygen Turbidity May Deployment Good Excellent Good Excellent Good June Removal Excellent Excellent Good Good Poor During the Outer Cove Brook Clovelly Golf Course station deployment, all sensors ranked excellent or good when compared to the freshly calibrated QA/QC sonde. At removal, temperature and ph ranked excellent, while conductivity and dissolved oxygen ranked good. The turbidity sensor ranked as poor, as was expected after the values jumped around constantly during the deployment. Analysis of the turbidity data at this site shows that biofouling is an issue. The presence of grass wrapped around the turbidity sensor indicates the tall grasses growing in this area are an issue, and may be what caused the turbidity wiper to stop working, as was noticed during the calibration attempt after removal. This sonde will now undergo performance testing. Outer Cove Brook has a large amount of algae growing and it was very hard to select a location for the sonde where the probes wouldn t be influenced by the long hair-like algae. The algae may cause issues periodically if it becomes tangled around the turbidity sensor or block the sensors on the conductivity probe. 5
6 Deployment Notes There were no transmission errors during this deployment period at either the below airport station or the Clovelly Golf Course station. At the end of this deployment period, the prolific slime substance first noted on April 9 th was still present in the river, and thus would have affected the sensors during deployment, in particular DO and turbidity. Data Interpretation The following graphs and discussion illustrate water quality-related events from May 3 to June 4, 2013 at the Outer Cove Brook Stations. With the exception of water quantity data (stage), all data used in the preparation of the graphs and subsequent discussion below adhere to this stringent QA/QC protocol. Water Survey of Canada is responsible for QA/QC of water quantity data. Corrected data can be obtained upon request from Water Survey of Canada. Precipitation data from the deployment period was retrieved from Environment Canada s weather station at St. John s Airport and supplemented with information from The Weather Network when EC data was not available. 6
7 Outer Cove Brook below Airport Water Temperature Water temperature ranged from 4.5 o C to 16.4 o C during this deployment period (Figure 2). Water temperatures rise when air temperatures are warm, and fall again when ambient air temperatures decrease. A notable decrease in water and air temperature occurred May th (Figure 2) due to a cold snap. Water temperatures display diurnal variations, typical of shallow streams and ponds which are highly influenced by natural diurnal variations in ambient air temperatures. Water temperature is a very important parameter and it has the ability to influence other parameters that are measured by the water quality instrument. Figure 2: Quarter-hourly water temperature ( C) and stage level (m) values at Outer Cove Brook below Airport for the deployment period May 3, 2013 to June 4,
8 ph Throughout this deployment period ph values ranged between 6.22 ph units and 6.82 ph units (Figure 3). The maximum value is lower than the maximum values from previous months (7.02; 7.29; 7.34) During the deployment, the ph values decreased constantly over time, dropping below the minimum CCME Guideline for the Protection of Aquatic Life during the last two weeks of deployment. There is a notable drop in ph on May 19, related to a precipitation event (Figure 3). This is a natural occurrence between rainfall and ph levels. The ph stays low after this precipitation event, compared to the beginning of the deployment period. The CCME guideline provides a basis by which to judge the overall health of the brook. Naturally, all streams and brooks are different. In the case of Outer Cove Brook below Airport, ph is within the normal range for stream water in St. John s. Figure 3: Quarter-hourly ph (ph units) and stage level (m) values at Outer Cove Brook below Airport for the deployment period May 3, 2013 to June 4,
9 Specific Conductivity & TDS The conductivity levels were within 305 µs/cm and 492 µs/cm during this deployment period. TDS ranged from g/l to g/l. Generally, rainfall events, such as that which occurred on May 26 (see Figure 4), can have the effect of diluting and lowering conductance levels. When stage levels rise, the specific conductance levels drop in correlation as the increased amount of water in the river system dilutes the solids present there, thus generally decreasing the specific conductivity readings. Total Dissolved Solids (TDS), is a parameter that the instrument calculates by an algothrim that utilizes the data from specific conductivity and water temperature to produce a TDS value and generally always mirrors specific conductivity. Figure 4: Quarter-hourly specific conductivity (μs/cm), TDS (g/l) and stage (m) values at Outer Cove Brook below Airport for the deployment period May 3, 2013 to June 4,
10 Dissolved Oxygen The instrument measures dissolved oxygen (mg/l) then calculates percent saturation. During this deployment, DO values were inaccurate due to the presence of a large amount of brown slime thickly coating the instrument (Figure 5), which led to DO values which did not reflect the actual oxygen content of the water. This caused the poor sensor performance ranking upon removal, as only the QA/QC reading was an accurate reflection of the DO in the water. As this field data was inaccurate, it will be removed from the dataset for the duration of the deployment. Figure 5: Thick brown slime growth covering river bottom at deployment location. Turbidity Outer Cove Brook below Airport contains a significant amount of algae. High algal growth, biofouling, or leaf and grass debris can interfere with turbidity measurements as they block the sensor. Turbidity readings during this deployment period were inaccurate due to the large amount of brown slime which quickly attached to the sonde casing after deployment, blocking the turbidity sensor and giving inaccurate water quality values. This biofouling is what caused the poor performance ranking at removal. Methods to combat this biofouling will be investigated. 10
11 Stage Stage values are based on a vertical reference that is unique to each station. As a result, absolute values of stage are not comparable between stations, but relative changes in stage are. Stage provides an estimation of water level at the station and can explain some of the changes that are occurring with other parameters (i.e. Specific Conductivity, DO, turbidity). Stage increases during precipitation events (Figure 6) due to increased runoff from the surrounding area. Precipitation data was obtained from Environment Canada s St. John s Airport weather station and supplemented with data from The Weather Network when EC data was unavailable. During the deployment period, the stage ranged from 0.83m to 0.92m. There was very low flow during sonde removal. Figure 6: Daily average stage values (m) at Outer Cove Brook below Airport and daily total precipitation values (mm) from Environment Canada s St. John s Airport Station for the deployment period May 3, 2013 to June 4,
12 Conclusions Generally in natural environments, climate and weather conditions contribute in large part to the variation in water quality parameters. During this deployment it was evident that many of the changes in the parameter data displayed on the graphs, was related to the intermittent precipitation events and small climatic changes of the seasons (i.e. temperature increases). Precipitation events during the deployment period led to related fluctuations in stage, which thus influenced the values of ph, specific conductance, and TDS. Due to the presence of a thick coating of slime covering the sonde, the turbidity and DO sensors yielded inaccurate data, which was consequently removed from the dataset. The presence of this thick biofouling growth may impact other water quality parameters, but to a lesser extent. 12
13 Outer Cove Brook at Clovelly Golf Course Water Temperature Water temperature ranged from 4.79 o C to o C during this deployment period (Figure 7). Water temperatures rise when air temperatures are warm, and fall again when ambient air temperatures decrease. A notable decrease in water and air temperature occurred May th (Figure 7) due to a cold snap. Water temperatures display diurnal variations, typical of shallow streams and ponds which are highly influenced by natural diurnal variations in ambient air temperatures. Water temperature is a very important parameter and it has the ability to influence other parameters that are measured by the water quality instrument. Figure 7: Quarter-hourly water temperature ( C) and stage level (m) values at Outer Cove Brook at Clovelly Golf Course for the deployment period May 3, 2013 to June 4,
14 ph Throughout this deployment period ph values ranged between 6.40 ph units and 6.80 ph units (Figure 8). During the deployment, the ph values at this station hover around the minimum CCME Guideline for the Protection of Aquatic Life (between 6.5 and 9 ph units) dipping below occasionally after precipitation events. There are notable drops in ph on May 21 and May 31, related to precipitation events. This is a natural occurrence between rainfall and ph levels. The CCME guideline provides a basis by which to judge the overall health of the brook. Naturally, all streams and brooks are different. In the case of Outer Cove Brook at Clovelly Golf Course, ph is within the normal range for stream water in St. John s. Figure 8: Quarter-hourly ph (ph units) and stage level (m) values at Outer Cove Brook at Clovelly Golf Course for the deployment period May 3, 2013 to June 4,
15 Specific Conductivity & TDS The conductivity levels were within 305 µs/cm and 522 µs/cm during this deployment period. TDS ranged from g/l to g/l. Generally, rainfall events, such as that which occurred on May 18th (see Figure 9), can have the effect of diluting and lowering conductance levels. When stage levels rise, the specific conductance levels drop in correlation as the increased amount of water in the river system dilutes the solids present there, thus generally decreasing the specific conductivity readings. There is a significant spike in conductivity and TDS on May 11 th, accompanied by a small increase in stage. This increase was not evident at the below airport station, indicating some possible input or disturbance in the river at this time between the two stations which may have led to resuspension of solids and salts. This river has been under investigation by Environment Canada, and this spike may result from disturbance due to sampling upstream or near the station. Other possible causes of the river disturbance include construction occurring upstream and ATV usage cutting through the river. Total Dissolved Solids (TDS), is a parameter that the instrument calculates by an algothrim that utilizes the data from specific conductivity and water temperature to produce a TDS value and generally always mirrors specific conductivity. Figure 9: Quarter-hourly specific conductivity (us/cm), TDS (g/l) and stage (m) values at Outer Cove Brook at Clovelly Golf Course for the deployment period May 3, 2013 to June 4,
16 Dissolved Oxygen The instrument measures dissolved oxygen (mg/l) then calculates percent saturation. The Dissolved Oxygen % Sat levels within this deployment period were within 57.4% Sat 99.0% Sat. Dissolved Oxygen (mg/l) measured 6.07 mg/l to mg/l. The DO mg/l values hover around the minimum DO CCME guideline for early life stages, varying in relation to water temperature. Notably, the water temperature decrease May resulted in an increase in DO mg/l during this period (Figure 10). Large fluctuations in DO values between day and night are due to the presence of vast amounts of algae and grass at the deployment site, which can only produce oxygen during daylight hours. Dissolved Oxygen percent saturation remains relatively constant throughout the deployment period, with diurnal fluctuations. Dissolved oxygen mg/l content fluctuates with the water temperature changes. Decreases in dissolved oxygen values are inversely related to increases in water temperature as warmer water can hold less oxygen. Figure 10: Quarter-hourly dissolved oxygen (mg/l & % sat) and water temperature ( C) values at Outer Cove Brook at Clovelly Golf Course for the deployment period May 3, 2013 to June 4,
17 Turbidity Outer Cove Brook contains a significant amount of algae. High algal growth in the summer or leaf debris during all seasons can interfere with turbidity measurements as they block the sensor. The turbidity sensor can read turbidity values between 0 NTU and 3000 NTU. If a turbidity reading hits 3000NTU it is always identified as an error reading, this is not a valid turbidity reading. During this deployment, the turbidity sensor did not function properly, likely due to long grass wrapping around the turbidity wiper, which then could not remove any biofouling or debris from the sensor, thus providing erroneous data, which has been removed from the dataset. As this instrument was not functioning properly during removal, the sonde will undergo repairs during June, and will be replaced by another fully functional sonde for the next deployment period. 17
18 Stage Stage values are based on a vertical reference that is unique to each station. As a result, absolute values of stage are not comparable between stations, but relative changes in stage are. Stage provides an estimation of water level at the station and can explain some of the events that are occurring with other parameters (i.e. Specific Conductivity, DO, turbidity). Stage increases during precipitation events due to increased runoff from the surrounding area (see Figure 11). Precipitation data was obtained from Environment Canada s St. John s Airport weather station and supplemented with data from The Weather Network when EC data was unavailable. During the deployment period, the stage values ranged from 0.54m to 0.69m. Figure 11: Daily average stage values (m) at Outer Cove Brook below Airport and daily total precipitation values (mm) from Environment Canada s St. John s Airport Station for the deployment period May 3 to June 4,
19 Conclusions Outer Cove Brook at Clovelly Golf Course Precipitation events during the deployment period led to related fluctuations in stage, which thus influenced the values of ph, specific conductance, and TDS. As ambient air temperatures warm up, in turn the amount of dissolved oxygen in the water decreases. High turbidity values at removal and a poor sensor ranking along with erratic values during deployment are explained by the presence of a layer of brownish slime coating the sensors and the presence of long strands of aquatic grass around the sonde which likely interfered with the readings. Dissolved oxygen levels at this station fluctuate greatly between day and night, with lowest values occurring consistently at night, indicating a diurnal pattern. It is likely that the large amount of aquatic grass and brown algae at this station is unable to produce oxygen without sunlight through the process of photosynthesis, and thus oxygen is replenished only during daylight hours. Conclusions Outer Cove Brook Network During this deployment period, the median water temperature at the upstream station (below Airport) of 9.80 C was very similar to that of the downstream station (at Clovelly Golf Course) of C. The median ph values for both were also comparable with below Airport s median at 6.53 and Clovelly Golf Course reading 6.60, and thus no significant change in ph from the upstream to the downstream station. The specific conductivity medians were similar at both stations with 442 us/cm reported below the airport and 449 us/cm reported at the golf course. These values are approximately 100 us/cm higher than during the previous deployment period. The highest value of 522 us/cm occurred at Clovelly Golf Course. Comparisons of dissolved oxygen (% Sat and mg/l) could not be made as the data associated with these parameters at the below airport station were erroneous. The median dissolved oxygen values at Clovelly Golf Course were 76.9 % Sat and 8.79 mg/l. Issues with turbidity sensors at both stations (biofouling and sensor failure) prevent comparisons of this data between stations. The appendix provides further information as well as a visual comparison of all raw data collected at both stations. 19

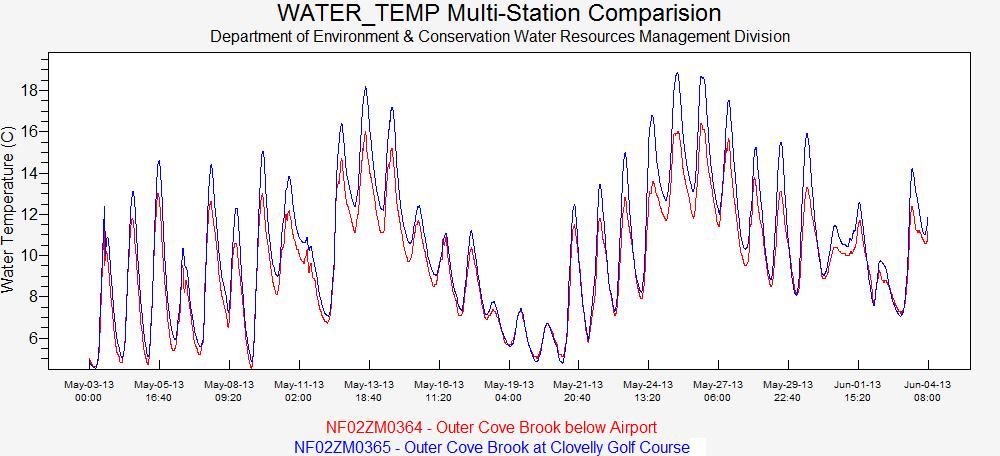
20 Appendix Parameter Station Comparison Graphs *Note: These graphs include erroneous data which will be removed from the dataset. 20
21 21
22 22
23 23
Outer Cove Brook Network
 Real Time Water Quality Report Outer Cove Brook Network Deployment Period August 6 to September 4, 2013 Government of Newfoundland & Labrador Department of Environment and Conservation Water Resources
Leary s Brook at Prince Philip Drive
 Real-Time Water Quality Report Leary s Brook at Prince Philip Drive Deployment Period January 18, 216 to February 22, 216 Government of Newfoundland & Labrador Department of Environment and Conservation
Waterford River at Kilbride
 Real Time Water Quality Report Waterford River at Kilbride Deployment Period June 2, 2015 to August 20, 2015 Government of Newfoundland & Labrador Department of Environment and Conservation Water Resources
Real-Time Water Quality Deployment Report
 Real-Time Water Quality Deployment Report Iron Ore Company of Canada Lab West Network July to August 31, 1 Government of Newfoundland & Labrador Department of Environment and Climate Change Water Resources
Waterford River Kilbride NF02ZM0009 December 2013 to January 2014
 Waterford River @ Kilbride NF02ZM0009 December 2013 to January 2014 Government of Newfoundland & Labrador Department of Environment and Conservation Real Time Water Quality Monthly Report Waterford River
Real-Time Water Quality Deployment Report
 Real-Time Water Quality Deployment Report Rattling Brook Network February 19, 2016 to March 23, 206 Government of Newfoundland & Labrador Department of Environment and Conservation Water Resources Management
Table 1: QA/QC Data Comparison Rankings for deployment between June 24 and July 21, 2009.
 General The Water Resources Management Division staff monitors the real-time web page on a daily basis. This monthly deployment report interprets the data from a water quality monitoring station on Minipi
Real-Time Water Quality Deployment Report
 Real-Time Water Quality Deployment Report Duck Pond Network July 6, 2016 to August 30, 2016 Government of Newfoundland & Labrador Department of Environment and Climate Change Water Resources Management
Long Harbour Real-Time Water Quality Monitoring Network. Annual Report
 Long Harbour Real-Time Water Quality Monitoring Network Annual Report 2008 Prepared by: Date: Ryan Pugh Ph: 709.729.16.81 Fx: 709.729.0320 ryanpugh@gov.nl.ca March 2, 2009 Table of Contents Table of Contents...
Labrador Iron Mines Schefferville Network
 Real Time Water Quality Report Labrador Iron Mines Schefferville Network 2015 06 02 to 2015 10 05 Government of Newfoundland & Labrador Department of Environment and Conservation Water Resources Management
Labrador Iron Mines Schefferville Network
 Real Time Water Quality Report Labrador Iron Mines Schefferville Network 2011 06 04 to 2011 10 16 Government of Newfoundland & Labrador Department of Environment and Conservation Water Resources Management
Newfoundland and Labrador Hydro Churchill River Real Time Water Monitoring Network Annual Report 2008
 Newfoundland and Labrador Hydro Churchill River Real Time Water Monitoring Network Annual Report 2008 Prepared by: Grace Gillis Environmental Scientist PH: (709) 896-5473 FX: (709) 896-4043 Email: gracegillis@govnlca
Real-Time Water Quality Monitoring Network in Newfoundland and Labrador
 Real-Time Water Quality Monitoring Network in Newfoundland and Labrador Overview Objectives of Real-Time Water Quality Monitoring Program in NL Real-Time Water Quality Monitoring Network in NL - - - Provincial
Morro Bay Watershed Creek Health For Water Year 2017
 Morro Bay Watershed Creek Health For Water Year 201 Date Range: October 1, 201 to September 30, 201 Analytes: Dissolved oxygen, water temperature, nitrates as N, orthophosphates as P Background The Morro
Reporting Period: 01/01/2010 to 12/31/2010. Understanding the Level 2 Stream Monitoring Data Report
 Squaw Creek, 10030147 Squaw Creek Latitude: 45.32639, Longitude: -88.945564 Jim Waters, Wolf River Trout Unlimited Andy Killoren, Wolf River Trout Unlimited Reporting Period: 01/01/2010 to 12/31/2010 Understanding
Reporting Period: 01/01/2008 to 12/31/2008. Understanding the Level 2 Stream Monitoring Data Report
 Panther Creek, 10010222 Panther Creek Latitude: 44.6216, Longitude: -90.568054 Carol Vedra, Beaver Creek Science Center Steven Hemersbach, Beaver Creek Citizen Science Center Reporting Period: 01/01/2008
Reporting Period: 01/01/2010 to 12/31/2010. Understanding the Level 2 Stream Monitoring Data Report
 Eau Claire River at Outlet Bay Rd, 10029003 Upper Eau Claire Lake Latitude: 46.302803, Longitude: -91.50336 Susan Peterson, Friends of the Saint Croix Headwaters John Kudlas, Friends of the St.Croix Headwaters
Results from the 2017 Water Quality Monitoring Program
 Results from the 217 Water Quality Monitoring Program As part of a larger project, this summer the BWC conducted water sampling throughout the Belleisle Bay to get a baseline of data and determine the
Reporting Period: 01/01/2008 to 12/31/2008. Understanding the Level 2 Stream Monitoring Data Report
 St Croix River at Old HWY 53 At Gordon, 163118 Saint Croix River Latitude: 46.252617, Longitude: -91.79963 Susan Peterson, Friends of the Saint Croix Headwaters James Heim, Friends of the Saint Croix Headwaters
Module 2, Add on Lesson Turbidity Sensor. Student. 90 minutes
 Module 2, Add on Lesson Turbidity Sensor Student 90 minutes Purpose Construct a sensor to measure the turbidity of water Graph data and reason about curves and linear relationships Calibrate the turbidity
Module 2, Add on Lesson Turbidity Sensor. Teacher. 90 minutes
 Module 2, Add on Lesson Turbidity Sensor Teacher 90 minutes Purpose Construct a sensor to measure the turbidity of water Graph data and reason about curves and linear relationships Calibrate the turbidity
Blue Green Algae Monitoring Summary Report
 Blue Green Algae Monitoring Summary Report 2007 2015 March 2016 Government of Newfoundland & Labrador Department of Environment and Conservation Water Resources Management Division Prepared by: Paul Rideout
Evaluation of Water Quality Effects of Stormwater Pond Construction in Horry County, South Carolina
 Evaluation of Quality Effects of Stormwater Construction in Horry County, South Carolina Environmental Quality Lab Burroughs & Chapin Center for Marine and Wetland Studies Coastal Carolina University February
Transparency A Water Clarity Measure
 Volunteer Monitoring Factsheet Series 2010 Transparency A Water Clarity Measure Why are we concerned? Water clarity is one of the most obvious measures of water quality. Water clarity can be a useful indicator
Antifouling System Reduces Algal and Biological Growth on TROLL 9500 Instrument Page 2
 Innovations in Water Monitoring White Paper Antifouling System Reduces Algal and Biological Growth on the In-Situ TROLL 9500 Water Quality Instrument by Ashley Steinbach, Chemist, In-Situ Inc. April 2011
Comparison of Three Turbidity Instruments DTS-12, YSI, and Hydrolab
 Comparison of Three Turbidity Instruments DTS-12, YSI, and Hydrolab Prepared: 211-12-21 Government of Newfoundland & Labrador Department of Environment and Conservation Water Resources Management Division
STREAM DISSOLVED OXYGEN IMPROVEMENT FEASIBILITY STUDY
 SALT CREEK / DUPAGE RIVER WORK GROUP STREAM DISSOLVED OXYGEN IMPROVEMENT FEASIBILITY STUDY FOR SALT CREEK AND EAST BRANCH OF THE DUPAGE RIVER DATA REPORT 2007 SOD MEASUREMENT SURVEY SALT CREEK OCTOBER
Applicable TEKS. Procedure. Duration. Objectives. Prerequisites. Materials. Temperature Station. ph Station
 L E S S O N LESSON 7 Survey: Physical Properties Applicable TEKS Grade 4 4.1 A 4.2 A, B, D, E, F 4.3 A 4.4 A, B Grade 4 4.1 A, C 4.8 C Duration Two 40-minute lessons Grade 5 5.1 A 5.2 A, C, D, E, F 5.3
October 29, Monitoring Data Analysis for September 20 October 21, Gills Creek Monitoring Sites
 October 9, Monitoring Data Analysis for September October, Gills Creek Monitoring Sites Over the course of the monitoring period (September through October, ), an overall decrease in water temperature
Real-time Water Quality Monitoring
 Real-time Water Quality Monitoring Amanjot Singh, Ph.D., P. Eng. Water Quality Engineer Credit Valley Conservation Authority November 14, 212 Focus Current sampling methods their objectives and limitations
WATER TEMPERATURE AND WATER QUALITY MONITORING. Pit 3, 4, and 5 Hydroelectric Project FERC Project No. 233
 WATER TEMPERATURE AND WATER QUALITY MONITORING 2012 Pit 3, 4, and 5 Hydroelectric Project FERC Project No. 233 Draft Prepared By: January 2013 TABLE OF CONTENTS Page Executive Summary...iii 1.0 Introduction...1
Kinley Creek Monitoring Sites Monitoring Data Summary for August 19 th, 2017 September 18 th, 2017
 Kinley Creek Monitoring Sites Monitoring Data Summary for August 19 th, 217 September 18 th, 217 Data Gaps The KINA station experienced submergence issues that affected specific conductivity from the date
When Things Heat Up. To relate the physical and chemical properties of water to a water pollution issue.
 Purpose: Summary: To relate the physical and chemical properties of water to a water pollution issue. In this exercise, students will measure the temperature and dissolved oxygen of a stream (or use their
BC Approved Water Quality Guidelines (updated to 2014) Compendium of Working Water Quality Guidelines (updated to 2006)
 Compendium of Working Water Quality Guidelines (updated to 2006)") 13477-116 Ave Surrey, BC Canada V3R 6W4 April 15, 2014 Web Kassa Environment Canada 401 Burrard Street Vancouver, British Columbia V6C 3S5 Re: Addendum to April 9, 2014 submission: Summary of in situ and
13477-116 Ave Surrey, BC Canada V3R 6W4 April 15, 2014 Web Kassa Environment Canada 401 Burrard Street Vancouver, British Columbia V6C 3S5 Re: Addendum to April 9, 2014 submission: Summary of in situ and
YIR01WQ2 Total oxygen in river stations by river size
 YIR01WQ2 Total oxygen in river stations by river size Figure 1 Annual average dissolved oxygen concentrations (mg O 2 /l) at stations in different sized rivers between 1993 and 1998 11.0 mg O2/l 10.5 10.0
HARPETH RIVER MAIN STEM DISSOLVED OXYGEN STUDY
 HARPETH RIVER MAIN STEM DISSOLVED OXYGEN STUDY September 18, 2002 Report prepared by David J. Wilson Introduction Dissolved oxygen (dissolved O 2, a.k.a. DO) is essential for fish and benthic macroinvertebrates.
Reporting Period: 01/01/2008 to 12/31/2008. Understanding the Level 2 Stream Monitoring Data Report
 Beaver Creek at HWY 53, 10020895 Unnamed Latitude: 44.10027, Longitude: -91.34095 Jon Johnson, GET High School Andrew Byom, GET High School Michelle Eddy, GET High School Alex Wegner, GET High School Sarah
Water Chemistry. Water 101
 Water Chemistry Water 101 I. Introduction A. Water is not pure Many different kinds of chemicals dissolved in it Ions, organic chemicals, organic matter, particulate matter, and gases can all be in water
Owasco Lake Day
 Introductions Halfman apologizes for not presenting this talk himself. A family reunion took precedent. Owasco Lake Day 6-25--14 1 The beginnings Preliminary water quality comparison of the Finger Lakes
Results of Water Quality Measurements in Messer Pond Bob Crane, Messer Pond Protective Association (MPPA) Board
 Board") Results of Water Quality Measurements in Messer Pond Bob Crane, Messer Pond Protective Association (MPPA) Board The collection of water samples for the assessment of water quality in Messer Pond, New London,
Results of Water Quality Measurements in Messer Pond Bob Crane, Messer Pond Protective Association (MPPA) Board The collection of water samples for the assessment of water quality in Messer Pond, New London,
Methylmercury Monitoring Plan. For Surface Water Quality. Muskrat Falls Reservoir, Churchill River and Lake Melville
 DOC-2016-298 Methylmercury Monitoring Plan For Surface Water Quality Muskrat Falls Reservoir, Churchill River and Lake Melville Initial Plan Prepared: October 17, 2016 Revised: December 19, 2016 Introduction:
Ionic Concentration Estimation of Urban and Non Urban Water Bodies of Newfoundland and Labrador using Real Time Water Quality Data
 Ionic Concentration Estimation of Urban and Non Urban Water Bodies of Newfoundland and Labrador using Real Time Water Quality Data Date: July 8 th, 2013 Government of Newfoundland and Labrador Department
TSS The TSS analyser was operational during the reporting period. The composite sampler is in place to cover any shortfalls in the TSS analyser.
 Interim Environmental Report Period Ending: 3 th April 28 Compiled By: Siobhan Quinn, Aoife Reynolds & Thomas McGlynn Approved By: Tony Doyle 1 Monitoring Data 1.1 Monitoring Equipment Axonics Axonics
Jackson Lake Analysis
 Jackson Lake Analysis Lake Zones Lake Zones Limnetic Zone- open water far from shore Light penetrates shallow, allowing photosynthesis Supports phytoplankton (algae, protists, cyanobacteria) which then
Grants Pass Water Quality Monitoring
 Grants Pass Water Quality Monitoring 2003-2005 Rogue Valley Council of Governments April 2005 Rogue Valley Council of Governments Natural Resources Department 155 North First Street Central Point, Oregon
SECTION 2 WATER 2.1 ROUTINE WATER COLUMN MONITORING Collection Summary
 SECTION 2 WATER 2.1 ROUTINE WATER COLUMN MONITORING 2.1.1 Collection Summary Routine water column sampling was performed biweekly between May and October for a total of 13 sampling rounds. Water column
Comparison of Multi- Parameter Instruments:
 Comparison of Multi- Parameter Instruments: YSI 6600, YSI Exo2, and Hydrolab HL4 2016-07-29 Government of Newfoundland and Labrador Department of Environment and Climate Change Water Resources Management
dissolved oxygen Case Studies & Solutions for long-term water quality monitoring with ROX optical DO sensor
 dissolved oxygen Case Studies & Solutions for long-term water quality monitoring with ROX optical DO sensor ROX Luminescent Dissolved Oxygen Sensor Optical sensing technology has replaced the stretched
Environmental Report - Status Week Ending: Thur 12 h May2006 Generated By: Siobhan Quinn/Mairtin Naughton/Sandra Barber Checked By: Leslie Finnegan
 Environmental Report - Status Week Ending: Thur 12 h May2006 Generated By: Siobhan Quinn/Mairtin Naughton/Sandra Barber Checked By: Leslie Finnegan 1 Monitoring Data 1.1 Monitoring Equipment Axonics System
SERIES 5. Water Quality Instruments
 SERIES 5 Water Quality Instruments SUPERIOR SENSOR TECHNOLOGY Hydrolab sondes are built with the industry s best sensor technology, to provide high quality data that you can trust. UNSURPASSED RELIABILITY
Lake Washington. Water Quality Assessment Report. Copyright 2012 PLM Lake & Land Management Corp.
 Lake Washington 2012 Water Quality Assessment Report Copyright 2012 PLM Lake & Land Management Corp. Water Quality Report On May 22nd, June 18th, July 30th, August 29th, and September 27 th, 2012, PLM
Effect of Turbidity on Dissolved Oxygen in the Lake Macatawa. Watershed
 Effect of Turbidity on Dissolved Oxygen in the Lake Macatawa Watershed Hope College GES 401 Research Project Group Members: Peter Van Heest, Rachel Burkhart, Wyatt Curry Advisor: Dr. G. Peaslee Introduction
TSS The TSS analyser was operational during the reporting period. The composite sampler is in place to cover any shortfalls in the TSS analyser.
 Interim Environmental Report Period Ending: 28th May 28 Compiled By: Siobhan Quinn & Thomas McGlynn Approved By: Tony Doyle 1 Monitoring Data 1.1 Monitoring Equipment Axonics Axonics plant operated as
Kinley Creek Monitoring Sites Monitoring Data Summary for March 30 th, 2017 May 3 rd, 2017
 Kinley Creek Monitoring Sites Monitoring Data Summary for March 3 th, 17 May 3 rd, 17 Data Gaps The KINA and KINB stations did not experience any gaps in the data record during this monitoring period.
Keeyask Infrastructure Project
 Keeyask Infrastructure Project Terrestrial and Aquatic Monitoring Plan Annual Report 2014-2015 December 2015 KEEYASK INFRASTRUCTURE PROJECT TERRESTRIAL AND AQUATIC MONITORING PLAN Water Quality: Annual
Estero Americano Watershed Sediment Reduction Project, Phase II, Sonoma and Marin Counties, CA. Draft Quarterly Monitoring Report Item B.4.
 Estero Americano Watershed Sediment Reduction Project, Phase II, Sonoma and Marin Counties, CA Draft Quarterly Monitoring Report Item B.4.2 This quarterly report summarizes data collected from December
Water Temperature Protocol
 Water Temperature Protocol Purpose To measure the temperature of a water sample Overview Students use an alcohol-filled thermometer to measure the temperature of water. Student Outcomes Students will learn,
APPENDIX F ONONDAGA LAKE WASTEBEDS 1-8 SHORELINE STABILIZATION MONITORING WORK PLAN
 APPENDIX F Prepared for: 301 Plainfield Road, Suite 330 Syracuse, NY 13212 Prepared by: 301 Plainfield Road, Suite 350 Syracuse, New York 13212 OCTOBER 2017 PARSONS TABLE OF CONTENTS Page LIST OF ACRONYMS...
Advancing catchment science through high-frequency monitoring of water quality
 Advancing catchment science through high-frequency monitoring of water quality Professor Kevin Hiscock School of Environmental Sciences University of East Anglia, Norwich Research Park, Norwich, NR4 7TJ
Acidity and Alkalinity:
 Evaluation of Pollution Sources to Lake Glenville Quarterly Report December 2018 Kimberlee K Hall, PhD Environmental Health Program, Western Carolina University Summary Chemical and microbial analysis
Ecology Unit 1 Practice Test
 Ecology Unit 1 Practice Test Grade:«8» Subject:Science ate:«10/2012 1 n ecologist would refer to all of the tropical rainforests worldwide as a biosphere a biome a community a population LT 1 I can define
Little Bay Water Quality Report Card Spring 2014
 Little Bay Water Quality Report Card Spring 2014 Little Bay is a small, semi-enclosed estuary located in the heart of Rockport, Texas. Estuaries, where freshwater from rivers and streams mixes with salt
Regional District of Nanaimo Community Watershed Monitoring Network 2011 Data Summary
 With participation from: Mid Vancouver Island Habitat Enhancement Society, Qualicum Beach Streamkeepers, Parksville Fish & Game, Nile Creek Enhancement Society, Friends of French Creek and Nanaimo Area
Dissolved Oxygen. LabQuest INTRODUCTION
 Dissolved Oxygen LabQuest 5 INTRODUCTION Oxygen gas dissolved in water is vital to the existence of most aquatic organisms. Oxygen is a key component in cellular respiration for both aquatic and terrestrial
Continuous Diurnal D. O. Water Monitoring. Water Monitoring and Standards Bureau of Freshwater and Biological Monitoring
 Continuous Diurnal D. O. Water Monitoring Water Monitoring and Standards Bureau of Freshwater and Biological Monitoring Objective: Develop an ambient surface water dissolved oxygen concentration database
What s in the Water?
 Purpose: Summary: Background: To observe and list abiotic factors in specific ecosystems. In this exercise, students will observe and list abiotic factors in an aquatic system and measure four of them
WATER QUALITY ENGINEERING
 WATER QUALITY ENGINEERING Zerihun Alemayehu (AAiT-CED) Water Quality Management The control of pollution from human activities so that the water is not degraded to the point that it is no longer suitable
Upper Sugar River Upstream Of Valley Spring Rd, Sugar River
 Upper Sugar River Upstream Of Valley Spring Rd, 10009472 Sugar River WBIC: 875300 Latitude: 43.03571, Longitude: -89.645996 Wade Moder, Upper Sugar River Watershed Association Wade Moder, Upper Sugar River
Resource. ph must be measured in the field. The ph will change if the water is collected and stored, and will not reflect the true value at the site.
 Resource ph What is ph? ph is a measurement of how acidic or alkaline (basic) the water is. ph is measured on a scale of 0 to 14, with 0 being the most acidic, and 14 being the most basic. Distilled water,
Freshwater Pollution Response Implementation Plan
 LOUGHS AGENCY OF THE FOYLE CARLINGFORD AND IRISH LIGHTS COMMISSION Freshwater Pollution Response Implementation Plan 2016-2017 COPYRIGHT 2015 LOUGHS AGENCY OF THE FOYLE CARLINGFORD AND IRISH LIGHTS COMMISSION
Lake Washington Ship Canal Water Quality Monitoring and Analysis Plan
 U.S. Army Corps of Engineers Seattle District Lake Washington Ship Canal Water Quality Monitoring and Analysis Plan Prepared by U.S. Army Corps of Engineers, Seattle District Hydrology and Hydraulics Section
MEMORANDUM Project Specific:
 Information Only MEMORANDUM Project Specific: 5-829-007 Policy Memo - File With TO: Robert Flaherty, Bullitt County Deputy Judge Executive FROM: Adam Connelly DATE: RE: 2006 Wet Weather Water Quality Monitoring
Bears Grass Creek Feet Upstream Of Sth 12 Bridge(#Bg 2a), Bears Grass Creek
, Bears Grass Creek") Bears Grass Creek - 100 Feet Upstream Of Sth 12 Bridge(#Bg 2a), 10016662 Bears Grass Creek WBIC: 2130300 Latitude: 44.7306508, Longitude: -91.199377 Anna Mares, Beaver Creek Citizen Science Center Reporting
Bears Grass Creek - 100 Feet Upstream Of Sth 12 Bridge(#Bg 2a), 10016662 Bears Grass Creek WBIC: 2130300 Latitude: 44.7306508, Longitude: -91.199377 Anna Mares, Beaver Creek Citizen Science Center Reporting
Special Provision - Turbidity
 1. DEFINITIONS Special Provision - Turbidity Instream Construction Activity Isolated Construction Activity Site Isolation Visually Conspicuous Plume Accidental Occurrence Any planned instream construction
Keeyask Infrastructure Project
 Keeyask Infrastructure Project Terrestrial and Aquatic Monitoring Plan Annual Report 2013-2014 December 2014 KEEYASK INFRASTRUCTURE PROJECT TERRESTRIAL AND AQUATIC MONITORING PLAN Water Quality: Annual
Water Quality Temperature
 Water Quality Computer 10 The temperature of a body of water influences its overall quality. Water temperatures outside the normal range for a stream or river can cause harm to the aquatic organisms that
Burr s Pond and Runnins River: An Annual Watershed Survey, 2010
 Bridgewater State University Virtual Commons - Bridgewater State University Watershed Access Lab Projects Watershed Access Lab 2010 Burr s Pond and Runnins River: An Annual Watershed Survey, 2010 Recommended
Prepared by: PacifiCorp 825 NE Multnomah Street Portland, OR 97232
 for the Wallowa Falls Hydroelectric Project (FERC No. P-308) Grande Ronde River Basin Wallowa County, Oregon March 16, 2017 Prepared by: PacifiCorp 825 NE Multnomah Street Portland, OR 97232 March 16,
CONTINUED MONITORING OF DO, ph, AND TURBIDITY IN THE WELLS FOREBAY AND LOWER OKANOGAN RIVER (DO, ph and Turbidity Study) WELLS HYDROELECTRIC PROJECT
 WELLS HYDROELECTRIC PROJECT") CONTINUED MONITORING OF DO, ph, AND TURBIDITY IN THE WELLS FOREBAY AND LOWER OKANOGAN RIVER () WELLS HYDROELECTRIC PROJECT FERC NO. 2149 FINAL REPORT NOT REQUIRED BY FERC March 2009 Prepared by: Parametrix,
CONTINUED MONITORING OF DO, ph, AND TURBIDITY IN THE WELLS FOREBAY AND LOWER OKANOGAN RIVER () WELLS HYDROELECTRIC PROJECT FERC NO. 2149 FINAL REPORT NOT REQUIRED BY FERC March 2009 Prepared by: Parametrix,
Monitoring to Ensure Quality. Katie Kennedy-Fairfax Water
 Monitoring to Ensure Quality Katie Kennedy-Fairfax Water Virginia s Largest Water Utility (1 in 5 Virginians on Public Supply) One of 25 Largest Water Utilities in the Country Nearly 2 Million Retail
Appendix 2 Screening of Keewatinoow Construction Camp Waste Water Effluent Discharge to Creek Fourteen
 Appendix 2 Screening of Keewatinoow Construction Camp Waste Water Effluent Discharge to Creek Fourteen Prepared by: North/South Consultants Inc. July 19, 2011 Introduction The following provides a screening
Water Quality Conditions During 2007 in the Vicinity of the Klamath Hydroelectric Project
 Prepared by: Richard Raymond, Ph.D. E&S Environmental Chemistry, Inc. Corvallis, Oregon Prepared for: PacifiCorp Energy 825 N.E. Multnomah, Suite 1500 Portland, OR 97232 October 14, 2008 CONTENTS Section
WATER QUALITY MONITORING TFL 49 ECOLOGICAL STEWARDSHIP PROJECT Annual Report
 WATER QUALITY MONITORING For the TFL 49 ECOLOGICAL STEWARDSHIP PROJECT 2003 Annual Report Prepared for RIVERSIDE FOREST PRODUCTS LIMITED by DOBSON ENGINEERING LTD. #4, 1960 Springfield Road Kelowna, BC
Appendix B. Box Plots of Water Quality Data
 CMP Water Quality Report 2005-2008 June 2009 Appendix B. Box Plots of Water Quality Data Box and whisker plots are provided for all CMP water quality parameters with detected data. Box plots illustrate
Sugar River at Bobcat Lane, Sugar River
 Sugar River at Bobcat Lane, 10044597 Sugar River WBIC: 875300 Latitude: 42.9886695, Longitude: -89.5763354 Wade Moder, Upper Sugar River Watershed Association Wade Moder, Upper Sugar River Watershed Association
Unnamed Tributary (unnamed) to Wolf River, WBIC: Latitude: , Longitude: Tim Waters, Wolf River Trout Unlimited
 to Wolf River, WBIC: Latitude: , Longitude: Tim Waters, Wolf River Trout Unlimited") Unnamed Tributary (unnamed) to Wolf River, 10049250 WBIC: Latitude: 45.245396, Longitude: -88.806261 Tim Waters, Wolf River Trout Unlimited Reporting Period: 01/01/2017 to 12/31/2017 Understanding the
Unnamed Tributary (unnamed) to Wolf River, 10049250 WBIC: Latitude: 45.245396, Longitude: -88.806261 Tim Waters, Wolf River Trout Unlimited Reporting Period: 01/01/2017 to 12/31/2017 Understanding the
My Stream s Temperatures
 My Stream s Temperatures Temperature Adapted from: An original Creek Connections activity. Creek Connections, Box 10, Allegheny College, Meadville, Pennsylvania 16335. Grade Level: basic, all Duration:
INTERMEDIATE BMI ASSESSMENT TIER 2 FIELD SHEET
 INTERMEDIATE BMI ASSESSMENT TIER 2 FIELD SHEET PHYSICAL PARAMETERS ASSESSMENT FIELD SHEET ALL TIERS NAME: DATE: TIME: STREAM OR RIVER NAME: WATERSHED NAME: TOWN: WEATHER PRESENT PAST 48 HOURS SITE DESCRIPTION
The data used for this reporting period was taken from the on-site meteorological station.
 Environmental Report - Final Week Ending: Thur 15 th Mar 27 Generated By: Siobhan Quinn/Sandra Barber Checked By: Tony Doyle 1 Monitoring Data. 1.1 Monitoring Equipment Axonics Axonics plant ran for the
Measuring Dissolved Oxyg Instructions for the La Motte Field-Test Kit
 Then, immediately add 8 drops of alkaline potassium iodide azide to the water sample Recap the bottle and shake to mix. Immediately add 8 drops of manganous sulfate to the water Record the temperature
Thompson Valley Creek 12 m upstream at Barka Rd bridge, Thompson Valley Creek
 Thompson Valley Creek 12 m upstream at Barka Rd bridge, 10031841 Thompson Valley Creek WBIC: 2131100 Latitude: 44.647297, Longitude: -91.179436 Anna Mares, Beaver Creek Citizen Science Center Reporting
Stevens Creek at Footville-Hanover, Stevens Creek
 Stevens Creek at Footville-Hanover, 10010928 Stevens Creek WBIC: 796300 Latitude: 42.6578, Longitude: -89.16124 Anne Miller, Rock County Land Conservation Department Reporting Period: 01/01/1996 to 06/21/2016
Keeyask Generation Project Sediment Management Plan for In-Stream Construction. Sediment Management Report SMP
 Keeyask Generation Project Sediment Management Plan for In-Stream Construction Sediment Management Report SMP-2015-01 Manitoba Conservation and Water Stewardship Client File 5550.00 Manitoba Environment
SECTION 1 FRESHWATER SYSTEMS UNIT 4: AQUATIC ECOLOGY
 SECTION 1 FRESHWATER SYSTEMS UNIT 4: AQUATIC ECOLOGY CENTRAL CASE STUDY: STARVING THE LOUISIANA COAST OF SEDIMENT LOUISIANA IS LOSING 25MI2 OF COASTAL WETLANDS ANNUALLY WETLANDS SUPPORT A DIVERSITY OF
Pigeon River at Mill Rd, Pigeon River. Latitude: , Longitude: Tom Henning Kris Stepenuck, UWEX
 Pigeon River at Mill Rd, 603339 Pigeon River WBIC: 62300 Latitude: 43.7843264, Longitude: -87.7367284 Tom Henning Kris Stepenuck, UWEX Reporting Period: 01/01/1996 to 06/17/2016 Understanding the Level
West Fork Kickapoo River 125 yds downstream of CTH P, West Fork Kickapoo River
 West Fork Kickapoo River 125 yds downstream of CTH P, 10030275 West Fork Kickapoo River WBIC: 1187900 Latitude: 43.657238, Longitude: -90.78372 Paul Hayes, Valley Stewardship Network Vicki Ramsay, Valley
Fox (IL) River downstream of Waterford Dam to Burlingston, Fox River
 River downstream of Waterford Dam to Burlingston, Fox River") Fox (IL) River downstream of Waterford Dam to Burlingston, 10042192 Fox River WBIC: 742500 Latitude: 42.725386, Longitude: -88.229051 Jayne Jenks, Waukesha County Dean Falkner, Waukesha County Reporting
Fox (IL) River downstream of Waterford Dam to Burlingston, 10042192 Fox River WBIC: 742500 Latitude: 42.725386, Longitude: -88.229051 Jayne Jenks, Waukesha County Dean Falkner, Waukesha County Reporting
Fairchild Pond at Rod and Gun Club, Fairchild Pond, Schoolhouse Creek
 Fairchild Pond at Rod and Gun Club, 10012481 Fairchild Pond, Schoolhouse Creek WBIC: 2135900,2136200 Latitude: 44.609592, Longitude: -90.95172 Theodore Ludwig Anna Mares, Beaver Creek Citizen Science Center
2015 Range Ponds Water Quality Report
 2015 Range Ponds Water Quality Report Prepared by Scott Williams, Aquatic Biologist Lake & Watershed Resource Management Associates PO Box 65; Turner, ME 04282 207-576-7839 The Range Ponds Environmental
Name Hour AP Biology Lab: Dissolved Oxygen in Aquatic Ecosystem: The Relationship between Temperature, DO, and Respiration Rates
 Name Hour AP Biology Lab: Dissolved Oxygen in Aquatic Ecosystem: The Relationship between Temperature, DO, and Respiration Rates Although water is composed of oxygen and hydrogen atoms, biological life