Appendix D. Flood Study Report
|
|
|
- Frank Haynes
- 6 years ago
- Views:
Transcription


1 Appendix D Flood Study Report


2 New Hope Coal Horse Creek Base Case (Natural Conditions) and Diversion Flood Study for Elimatta Mine 28 March 2014
3
4 Contents Page number 1. Introduction Background Scope of study 1 2. Hydrology Catchment description Horse Creek Available data and reports Parsons Brinckerhoff flood study for West Surat Rail Link Amendments to the XP-RAFTS model PSM Horse Creek Diversion report Comparison of peak discharges Probable Maximum Precipitation Adopted design flows 8 3. Hydraulic modelling Available data and reports Parsons Brinckerhoff flood study for West Surat Rail Link PSM Horse Creek Diversion report Base Case XP-SWMM 2d model Terrain data Grid cell size Boundary conditions Structures Roughness Validation Model scenarios Results Diversion Stage Description of diversion Roughness Results Diversion Stage Description of diversion Roughness Results Diversion Stage 3 18 Parsons Brinckerhoff G-TPT-RPT-003 RevB i
5 3.5.1 Description of diversion Roughness Results Summary of results Conclusion References 23 List of tables Page number Table 2.1 Adopted initial loss and continuing loss values 5 Table 2.2 Comparison of peak design flows between Parsons Brinckerhoff XP-RAFTS model and PSM study 6 Table 2.3 Peak design flows (m 3 /s) 8 Table 3.1 Roughness values for the XP-SWMM 2D model 13 Table 3.2 Peak water level comparison across scenarios for simulated design flood events 21 List of figures Page number Figure 2-1 Relative position of Elimatta MLA (orange boundary) to the West Surat Rail Link Hydraulic Study reach (Magenta reach) 4 Figure 2-2 Parsons Brinckerhoff sub-catchments and XP-RAFTS nodes; and PSM flow locations 7 Figure 2-3 Inflow (total) hydrographs to MLA for XP-RAFTS node J06 9 Figure 2-4 Inflow (local) hydrographs to MLA for XP-RAFTS node A08A 9 Figure 2-5 Inflow (local) hydrographs to MLA for XP-RAFTS node A08 10 Figure 2-6 Inflow (local) hydrographs to MLA for XP-RAFTS node A07 10 Figure 2-7 Inflow (total) hydrographs to MLA for XP-RAFTS node J07 11 Figure 3-1 Stage 1 diversion and levee alignments 16 Figure 3-2 Stage 2 diversion and levee alignments 17 Figure 3-3 Stage 3 diversion and levee alignments 19 List of photographs Page number Photo 2.1 Typical Horse Creek main channel view 2 Photo 2.2 Scattered stagnant pools and woody debris in the main channel 3 Photo 2.3 Main channel overbanks (floodplain) 3 Parsons Brinckerhoff G-TPT-RPT-003 RevB ii
6 List of appendices Appendix A Rainfall data Appendix B Base Case maps Appendix C Diversion Stage 1 maps Appendix D Diversion Stage 2 maps Appendix E Diversion Stage 3 (Final) maps Appendix F Hydrology section from Parsons Brinckerhoff report West Surat Rail Link Hydraulic Study (September 2012) Parsons Brinckerhoff G-TPT-RPT-003 RevB iii
7 1. Introduction This report documents the base case (natural conditions) hydrological and hydraulic study of Horse Creek within the Mine Lease Area (MLA) of the proposed Elimatta Mine by New Hope Coal Ltd. Parsons Brinckerhoff was commissioned to determine the baseline hydraulic model parameters and simulate the flood conditions under natural conditions. 1.1 Background The Elimatta Mine (MLA 50254) is located in south western Queensland in the Surat Basin north west of Xstrata s proposed Wandoan Coal project. New Hope Coal is proposing to develop the thermal coal mine for export via coal export facilities at the port of Gladstone. Horse Creek passes through the centre of MLA 50254, flowing in north-easterly direction ultimately contributing to the Fitzroy River catchment. MLA is located in a dry temperate and semi-arid region resulting in ephemeral flow in Horse Creek, which takes place only during, and for a limited time after, rainfall events. In order to access coal resources and provide sufficient space for out-of-pit spoil storage, Horse Creek will have to be permanently diverted. In order to achieve regulatory approvals the diverted watercourse will have to be designed to recreate as closely as possible the geomorphologic and hydraulic characteristics of the natural watercourse. Various studies have been, and are currently being undertaken to determine the baseline characteristics of the existing watercourse to assist with this process. This study will provide baseline hydrological and hydraulic information, against which the performance of the proposed diversion will be measured. As part of a previous flood study undertaken for the West Surat Rail Link, Parsons Brinckerhoff undertook hydrological modelling of the catchment and one and two-dimensional flood modelling of Horse Creek to the north of the subject MLA. 1.2 Scope of study The scope of this flood study is to: determine the design storm event hydrographs at the upstream and downstream ends of the MLA on Horse Creek, at suitable locations in between, and at tributaries meeting Horse Creek within the MLA adopt hydrology inputs from the XP-RAFTS runoff routing model set up for a Horse Creek flood study undertaken for the West Surat Rail Link in September 2012, with relevant amendments described later in this report develop a two-dimensional (XP-SWMM) hydraulic model of natural conditions and various developed case stages of the creek diversions through the MLA run hydraulic models for the 2, 5, 10, 50, 100 and 1000 year Average Recurrence Interval (ARI) events, and the Probable Maximum Flood (PMF) event generate maps depicting the flood extents (water levels), depths, velocity, bed shear stress and stream power distribution throughout Horse Creek for the simulated floods document the methodology, inputs and results in a flood report. Parsons Brinckerhoff G-TPT-RPT-003 RevB 1


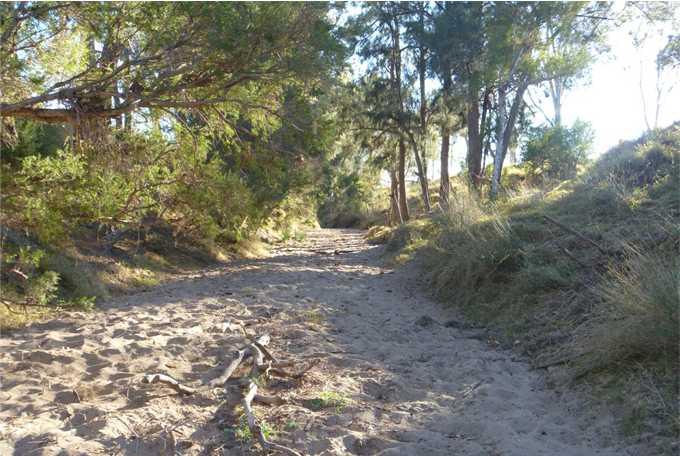
8 2. Hydrology 2.1 Catchment description Horse Creek The Horse Creek catchment extends approximately 33 km upstream and to the south of the MLA boundary, and comprises mainly rural farmland. In its lower reaches, Horse Creek is characterised by a well-defined main channel flowing through a wide floodplain with several smaller flood channels. There are no stream gauging stations on Horse Creek. Horse Creek is classified as a watercourse in terms of the Water Act and any interference with its features will require authorisation in terms of this Act. A typical photograph representing the Horse Creek main channel within the MLA is shown in Photo 2.1 below. The channel and banks have large scattered trees and grass cover, while the creek bed is sandy. A geomorphological study was undertaken by Parsons Brinckerhoff where the existing catchment and creek characteristics was inspected and investigated in detail. Photo 2.1 Typical Horse Creek main channel view Some stagnant pools and loose woody debris are visible along the channel as shown in Photo 2.2. Parsons Brinckerhoff G-TPT-RPT-003 RevB 2


 Parsons Brinckerhoff")
9 Photo 2.2 Scattered stagnant pools and woody debris in the main channel The floodplains outside the main creek channel are typically short-medium grass as shown in Photo 2.3. Photo 2.3 Main channel overbanks (floodplain) Parsons Brinckerhoff G-TPT-RPT-003 RevB 3
10 2.2 Available data and reports Parsons Brinckerhoff flood study for West Surat Rail Link The Parsons Brinckerhoff report West Surat Rail Link Hydraulic Study (September 2012) including the XP-RAFTS hydrological model and hydraulic model parameters, were referenced for the purposes of this flood study. XP-RAFTS is a robust runoff routing model that is used extensively throughout Australia and the Asia Pacific region for hydrologic and hydraulic analysis of storm water drainage and conveyance systems. Refer to the aforementioned report for descriptions of the flood frequency analysis, IFD parameters, rainfall losses, XP-RAFTS model, calibration and rural probabilistic rational method. The hydrology section of the report has been provided in Appendix F for reference. The relative position of the reach of Horse Creek for the West Surat Rail Link Hydraulic Study to the Elimatta MLA is shown below in Figure 2.1. Figure 2-1 Relative position of Elimatta MLA (orange boundary) to the West Surat Rail Link Hydraulic Study reach (Magenta reach) Parsons Brinckerhoff G-TPT-RPT-003 RevB 4
11 2.2.2 Amendments to the XP-RAFTS model An XP-RAFTS model was developed by Parsons Brinckerhoff for the West Surat Rail Link project to assess catchment flows for the 10, 100 and 1,000 year ARI design events. This study is being undertaken to establish baseline hydrological and hydraulic characteristics for Horse Creek under a range of ARI events in order to be able to compare these with the proposed creek diversion characteristics. The Department of Natural Resources and Mines (DNRM) recommends that modelling of the watercourses be undertaken to determine peak discharges for the 2, 50, 100 and 1000 year ARI design events to facilitate comparison of pre and post-developed creek characteristics such as flow velocity, stream power and shear stresses. In order to comply with these recommendations, additional storm durations were set up in the XP-RAFTS model for the 2 and 50 year ARI events according to the Bureau of Meteorology website (BoM, 2013) data. Additionally, the peak flow rates for the 5 and 10 year ARI events were determined. The 100 year ARI rainfall intensities were updated according to the Bureau of Meteorology website outputs replacing the previously CRC-Forge generated data method, as these should only be used for large to rare events (greater than the 100 year ARI event). The 1000 year ARI rainfall intensities were adopted as is. Rainfall intensities for critical duration storms for the simulated events are presented in Appendix A. The West Surat Rail Link project XP-RAFTS model used the ARBM loss model and storage coefficients. Following the Horse Creek Flood Study Peer Review (WRM, 2013), the XP-RAFTS model was revised to use the Initial Loss / Continuing Loss method and removed the storage coefficients. The flood frequency analysis (FFA) was used for the calibration of the revised XP-RAFTS model. Calibration to the FFA and not the historical events allowed improved calibration across all flood events (small to medium to large floods). The WRM Peer Review indicated that the previous model calibration was poor for the small to medium magnitude events. The FFA adopted for calibration purposes (as noted in the WRM Peer Review) gave reasonable estimates of design discharges at the Windamere gauge and is therefore suitable for calibration purposes. Various initial loss and continuing loss values were tested to calibrate the XP-RAFTS models to the flood frequency analysis results for each ARI event at the Windamere gauge. The adopted initial loss and continuing loss values for the simulated ARI events are presented in Table 2.1. Table 2.1 Adopted initial loss and continuing loss values ARI (years) Initial Loss (mm) Continuing Loss (mm/hour) PSM Horse Creek Diversion report The PSM Australia report titled Horse Creek Diversion Hydrologic, Morphologic & Hydraulic Design (March 2012) was referenced for the purposes of this flood study. The PSM report presents adopted design peak flow rates for ARI storms that were simulated in this study Comparison of peak discharges The peak discharge rates from the hydrological model and a comparison with the PSM peak discharge rates are summarised in Table 2.2. The Parsons Brinckerhoff XP-RAFTS node locations and the PSM flow Parsons Brinckerhoff G-TPT-RPT-003 RevB 5
12 locations are indicated on Figure 2.2. The PSM model schematic is not in Parsons Brinckerhoff s possession so the two PSM flow locations on Figure 2.2 are based on the location described in the PSM report. Table 2.2 Comparison of peak design flows between Parsons Brinckerhoff XP-RAFTS model and PSM study ARI (years) Parsons Brinckerhoff XP- RAFTS Upstream end of MLA (Node J06 Total flow) PSM Upstream end of MLA Peak flow rate (m 3 /s) Parsons Brinckerhoff XP- RAFTS Downstream end of MLA (Node A07 Total flow) PSM Downstream end of MLA The Parsons Brinckerhoff peak flow rates at the upstream end of the MLA are between approximately 1.5 and 3.5 times greater than those by PSM. The Parsons Brinckerhoff peak flow rates at the downstream end of the MLA are approximately 2 to 2.5 times greater than those by PSM for the 10, 50, 100 and 1000 year ARI events, 2.7 times greater for the 5 year ARI event and 4.4 times greater than the 2 year ARI event. The downstream location of the Parsons Brinckerhoff XP-RAFTS nodes covers a larger catchment area than the downstream PSM node, therefore the Parsons Brinckerhoff peak discharges are greater. It is considered prudent that the Parsons Brinckerhoff downstream node includes the additional tributaries because they add to the potential backwater influences that may affect the flow conditions at the downstream end of the MLA. The PSM node may not consider these backwater effects. Tributary sub-catchments A07, A08 and A08A are entered to XP-SWMM 2d as local hydrographs at the confluence of their stream with Horse Creek or at an appropriate location upstream of future creek diversions. The inflow location for sub-catchment A08 was added to the XP-SWMM 2d model just upstream of the Stage 1 diversion, and the inflow for sub-catchment A08A was added just upstream of the southern-most Stage 2 diversion. The catchment area that drains to Horse Creek between the upstream and downstream ends of the MLA has been added to the XP-SWMM 2d model (Section 3.2) in a distributed manner as shown by XP-RAFTS nodes in Figure 2.2. The part of sub-catchment A08A within the MLA and sub-catchment A08 both drain to the downstream end of the MLA, and have a total area greater than 50 km 2. The PSM study suggests an increase of only 1 m 3 /s and 50 m 3 /s, between the upstream and downstream end of the MLA, respectively, for the 2 year ARI and 1000 year ARI events. The Parsons Brinckerhoff results show a more reasonable increase in peak flow. Parsons Brinckerhoff G-TPT-RPT-003 RevB 6
13 Figure 2-2 Parsons Brinckerhoff sub-catchments and XP-RAFTS nodes; and PSM flow locations 2.3 Probable Maximum Precipitation The Revised Generalised Tropical Storm Method (GTSMR) for the coastal zone is applicable for the catchment contributing to the MLA. The maximum duration covered by this method is 120 hours. This method represents the best estimate of the Probable Maximum Precipitation (PMP) depth for a particular location that can currently be made using information obtained from observed large events and the generalised PMP methods (Bureau of Meteorology, 2003). The basic methodology for determining the PMP is: 1. Choosing the correct zone 2. Obtaining the raw depths 3. Applying catchment adjustment factors (moisture, decay and topographic) 4. Determine PMP depths. A PMP scenario model using the aforementioned procedure was created in XP-RAFTS to determine the Probable Maximum Flood (PMF) peak flow rate at the upstream end of the MLA and the tributary catchment contributing Horse Creek within the MLA. Parsons Brinckerhoff G-TPT-RPT-003 RevB 7
14 The development of the GTSMR is documented in the "Revision of the Generalised Tropical Storm Method of Estimating Probable Maximum Precipitation" (Bureau of Meteorology, 2003). 2.4 Adopted design flows The XP-RAFTS hydrological model for existing catchment conditions, calibrated to the Flood Frequency Analysis (FFA) for Juandah Creek stream-flow gauge located at Windamere (GS130344A) (revised for this study) was used to generate design flow hydrographs at the upstream end of the MLA, and for three subcatchments that drain to Horse Creek within or near the MLA. The peak design flows (from hydrographs) calculated in the XP-RAFTS model at the upstream boundary of the MLA, and contributory sub-catchments between the upstream and downstream MLA boundaries, are included in Table 2.3. These peak design flows are incorporated into the XP-SWMM 2d hydraulic models by way of nodes at geographically suitable locations as shown in Figure 2.2, and reflect time-dependent flow inputs. The tributary sub-catchment inflows are added to the XP-SWMM 2d model on Horse Creek just upstream of the confluence of the tributary and Horse Creek and are not added to Horse Creek proportionally along its length. Table 2.3 Peak design flows (m 3 /s) Location XP-RAFTS model node Average Recurrence Interval 2 year 5 year 10 year 50 year 100 year 1000 year Upstream end of MLA Horse Creek online sub-catchment inflow Western subcatchment tributary inflow Western subcatchment tributary inflow Eastern subcatchment tributary inflow J A08A A A J The Probable Maximum Precipitation peak design flow rate at the upstream end of the MLA is m 3 /s. The inflow hydrographs from the Parsons Brinckerhoff XP-RAFTS model at all nodes (see Figure 2.2) are presented in Figures 2.3 to 2.7 below. Parsons Brinckerhoff G-TPT-RPT-003 RevB 8
15 Figure 2-3 Inflow (total) hydrographs to MLA for XP-RAFTS node J06 Figure 2-4 Inflow (local) hydrographs to MLA for XP-RAFTS node A08A Parsons Brinckerhoff G-TPT-RPT-003 RevB 9
16 Figure 2-5 Inflow (local) hydrographs to MLA for XP-RAFTS node A08 Figure 2-6 Inflow (local) hydrographs to MLA for XP-RAFTS node A07 Parsons Brinckerhoff G-TPT-RPT-003 RevB 10
17 Figure 2-7 Inflow (total) hydrographs to MLA for XP-RAFTS node J07 Parsons Brinckerhoff G-TPT-RPT-003 RevB 11
18 3. Hydraulic modelling 3.1 Available data and reports Parsons Brinckerhoff flood study for West Surat Rail Link A two-dimensional hydrodynamic TUFLOW model of Horse Creek was developed by Parsons Brinckerhoff as part of the West Surat Rail Link Hydraulic Study. This was used to estimate design flood levels under existing conditions. The area covered by this model is located to the north of MLA Hydraulic model parameters were adopted from the West Surat Rail Link Hydraulic Study model for consistency with this flood model PSM Horse Creek Diversion report The PSM Australia report titled Horse Creek Diversion Hydrologic, Morphologic & Hydraulic Design (March 2012) was referenced for the purposes of this flood study. The report presents flood extent maps for various ARI events for existing (natural) conditions. 3.2 Base Case XP-SWMM 2d model A new XP-SWMM 2d model was built for the base case (natural conditions) scenario to replace the TUFLOW model. XP-SWMM 2d allows improved functionality and creation of models with multiple grid size domains. XP-SWMM 2d is a computer program for simulating depth-averaged, two and one-dimensional free-surface flows such as occurs from floods and tides. XP-SWMM 2d is based on the computational engine TUFLOW which was originally developed for modelling two-dimensional (2D) flows, and stands for Two-dimensional Unsteady FLOW. An XP-SWMM 2d model was developed for Horse Creek for the full extent of MLA and slightly beyond its upstream and downstream boundaries to determine baseline (undeveloped) flood conditions. Specific details of the XP-SWMM 2d models are discussed below. The model was used to simulate the 2, 5, 10, 50, 100 and 1000 year ARI flood events using inflow hydrographs from the XP-RAFTS model Terrain data A digital elevation model (DEM) covering the extent of the MLA was constructed using the supplied data. The XP-SWMM 2d models use an updated digital elevation model of the natural terrain. The survey resolution is +/ m within the top of banks of Horse Creek. The terrain was derived from 1:10000 and 1:12000 scale aerial photography (Cottrell, Cameron and Steen, 29 September 2009) Grid cell size XP-SWMM 2d is a grid-based modelling system, which converts the ground into a series of vertical and horizontal grids, or cells, of nominated dimensions. The smaller the cell size, the more accurately the model reflects the actual ground with associated model result accuracy, however the processing time is significantly increased. For larger flood events that will not be contained within the creek banks and will spill onto the Parsons Brinckerhoff G-TPT-RPT-003 RevB 12
19 floodplain, larger cell dimensions may be adopted without loss of modelling accuracy. For flows that will be contained within the stream banks a smaller cell is required to achieve modelling accuracy. Two grid cell sizes were used for the hydraulic analysis of Horse Creek and floodplain for the 2, 5, 10, 50, 100 and 1000 year ARI events. A 5 m x 5 m cell size grid was adopted to define the channel geometry within the banks of Horse Creek. Horse Creek has a typical bottom width of 5 10 m and a top width of m. Beyond the tops of banks (the floodplain), the terrain is generally much flatter and shows only a gradual variation in slope. Floodplains can be defined by a larger grid cell size. The Horse Creek floodplain is defined by a 20 m x 20 m cell size grid Boundary conditions Inflows The upstream boundary of Horse Creek model was located approximately 1 km upstream of the MLA boundary. Hydrographs from the XP-RAFTS model for the Horse Creek catchment upstream of the MLA and tributary sub-catchments to Horse Creek within the MLA were applied as inflow points at the creek bed level of Horse Creek in the XP-SWMM 2d models. Downstream boundary The downstream boundary of the Horse Creek model was located approximately 3.7 km downstream of the MLA boundary. The downstream boundary was set as a head-flow type with creek bed and floodplain gradient of 0.002%. This type allows XP-SWMM 2d to determine the tailwater level based on normal depth calculations Structures There is one vehicle track crossing of Horse Creek within the MLA, located approximately 1100 metres upstream of where Horse Creek crosses the northern boundary of the MLA. The track crosses the creek at the creek bed level. The surface terrain is considered adequate to represent the vehicle track crossing Roughness Roughness values for the XP-SWMM 2d model area were assigned to different land use types using the aerial photography. Table 3.1 lists the Manning s n value for the land use types identified in the model area. These values are consistent with those used in the Parsons Brinckerhoff report West Surat Rail Link Hydraulic Study. Table 3.1 Roughness values for the XP-SWMM 2D model Land use Manning s n value Water courses with no vegetation 0.03 Rural (bare/grass floodplain) 0.04 Riparian zone/light vegetation 0.06 Dense vegetation (copses of trees) on floodplain Validation We are unaware of any surveyed flood level information available in the MLA; therefore it has not been possible to calibrate the XP-SWMM 2d model by comparing water levels predicted by the model with recorded water levels for a known flood event. This was also the case for the West Surat Rail Link Hydraulic Study. Parsons Brinckerhoff G-TPT-RPT-003 RevB 13
20 3.2.8 Model scenarios The XP-SWMM 2d models were used to simulate the 2, 5, 10, 50, 100 and 1000 year ARI events for the base case (undeveloped natural watercourse) conditions Results Results for the base case flood study are in the form of drawings depicting the flood extents (water levels), depths, velocities, bed shear stress and stream power distributions. These can be found in Appendix B. Water levels (flood extents) It can be seen on Figure 2 (Appendix B) that the 2 year ARI flood is contained within the banks of Horse Creek for its length within the MLA. The 5 year ARI flood (Figure 7) breaks the banks of Horse Creek and enters depressions that only convey water in events this size and greater. As flood events get larger, the floodplain and overflow channels convey more flood water. In the 10 year ARI event (Figure 12), the downstream boundary of the MLA is crossed by flood water at two locations due to break-outs from the creek. It can be seen clearly in the 50 year ARI flood map (Figure 17) that floodplain water now begins to merge with the flow in the creek. In the 100 year and 1000 year ARI events, the flood extents are generally continuous across the floodplain with few dry areas (islands). Depths It can be seen on Figure 3 (Appendix B) that the 2 year ARI flood is typically 3-4 m deep in Horse Creek, while some reaches of the creek have depths above 6 m. In the 5 year ARI flood (Figure 8), when flood water begins to break the banks, the creek is full and depths are mostly 6-8 m. Flood water outside the creek s top of banks is typically up to 1.5 m deep. In the 10 year ARI flood (Figure 13), water in the floodplain is more spread out and generally up to 2 m deep. In the 50 year ARI flood (Figure 18), depths in Horse Creek are up to 8.5 m, and depths in oxbows and anabranches are typically 2-4 m. In the 100 year ARI flood (Figure 23), depths in Horse Creek are up to 8.8 m. In the 1000 year ARI flood (Figure 28), depths in Horse Creek are up to 10.6 m, depths in oxbows and anabranches are generally above 8 m, and floodplain water is generally 0-2 m deep over a large area. Velocity Hydrodynamic modelling shows that maximum velocities within Horse Creek for the 2 year ARI event are generally between 0-2 m/s, however at some locations velocities are shown to be greater than 3 m/s along the creek centreline. When flood flows break out of the creek as shown in the 5 year ARI map (Figure 9) onto the floodplain or anabranches, the velocities are generally less than 1 m/s. Maximum velocities in the creek during the 10 year ARI event (Figure 14) are generally 1-2 m/s and in the floodplain up to 1 m/s. During the 50 year ARI event (Figure 19), longer reaches of Horse Creek are shown to have velocities greater than 3 m/s. Again, flood flows on the floodplain have velocities generally less than 1 m/s. Between the 100 and 1000 year ARIs, areas in the floodplain where velocities increase to m/s become significantly larger, with some floodplain channels up to 3 m/s. Bed shear stress distributions Bed shear stress (and stream power) described below are not relevant to flood investigations in isolation, but are more useful as relative concepts, enabling comparison of pre and post-development conditions caused by interference with the features of a watercourse, such as a creek diversion or road bridge or culverts. A comparison of these characteristics will indicate how the interference is likely to impact on the stability of the creek and sediment transportation regime. In the case of creek diversions DNRM uses these relative characteristics, amongst other considerations, to assess the acceptability of a conceptual design in granting Parsons Brinckerhoff G-TPT-RPT-003 RevB 14
21 authorisation in terms of the Water Act. The results of the modelling in respect of these characteristics are presented as a factual condition only; no attempt has been made to draw any conclusions from the results. Bed shear stress is the force per unit area exerted by a block of water on the channel boundary as it moves downstream. It is a function of velocity, roughness and depth at any given point in time and grid cell, as well as density and gravity (however these remain constant for the purposes of this study). The maps presented in Appendix B show expected maximum bed shear stress, which provides a theoretical indication of the resistance of the creek to withstand frictional influences (i.e. erosion and sediment transport). The bed shear stress distribution within the creek s banks for the 2 year ARI event (Appendix B) indicates that Horse Creek experiences a wide variation in bed shear stress. These values need to be considered alongside visual assessment and any historical evidence of bed erosion/movement, as well as stream power, to understand the potential of sediment transport and creek movement over time. Limited photographic documentation of Horse Creek shows a small number of instances where bank slumping and erosion has occurred, presumably from flood events of recent years. There did appear to be good grass cover on the banks that is adding to their stability. The creek invert appears to be mostly sandy with little or sparse grass cover and would be subject to higher erosive forces than the banks. The flood modelling also shows secondary flow paths (or anabranches) where historically Horse Creek may have once regularly flowed. The geomorphological assessment will be able to provide additional information to better understand creek movement and erosive potential of Horse Creek. The bed shear stress maps (Appendix B) show that for the 5, 10, 50, 100 year ARI events, the bed shear stress outside the top of creek banks is mostly in the low range as flows cut across the low points in the floodplain. It is not until the 1000 year ARI event that floodplain shear stresses in certain areas reach the high range. Stream power distributions Stream power is the energy available to transport sediment. It is used to determine erosion potential of channels. Stream power is an expression of the rate of energy expenditure or flow strength at a given point in a river system. Stream power results will inform the geomorphology study to be undertaken by Parsons Brinckerhoff and are not commented on here. Similar to bed shear stress, stream power is a relative measure where the design scenario (in this case, the creek diversion) would be expected not to exceed. Stream power maps have been included in Appendix B. 3.3 Diversion Stage Description of diversion The Stage 1 diversion is temporary and starts approximately 4.3 km (thread distance) upstream of where Horse Creek crosses the northern boundary of the MLA. The diversion is on the northern side of Horse Creek and is approximately 2.6 km long. The first part of the diversion is a trapezoidal section sized for conveyance of minor event flows, which then transitions to include a larger trapezoidal section through a hillside, before re-joining Horse Creek. There are three levees as part of the Stage 1 diversion to keep flood water from inundating mine infrastructure. A plan view of the Stage 1 diversion and levee alignments is shown in Figure 3-1. Parsons Brinckerhoff G-TPT-RPT-003 RevB 15
 were simulated with a Manning s roughness of 0.05. Outside the riparian zone, floodplain roughness of 0.04 was applied. 3.")

22 Figure 3-1 Stage 1 diversion and levee alignments Roughness The banks of the Stage 1 diversion were simulated with a Manning s roughness of 0.06, while the overbanks for a width of 20 m (riparian zone) were simulated with a Manning s roughness of Outside the riparian zone, floodplain roughness of 0.04 was applied Results Maps showing the flood levels, depths, maximum velocity, bed shear stress and stream power distribution throughout the MLA for the 2, 5, 10, 50, 100 and 1000 year ARI events are presented in Appendix C. Maps showing the areas that go from wet to dry, and from dry to wet, from the Base Case to Stage 1 scenarios, are shown in Appendix C. Maps showing the areas of afflux (both decreases and increases in water level) from the Base Case scenario to the Stage 1 scenario are shown in Appendix C (2, 50, 1000 year ARI events only). Note that areas that go from dry to wet are shown as afflux (increase in water level); however areas that go from wet to dry are not shown as a decrease in water level. Refer to Section 3.6 for a summary of peak water levels for all simulated ARI events at the upstream and downstream MLA boundaries for the Stage 1 diversion. Parsons Brinckerhoff G-TPT-RPT-003 RevB 16
 upstream of the start of the Stage 1 diversion, 2.")
23 3.4 Diversion Stage Description of diversion The Stage 2 diversion is temporary and incorporates the Stage 1 diversion (refer Section 3.3). The additional creek diversion in Stage 2 starts approximately 5.5 km (thread distance) upstream of the start of the Stage 1 diversion, 2.6 km downstream of where Horse Creek crosses the southern boundary of the MLA and 9.8 km upstream of where Horse Creek crosses the northern boundary of the MLA. The diversion is on the eastern side of Horse Creek and is approximately 950 m long. The diversion is a trapezoidal section sized for conveyance of minor event flows, before re-joining Horse Creek. An additional levee is proposed as part of the Stage 2 diversion to keep flood water from inundating mine infrastructure and is located on the western side of Horse Creek. A plan view of the Stage 2 diversions and levee alignments is shown in Figure 3-2. Figure 3-2 Stage 2 diversion and levee alignments Parsons Brinckerhoff G-TPT-RPT-003 RevB 17
24 3.4.2 Roughness The banks of the Stage 2 diversion were simulated with a Manning s roughness of Results Maps showing the flood levels, depths, maximum velocity, bed shear stress and stream power distribution throughout the MLA for the 2, 5, 10, 50, 100 and 1000 year ARI events are presented in Appendix D. Maps showing the areas that go from wet to dry, and from dry to wet, from the Base Case scenario to the Stage 2 scenario, are shown in Appendix D (2, 5, 10, 50, 100 and 1000 year ARI events). Maps showing the areas of afflux (both decreases and increases in water level) from the Base Case scenario to the Stage 2 scenario are shown in Appendix D (2, 50, 1000 year ARI events only). Note that areas that go from dry to wet are shown as afflux (increase in water level); however areas that go from wet to dry are not shown as a decrease in water level. Refer to Section 3.6 for a summary of peak water levels for all simulated ARI events at the upstream and downstream MLA boundaries for the Stage 2 diversion. 3.5 Diversion Stage Description of diversion The Stage 3 diversion incorporates only part of the Stage 1 diversion. The remainder of the length of the Stage 3 diversion is a new construction and is the permanent diversion. The Stage 3 diversion starts approximately 1.4 km downstream of where Horse Creek crosses the southern boundary of the MLA and is continuous through the MLA and ends where Horse Creek crosses the northern boundary of the MLA. The diversion includes a trapezoidal section that meanders within a larger trapezoidal section. The meandering section conveys the minor event flows while the larger section conveys the major event flows. A levee is proposed along the eastern side, southern side and part of the western side of the south-western mine void, to keep flood water from entering the void. A plan view of the Stage 3 diversion, levee alignment, mine voids and spoil mounds is shown in Figure 3-3. Parsons Brinckerhoff G-TPT-RPT-003 RevB 18

25 Figure 3-3 Stage 3 diversion and levee alignments Parsons Brinckerhoff G-TPT-RPT-003 RevB 19
26 3.5.2 Roughness The banks of the Stage 3 diversion were simulated with a Manning s roughness of 0.06, while the overbanks for a width of 20 m (riparian zone) were simulated with a Manning s roughness of Outside the riparian zone, floodplain roughness of 0.04 was applied Results Maps showing the flood levels, depths, maximum velocity, bed shear stress and stream power distribution throughout the MLA for the 2, 50 and 1000 year ARI events are presented in Appendix E. Maps showing the areas that go from wet to dry, and from dry to wet, from the Base Case to Stage 3 scenario, are shown in Appendix E (2, 5, 10, 50, 100 and 1000 year ARI events). Maps showing the areas of afflux (both decreases and increases in water level) in the 2, 50 and 1000 year ARI events from the Base Case scenario to the Stage 3 scenario are shown in Appendix E. Note that areas that go from dry to wet are shown as afflux (increase in water level); however areas that go from wet to dry are not shown as a decrease in water level. A map showing the flood extents for the Probable Maximum Flood for Stage 3 is shown in Appendix E. Refer to Section 3.6 for a summary of peak water levels for all simulated ARI events at the upstream and downstream MLA boundaries for the Stage 3 diversion. Parsons Brinckerhoff G-TPT-RPT-003 RevB 20
27 3.6 Summary of results A summary table of peak water levels for all simulated ARI events at the upstream and downstream MLA boundaries for the Base Case and diversion stages is presented below. Table 3.2 Peak water level comparison across scenarios for simulated design flood events Average Recurrence Interval MLA boundary Peak water level for scenario (m AHD) Base Case Stage 1 Stage 2 Stage 3 2 year Upstream Downstream year Upstream Downstream year Upstream Downstream year Upstream Downstream year Upstream Downstream year Upstream Downstream Parsons Brinckerhoff G-TPT-RPT-003 RevB 21
28 4. Conclusion This study documents the methodology adopted for the hydrological modelling and the hydraulic flood modelling of Horse Creek in the Base Case (natural conditions) scenario, and the Stage 1, 2 and 3 diversion scenarios over the full extent of MLA 50254, and a sufficient distance upstream and downstream of the MLA boundary. The aim was to provide sufficient information to evaluate the impacts of the proposed creek diversions both off and on mine lease. The report described: the methodology adopted for the study including adoption and amendment of the XP-RAFTS models previously developed by Parsons Brinckerhoff tabulated peak flows for various ARI events determined utilising the XP-RAFTS hydrology model and provided a comparison between these results and those of PSM for the same creek reach and flood events, and provided some commentary regarding differences described the methodology and inputs into the XP-SWMM 2d hydraulic model, including incorporation of ground data, grid cell selection and peak flow simulation by incorporation of hydrographs at geographically representative locations described the calibration and verification of the hydrology and hydraulic models respectively presented results of the XP-SWMM 2d hydraulic modelling by way of colour distribution maps depicting the flood extents (water levels), depths, maximum velocity, bed shear stress, stream power, afflux and wet to dry and dry to wet areas throughout Horse Creek for the simulated flood events and diversion scenarios. It was shown that there is an afflux of only 120 mm at the upstream boundary of the MLA between the Base Case and Stage 3 diversion scenarios for the 1000 year ARI flood event. There is no afflux at the downstream MLA boundary between the Base Case and Stage 3 diversion scenarios for any simulated flood event. Parsons Brinckerhoff G-TPT-RPT-003 RevB 22
29 5. References Bureau of Meteorology (2003) Revision of the Generalised Tropical Storm Method of Estimating Probable Maximum Precipitation. Hydrology Report Series, Report No. 8 (HRS8). Bureau of Meteorology. Available online: Accessed 12 March Bureau of Meteorology (2013) Welcome to the IFD Program. Available online: Accessed 21 June Cottrell, Cameron and Steen. Letter dated 29 September Ref: Institution of Engineers Australia (1998) Australian Rainfall and Run-off. Institution of Engineers Australia, Crows Nest, NSW. Parsons Brinckerhoff (2012) West Surat Rail Link Hydraulic Study. Report B-RPT-001 RevA_FINAL. 19 September Northern Energy Corporation Ltd. PSM Australia (2012) Horse Creek Diversion Hydrologic, Morphologic & Hydraulic Design. Report No: PSM Australia Pty Ltd. WRM (2013) Horse Creek Flood Study Peer Review. New Hope Coal Ltd. November Report No: B_Draft. WRM Water and Environment. Parsons Brinckerhoff G-TPT-RPT-003 RevB 23
3.5 Hydrology & Hydraulics
 3.5 Hydrology & Hydraulics 3.5.1 Purpose The purpose of this section is to provide results from the analysis and assessment of the impact of the proposed Carmichael Rail Alignment (Option 11 Revision 1)
Appendix D Flood Assessment
 Appendix D Flood Assessment Mount Pleasant Operation Rail Modification Flood Assessment MACH Energy Australia Pty Ltd 0744-09-B3, 19 December 2017 Report Title Client Report Number Mount Pleasant Operation
Report. Flood Hydrology Technical Report Red Hill Mining Lease EIS 23 AUGUST BM Alliance Coal Operations Pty Ltd.
 Report Flood Hydrology Technical Report Red Hill Mining Lease EIS 23 AUGUST 2013 Prepared for BM Alliance Coal Operations Pty Ltd Project Manager: URS Australia Pty Ltd Chris Taylor Senior Associate Level
IDENTIFYING FLOOD CONTROL LOTS IN THE HORNSBY LGA
 IDENTIFYING FLOOD CONTROL LOTS IN THE HORNSBY LGA B.C. Phillips 1, R.S. Thomson 1, T. Fang 1, S. Yu 1, A. Boyd 2 1 Cardno (NSW/ACT) Pty Ltd, Sydney, NSW 2 Hornsby Shire Council, Hornsby, NSW Introduction
Temporary Watercourse Crossing: Culverts
 Temporary Watercourse Crossing: Culverts DRAINAGE CONTROL TECHNIQUE Low Gradient Velocity Control Short Term Steep Gradient Channel Lining Medium-Long Term Outlet Control Soil Treatment Permanent Symbol
IDENTIFYING FLOOD RISK FOR RAPID CREEK
 IDENTIFYING FLOOD RISK FOR RAPID CREEK P Saunders 1, S Ruscheinsky 2 L Rajaratnam 3 1 Sinclair, Knight Merz, Darwin, NT 2 Sinclair Knight Merz, Sydney, NSW 3 Department of Land Resources Management, Darwin
Prepared for: City of Jeffersonville. November Prepared by
 JEFFERSONVILLE STORMWATER MASTER PLAN HYDRAULICS APPENDIX JEFFERSONVILLE, INDIANA Prepared for: City of Jeffersonville November 2011 Prepared by Christopher B. Burke Engineering, Ltd. 115 W. Washington
RETENTION BASIN EXAMPLE
 -7 Given: Total Tributary Area = 7.5 ac o Tributary Area within Existing R/W = 5.8 ac o Tributary Area, Impervious, Outside of R/W = 0.0 ac o Tributary Area, Pervious, Outside of R/W = 1.7 ac o Tributary
498 AVE BRIDGE HYDRAULICS INVESTIGATION OF IMPACTS RELATED TO TOWN OF HIGH RIVER FLOOD MITIGATION WORKS
 498 AVE BRIDGE HYDRAULICS INVESTIGATION OF IMPACTS RELATED TO TOWN OF HIGH RIVER FLOOD MITIGATION WORKS Submitted to: M.D. of Foothills No. 31 High River, Alberta Submitted by: Amec Foster Wheeler Environment
A part of BMT in Energy and Environment Portarlington East Drainage / Flood Study Final Report
 A part of BMT in Energy and Environment S Portarlington East Drainage / Flood Study Final Report R.M7373.003.02.FinalReport October 2009 Portarlington East Drainage/Flood Study Final Report Prepared For:
Temporary Watercourse Crossing: Fords
 Temporary Watercourse Crossing: Fords DRAINAGE CONTROL TECHNIQUE Low Gradient Velocity Control Short Term Steep Gradient Channel Lining Medium-Long Term Outlet Control Soil Treatment Permanent [1] [1]
STORM WATER MANAGEMENT REPORT
 Silvercreek Junction STORM WATER MANAGEMENT REPORT Howitt Creek at the Silvercreek Parkway Site Guelph, Ontario August, 2008 TSH File 22304A-04 August 19, 2008 STORMWATER MANAGEMENT REPORT Howitt Creek
Hydraulic and Sediment Transport Modeling Strategy
 Appendix B Hydraulic and Sediment Transport May 2014 Technical Memorandum Channel Capacity Report September 2014 San Joaquin River Restoration Program Hydraulic and Sediment Transport The San Joaquin River
Bickham Coal WRA & WMP Appendix 20 Flood Modelling
 Appendix 2 Flood Modelling March 29 March 29 Table of Contents Page No. 1. INTRODUCTION... 1 1.1 Background... 1 1.2 Scope... 1 1.3 Objectives... 1 2. HYDROLOGICAL MODELLING... 2 2.1 Selection of Hydrologic
Pakenham East Precinct Structure Plan. Deep Creek Corridor Proposals
 Hydrological and Environmental Engineering Pakenham East Precinct Structure Plan Deep Creek Corridor Proposals 5 October 2014 Report by: Valerie Mag BE Civil (Hons), M Eng Sci Stormy Water Solutions stormywater@optusnet.com.au
2.9 SURFACE WATER DIVERSION. Horse Creek Diversion
 Figure 5.17 TDP Dimensions 2.9 SURFACE WATER DIVERSION Horse Creek, an ephemeral tributary of the Dawson River, passes centrally through MLA 50254 and to the east of MLAs 50271 and 50270. Horse Creek has
Hydrotechnical Design Guidelines for Stream Crossings
 Hydrotechnical Design Guidelines for Stream Crossings Introduction Design of stream crossings and other in-stream highway facilities requires estimation of design highwater elevation and mean channel velocity.
Control and mitigation of floods along transbasin diversion channel of Mekong tributaries and Nan river, Thailand
 Control and mitigation of floods along transbasin diversion channel of Mekong tributaries and Nan river, Thailand Tawatchai Tingsanchali* School of Civil Engineering, Asian Institute of Technology, P.O.Box
SCOUR AT COMPLEX BRIDGE STRUCTURES THE BENEFITS OF TWO-DIMENSIONAL HYDRAULIC MODELLING IN THE ESTIMATION OF SCOUR DEPTHS
 SCOUR AT COMPLEX BRIDGE STRUCTURES THE BENEFITS OF TWO-DIMENSIONAL HYDRAULIC MODELLING IN THE ESTIMATION OF SCOUR DEPTHS M Burgess 1, C Moore 1 1 Arup, Sydney, NSW Abstract Assessing scour potential at
Appendix D. Surface water assessment report
 Appendix D Surface water assessment report Lake Ifould Surface Water Impact 11 September 2008 Iluka Resources Parsons Brinckerhoff Australia Pty Limited ABN 80 078 004 798 PPK House 101 Pirie Street Adelaide
What s so hard about Stormwater Modelling?
 What s so hard about Stormwater Modelling? A Pugh 1 1 Wallingford Software Pty Ltd, ann.pugh@wallingfordsoftware.com Abstract A common misconception of stormwater modelling is that it is simple. While
Southeast Policy Area Drainage Study
 Southeast Policy Area Drainage Study Prepared for City of Elk Grove January 2014 448-00-12-03 Table of Contents 1.0 Introduction... 1 2.0 Watershed Description... 1 3.0 Drainage Plan Concept... 1 4.0
Appendix C, Attachment 4 June 11, Diversion Channel Outlet Hydraulic Modeling RAS and ADH
 Diversion Channel Outlet Hydraulic Modeling RAS and ADH 11 June 2012 1 Contents Introduction... 3 HEC-RAS modeling of Outlet... 3 Transition Structure Geometry... 3 ADH Modeling of Outlet and Floodplain...
Advice to decision maker on coal mining project
 . Advice to decision maker on coal mining project IESC 2015-063: West Muswellbrook Project New Development Requesting agency The New South Wales Mining and Petroleum Gateway Panel Date of request 27 January
Flood Hazard Assessment of Potential Growth Areas Palmerston North City: Ashhurst
 Flood Hazard Assessment of Potential Growth Areas Palmerston North City: Ashhurst Report prepared for Palmerston North City Council by Philip Wallace River Edge Consulting Limited May 2013 Table of Contents
SECTION IV WATERSHED TECHNICAL ANALYSIS
 A. Watershed Modeling SECTION IV WATERSHED TECHNICAL ANALYSIS An initial step in the preparation of this stormwater management plan was the selection of a stormwater simulation model to be utilized. It
Armstrong Creek West Precinct. Review of Stormwater Management Strategy
 Armstrong Creek West Precinct Review of Stormwater Management Strategy 31 October 2011 Report by: Valerie Mag, B.E. Civil (Hons), M. Eng. Sci. Stormy Water Solutions stormywater@optusnet.com.au Ph 9511
E. STORMWATER MANAGEMENT
 E. STORMWATER MANAGEMENT 1. Existing Conditions The Project Site is located within the Lower Hudson Watershed. According to the New York State Department of Environmental Conservation (NYSDEC), Lower Hudson
Abstract. Policy Context for Flood Risk Management in NSW. A Frazer 1, D McLuckie 1, J Bucinskas 1, A Toniato 1, G Pelosi 1, P Buchanan 1
 LOCAL OVERLAND FLOODING THE NSW EXPERIENCE A Frazer 1, D McLuckie 1, J Bucinskas 1, A Toniato 1, G Pelosi 1, P Buchanan 1 1 Office of Environment and Heritage, NSW Abstract Local overland flooding describes
Low Gradient Velocity Control Short Term Steep Gradient Channel Lining Medium-Long Term Outlet Control Soil Treatment Permanent [1]
![Low Gradient Velocity Control Short Term Steep Gradient Channel Lining Medium-Long Term Outlet Control Soil Treatment Permanent [1]](/thumbs/83/88729038.jpg "Low Gradient Velocity Control Short Term Steep Gradient Channel Lining Medium-Long Term Outlet Control Soil Treatment Permanent [1]") Diversion Channels DRAINAGE CONTROL TECHNIQUE Low Gradient Velocity Control Short Term Steep Gradient Channel Lining Medium-Long Term Outlet Control Soil Treatment Permanent [1] [1] The design of permanent
Diversion Channels DRAINAGE CONTROL TECHNIQUE Low Gradient Velocity Control Short Term Steep Gradient Channel Lining Medium-Long Term Outlet Control Soil Treatment Permanent [1] [1] The design of permanent
Alberta Rainfall Runoff Response
 Alberta Rainfall Runoff Response Introduction The runoff response to a rainfall event is a function of many complex hydrologic processes. Some of the major factors in the rainfall-runoff process are basin
Hydraulic Capacity Review Rangitaiki River and Reids Floodway
 Hydraulic Capacity Review Rangitaiki River and Reids Floodway February 2011 Contents Executive Summary... 1 1 Introduction... 2 2 Hydrology and Sea Levels... 2 2.1 Design Hydrographs... 2 2.2 Sea Level...
Learning objectives. Upon successful completion of this lecture, the participants will be able to describe:
 Solomon Seyoum Learning objectives Upon successful completion of this lecture, the participants will be able to describe: The different approaches for estimating peak runoff for urban drainage network
The study consists of two parts. The same workflow is used in both:
 Results following the workflow The study consists of two parts. The same workflow is used in both: Climate impact indicators of hydrology in a future climate Data collection and hydraulic modelling Identify
BMA Broadmeadow Mine - EHP EA amendment application (Pre-lodgement meeting) Wednesday 22 April, 2015
 Wednesday 22 April, 2015") BMA Broadmeadow Mine - EHP EA amendment application (Pre-lodgement meeting) Wednesday 22 April, 2015 Broadmeadow Mine 2 BRM Subsidence Management Plan SMP Purpose SMP is the document that outlines the
BMA Broadmeadow Mine - EHP EA amendment application (Pre-lodgement meeting) Wednesday 22 April, 2015 Broadmeadow Mine 2 BRM Subsidence Management Plan SMP Purpose SMP is the document that outlines the
Context of Extreme Alberta Floods
 Context of Extreme Alberta Floods Introduction Design of water management and stream crossing infrastructure requires determination of hydrotechnical design parameters. These parameters often consist of
Environmental Assessment Chapter 8 Surface Water
 Environmental Assessment Chapter 8 Surface Water 8.2.7 Rainfall and Evaporation Based on recorded data for the area of interest, the mean annual rainfall is about 700mm, with maximum monthly rainfalls
APPENDIX E APPENDIX E ESTIMATING RUNOFF FOR SMALL WATERSHEDS
 APPENDIX E ESTIMATING RUNOFF FOR SMALL WATERSHEDS March 18, 2003 This page left blank intentionally. March 18, 2003 TABLES Table E.1 Table E.2 Return Frequencies for Roadway Drainage Design Rational Method
6/4/2014. Murweh Shire, Queensland CHARLEVILLE FLOOD MANAGEMENT MOVING BEYOND MITIGATION
 Neil Polglase David Murray Murweh Shire, Queensland May 2014 CHARLEVILLE FLOOD MANAGEMENT MOVING BEYOND MITIGATION Emergency Management System Land area of 43,905 km2 Population Murweh Shire 4,910 Town
ONE DIMENSIONAL DAM BREAK FLOOD ANALYSIS FOR KAMENG HYDRO ELECTRIC PROJECT, INDIA
 ONE DIMENSIONAL DAM BREAK FLOOD ANALYSIS FOR KAMENG HYDRO ELECTRIC PROJECT, INDIA S. Masood Husain Nitya Nand Rai Director Assistant Director Foundation Engineering & Special Analysis Directorate Central
Report. Inflow Design Flood Control System Plan St. Clair Power Plant St. Clair, Michigan. DTE Energy Company One Energy Plaza, Detroit, MI
 Report Inflow Design Flood Control System Plan St. Clair Power Plant St. Clair, Michigan DTE Energy Company One Energy Plaza, Detroit, MI October 14, 2016 NTH Project No. 62-160047-04 NTH Consultants,
Jacobi, Toombs, and Lanz, Inc.
 Area 5: Blackiston Mill Road at Dead Man's Hollow Flooding Assessment Jacobi, Toombs, and Lanz, Inc. This document summarizes an assessment of drainage and flooding concerns and provides recommendations
Flood Forecasting - What Can You Do With Your Data?
 Flood Forecasting - What Can You Do With Your Data? C Druery 1, D McConnell,2 1 WorleyParsons, Sydney, NSW 2 WorleyParsons, Sydney, NSW Abstract Driven by the large scale flooding over the past several
DRAINAGE & DESIGN OF DRAINAGE SYSTEM
 Drainage on Highways DRAINAGE & DESIGN OF DRAINAGE SYSTEM P. R.D. Fernando Chartered Engineer B.Sc.(Hons), M.Eng. C.Eng., MIE(SL) Drainage Requirement of Highway Drainage System Introduction Drainage means
Building a Comprehensive Spatio-Temporal Database of Floodplain Inundation for Environmental Management in the Murray-Darling Basin, Australia
 nd International Congress on Modelling and Simulation, Hobart, Tasmania, Australia, to 8 December mssanz.org.au/modsim Building a Comprehensive Spatio-Temporal Database of Floodplain Inundation for Environmental
FLOOD PLAIN MANAGEMENT
 CITY OF STRATFORD STRATFORD WEST SECONDARY PLAN FLOOD PLAIN AND STORM WATER MANAGEMENT COURT DRAIN AND MCNAMARA DRAIN MCCORMICK RANKIN CORPORATION December 2007 TABLE OF CONTENTS 1.0 INTRODUCTION...2 1.1
FLOOD INUNDATION ANALYSIS FOR METRO COLOMBO AREA SRI LANKA
 FLOOD INUNDATION ANALYSIS FOR METRO COLOMBO AREA SRI LANKA Mohamed Mashood Mohamed Moufar* (MEE 13633) Supervisor: Dr. Duminda Perera**, ABSTRACT The canal network in Metro Colombo area in Sri Lanka, initially
Gold Coast. Rapid Transit. Hydrology and Hydraulics
 Gold Coast Rapid Transit 19 Hydrology and Hydraulics Contents 1. Introduction 19 1 2. Source Data 19 2 3. Methodology 19 3 3.1 Drainage Upgrades 19 3 3.2 Period of Closure 19 6 4. Description of the Existing
SURFACE/STORM WATER MANAGEMENT STRATEGY: 1960 & 2040 Mickleham Road, Mickleham. Lindum Vale. Satterley Property Group
 SURFACE/STORM WATER MANAGEMENT STRATEGY: 1960 & 2040 Mickleham Road, Mickleham Lindum Vale Satterley Property Group October 2017 Document history Revision: Revision no. 04 Author/s Jonathon McLean Andrew
Development of Stage-Discharge Ratings for Site 2240 Bear Creek at Cold Spring
 Development of Stage-Discharge Ratings for Site 2240 Bear Creek at Cold Spring Prepared for: Urban Drainage and Flood Control District 2480 W. 26 th Avenue Suite 156-B Denver, CO 80211 May 19, 2006 (Rev
Hydrology & Hydraulic Design Criteria
 Hydrology and Hydraulics Design Criteria Page No: i CONTENTS 1.0 INTRODUCTION...1 1.1 Background...1 1.2 Document Purpose...3 1.3 Definitions...3 1.4 Codes and Standards...3 2.0 DESIGN CRITERIA...3 2.1
SHEEP RIVER AT 128 TH STREET FLOOD HAZARD RISKS AND REVIEW OF MITIGATION OPTIONS
 SHEEP RIVER AT 128 TH STREET FLOOD HAZARD RISKS AND REVIEW OF MITIGATION OPTIONS Submitted to: Municipal District of Foothills No. 31 Calgary, Alberta Submitted by: Calgary, Alberta CW2167.SHEEP is committed
Closure Water Balance Model to Support Closure Designs for a Mine in Laos
 Page 1 Closure Water Balance Model to Support Closure Designs for a Mine in Laos BR Luinstra SRK Consulting (Australasia) JT Chapman SRK Consulting (Australasia) A Hendry SRK Consulting (Australasia) A
Application for Subsidence Management Approval. Subsidence Management Plan ANNEX D. Bettys Creek Subsidence Management Plan
 Application for Subsidence Management Approval Subsidence Management Plan ANNEX D Bettys Creek Subsidence Management Plan Subsidence Management Plan Bettys Creek Glennies Creek Longwall Panels 10 to 17
Stage 3: Flood Study Report DRAFT
 hydrol Stage 3: Flood Study Report DRAFT Dee Why South Catchment Flood Study W4961 W4961 Prepared for 29 April 2013 Document Information Prepared for Project Name File Reference R001 Stage 3 Flood Study
UPDATE OF ARC TP108 RUN-OFF CALCULATION GUIDELINE
 UPDATE OF ARC TP108 RUN-OFF CALCULATION GUIDELINE Bodo Hellberg, Stormwater Action Team, Auckland Regional Council Matthew Davis, Stormwater Action Team, Auckland Regional Council ABSTRACT This paper focuses
COOPER STREET, EPPING STORMWATER MANAGEMENT STRATEGY. May Cooper Street Pty Ltd
 415-425 COOPER STREET, EPPING STORMWATER MANAGEMENT STRATEGY May 2017 Cooper Street Pty Ltd Disclaimer Dalton Consulting Engineers Pty Ltd This report has been prepared solely for the benefit of Cooper
Hey and Associates, Inc.
 Hey and Associates, Inc. Table 1: 100-Year Study Existing Conditions Discharges and Elevations vs. FIS Results Location Existing FIS Q (cfs) Existing FIS Elevation Existing XP- SWMM Q (cfs) Existing XP-SWMM
Distribution Restriction Statement Approved for public release; distribution is unlimited.
 CECW-EH-Y Regulation No. 1110-2-1464 Department of the Army U.S. Army Corps of Engineers Washington, DC 20314-1000 Engineering and Design HYDROLOGIC ANALYSIS OF WATERSHED RUNOFF Distribution Restriction
WWTP Protection Memo INTRODUCTION AND PURPOSE MODEL DEVELOPMENT AND ALTERNATIVES. August 31, PROJECT: TO: FROM: Re:
 WWTP Protection Memo August 31, 2017 PROJECT: TO: FROM: Re: City of Montesano WWTP Protection Log Jacks Matt Kastberg, Parametrix, Inc. Keelan Jensen, Dan Eggers, Henry Hu, WEST Consultants, Inc. WWTP
What is runoff? Runoff. Runoff is often defined as the portion of rainfall, that runs over and under the soil surface toward the stream
 What is runoff? Runoff Runoff is often defined as the portion of rainfall, that runs over and under the soil surface toward the stream 1 COMPONENTS OF Runoff or STREAM FLOW 2 Cont. The types of runoff
APPENDIX E ESTIMATING RUNOFF FROM SMALL WATERSHEDS
 ESTIMATING RUNOFF FROM SMALL WATERSHEDS June 2011 THIS PAGE LEFT BLANK INTENTIONALLY. June 2011 TABLES Table E.1 Table E.2 Return Frequencies for Roadway Drainage Design Rational Method Values June 2011
STORM DRAINAGE DESIGN MANUAL
 Appendix I STORM DRAINAGE DESIGN MANUAL by: SUNGATE DESIGN GROUP, P.A. GEN ERAL DESIGN STAN DARDS AN D POLICIES 1. STREET AND LOCAL DRAINAGE Discharge estimates for specified design storms shall be calculated
Flooding & Drainage Assessment for Killingworth Local Environmental Study
 Flooding & Drainage Assessment for Killingworth Local Environmental Study Transmittal Revision Author Verifier Issued to Date 1 Preliminary Angus Brien Ben Clark Philip Carroll RPS Group 21.03.2011 2 Preliminary
COMPOUND CHANNEL MODELLING CAPABILITY ASSESSMENT OF 1D HYDRAULIC MODEL
 COMPOUND CHANNEL MODELLING CAPABILITY ASSESSMENT OF 1D HYDRAULIC MODEL Jahangir Islam and Nick Brown Auckland Council ABSTRACT (200 WORDS MAXIMUM) Accurate modelling of streams or open channels in urban
Stormwater Erosion Control & Post-Construction Plans (Stormwater Quality Plans)
") Stormwater Erosion Control & Post-Construction Plans (Stormwater Quality Plans) Allen County Stormwater Plan Submittal Checklist The following items must be provided when applying for an Allen County Stormwater
Stormwater Erosion Control & Post-Construction Plans (Stormwater Quality Plans) Allen County Stormwater Plan Submittal Checklist The following items must be provided when applying for an Allen County Stormwater
What is a representative pan factor value for the eastern Pilbara? Aditya Jha
 What is a representative pan factor value for the eastern Pilbara? Aditya Jha Parsons Brinckerhoff Australia Pty Ltd, Level 5, 503 Murray St, Perth, Western Australia 6000, AJha@pb.com.au Abstract The
River Processes River action (fluvial)
") River action (fluvial) is probably the single most important geomorphic agent and their influence in geomorphology can hardly be overestimated. 1 To understand the complexity associated with river flow
River action (fluvial) is probably the single most important geomorphic agent and their influence in geomorphology can hardly be overestimated. 1 To understand the complexity associated with river flow
LAKE COUNTY HYDROLOGY DESIGN STANDARDS
 LAKE COUNTY HYDROLOGY DESIGN STANDARDS Lake County Department of Public Works Water Resources Division 255 N. Forbes Street Lakeport, CA 95453 (707)263-2341 Adopted June 22, 1999 These Standards provide
Appendix F. Flow Duration Basin Design Guidance
 Appendix F Flow Duration Basin Design Guidance Appendix F FINAL REPORT F:\SC46\SC46.31\HMP Mar 05\Appendices\Appendix F FLY_HMP.doc MARCH 2005 Appendix F Flow Duration Basin Design Guidance Prepared by
HYDROLOGIC-HYDRAULIC STUDY ISABELLA OCEAN RESIDENCES ISLA VERDE, CAROLINA, PR
 HYDROLOGIC-HYDRAULIC STUDY ISABELLA OCEAN RESIDENCES ISLA VERDE, CAROLINA, PR 1 INTRODUCTION 1.1 Project Description and Location Isabella Ocean Residences is a residential development to be constructed
Opanuku Stream Accuracy Benchmark 1. Introduction
 Opanuku Stream Accuracy Benchmark 1. Introduction 1.1 Fundamental Approach The proposed approach to flood model accuracy assessment uses data directly measured during an actual physical flood event. In
Brisbane River Catchment Flood Study overview
 Brisbane River Catchment Flood Study overview Brisbane River Catchment Flood Study overview Floods can and do occur in the Brisbane River catchment. The Queensland Government, local councils and the community
Development of a Stage-Discharge Rating for Site Van Bibber Creek at Route 93
 Development of a Stage-Discharge Rating for Site 330 - Van Bibber Creek at Route 93 Prepared for: Urban Drainage and Flood Control District 2480 W. 26 th Avenue Suite 156-B Denver, CO 80211 May 19, 2006
The Texas A&M University and U.S. Bureau of Reclamation Hydrologic Modeling Inventory (HMI) Questionnaire
 Questionnaire") The Texas A&M University and U.S. Bureau of Reclamation Hydrologic Modeling Inventory (HMI) Questionnaire May 4, 2010 Name of Model, Date, Version Number Dynamic Watershed Simulation Model (DWSM) 2002
The Texas A&M University and U.S. Bureau of Reclamation Hydrologic Modeling Inventory (HMI) Questionnaire May 4, 2010 Name of Model, Date, Version Number Dynamic Watershed Simulation Model (DWSM) 2002
Effects on Flood Levels from the Proposed Whakatane Marina
 Effects on Flood Levels from the Proposed Whakatane Marina Peter West, Graduate Engineer Environment Bay of Plenty September 2004 5 Quay Street P O Box 364 Whakatane NEW ZEALAND ISSN 1176-5550 Working
Bear Creek Dam and Reservoir NID# OR Douglas County, Oregon
 Bear Creek Dam and Reservoir NID# OR00614 Douglas County, Oregon FINAL Dam Breach Study and Flood Inundation Mapping March, 2009 Prepared for: The City of Drain, Oregon 129 West C Avenue Drain, OR 97435
The Islamic University of Gaza- Civil Engineering Department Sanitary Engineering- ECIV 4325 L5. Storm water Management
 The Islamic University of Gaza- Civil Engineering Department Sanitary Engineering- ECIV 4325 L5. Storm water Management Husam Al-Najar Storm water management : Collection System Design principles The Objectives
Standards for Soil Erosion and Sediment Control in New Jersey May 2012 STANDARD FOR GRASSED WATERWAYS. Definition. Purpose
 STANDARD FOR GRASSED WATERWAYS Definition A natural or constructed watercourse shaped or graded in earth materials and stabilized with suitable vegetation for the safe conveyance of runoff water. Purpose
PAPER FOR INTERNATIONAL SYMPOSIUM ON URBAN STORMWATER MANAGEMENT SYDNEY FEB 1991
 PAPER FOR INTERNATIONAL SYMPOSIUM ON URBAN STORMWATER MANAGEMENT SYDNEY FEB 1991 Title: Author: The Need for a Single Drainage Authority for Metropolitan Sydney - a Case Study D Still (Director, Bewsher
Failure Consequence Classification
 Failure Consequence Classification Audience: Dam Safety Officers (DSO) Owners of small dams Community emergency preparedness coordinators Introduction This document provides an overview of failure consequence
FORT COLLINS STORMWATER CRITERIA MANUAL Hydrology Standards (Ch. 5) 1.0 Overview
 1.0 Overview") Chapter 5: Hydrology Standards Contents 1.0 Overview... 1 1.1 Storm Runoff Determination... 1 1.2 Design Storm Frequencies... 1 1.3 Water Quality Storm Provisions... 2 1.4 Design Storm Return Periods...
Chapter 5: Hydrology Standards Contents 1.0 Overview... 1 1.1 Storm Runoff Determination... 1 1.2 Design Storm Frequencies... 1 1.3 Water Quality Storm Provisions... 2 1.4 Design Storm Return Periods...
Title Advanced Hydraulic Modeling to Support Emergency Action Plans
 Title Advanced Hydraulic Modeling to Support Emergency Action Plans Abstract Freese and Nichols, Inc. (FNI) developed an Emergency Action Plan (EAP) for a Levee Improvement District (LID) located in a
BMP Design Aids. w w w. t r a n s p o r t a t i o n. o h i o. g o v. Equations / Programs
 BMP Design Aids 1 Equations / Programs Outlet Discharge Equations Hydrograph and Pond Routing Programs USGS StreamStats 2 Ohio Department of Transportation 1 Training Intent Introduction and overview of
APPLICATION FORM AF-50: CONSENT UNDER SECTION 50, ARTERIAL DRAINAGE ACT, 1945
 APPLICATION FORM AF-50: CONSENT UNDER SECTION 50, ARTERIAL DRAINAGE ACT, 1945 APPLICATION DETAILS Name of Applicant: Company / authority: Address: Date of Application: Client (if appropriate): BRIDGE DETAILS
Modelling landscape opportunities, multiple benefits and impacts
 In partnership with: Modelling landscape opportunities, multiple benefits and impacts Iain Craigen and Charlotte Beattie Natural Flood Management and Working With Natural Processes There is a growing evidence
Introduction. Keywords: Oil Palm, hydrology, HEC-HMS, HEC-RAS. a * b*
 The Effect of Land Changes Towards in Sg. Pandan Perwira Bin Khusairi Rahman 1,a* and Kamarul Azlan bin Mohd Nasir 1,b 1 Faculty of Civil Engineering, Universiti Teknologi Malaysia, Malaysia a * wirakhusairirahman@gmail.com,
TULLAMORE FLOOD RISK ASSESSMENT AND MANAGEMENT STUDY
 TULLAMORE FLOOD RISK ASSESSMENT AND MANAGEMENT STUDY FINAL HYDRAULICS REPORT 1794/RP/004/C June 2008 FRAM Section Engineering Services Office of Public Works Doc. No. 1794/RP/004/C ii June 2008 INDEX OF
ASSESSMENT OF DRAINAGE CAPACITY OF CHAKTAI AND RAJAKHALI KHAL IN CHITTAGONG CITY AND INUNDATION ADJACENT OF URBAN AREAS
 Proceedings of the 4 th International Conference on Civil Engineering for Sustainable Development (ICCESD 2018), 9~11 February 2018, KUET, Khulna, Bangladesh (ISBN-978-984-34-3502-6) ASSESSMENT OF DRAINAGE
OFFICE OF STRUCTURES MANUAL ON HYDROLOGIC AND HYDRAULIC DESIGN CHAPTER 3 POLICY AND PROCEDURES
 OFFICE OF STRUCTURES MANUAL ON HYDROLOGIC AND HYDRAULIC DESIGN CHAPTER 3 POLICY AND PROCEDURES April 28, 2016 Table of Contents 3.1 Introduction... 2 3.1.1 Purpose of Chapter 3... 2 3.1.2 Policy vs. Design
Surface Water Management Procedure Environment
 1 Purpose and Scope This procedure specifies the operational environmental requirements that relate to surface water management at the Roy Hill Project. This procedure applies to all personnel involved
DRAINAGE REVIEW: Berwick Health and Education Precinct. for. Victorian Planning Authority
 DRAINAGE REVIEW: Berwick Health and Education Precinct for Victorian Planning Authority April 2017 Document history Revision: Revision no. 03 Author/s Jonathon McLean Approved Jonathon McLean Distribution:
Address for Correspondence
 Research Paper DYNAMIC FLOOD ROUTING AND UNSTEADY FLOW MODELLING: A CASE STUDY OF UPPER KRISHNA RIVER 1 Doiphode Sanjay L* 2 Oak Ravindra A. Address for Correspondence 1 M tech Student, Bharati Vidyapeeth
APPENDIX J-3 Technical Report on Airport Drainage, Northern Sector Airport and Ordinance Creek Watershed, Airport Creek Hydrologic Models
 APPENDIX J-3 Technical Report on Airport Drainage, Northern Sector Airport and Ordinance Creek Watershed, Airport Creek Hydrologic Models Introduction Technical Report on Airport Drainage Appendix J-3:
Upstream structural management measures for an urban area flooding in Turkey
 doi:10.5194/piahs-370-45-2015 Author(s) 2015. CC Attribution 3.0 License. Upstream structural management measures for an urban area flooding in Turkey Z. Akyurek 1, B. Bozoğlu 1, S. Sürer 2, and H. Mumcu
Chapter 10 Infiltration Measures
 Chapter 10 Infiltration Measures Definition: A sub-surface water filtration system designed to allow water to infiltrate into surrounding soils. Purpose: To encourage stormwater to infiltrate into surrounding
Report. Inflow Design Flood Control System Plan Belle River Power Plant East China, Michigan. DTE Energy Company One Energy Plaza, Detroit, MI
 Report Inflow Design Flood Control System Plan Belle River Power Plant East China, Michigan DTE Energy Company One Energy Plaza, Detroit, MI October 14, 2016 NTH Project No. 62-160047-04 NTH Consultants,
8.0 - WATER MANAGEMENT STRATEGY
 8. - WATER MANAGEMENT STRATEGY 8.1 POTENTIAL IMPACTS The project has the potential to adversely affect water quality and flow frequency in the downstream receiving waters of Horse Creek. Such adverse impacts
GRASS-LINED CHANNEL (acre) CODE 840
 CODE 840") NATURAL RESOURCES CONSERVATION SERVICE ILLINOIS URBAN MANUAL PRACTICE STANDARD GRASS-LINED CHANNEL (acre) CODE 840 (Source: NC Erosion and Sediment Control Field Manual) DEFINITION A natural or constructed
NATURAL RESOURCES CONSERVATION SERVICE ILLINOIS URBAN MANUAL PRACTICE STANDARD GRASS-LINED CHANNEL (acre) CODE 840 (Source: NC Erosion and Sediment Control Field Manual) DEFINITION A natural or constructed
Training Course Brochure Building Capacity in Rural & Urban Water Management
 Training Course Brochure 2015 Building Capacity in Rural & Urban Water Management Introduction The WastePro Academy seeks to encourage the use of desktop software applications in the water and environmental