Drought Monitoring and Impact Assessment in the Mekong River Basin
|
|
|
- Benedict Thompson
- 6 years ago
- Views:
Transcription

317 460050 info@futurewater.nl www.futurewater.nl")
1 Drought Monitoring and Impact Assessment in the Mekong River Basin March 2011 Client Mekong River Commission Secretariat Authors W. Terink W.W. Immerzeel P. Droogers Report FutureWater: 104 FutureWater Costerweg 1G 6702 AA Wageningen The Netherlands +31 (0)
2 Contents 1 Introduction The Mekong River Commission Drought in the Mekong Basin Impact of flood vs. drought Flood management procedures are different for drought management Drought assessment and alleviation is far more complex than flooding Climate change will increase drought substantially In contrast to drought floods provide positive services Drought is a basin-wide issue 11 2 Drought Monitoring Definitions Meteorological Drought Rainfall anomalies Standardized Precipitation Index Moisture Availability Index Agricultural Drought Normalized Difference Vegetation Index Soil moisture deficits Hydrological Drought 17 3 Drought Monitoring in the Mekong basin Meteorological Drought Precipitation anomalies Standardized Precipitation Index Moisture Availability Index Agricultural Drought Normalized Difference Vegetation Index Soil moisture deficits Hydrological Drought Stream flow Reservoirs and lakes 28 4 Drought risk mapping in the Mekong Basin Drought risk mapping Quantification of drought risks Drought Hazard Index Drought Vulnerability Index Drought Risk Index 36 5 Conclusions and recommendations 39 6 References 40 Appendix 1: Precipitation anomalies 41 Appendix 2: Standardized Precipitation Index (SPI) for 6-monthly time-scale 43 Appendix 3: Moisture Availability Index 46 Appendix 4: Normalized Difference Vegetation Index (NDVI) 49 1
3 Appendix 5: Soil moisture maps 52 Appendix 6: Hazard Index maps 55 Appendix 7: Vulnerability Index maps 59 2
 is an international river basin organisation built on a foundation of nearly 50 years of knowledge and experience in the region.")
4 1 Introduction 1.1 The Mekong River Commission The Mekong River Commission (MRC) is an international river basin organisation built on a foundation of nearly 50 years of knowledge and experience in the region. On the 5 th of April 1995, Cambodia, Lao PDR, Thailand and Viet Nam, signed the Agreement on the Cooperation for the Sustainable Development of the Mekong River Basin. This agreement formed the Mekong River Commission (MRC), which replaced the Committee for Coordination of Investigation of the Lower Mekong Basin (the Mekong Committee) and the Interim Mekong Committee, which were established in 1957 and 1978 respectively. The MRC provides the institutional framework to promote regional cooperation in order to implement the 1995 Agreement. It serves its Member States by supporting decisions and promoting action on sustainable development, protection of ecological balance and poverty alleviation, as a contribution to the UN Millennium Development Goals. The mission of the MRC is to promote and coordinate sustainable management and development of water and related resources for the countries mutual benefit and their people s well-being. To this end, the work of the MRC supports the Mekong Programme, a regional cooperation programme for the sustainable development of water and related resources in the Mekong River Basin. Figure 1: Map of Mekong and MRC countries. 3
5 1.2 Drought in the Mekong Basin It is widely accepted that drought is a serious threat to the people and environment in the Mekong River Basin. There are however some misconceptions that hampered the implementation of an effective drought initiative. The main justifications why an effective Drought Management Initiative is highly required will be discussed briefly here and includes: 1. Impact of drought is of the same magnitude or even higher compared to the impact of floods 2. Procedures set in place for flood management cannot be transferred directly for drought management. 3. Drought assessment and alleviation is far more complex than flooding. 4. Climate change will increase drought substantially. 5. Floods provide many positive services; drought not. 6. Drought is a trans-boundary and basin-wide issue. These six issues will be clarified in the next sections to justify why an effective and operational drought program is essential for the Mekong River Basin Impact of flood vs. drought It is clear that floods have devastating impact on people living in the Mekong River Basin. Almost every year millions of people are affected by the negative impacts of floods. However, the number of people affected by drought is probably much higher (Figure 2). In contrast to floods, the number of people affected by drought is very difficult to assess. Drought is a slow killer and effects are occurring gradually, while for flooding the impact is instantaneous. Results can be monitored easily in terms of for example number of people being displaced. Typical examples of impact of drought and floods for the four LMB countries are presented in Table 1 to Table 4. Figure 2: Number of people affected by drought and floods in the LMB countries (source International Disaster Database). 4
6 Table 1: Typical examples of impact of drought and floods in Cambodia. Disaster Date Affected Damage Source (person) (1000s US$) Flood Jun ,470, IDD Flood Jul ,300,000 1,500 IDD Flood Aug ,448, ,000 IDD Flood Aug ,669,182 15,000 IDD Drought ,000,000 Unknown ADB Drought Jun ,000, ,000 IDD IDD=International Disaster Database ADB=Asian Development Bank Table 2: Typical examples of impact of drought and floods in Lao PDR. Disaster No Events Affected Source (person) Drought 5 4,250,000 WFP Flood 16 3,244,150 WFP WFP = World Food Programme Table 3: Typical examples of impact of drought and floods in Thailand. Disaster Date Affected Impact Source Drought ,000 ha Increased farm production cost 40% ADB Drought ,444,010 ppl Decreased agricultural product GAR Flood ,822 ppl Unknown GAR Drought 2010 Unknown Lost 75% of Cassava production & increased price 60% Bangkok Post ADB = Asian Development Bank GAR = Global Assessment Report Table 4: Typical examples of impact of drought and floods in Vietnam. Disaster Date Affected Impact Source Drought ,000 ha $ 60 million (Cuu long delta) ADB Drought (North June 2010 central) ADB = Asian Development Bank 40,000 hhds, 250,000 ha Not enough clean water; crops dried up; high tem. VietNamNet Flood management procedures are different for drought management. Procedures set in place for flood management cannot be transferred directly for drought management. The entire management of drought requires a completely different approach compared to floods. Floods and drought have a completely different dimension regarding forecasts, impacts and mitigation (Figure 3). Probably the most striking difference in terms of disaster management focus is on the domain area: rivers for flood versus land for drought. While flood mitigation can focus on river management only, drought management should include surface water, soil water and groundwater simultaneously. In the growing international literature on floods and drought this is often referred to as blue and green water. Blue water refers to the visible water, e.g. water in streams, rivers and reservoirs. Green water refers to water falling as precipitation, stored in 5
. Figure 4: Green and Blue water on a global scale (source: Comprehensive Assessment of Water and Agriculture). 1.2.")
.")
7 the soil and subsequently evaporated by vegetation. On a global scale this green water use is of several magnitudes bigger than the blue water use (Figure 4). Figure 3: Flood and Drought pillars (source: Droogers and Immerzeel). Figure 4: Green and Blue water on a global scale (source: Comprehensive Assessment of Water and Agriculture) Drought assessment and alleviation is far more complex than flooding The impact of drought has a local character within a basin context. Drought events develop over large areas, but have a high spatial differentiation (Figure 5, left). The impact of drought shows an even more spatial distribution (Figure 5, right) as a result of a complex interaction between different processes. Floods, in contrast, occur in well distributed areas around the river. Moreover, drought events are far more difficult to define as they manifest in gradients from mild to severe, why floods occur in a so-called a binary mode: flooded or not flooded. 6
 concluded in their latest Assessment Report that low rainfall and higher")
 and the SWAT simulation model.")
8 Figure 5: Precipitation anomaly based on TRMM satellite (left) and Vegetation anomaly based on MODIS satellite (right) for the season Climate change will increase drought substantially The Intergovernmental Panel on Climate Change (IPCC) concluded in their latest Assessment Report that low rainfall and higher temperatures will intensify drought in the Mekong Region substantially (Figure 6). A first assessment of the impact of climate change on drought was undertaken using one Global Circulation Model (GCM) and the SWAT simulation model. One of the main conclusions resulting from the study was that Many scientists are now concluding that these (climate) predictions are gross underestimates and that the region will likely experience the upper extremes of the climate scenarios forecast in the last IPCC assessment. Other key observations are that: Average daily temperatures across Southeast Asia have increased 0.5 to 1.5ºC between 1951 and 2000 (IPCC 2007). Thailand s temperatures have reportedly increased 1.0 to 1.8ºC in the past 50 years; average daytime temperatures in the month of April have been particularly high at 40ºC (ADB, 2009). Viet Nam s temperatures increased by 0.7 C during this same period (ADB 2009). Daily maximum and minimum temperatures are also increasing. Annual maximum flows at Kratie are indicted to increase both in terms of their mean and inter-annual range. A major impact of global warming rests with the increase in the level and variance of flows during the dry season from year to year. This analysis emphasises that there is the prospect of a far more wide ranging modification of the Mekong flow regime than simply a change to mean discharge or the incidence and severity of floods and drought. In general terms any increase in the year to year variability in the statistics points towards a far less certain hydrological environment, which has wide ranging implications for food security and the environment 7

9 as well as for the economic returns from water resources investments, such as hydropower schemes. Climate change and the changes in flow regimes can be observed already. Figure 8 indicates that low flows are more frequent over the last decade. The figure shows the joint distribution of the annual maximum flood discharge (m 3 s -1 ) and the volume of the annual flood hydrograph (km 3 ) at on the Mekong at Kratie ( ). The boxes indicate one (1δ) and two (2δ) standard deviations for each variable above and below their respective means. Events outside of the 1δ box might be defined as significant flood / drought years and those outside of the 2δ box as historically extreme flood / drought years. An important aspect of using climate change scenarios is to downscale these scenarios to a level appropriate to undertake smaller scale assessments. In principle two methodologies exists to undertake this down-scaling: (i) using a regional climate model, (ii) statistical downscaling. Within the MRCS initial studies have been undertaken using the regional climate model PRECIS. The PRECIS (Providing Regional Climates for Impacts Studies) model is one of the most frequently used regional climate models (RCM) in Southeast Asia over the last five years. One of the major drawbacks of the use of RCMs is that, given the complexity and the timeconsuming calculations, only a limited number of GCMs can be used to define the boundary conditions. At the same time are these boundary conditions by enlarge responsible for the final result of the overall trends. The statistical downscaling approach has the advantage that it can be performed relatively quickly so that many GCMs can be used in the assessment. The ADAPT project undertaken by MRCS in association with a large group of international research organisations is a typical example of such an approach. Obviously a combination of these two provides the most relevant results to be used to make strategic decisions regarding drought management and preparedness. Figure 6: Precipitation changes (Dec-Jan-Feb) from the MMD-A1B simulations. Dec-Jan- Feb mean change between 1980 to 1999 and 2080 to 2099, averaged over 21 models (source: IPCC). 8
 of mean annual rainfall during 2010-50 relative to 1985-2000 for the")
10 Figure 7: Downscaled climate change precipitation scenario. Indicated is the change (%) of mean annual rainfall during relative to for the ECHAM4-A2 GCM (source: Kittipong Jirayoot, 2009). 9

11 Figure 8: Scatterplots of the joint distribution of the annual maximum flood discharge (cumecs) and the volume of the annual flood hydrograph (km3) at on the Mekong at Kratie ( ) (source: Adamson and Bird, 2010) In contrast to drought floods provide positive services It is widely accepted that drought events have only negative impacts, while floods provide, besides negative impacts, also specific services. The latter is especially true for the Mekong Basin. Typical examples of services floods provide are the more adequate moisture conditions to plant a crop after the flooding. This type of positive services is often referred to as recession irrigation. A rising river overtops its banks and inundates the plains alongside the river. Crops benefit from the receding flow by enhanced residual moisture conditions. For the Mekong Basin the most relevant positive impact of flooding and high flows is the wellknown Tonle Sap / Great Lake system. It is the most important inland wetland in Southeast Asia and it supports a huge population through its enormous fisheries productivity and water supply; and provides the last refuge for some of Asia's most globally significant biodiversity. Drought in contrast has no positive components and it can only be considered as a threat to humans, livestock, wildlife and the entire environment. 10

12 Figure 9: Tonle Sap flow directions (source: Drought is a basin-wide issue An important consideration for the proposed Drought Management Initiative is the basin-wide and trans-boundary dimension of drought. Without such a trans-boundary dimension drought should probably not being adopted by the MRC. However, there are many trans-boundary dimensions associated with drought in the Mekong Basin. The most relevant are: Low flows are a result of reduced recharge and/or increased withdrawals in upstream parts of the Mekong River. Flow regulation by reservoirs can overcome dry spells and is clearly a trans-boundary issue. At the same time can reservoirs being used to tap water, reducing total annul flows to downstream areas. Market prices are highly affected by drought. So drought in one region will reduce harvests in that region, inducing higher prices affecting all farmers in the region positively. Drought is a result of lower rainfall and is not restricted by country boundaries. Rainfall forecasting and early warning systems for drought should therefore be taken at basin level. So far, drought has been considered as country specific problems. This has for example leaded to different definitions and drought risk assessments. For example, the four member states have created drought assessment maps under various assumptions and names: Cambodia: Drought risk area Lao PDR: Percentage of households affected by drought Vietnam: Drought hazard zone Thailand: Drought hazard zone Maps associated to these assessments can be seen in Figure 10. It is clear that these maps are all using different definitions and an attempt to combine these maps to one generalized map for the entire LMB fails because of these different methodologies and definitions. 11


13 Figure 10: Drought risk maps of the four MRC member states. The notion of drought as a meteorological hazard in tropical monsoon regions is not perhaps one that fits naturally with conventional perceptions. The term Monsoon is virtually synonymous with torrential rainfall, moisture surplus, floods and climatic predictability. Drought on the other hand is more generally associated with the marginal rainfall climates of arid and semi-arid regions, which show high variability and low reliability from year to year, such that rainfall deficits are common and often severe. Drought is by many considered to be the least understood of all major hazards (Keyantash and Dracup, 2004). Impacts are non-structural, unlike other hydro-meteorological extremes such as floods and typhoons, and they are much more widespread geographically. The severity of a 12
14 drought and its impact is dependent not only on its duration, intensity and spatial extent, but also on the specific environment and the economic activities carried out within it as well as the capacity of the prevailing institutional and social systems to cope with it. In the Mekong Basin and along the mainstream there are a range of environments and water demands that respond differently to the various and complex elements of a drought event. The most important characteristics of drought in the Mekong basin are: Below normal flows during the flood season affect the timing, depth and duration of wetland inundation and the inflows to the Great Lake / Tonle Sap system with negative consequences upon fisheries and therefore upon the economy of Cambodia. Deficient flows during the dry season months permit more extensive saline intrusion in the Viet Nam delta which reduces water availability for irrigation. This leads to lower yields, reduced planted area and significant economic loss for one of the world s largest producers of rice for the global market. Low water levels also restrict navigability and reduce river-borne trade. Rainfall shortfalls and unexpected precipitation patterns in both the wet and dry seasons can result in agricultural losses, which can become so large that they lead to reductions in regional and national economic growth targets, as has happened in north east Thailand in The definitive feature of the drought process is the accumulation of a moisture deficit, which may be measured in terms of rainfall, stream flow or soil moisture. The severity of an event, however, is not only a function of the levels that this deficit reaches, but also the timing of crucial moisture shortfalls. For example, if these are reached during the grain filling stage of crop development, then the severity of the event from an agricultural point of view is maximized. In this report a framework is presented for drought monitoring and impact assessment that should be further developed and implemented as part of a Drought Management Initiative (DMI) for MRC. A number of technical examples of drought indicators, hazard indicators, and vulnerability indicators are already given in this report that can be included in the final DMI. 13
15 2 Drought Monitoring 2.1 Definitions The drought phenomenon is often grouped into four types (Wilhite and Glantz, 1985): Meteorological or climatological drought, which focuses on the degree of dryness in terms of an accumulated rainfall deficit. Agricultural drought, which expresses the precipitation shortfall primarily in terms of its impact upon crop production through insufficient soil moisture. It generally applies to rainfed agriculture, though irrigated crops can be affected when the water resources themselves become restricted or too expensive. Hydrological drought refers to shortages in both surface and ground water. This can take the form of critically low river flow, drawn down reservoir storage and deeper groundwater levels which make pumped abstraction too expensive or mechanically impossible. Socio-economic definitions of drought associate the supply and demand consequences for economic goods. For example, if the water shortage becomes so severe that the cooling water supply to key thermal power stations is reduced, the event would be severe. Similarly, energy outputs from hydropower schemes can be curtailed due to low stream flow and low levels of reservoir storage. There are industrial, agricultural, environmental and social consequences from any curtailment of water supply and water use during droughts. Meteorological drought is the prime mover in the sequence. The first consequence of an accumulated rainfall deficit is a reduction in soil moisture storage, which once it reaches a critical level, will have impacts upon crops and animal grazing. Agricultural impacts are therefore the first to appear and in most cases provide the first confirmation that there is in fact a drought of any sort at all. These impacts can vary from crop to crop, farm to farm, region to region and depend upon the crop and its resistance to moisture stress, the stage in its growth, whether there are alternative water supplies other than rainfall and whether livestock can be provided with alternative grazing. As the rainfall and moisture deficit continues to accumulate, hydrological drought begins to manifest itself. Firstly, natural streamflows decrease and fall below normal, ultimately causing a water resources shortfall as reservoirs and other sources of water supply become drawn down. If the event has a long duration and particularly in the case of multi-year droughts, groundwater levels fall and abstraction can become too expensive, too damaging or even mechanically impossible. Finally, drought becomes apparent as a socio-economic process of water shortages and their impacts. There may be food price increases due to reduced domestic agricultural output and (possibly) their replacement with more expensive imports. There may be power rationing due to reduced generating capacity and some industries that are high consumers of water (petrochemicals, metallurgical, bottling plants) might have to reduce production, with secondary consequences for employment, prices, the availability of goods and national economic growth. This sequential process in the development of and linkages between the various components of the overall concept of drought is presented schematically in Figure 11. Also shown are some of the environmental impacts which start to become apparent from the start. For example, many 14

16 plants leaf and flower on the arrival of the first seasonal rainstorms. If these are delayed or do not happen to the necessary degree, there are consequences for insect and birdlife, for natural grazing and, not insignificantly, the risk of fire. Figure 11: Drought Monitoring and Impact Assessment Toolbox (DMIAT). It is proposed to follow the above described framework for assessing drought in the LMB. For each type of drought a number of commonly used indicators will be discussed hereafter. Drought indices assimilate thousands of bits of data on rainfall, agriculture, hydrology and other water related indicators into a comprehensible big picture. A drought index value is typically a single number, far more useful than raw data for decision making. 2.2 Meteorological Drought There are several meteorological indicators for monitoring drought that vary in complexity and applicability. Most indicators describe how much precipitation for a given period of time has deviated from historical averages and will be explained here Rainfall anomalies A rainfall anomaly is expressed as the percentage of normal precipitation it is one of the simplest measurements of rainfall for a location. Analyses using the percentage of normal are very effective when used for a single region or a single season. Percentage of normal is also easily misunderstood and gives different indications of conditions, depending on the location and season. It is calculated by dividing actual precipitation by normal precipitation. This can be determined for a variety of time scales. Usually these time scales range from a single month to a group of months representing a particular season, to an annual or water year. One of the disadvantages of using the percentage of normal precipitation is that the mean, or average, precipitation is often not the same as the median precipitation. The reason for this is 15
17 that precipitation on monthly or seasonal scales does not have a normal distribution. Use of the percentage of normal comparison implies a normal distribution where the mean and median are considered being the same. This makes it difficult to link a value of a departure with a specific impact occurring as a result of the departure, inhibiting attempts to mitigate the risks of drought based on the departures from normal and form a plan of response (Willeke et al., 1994) Standardized Precipitation Index The Standardized Precipitation Index (SPI) is an index based on the probability of precipitation for any time scale. A deficit of precipitation has different impacts on groundwater, reservoir storage, soil moisture, snowpack, and streamflow and this was the base to the development of the Standardized Precipitation Index (SPI) in The SPI was designed to quantify the precipitation deficit for multiple time scales. These time scales reflect the impact of drought on the availability of the different water resources. Soil moisture conditions respond to precipitation anomalies on a relatively short scale. Groundwater, streamflow, and reservoir storage reflect the longer-term precipitation anomalies. For these reasons, McKee et al. (1993) originally calculated the SPI for 3, 6, 12, 24, and 48 month time scales. The SPI calculation for any location is based on the long-term precipitation record for a desired period. This long-term record is fitted to a probability distribution, which is then transformed into a normal distribution so that the mean SPI for the location and desired period is zero (Edwards and McKee, 1997). Positive SPI values indicate greater than median precipitation, and negative values indicate less than median precipitation. Because the SPI is normalized, wetter and drier climates can be represented in the same way, and wet periods can also be monitored using the SPI. McKee et al. (1993) used a classification system to define drought intensities resulting from the SPI. McKee et al. (1993) also defined the criteria for a drought event for any of the time scales. A drought event occurs any time the SPI is continuously negative and reaches an intensity of or less. The event ends when the SPI becomes positive. Each drought event, therefore, has a duration defined by its beginning and end, and intensity for each month that the event continues. The positive sum of the SPI for all the months within a drought event can be termed the drought s magnitude Moisture Availability Index The Moisture Availability Index (MAI) (Hargreaves and Keller, 2005) has been used in numerous studies at the country and global level to evaluate the climate resource for agricultural production. The MAI is the ratio between monthly precipitation and reference evapotranspiration and this takes into account water requirements too. The MAI can be calculated at different time scales (monthly, seasonal, and annual). 2.3 Agricultural Drought There are several agricultural drought indices available that either describes the soil moisture condition, vegetation status or actual crop transpiration. 16
18 2.3.1 Normalized Difference Vegetation Index The Normalized Difference Vegetation Index (NDVI) is a simple numerical indicator that can be used to analyse remote sensing measurements, typically but not necessarily from a space platform, and assess whether the target being observed contains live green vegetation or not. In data-scarce environments time series analysis of the Normalized Difference Vegetation Index (NDVI) can provide valuable information in assessing spatial distributed linkages between climate properties, vegetative phenological cycles and rain-fed land use (Tucker, 1979). The NDVI assumes that the difference between the near-infrared (NIR) and red (RED) reflectance divided by the sum of both (Equation 1) is a quantitative measure of photosynthetic activity (Prince 1991). Analysis of remotely sensed NDVI imagery has successfully been applied in a variety of fields such as drought assessment (Immerzeel et al., 2004). NDVI NIR RED NIR RED Equation 1: Calculation of the NDVI. With: NDVI = Normalized Difference Vegetation Index; NIR = Near InfraRed reflectance; RED = Red reflectance; Soil moisture deficits The soil moisture deficit can be considered as an integrated factor determined by a range of processes such as precipitation, evapotranspiration, runoff, and groundwater recharge. Since soil moisture is a dominant factor for vegetation growth, soil moisture deficit can be seen as an overall drought index. Soil moisture determination was always hampered with difficult and very local specific measurements using tensiometers, neutron sondes, capacitive sensors and/or TDR. However satellite information using passive or active microwave has moved the observation of soil moisture deficit to a higher level. One of the standard sensors being used nowadays is the AMSR-E on board of the Aqua satellite. Various derived products exist and can be obtained from the Goddard Earth Science Data and Information Services Center (GES DISC). 2.4 Hydrological Drought Hydrological drought is probably one of the easiest and most commonly one used. Focus on the so-called blue component of water, in contrast to green water, has always dominated the hydrology and water resources analysis. For hydrological drought assessments many varieties exist, but they are all based on comparing regular flows with time-specific flows. Comparisons are often done at weekly, 10-days, monthly, seasonal or annual time-scales. Daily flow rates are not commonly used, and are more the domain of flood analysis. Reservoir levels are a second component of the hydrological drought analysis. With the advent of satellites innovative methods are becoming available to monitor real-time reservoir levels of any reservoir in the world even without having access to the site. An interesting example of this is the ENVISAT sensor as developed and maintained by European Space Agency (ESA). In the next chapter this will be demonstrated for the Tonle Sap. 17

 daily precipitation data have been downloaded from NASA 1.")
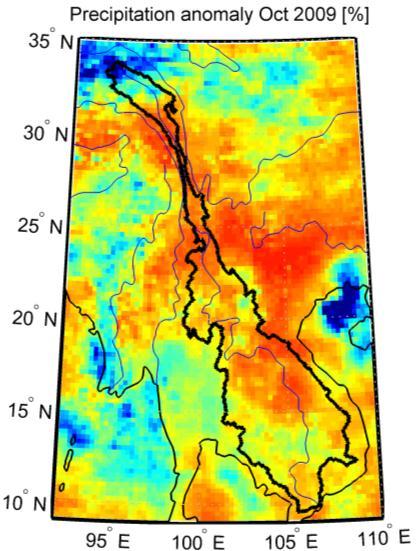
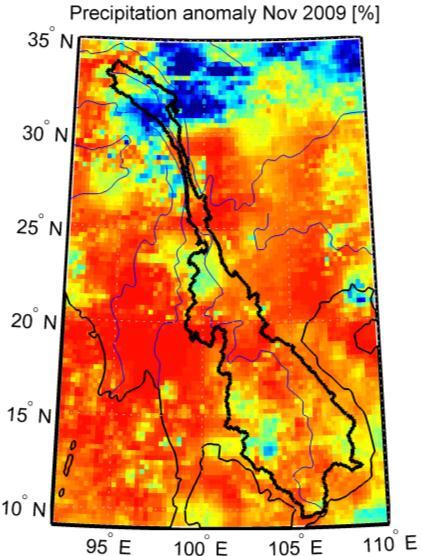
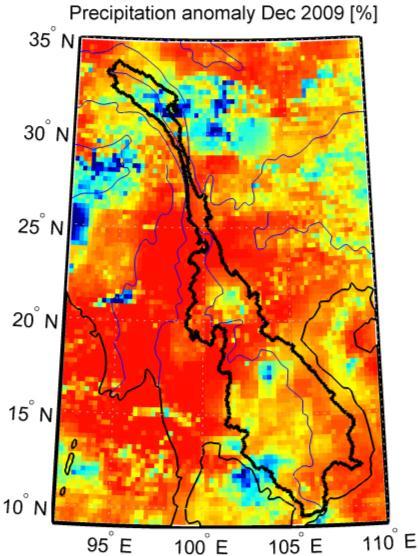
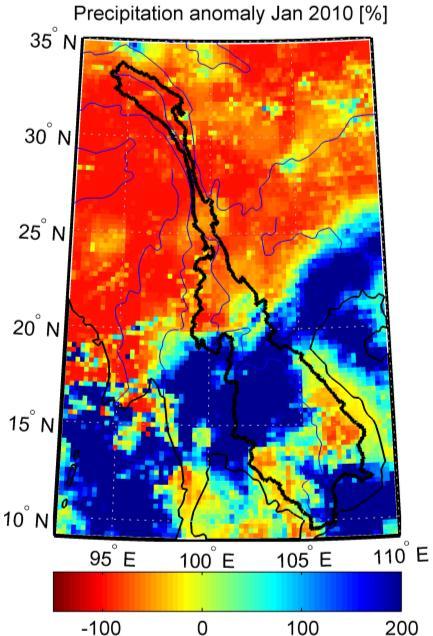
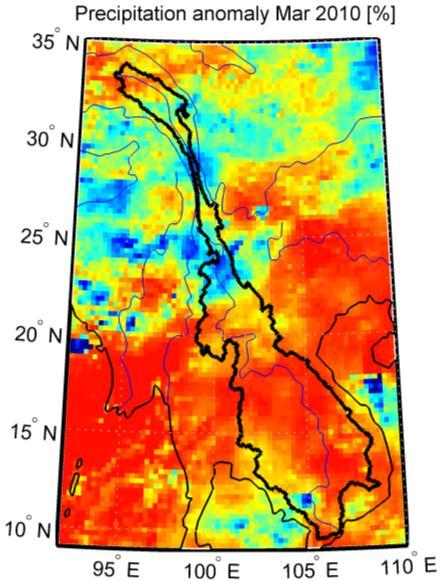
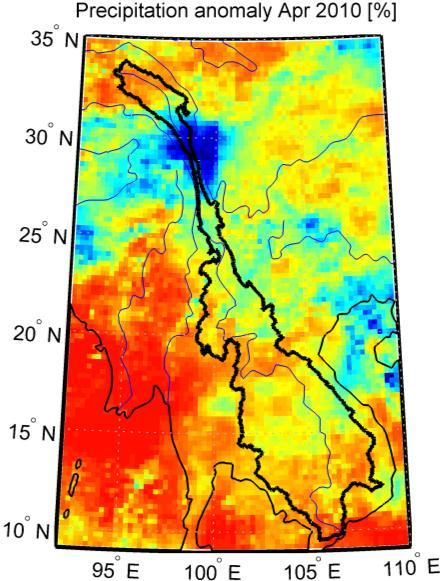
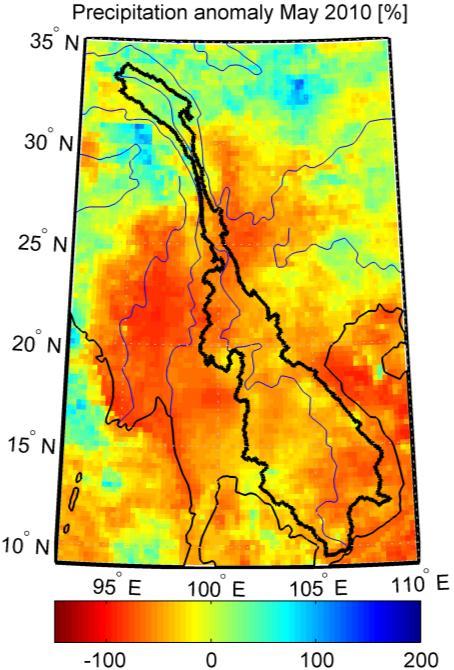
19 3 Drought Monitoring in the Mekong basin This Chapter will demonstrate some of the methods for drought monitoring as introduced in the previous Chapter. The objective is not to deliver a full drought analysis of the Mekong River Basin, but should be considered as a first introduction and demonstration of options that might be included in an operational drought monitoring initiative at MRC. 3.1 Meteorological Drought Precipitation anomalies To evaluate the anomalies of precipitation, TRMM (Tropical Rainfall Measuring Mission) daily precipitation data have been downloaded from NASA 1. This is a joint U.S.-Japan satellite mission to monitor tropical and sub-tropical precipitation and to estimate its associate latent heating. The dataset has a spatial resolution of 0.25 x 0.25 degrees. For the purpose of this study we have calculated the precipitation anomalies for September 2009 through May 2010, with respect to the average of September 2000 through May The anomalies are calculated for each month separately, and for the entire period as a whole. Figure 12 shows the precipitation anomalies for the entire period September 2009 through May The left plot represents the anomalies in mm, while the right plot shows the anomalies in percentages. Figure 12: Precipitation anomaly in mm (left) and in percentages (right) of Sep 2009 through May 2010 with respect to the same months averaged over shtml 18
20 It is noticed that the precipitation amount for September 2009 through May 2010 is below average. Especially the middle and south-eastern part of the basin show very low amounts of precipitation. These differences vary between more or less -200 and -400 mm on average in these regions. Despite these low precipitation anomalies in these regions, the anomalies in the northern and south-western part are not small. Especially the rainfall in the south-western part is above average. The figures with the anomalies per month are shown in Appendix 1. January 2010 seems to behave like average conditions, except for the wet conditions in the middle and south-eastern part of the basin. May 2010, however, shows very low precipitation anomalies. Some areas receive less than 100 mm precipitation during this month, when compared to the average situation Standardized Precipitation Index As mentioned in Section 2.2.2, the Standardized Precipitation Index (SPI) was designed to quantify the precipitation deficits for multiple time-scales. According to McKee et al. (1993) the SPI can be calculated for 3, 6, 12, 24, or 48 months, which represent typical time-scales for precipitation deficits. A disadvantage of the use of the SPI is the need of long time-series (Hayes, 1999). Guttman (1999) recommends using at least 50 years of data for drought periods of 1 year or less, and more for multi-year droughts. Other studies, however, by Hayes (2006) and Naresh Kumar et al. (2009) used shorter periods of 39-, and 30-years, respectively. For the calculation of the SPI in this study we have used the same TRMM data as used in the previous section. Unfortunately we only have a time-series of 11 years available for the calculation of the SPI. Figure 13: Example of gamma fit through 3-monthly precipitation sums for one grid cell. To verify whether or not the time-series is long enough to calculate the SPI, we have fitted a gamma distribution through the 3-monthly precipitation sums of one grid-cell within the basin 19


21 (Figure 13). It can be seen that the fit is reasonably good, except for precipitation sums between 100 and 200 mm. 20

. SPI Value Drought Category 0 to -0.")
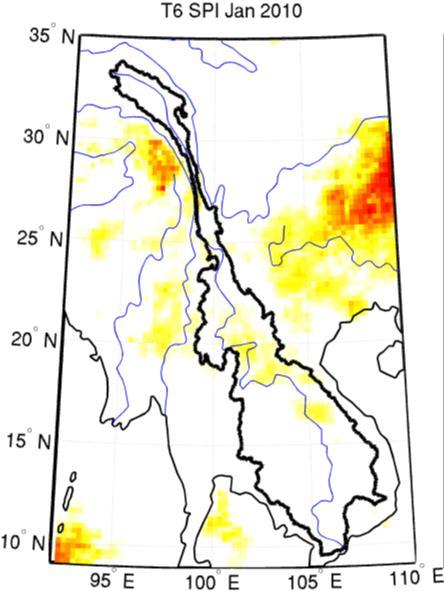
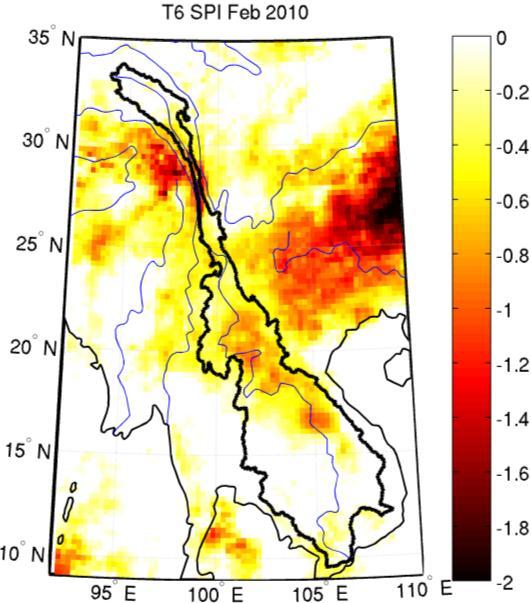
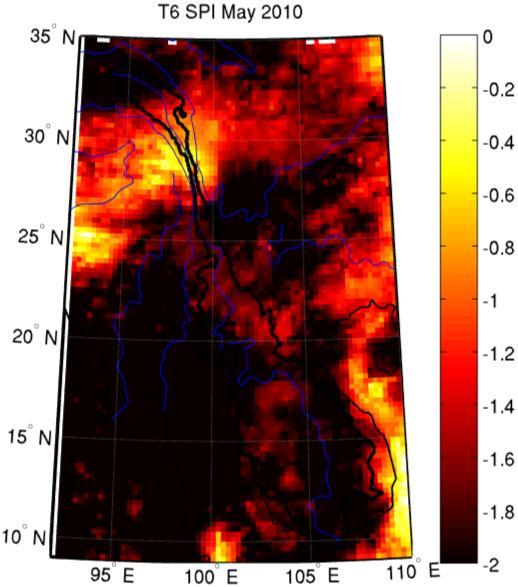
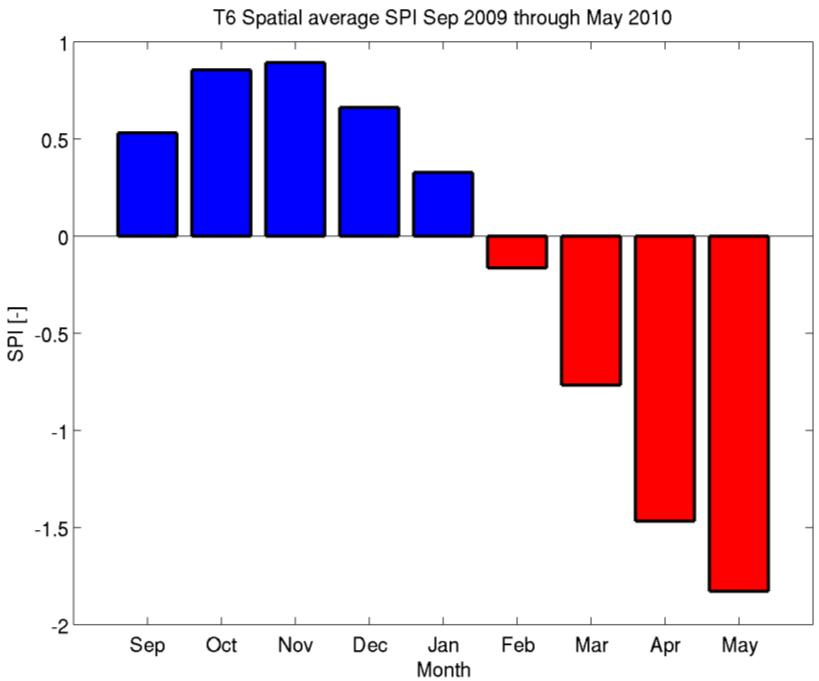
22 Figure 14: Standardized Precipitation Index (SPI) for September 2009 through May 2010 with a time scale of 3 months (T3). In this study the SPI has been calculated for time-scales of 3 and 6 months. Figure 14 shows the spatial SPI for a time-scale of three months for September 2009 through May To quantify the severity of drought, we have used the indicators from McKee et al. (1993) (Table 5). As can been seen from Figure 14, a mild drought starts in December 2009 in the middle of the basin. In January 2010 the largest part of the basin has a moderate drought. Then in February through April, the largest part of the basin is exposed to a severe or extreme drought. Table 5: SPI drought indicators (McKee et al., 1993). SPI Value Drought Category 0 to Mild drought to Moderate drought to Severe drought Extreme drought The SPIs can be averaged over the area of interest to get an idea of the areal SPI. For this study we have averaged the SPIs over the entire area and the results for the 3-monthly time- 21

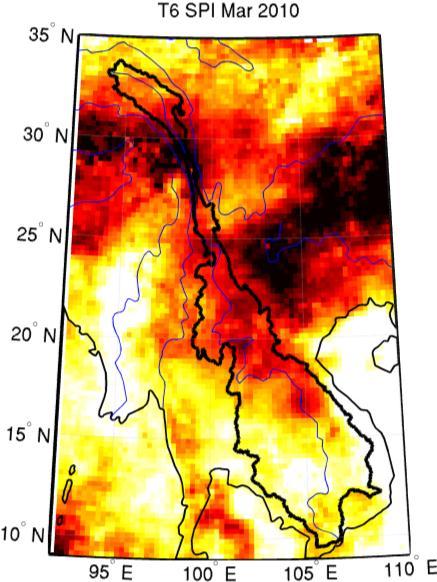
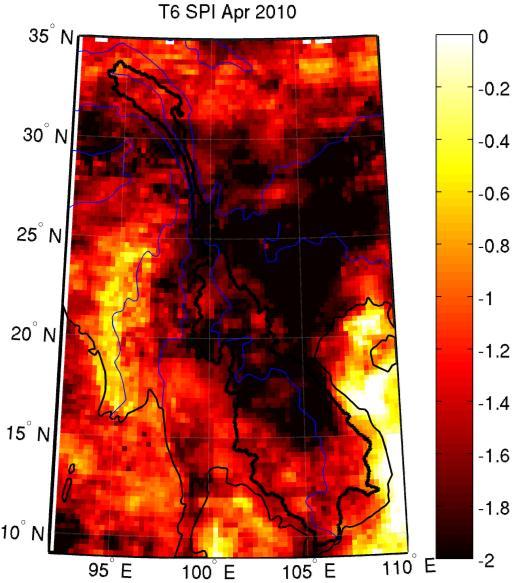
23 scale are plotted in Figure 15 for each month. From this figure we can conclude that problems start to occur from January on, with the most severe drought in March Figure 15: Spatial average SPI for September 2009 through May 2010 with a time scale of 3 months. Figures for the SPI with a 6-monthly time-scale can be found in Appendix 2. We see that the precipitation deficit starts to develop in a later stage for the 6-monthly time-scale. This is a logical result of the fact that 6-monthly sums are taken into account, so that the probability of a 6-monthly sum below the median is much smaller. Considering the spatial average 6-monthly SPI, it is noticed that a mild drought is developing in February 2010 instead of in January The severe drought is now shown during May 2010 instead of March If we consider the spatial SPI for the 6-monthly time-scales, then we see a mild drought starting to develop in January 2010 in the middle of the basin. From March onwards we notice a severe drought in the northern and centre part of the basin, while the southern part is exposed to a mild drought. Then in April there is an extreme drought in most of the basin, while the southern part suffers from a moderate to severe drought. Finally in May most of the basin is exposed to an extreme drought, while the northern part is back to a mild drought Moisture Availability Index As mentioned in Section 2.2.3, the Moisture Availability Index (MAI) is calculated by dividing the precipitation by the reference evapotranspiration. In the current study we have calculated the MAI on a monthly time-scale for September 2009 through May The evapotranspiration has been calculated using the method of Hargreaves (Hargreaves et al., 1985). To calculate the evapotranspiration the daily average, daily minimum and daily maximum temperature was needed. We used the NCEP/NCAR Reanalysis 2 data. The data are downscaled to a resolution of 0.25 degrees (same as TRMM), using spline interpolation in ArcGIS. Finally the data were aggregated to a monthly evapotranspiration and precipitation value

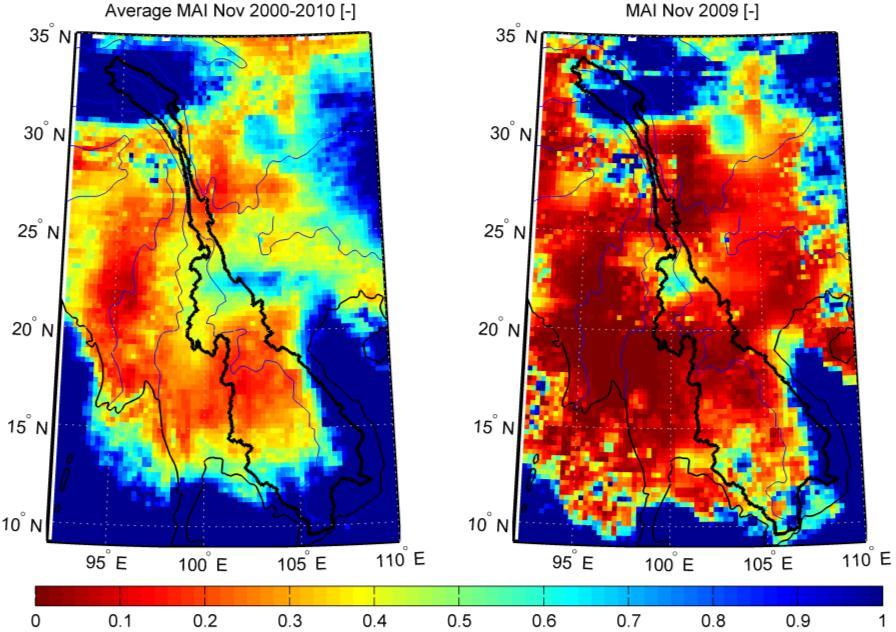
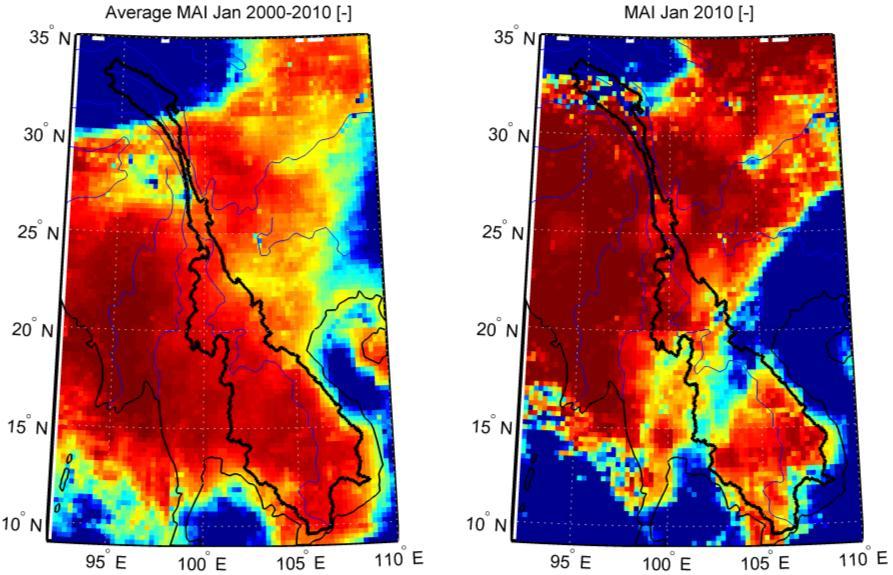
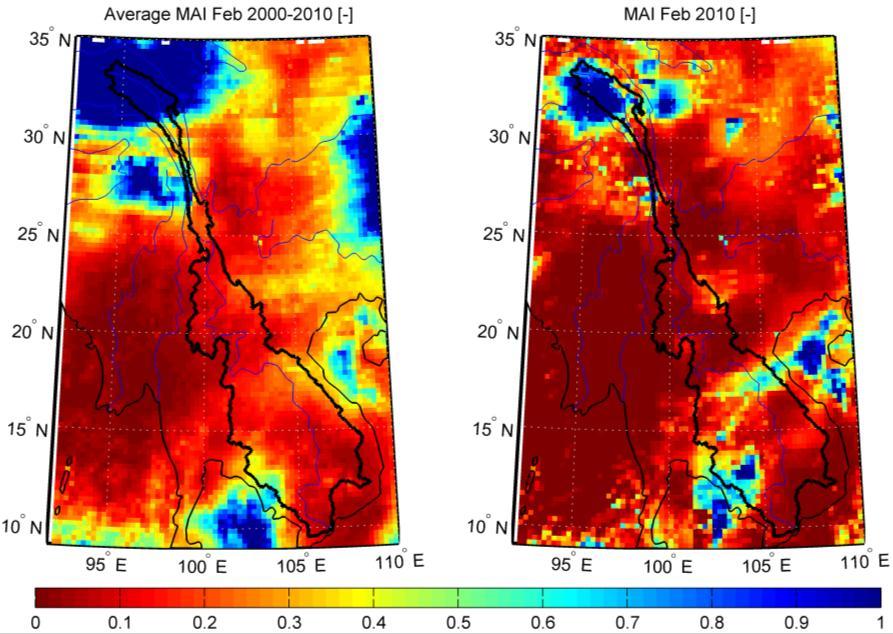
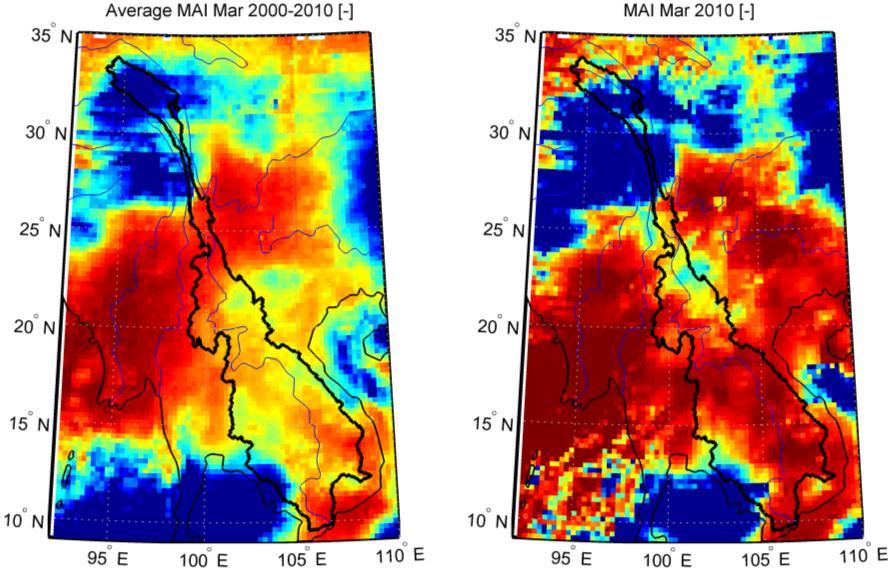
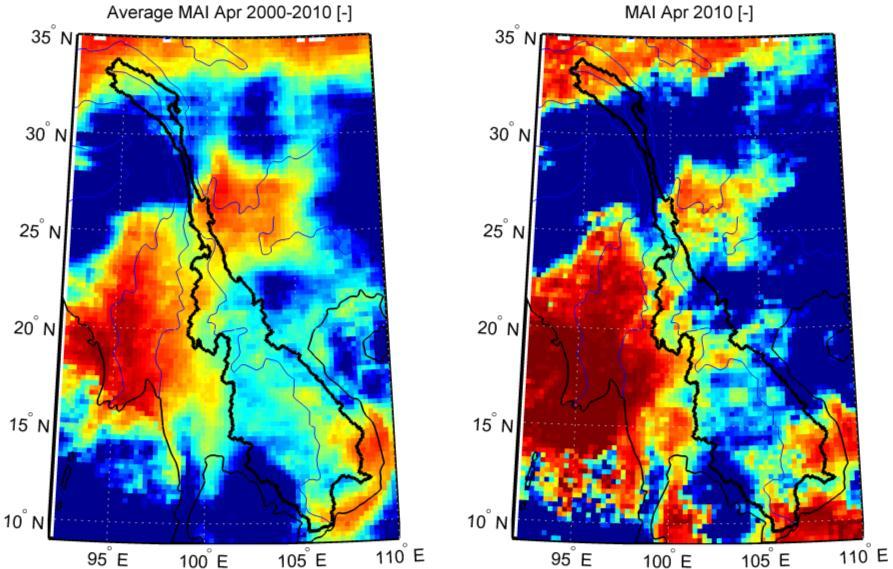
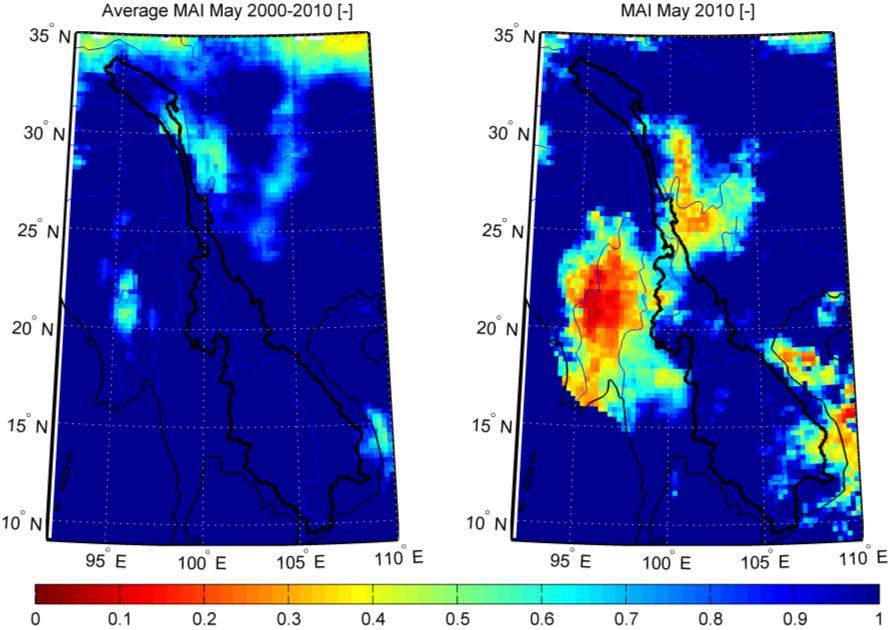
24 In the current study, the MAI was calculated for the months September 2009 through May 2010, as well as for the average of the period September 2009 through May Figure 16 shows the spatial average MAI for the entire Mekong River Basin for September 2009 through May 2010 with respect to the same months averaged over the years A MAI smaller than 1, indicates that there is more evapotranspiration than precipitation. We notice a precipitation deficit in November 2009 through April There is already a precipitation deficit for the period However, the MAI is significantly smaller in November 2009, December 2009 and February The MAI for January 2010 is larger than for the average situation. This is caused by a region in which there is above average precipitation (see Appendix 1). Figure 16: Spatial averaged Moisture Availability Index (MAI) per month for the entire Lower Mekong River Basin. The average MAI over the period Sep 2000 through May 2010 is represented with blue bars. The red bars represent the average MAI for Sep 2009 through May Figure 17 represents a spatial comparison of the average MAI for the period with the MAI for the September 2009 through May It seems that the area already has a MAI smaller than 1 for the average situation. The MAI for the average period is , while September 2009 through May 2010 show MAIs ranging from 0.3 until 0.7, with the lowest values found in the centre of the basin. The lowest MAI values can be found at the east- and west side of the basin. If we consider the individual months (see Appendix 3), then we notice that small MAIs start to develop in September 2009 in the northern part of the basin. This pattern then extends from the northern to the middle part of the basin in October Then from November 2009 through February 2010, most of the basin is exposed to MAIs ranging from 0 to 0.2. In March 2010 the MAIs remain low throughout the largest part of the basin, while the MAIs in the upstream part are increasing. April 2010 seems to have MAI larger than the average situation, except for the most south-, south-western part. 23
 is a quantitative measure for the photosynthetic activity in a specific region.")
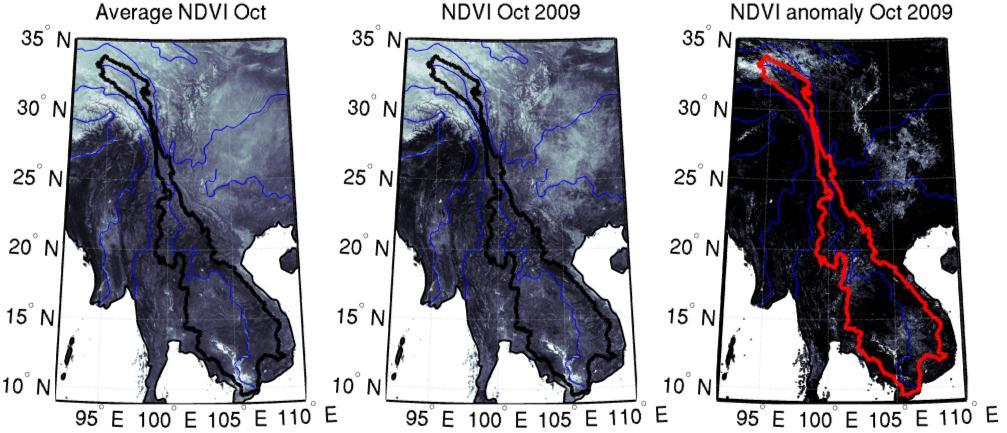
25 Figure 17: Average MAI for the entire period Sep 2000 through May 2010 (left), and for Sep 2009 through May 2010 (right). 3.2 Agricultural Drought Normalized Difference Vegetation Index As was mentioned in Section 2.3.1, the Normalized Difference Vegetation Index (NDVI) is a quantitative measure for the photosynthetic activity in a specific region. It is a value between zero and one, where a higher value (close to one) corresponds to a larger photosynthetic activity than a lower value (close to zero). The NDVI was calculated by the VEGETATION program 3, which is a joint program of Belgium, the European Commission, France, Italy, and Sweden. They use an earth observation sensor on board of the SPOT satellite. The NDVI ( was made available for south-east Asia on a spatial resolution of degrees, which is approximately 1 km. For this study we have used the NDVI from September 1999 through May For each month the NDVI has been averaged over the period Then each month of the period September 2009 through May 2010 is compared with the average for that month, to calculate the anomaly for that month. Results of this analysis are shown in Figure 18 for April The results for the remaining months are shown in Appendix 4. It seems that during April 2010 there is slightly less photosynthetic activity in some parts of the basin. The photosynthetic activity is already reasonably small for the average situation for April. Therefore the effects for April 2010 are neglectable. Except for September and October, all remaining months hardly show any difference with the average situation for that month. In Appendix 4 it is shown that during September and October 2010 there is less photosynthetic activity in the south-eastern part of

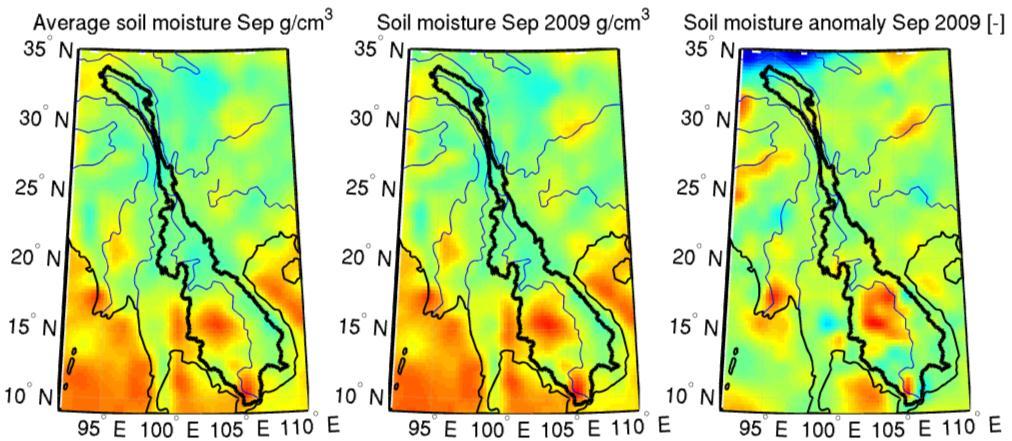
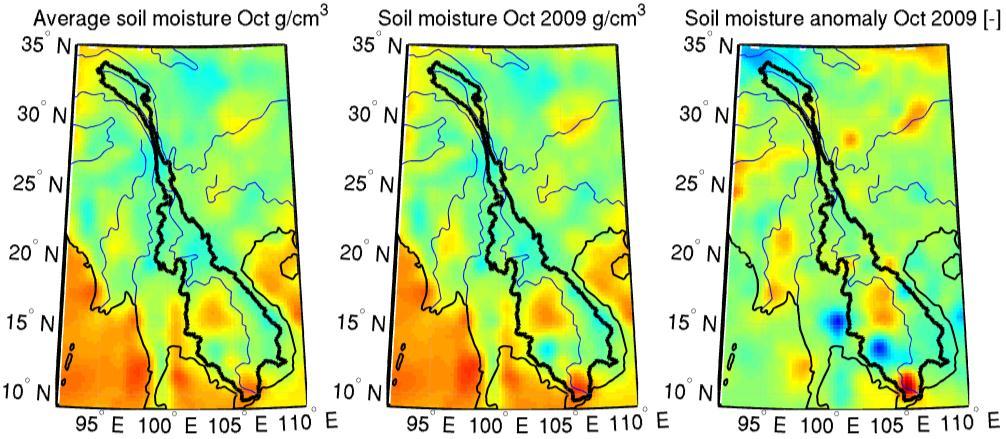
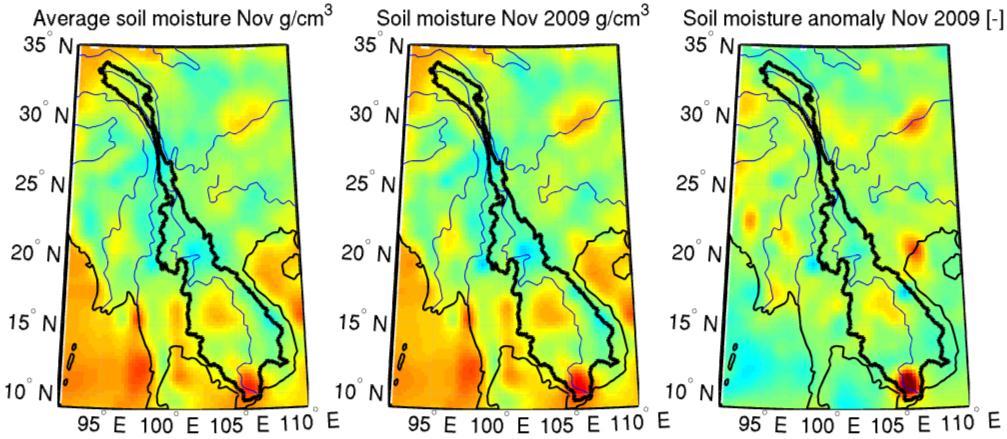
26 the basin. For October this can partly be explained by the fact that there is less than average rainfall in this region. Figure 18: NDVI for April. The left plot represents the average NDVI for The middle plot represents the NDVI of April The left plot represents the anomaly between the second and third plot (source: Soil moisture deficits In the current study, soil moisture deficits are calculated using the anomalies between the soil moisture content of the month of interest, and the average for that month over the period For the soil moisture data we used the AMSR-E/Aqua level 3 global monthly Surface Soil Moisture Averages 4, with a spatial resolution of 1.00 degree. The data was published by the Goddard Earth Science Data and Information Services Center (GES DISC)

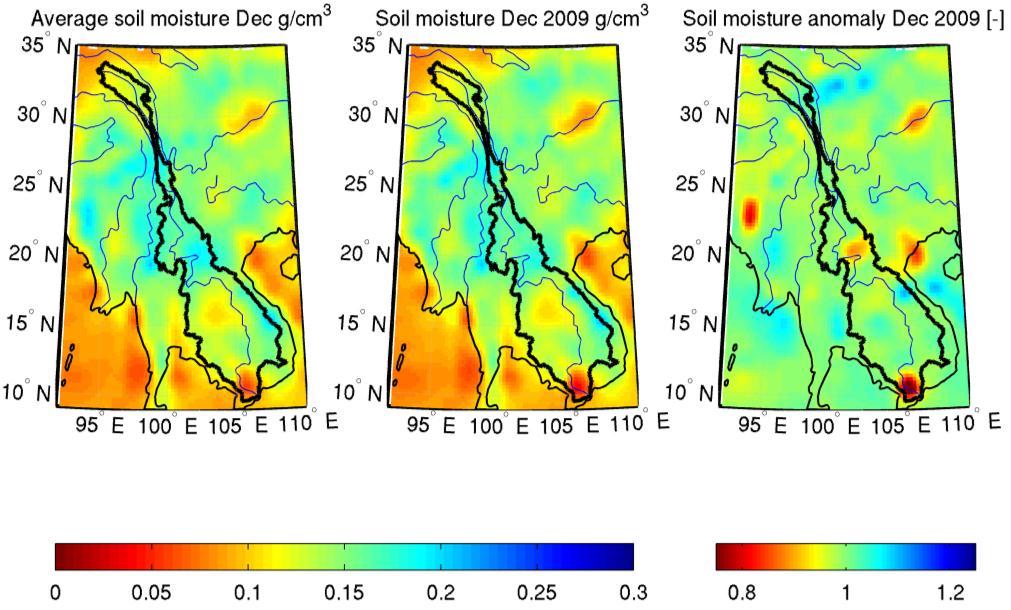
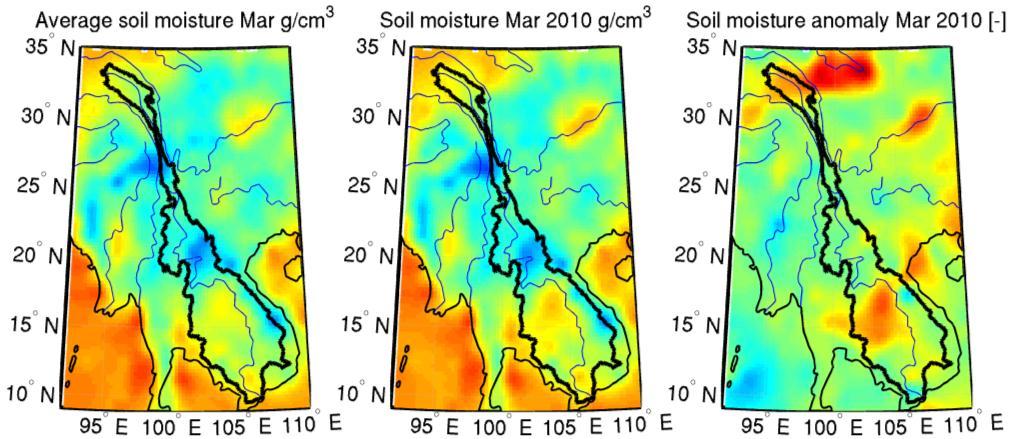
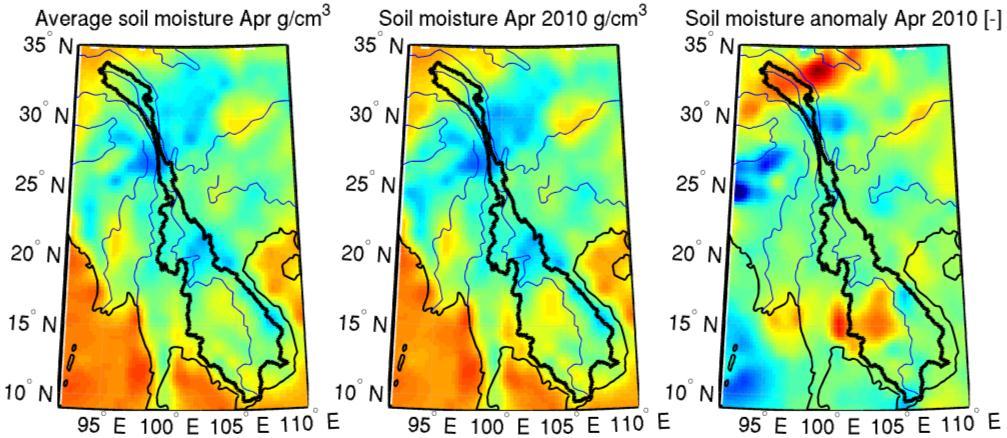
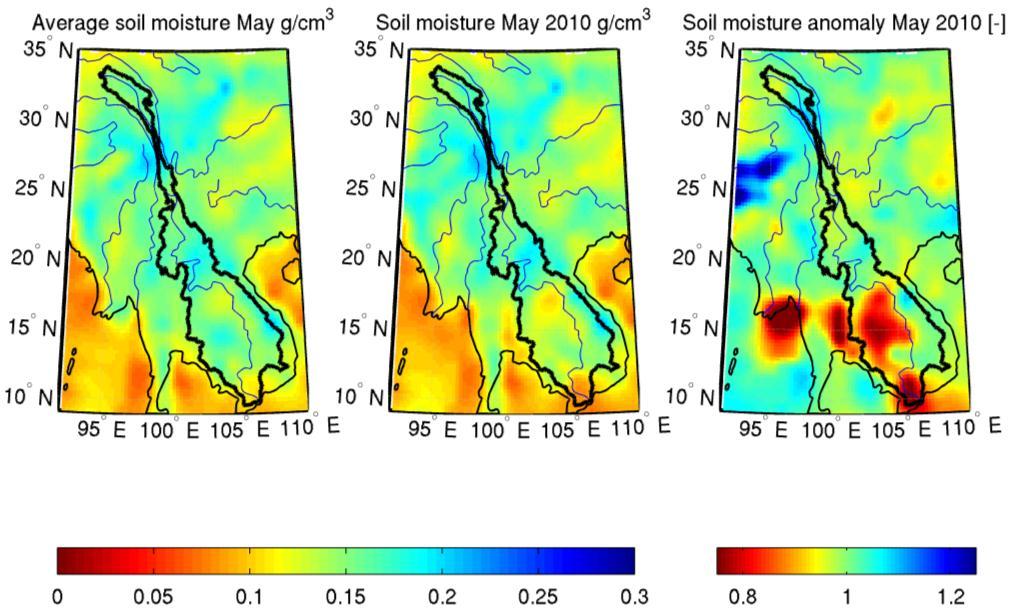
27 Figure 19: Average soil moisture for May (left), soil moisture in May 2010 (middle), and soil moisture anomaly for May 2010 (right). Units are g/cm 3 for the left and middle plot. For the current study we downscaled the monthly soil moisture data to a spatial resolution of 0.25 degrees, using spline-interpolation in ArcGIS. Figure 19 shows the soil moisture conditions for May. The left plot shows the average soil moisture content for May during , the middle plot represents the soil moisture content for May 2010, and the right plot is the anomaly between the latter two. It needs to be mentioned that for the data above the oceans are not correct and irrelevant. This is due to the fact that in the original data these areas had missing values. For February 2010 no data was available, so this is left out of the analysis. Figures for the remaining months can be found in Appendix 5. It is shown in Figure 19 that the soil moisture during May 2010 is below average in the South and south-western part of the basin. This is partly related to the low precipitation anomaly. According to the Standardized Precipitation Index (SPI) with 6-monthly time-scale, the largest part of the basin is exposed to an extreme drought during May This period of extreme drought is reflected in the low soil moisture anomaly, which seems to be most sensitive in the south and south-western part of the basin. The lower soil moisture conditions during May 2010 have a negative effect on the growth of vegetation. This was shown with the below average NDVI in this region (Figure 18). The soil moisture deficit in this region already starts to develop in March 2010 (Appendix 5). Finally, anomalies for soil moisture are low in the southern part from September 2009 through January Hydrological Drought Stream flow Monthly streamflow data are used to compare the discharge from September 2009 through May 2010 with the average discharge from September 2000 through May These data were made available by the MRC for a couple of stations throughout the basin. Figure 20 compares the average monthly discharge for September 2009 through May 2010 with the average for those months over the period
28 27
29 Figure 20: Average monthly discharges for a couple of discharge measurement stations throughout the basin. The plots are ordered from upstream to downstream. From this figure it is clear that the discharge for the period of interest is below average for all stations during all months, except for Kratie during October. This can be explained by the fact that in September and October there was above average precipitation in and upstream of Kratie. The decrease in discharge is most significant during September. For Kratie, for example, the discharge decreases with 8000 m 3 /s during this month. Low discharges during the wet season, like e.g. in September, can have negative effects on the depth and duration of wetland flow inundation, but also have an effect on the inflow of the Tonle Sap Lake Reservoirs and lakes Tonle Sap is the greatest lake in the basin, which is located in Cambodja. The European Space Agency (ESA) River & Lakes uses the ENVISAT satellite to measure water level heights in three locations in Lake Tonle Sap. The locations of these measurements can be found in Figure 21, while the measurements are shown in Figure 22. In this figure the average lake levels for the period September 2000 through May 2010 are compared with the lake levels for September 2009 through May For the first location no measurements are available for September and May. The second location does not have data for October 2009 and the third location has a gap on February If we look at the measured water level of each of these locations, then we notice hardly any difference with the average situation. We notice a small increase in water level during October, November and December, while during the remaining months the water level is equal or slightly lower than average. The water levels in the lake depend on the water levels downstream in the Mekong River. 28

30 Figure 21: Locations of 3 ENVISAT water level measurements in Lake Tonle Sap (source: European Space Agency (ESA) River & Lake 5 ). Figure 22: Water levels from Lake Tonle Sap, measured with ENVISAT 5. Locations are found in Figure 21. The closest river discharge measurement station with available data is Kratie. During October this station measures above average discharge (Figure 20). The higher discharge causes a higher water level in the Mekong River, and eventually leads to a small increase in lake water
31 level. As can be seen from Figure 20, the discharge in Kratie during January through May is slightly below average. Therefore the lake levels are hardly affected during these months. 30
32 4 Drought risk mapping in the Mekong Basin 4.1 Drought risk mapping The risk of a drought is the probability of harmful consequences, or expected losses resulting from interactions between hazards and vulnerable conditions (Shahid et al., 2008). Therefore, a conceptual approach to drought risk mapping can be broken down into a combination of the hazard and vulnerability. Similar to other natural hazard risks, drought risk depends on a combination of the physical nature of drought and the degree to which a population or activity is vulnerable to the effects of drought (Shahid et al., 2008). To study the risk of drought, therefore, it is essential to study the frequency, severity, and spatial extent of drought, as well as the socioeconomic ability of the region to anticipate and cope with the drought. As mentioned earlier, drought risk mapping can be broken into a combination of hazard and vulnerability: DRI DHI * DVI Equation 2: Calculation of the Drought Risk Index (DRI) (Blakie et al., 1994). Where: DRI = Drought Risk Index; DHI = Drought Hazard Index; DVI = Drought Vulnerability Index; 4.2 Quantification of drought risks To quantify the risk of drought in the Mekong river basin, we applied Equation 2. For this study we have defined several Drought Hazard Indexes and Drought Vulnerability Indexes: Drought Hazard Indexes: Average yearly precipitation sum October through May (HI 1 ); Coefficient of variation (CV) of yearly precipitation sums during October through May (HI 2 ); Average yearly Normalized Difference Vegetation Index (NDVI) during October through May (HI 3 ); CV of yearly NDVIs during October through May (HI 4 ); Drought Vulnerability Indexes: Population density (VI 1 ); Gross Domestic Product (GDP) per capita (VI 2 ); Land use (VI 3 ); Distance to river (VI 4 ); Drought risk mapping is performed on a spatial resolution of 0.05 degrees, which is approximately 5 km Drought Hazard Index The DHI is calculated using the four hazard indexes as defined in Section 4.2: 31
33 HI1 HI2 HI3 HI DHI 4 Equation 3: Calculation of the Drought Hazard Index (DHI). 4 The first hazard index is the average of the yearly precipitation sums during October through May. The lower the average precipitation sum is, the higher the hazard index will be. Areas which are prone to low precipitation values are more hazardous. For each grid cell, the value is scaled to a value between zero and one: HI 1 value 1 max min values values min values Equation 4: Scaling of average precipitation Hazard Index between 0 and 1. Where: value = average precipitation sum; values = all average precipitation sums in the basin; The hazard index map for the average yearly precipitation can be found in Appendix 6: Hazard Index maps. Based on this map, it can be seen that the hazard is highest in the northern part of the basin and lowest in the southern part of the basin. The second hazard index is the CV of average yearly precipitation sums, based on the period October through May. The CV is calculated by dividing the standard deviation of yearly precipitation sums by the average of yearly precipitation sums. Areas with large CV values indicate areas with a large year-to-year variation in precipitation. Therefore, a high CV indicates a high hazard. Each grid cell is again scaled between zero and one: HI 2 value max min values values min values Equation 5: Scaling of CV of precipitation Hazard Index between 0 and 1. Where: value = CV of average precipitation sums; values = all CVs of precipitation sums in the basin; The hazard index map for the CV of average precipitation sums can be found in Appendix 6: Hazard Index maps. It is shown that especially the southeastern and middle parts of the basin have the highest hazards. This means that in these regions the yearly precipitation sum during October through May can be significantly lower than the average. The third hazard index is the average of yearly NDVIs, based on the period October through May. Regions with low NDVIs indicate areas with low photosynthetic activity, thus less vegetation growth. Therefore, regions with low NDVIs are more hazardous to droughts. Each grid cell is scaled between zero and one using a similar equation as Equation 4. The hazard index map for the average NDVIs is shown in Appendix 6: Hazard Index maps. It can be noticed that the northern part of the basin has the highest NDVI hazard index. It should be taken in mind that this is a mountainous area with barely any vegetation. High hazard indexes are also found in the central and south, southwest part of the basin. The high hazard index for Lake Tonle Sap can be neglected, because this is of course an area with no vegetation at all. 32
34 The last hazard index is the CV of average yearly NDVIs. Areas with large CV values indicate areas with a large year-to-year variation in photosynthetic activity. Each grid cell is scaled between zero and one, using a similar equation as Equation 5. From the hazard index map of CVs (Appendix 6: Hazard Index maps) it can be concluded that the highest NDVI hazards are found in the northern part of the basin. In addition to this, high hazards for the NDVI are found in the south, and southwestern part of the basin, with exception of Lake Tonle Sap. Based on the four individual hazard indexes we calculate the DHI based on Equation 3. The result is a Drought Hazard Index map (Figure 23). This map shows that the drought hazard is highest in the northern and south, southeastern part of the basin. Also the central part of the basin is quite hazardous to droughts. µ Kilometers Legend DHI Figure 23: Drought Hazard Index map. A higher value corresponds to a higher hazardous area. 33
35 4.2.2 Drought Vulnerability Index The Drought Vulnerability Index (DVI) is calculated using the four indexes as defined in Section 4.2: VI 1 VI 2 VI 3 VI DVI 4 4 Equation 6: Calculation of Drought Vulnerability Index (DVI). The first vulnerability index is the population density. For the population density we used data from the Netherlands Environmental Agency 6. They have downscaled population data based on the IPCC-SRES scenarios 7. For this study we use the average population density between 2010 and Areas with high population densities are more vulnerable to droughts. For each grid cell, the population density is scaled to a value between zero and one: VI 1 value max min values values min values Equation 7: Scaling of population density between 0 and 1. Where: value = population density; values = all population densities in the basin; The vulnerability index maps are shown in Appendix 7: Vulnerability Index maps. Based on the population vulnerability index, it is noticed that vulnerabilities are largest in the central part of the basin. Besides this region, there are smaller areas with high vulnerabilities in the southern and more northern part of the basin. The second vulnerability index is the Gross Domestic Product (GDP) per capita. Again we use (downscaled) data from the Netherlands Environmental Agency. Areas with a small GDP are more vulnerable to droughts than areas with high GDPs. Therefore, for each grid cell the GDP is scaled to a value between zero and one: VI 2 value 1 max min values values min values Equation 8: Scaling of GDP between 0 and 1. Where: value = GDP per capita; values = all GDPs per capita in the basin; According to the vulnerability index of the GDP in Appendix 7: Vulnerability Index maps, the largest area of the basin is vulnerable to drought. This is logically highly correlated with areas with small population densities
36 The third vulnerability index is land use. For land use we used data from the European Space Agency 8 (ESA). In their GLOBCOVER 9 project they produced a global land cover map using the ENVISAT environmental satellite. For the purpose of this study, we have created 6 classes based on the land cover map. This map is shown in Figure 24. Land use classes with high vulnerability to drought are given a high index number. The results of this classification are shown in Table 6. The class Other involves areas covered with rock, snow/ice, or water bodies. Again these vulnerability indexes are scaled between zero and one, using a similar equation as Equation 7. The map with land use vulnerability indexes is shown in Appendix 7: Vulnerability Index maps. It can be concluded that mainly the central and southern part of the basin are highly vulnerable. These are areas with rainfed or irrigated agriculture. µ Kilometers Legend Other Grassland Nature Irrigated Rainfed agriculture Urban Figure 24: Reclassified land use classes
37 Table 6: Indexation of land use classes, based on their vulnerability to droughts. Land use Urban 5 Rainfed agriculture 4 Irrigated 3 Nature 2 Grassland 1 Other 0 Index The final drought vulnerability index is distance to the river. Areas on a long distance from the river are more dependent on precipitation, and thus more vulnerable to drought, than areas which are located on a short distance from the river. Distances from the river are also scaled between zero and one, using a similar equation as Equation 7. The resulting vulnerability index map is shown in Appendix 7: Vulnerability Index maps. Based on the four drought vulnerability indexes, we calculate the Drought Vulnerability Index (DVI) using Equation 6. The resulting Drought Vulnerability Index map is shown in Figure 25. Based on Figure 25 we conclude that the vulnerability is largest in the central and southern part of the basin. This is mainly caused by the rainfed and irrigated agriculture, and high population densities in these regions Drought Risk Index The DRI is calculated by multiplying the DHI (Figure 23) by the DVI (Figure 25). The DRI map is shown in Figure 26. The classes are derived using the natural break method in ArcMap. It can be concluded that drought risks are largest in the central and south, southeastern part of the basin. The drought risk in the northern part is high due to the large hazard index in this area. Especially the high hazard index for average precipitation and NDVI are high in this region. 36
38 µ Kilometers Legend DVI Figure 25: Drought Vulnerability Index map. A higher value corresponds with higher drought vulnerability. 37
39 µ Kilometers Legend DRI Low Moderate High Very high Figure 26: Drought Risk Index map. 38
40 5 Conclusions and recommendations The Mekong River Commission started to discuss on a drought management initiative already in The severe drought from demonstrated once again the importance of the issue for people and the environment in the Mekong River Basin. It was therefore decided to place drought again higher on the agenda, all in agreement with the Draft Strategic Plan It was also decided that a full program would not be the most efficient way in dealing with the topic and it was agreed to develop a Drought Management Initiative (DMI). This technical report introduces and demonstrates components that can be used for a full drought monitoring and impact assessment program, similar to the flood forecasting centre in Phnom Penn. This report made it very clear that there is however a huge difference between flood and drought. The main issues raised are: Impact of drought is of the same magnitude or even higher compared to the impact of floods. Procedures set in place for flood management cannot be transferred directly for drought management. Drought assessment and alleviation is far more complex than flooding. Climate change will increase drought substantially. Floods provide many positive services; drought not. Drought is a trans-boundary and basin-wide issue. A framework and associated analysis tools were introduced and demonstrated for the drought in this report. It is clear that by using a mixture of observations, most of these based on readily available satellite information, will support a drought management program. This framework, revered to as Drought Monitoring and Impact Assessment Toolbox (DMIAT) is flexible and can be tailor-made to the need of the user. Moreover, it is very clear that, by the nature of the observations, a drought assessment and analysis program is not extremely complex or costly. Moreover, since droughts develop gradually, early warning and support planning can be done effectively. The objective of this study was not to develop a complete framework for drought, but only to demonstrate some of the highlights using the drought as typical example. The Drought Monitoring and Impact Assessment Toolbox (DMIAT) as demonstrated here could form the base for the Mekong River Commission to support the countries in a better preparedness to drought. Further development and refinement of DMIAT, based on the analysis presented here, should be explored. 39
41 6 References Adamson, P and J. Bird (2010). The Mekong - A drought prone tropical environment? MRC Paper. Blaikie P.M., T. Cannon, I. Davis, B. Wisner and P. Blaikie At risk: natural hazards, people s vulnerability, and disasters. Routledge, New York. Edwards, D.C.; and T. B. McKee Characteristics of 20th century drought in the United States at multiple time scales. Climatology Report Number 97 2, Colorado State University, Fort Collins, Colorado. Guttman, N.B Accepting the Standardized Precipitation Index: A calculation algorithm. Journal of the American Water Resource Association, 35, Hargreaves G.H. and Keller. A.A., Global Mapping of the Moisture Availability Index: Using the World Water and Climate Atlas ASCE Conf. Proc. 173, 533 (2005), DOI: /40792(173)533 Hargreaves, G. and Z. Samani Reference Crop Evapotranspiration from Temperature Applied Engineering in Agriculture. 1. (2). pp Hayes, M.J Drought Indices. drought/indices1.pdf, viewed on National Drought Mitigation Center. Hayes, M.J What is Drought?: Drought indices. Immerzeel, W.W., R. A. Quiroz, and S. M. De Jong International Journal of Remote Sensing. 26(11). pp Keyantash, J.A and J. A Dracup (2004). An aggregated drought index: Assessing drought severity based on fluctuations in the hydrological cycle and surface water storage. Water Resources Research. 40 (9). Paper Number W McKee, T.B.; N.J. Doesken; and J. Kleist The relationship of drought frequency and duration to time scales. Preprints, 8th Conference on Applied Climatology, pp January 17 22, Anaheim, California. Naresh Kumar, M., Murthy, C.S., Sesha Sai, M.V.R., & Roy, P.S On the use of Standardized Precipitation Index (SPI) for drought intensity assessment. Meteorological applications, 16, Prince, S.D A model of regional primary production for use with coarse-resolution satellite data. International Journal of Remote Sensing. 12. pp Shahid S. and H. Behrawan Drought risk assessment in the western part of Bangladesh. 46. pp DOI: /s Tucker, C.J Red and photographic infrared linear combination for monitoring vegetation. Remote Sensing of Environment. 8. pp Wilhite D,A and M.H Glantz. (1985). Understanding the drought phenomenon: The role of definitions. Water International. 10. (3). pp Willeke, G., J.R.M. Hosking, J.R. Wallis, and N.B. Guttman The National Drought Atlas. Institute for Water Resources Report 94 NDS 4, U.S. Army Corps of Engineers. 40

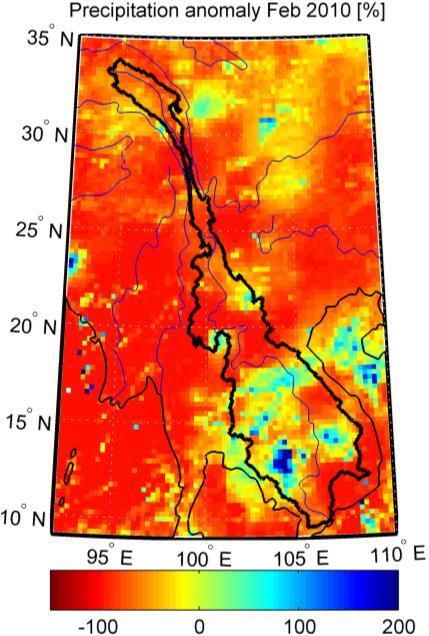
42 Appendix 1: Precipitation anomalies 41
43 42

 for 6-monthly")
44 Appendix 2: Standardized Precipitation Index (SPI) for 6-monthly time-scale 43
45 44
46 45

47 Appendix 3: Moisture Availability Index 46
48 47
49 48
50 Appendix 4: Normalized Difference Vegetation Index (NDVI) 49
51 50
52 51
53 Appendix 5: Soil moisture maps 52
54 53
55 54
GEO-DRI Drought Monitoring Workshop, May 10-11, 2010, Winnipeg, Manitoba Drought in Southeast Asia
 GEO-DRI Drought Monitoring Workshop, May 10-11, 2010, Winnipeg, Manitoba Drought in Southeast Asia Orn-uma Polpanich Stockholm Environment Institute Asia Bangkok, Thailand Southeast Asia Is located on
GEO-DRI Drought Monitoring Workshop, May 10-11, 2010, Winnipeg, Manitoba. Drought in Southeast Asia
 GEO-DRI Drought Monitoring Workshop, May 10-11, 2010, Winnipeg, Manitoba Drought in Southeast Asia Climate change, drought, agriculture and economics was caused by an early end to the monsoon season coupled
The Flow of the Mekong
 MRC Management Information booklet series No. 2 The Flow of the Mekong November 2009 Meeting the needs, keeping the balance INTRODUCTION Integrated basin flow management (IBFM) is designed to provide information
Mekong River Basin Water Resources Assessment: Impacts of Climate Change
 Mekong River Basin Water Resources Assessment: Impacts of Climate Change Judy Eastham, Freddie Mpelasoka, Mohammed Mainuddin, Catherine Ticehurst, Peter Dyce, Geoff Hodgson, Riasat Ali and Mac Kirby. August
Climate Change and Adaptation in Asia: Key Findings of the IPCC 5 th Assessment Report
 1 Climate Change and Adaptation in Asia: Key Findings of the IPCC 5 th Assessment Report Juan M. Pulhin, Professor and Dean College of Forestry and Natural Resources University of the Philippines Los Baños
The Fourth Assessment of the Intergovernmental
 Hydrologic Characterization of the Koshi Basin and the Impact of Climate Change Luna Bharati, Pabitra Gurung and Priyantha Jayakody Luna Bharati Pabitra Gurung Priyantha Jayakody Abstract: Assessment of
A Risky Climate for Southern African Hydro: Assessing hydrological risks and consequences for Zambezi River Basin dams
 A Risky Climate for Southern African Hydro: Assessing hydrological risks and consequences for Zambezi River Basin dams Executive summary Africa is highly vulnerable to the impacts of climate change. Numerous
Drought Situations and Management in Vietnam
 Drought Situations and Management in Vietnam Background: In Vietnam, drought is one of the most frequent natural disasters, only after flood and storm, and has been becoming more severe due to the impact
CHAPTER FIVE Runoff. Engineering Hydrology (ECIV 4323) Instructors: Dr. Yunes Mogheir Dr. Ramadan Al Khatib. Overland flow interflow
 Instructors: Dr. Yunes Mogheir Dr. Ramadan Al Khatib. Overland flow interflow") Engineering Hydrology (ECIV 4323) CHAPTER FIVE Runoff Instructors: Dr. Yunes Mogheir Dr. Ramadan Al Khatib Overland flow interflow Base flow Saturated overland flow ١ ٢ 5.1 Introduction To Runoff Runoff
Engineering Hydrology (ECIV 4323) CHAPTER FIVE Runoff Instructors: Dr. Yunes Mogheir Dr. Ramadan Al Khatib Overland flow interflow Base flow Saturated overland flow ١ ٢ 5.1 Introduction To Runoff Runoff
Issues include coverage gaps, delays, measurement continuity and consistency, data format and QC, political restrictions
 Satellite-based Estimates of Groundwater Depletion, Ph.D. Chief, Hydrological Sciences Laboratory NASA Goddard Space Flight Center Greenbelt, MD Groundwater Monitoring Inadequacy of Surface Observations
Application of a Basin Scale Hydrological Model for Characterizing flow and Drought Trend
 Application of a Basin Scale Hydrological Model for Characterizing flow and Drought Trend 20 July 2012 International SWAT conference, Delhi INDIA TIPAPORN HOMDEE 1 Ph.D candidate Prof. KOBKIAT PONGPUT
Climate change science, knowledge and impacts on water resources in South Asia
 Climate change science, knowledge and impacts on water resources in South Asia DIAGNOSTIC PAPER 1 GUILLAUME LACOMBE, PENNAN CHINNASAMY Regional Conference on Risks and Solutions: Adaptation Frameworks
Module 9 (L35 L37): Drought Management : Drought assessment and classification, drought. 36 Drought Analysis
: Drought Management : Drought assessment and classification, drought. 36 Drought Analysis") Module 9 (L35 L37): Drought Management : Drought assessment and classification, drought analysis techniques, drought mitigation planning. 36 Drought Analysis 1 1 L36 L36 Drought Analysis Topics Covered
Module 9 (L35 L37): Drought Management : Drought assessment and classification, drought analysis techniques, drought mitigation planning. 36 Drought Analysis 1 1 L36 L36 Drought Analysis Topics Covered
EVALUATION OF HYDROLOGIC AND WATER RESOURCES RESPONSE TO METEOROLOGICAL DROUGHT IN THESSALY, GREECE
 EVALUATION OF HYDROLOGIC AND WATER RESOURCES RESPONSE TO METEOROLOGICAL DROUGHT IN THESSALY, GREECE A. LOUKAS*, AND L. VASILIADES Laboratory of Hydrology and Water Systems Analysis,, Volos, Greece *E-mail:
Comparison of climate change impacts and development effects on future Mekong flow regime
 9th International Congress on Environmental Modelling and Software Brigham Young University BYU ScholarsArchive 5th International Congress on Environmental Modelling and Software - Ottawa, Ontario, Canada
NATIONAL INDICATIVE PLAN
 Viet Nam National Mekong Committee NATIONAL INDICATIVE PLAN TO IMPLEMENT THE IWRM-BASED BASIN DEVELOPMENT STRATEGY OF THE MEKONG RIVER COMMISSION Hanoi, August 2012 CONTENT Foreword Executive Summary Glossary
Impacts of Drought in the e Philippines
 Department of Science and Technology Department of Science and Technology Philippine Atmospheric, Geophysical and Astronomical Services Administration Impacts of Drought in the e Philippines by Rosalina
CLIMATE INFORMATION IN HAZARD RISK ASSESSMENT JANNEKE ETTEMA, VICTOR JETTEN, DINAND ALKEMA, THEA TURKINGTON
 CLIMATE INFORMATION IN HAZARD RISK ASSESSMENT JANNEKE ETTEMA, VICTOR JETTEN, DINAND ALKEMA, THEA TURKINGTON FIRE ENSCHEDE - YESTERDAY On fire ~100 m ITC building Short rain event made the wind direction
Sustainable Development 6 and Ecosystem Services
 Sustainable Development 6 and Ecosystem Services 6 28 On Target for People and Planet: Setting and Achieving Water-related Sustainable Development Goals Sustainable Development and Ecosystem Services Lead
Climate change and groundwater resources in Lao PDR
 Journal of Groundwater Science and Engineering Vol.5 Vol.4 No.1 No.2 Mar. Jun. 2016 2017 Climate change and groundwater resources in Lao PDR Khongsab Somphone 1*, OunakoneKone Xayviliya 1 1 Division of
New Zealand Drought Index and Drought Monitor Framework
 New Zealand Drought Index and Drought Monitor Framework Contents Executive summary... 2 1 Introduction... 3 2 Elements of International Drought Monitors... 3 3 The water balance model... 3 3.1 Potential
CLIMATE CHANGE AND FLOOD RISK IN THE MEKONG DELTA ADAPTATION AND COEXISTENCE IN FLOOD-PRONE RICE AREA
 CLIMATE CHANGE AND FLOOD RISK IN THE MEKONG DELTA ADAPTATION AND COEXISTENCE IN FLOOD-PRONE RICE AREA Hideto Fujii Japan International Research Center for Agricultural Sciences 1-1 Ohwashi, Tsukuba, Ibaraki
Predicting Unmet Irrigation Demands due to Climate Change An integrated Approach in WEAP
 Predicting Unmet Irrigation Demands due to Climate Change An integrated Approach in WEAP Marc Haering Emad Al-Karablieh, Amer Salman University of Jordan G-Wadi International Session 5: Risks Assessment
Middle-East and Northern Africa Water Outlook
 Middle-East and Northern Africa Water Outlook April 2011 Commissioned by World Bank World Bank Task Leader Bekele Debele Negewo Authors Walter Immerzeel Peter Droogers Wilco Terink Jippe Hoogeveen Petra
Hydrology and Water Management. Dr. Mujahid Khan, UET Peshawar
 Hydrology and Water Management Dr. Mujahid Khan, UET Peshawar Course Outline Hydrologic Cycle and its Processes Water Balance Approach Estimation and Analysis of Precipitation Data Infiltration and Runoff
CLIMATE CHANGE EFFECTS ON THE WATER BALANCE IN THE FULDA CATCHMENT, GERMANY, DURING THE 21 ST CENTURY
 CLIMATE CHANGE EFFECTS ON THE WATER BALANCE IN THE FULDA CATCHMENT, GERMANY, DURING THE 21 ST CENTURY Manfred Koch and Gabriel Fink Department of Geohydraulics and Engineering Hydrology, University of
Climate Change: Scientific basis and risks for the finance sector
 Climate Change: Scientific basis and risks for the finance sector P. Hadjinicolaou 1,2 and C. Zerefos 1,3 1 Lab. of Climatology and Atmospheric Environment, University of Athens 2 Frederick Institute of
NBI strategic water resources analysis Phase I findings
 NBI strategic water resources analysis Phase I findings Abdulkarim H Seid NBI Secretariat The NBI Strategic Water Resources Analysis Key question: how to meet demands for water, food and energy upstream
Temperature extremes, moisture deficiency and their impacts on dryland agriculture in Gujarat, India
 Drought: Research and Science-Policy Interfacing Andreu et al. (Eds) 2015 Taylor & Francis Group, London, ISBN 978-1-138-02779-4 Temperature extremes, moisture deficiency and their impacts on dryland agriculture
Report of the Mekong River Commission **
 Distr.: General 25 April 2017 English only Economic and Social Commission for Asia and the Pacific Seventy-third session Bangkok, 15-19 May 2017 Item 3 (d) of the provisional agenda * Review of issues
Chapter 13 of Agenda 21
 Chapter 13 of Agenda 21 What is Agenda 21? Agenda 21 is the global plan of action that was adopted at the United Nations Conference on Environment and Development (UNCED) held in Rio de Janeiro, Brazil,
Operational products for crop monitoring. Hervé Kerdiles, JRC MARS
 Operational products for crop monitoring Hervé Kerdiles, JRC MARS Outline Meteo products Rainfall, temperature, global radiation, ETa, snow depth Biomass indicators & crop yield prediction NDVI & other
The paper was presented at FORTROP, during November 2008, Kasetsart University BKK, Thailand. Climate Change Impact on Forest Area in Thailand
 The paper was presented at FORTROP, during 17-19 November 2008, Kasetsart University BKK, Thailand Climate Change Impact on Forest Area in Thailand Nathsuda Pumijumnong 1 and Jassada Techamahasaranont
Remotely-Sensed Fire Danger Rating System to Support Forest/Land Fire Management in Indonesia
 Remotely-Sensed Fire Danger Rating System to Support Forest/Land Fire Management in Indonesia Orbita Roswintiarti Indonesian National Institute of Aeronautics and Space (LAPAN) SE Asia Regional Research
Nick van de Giesen, Jens Liebe, Marc Andreini, and Tammo Steenhuis (2004), Use of small reservoirs in West Africa as remotely-sensed cumulative
, Use of small reservoirs in West Africa as remotely-sensed cumulative") Nick van de Giesen, Jens Liebe, Marc Andreini, and Tammo Steenhuis (2004), Use of small reservoirs in West Africa as remotely-sensed cumulative runoff gauges, in Proceedings of the 2 nd international CAH-
Nick van de Giesen, Jens Liebe, Marc Andreini, and Tammo Steenhuis (2004), Use of small reservoirs in West Africa as remotely-sensed cumulative runoff gauges, in Proceedings of the 2 nd international CAH-
Lecture 9A: Drainage Basins
 GEOG415 Lecture 9A: Drainage Basins 9-1 Drainage basin (watershed, catchment) -Drains surfacewater to a common outlet Drainage divide - how is it defined? Scale effects? - Represents a hydrologic cycle
Estimating Agricultural Water Consumption impacts on water level fluctuations of Urmia Lake, Iran
 Estimating Agricultural Water Consumption impacts on water level fluctuations of Urmia Lake, Iran Leila Eamen 1 and A. B. Dariane* 2 1. MSc. Student, Dept. of Civil Eng., K.N. Toosi Univ. of Tech. 2. Associate
The Drought Severity Index and the recollection of drought by agriculturalists in the Palliser Triangle, southwestern Manitoba
 Prairie Perspectives 39 The Drought Severity Index and the recollection of drought by agriculturalists in the Palliser Triangle, southwestern Manitoba R.A. McGinn and G.J. Byrant Brandon University Abstract:
Hydrological Feedbacks in Tropical African Wetlands
 Hydrological Feedbacks in Tropical African Wetlands Simon Dadson University of Oxford (simon.dadson@ouce.ox.ac.uk) Key challenges Linking across scales: can we predict the hydrological response to climate
SECRETARIAT OF THE CONVENTION TO COMBAT DESERTIFICATION SECRETARIAT DE LA CONVENTION SUR LA LUTTE CONTRE LA DESERTIFICATION
 in arid, semi-arid and dry sub-humid areas resulting from various factors (Cf. the UNCCD); refers to Long-term loss of ecosystem function and productivity caused by disturbances from which the land cannot
Event and Continuous Hydrological Modeling with HEC- HMS: A Review Study
 Event and Continuous Hydrological Modeling with HEC- HMS: A Review Study Sonu Duhan *, Mohit Kumar # * M.E (Water Resources Engineering) Civil Engineering Student, PEC University Of Technology, Chandigarh,
Vulnerability in Southeast Asia
 Mapping Climate Change Vulnerability in Southeast Asia Its relevance and application at the local level Arief Anshory Yusuf y EEPSEA/Padjadjaran University The mapping in a nutshell Quantify the climate
Climate Change Impact on Pastures and Livestock Systems in Kyrgyzstan
 July 2013 Climate Change Impact on Pastures and Livestock Systems in Kyrgyzstan Summary report S U M M AR Y R E P O R T 1. INTRODUCTION The Kyrgyz government with the support of IFAD is currently designing
ISPRS Archives XXXVIII-8/W3 Workshop Proceedings: Impact of Climate Change on Agriculture
 IMPACT ANALYSIS OF CLIMATE CHANGE ON DIFFERENT CROPS IN GUJARAT, INDIA Vyas Pandey, H.R. Patel and B.I. Karande Department of Agricultural Meteorology, Anand Agricultural University, Anand-388 110, India
Title Action Plan toward Effective Flood Hazard Mapping in My Country
 Title Action Plan toward Effective Flood Hazard Mapping in My Country JICA region focused training course on flood hazard mapping Sep 2006 LAI TUAN ANH Division of Geodesy Department of Planning and Management
Some aspects of the sediment transit on the Mekong river in relation with hydropower development
 Some aspects of the sediment transit on the Mekong river in relation with hydropower development Daniel Loudière Société Hydrotechnique de France A presentation in three parts - the situation when starting
NATIONAL AND REGIONAL IMPACTS OF CLIMATE CHANGE ON THE INDIAN ECONOMY
 NATIONAL AND REGIONAL IMPACTS OF CLIMATE CHANGE ON THE INDIAN ECONOMY PARTHA SEN and SHREEKANT GUPTA Delhi School of Economics University of Delhi sgupta@econdse.org Climate Change and Developing Countries
HYDROLOGY, IRRIGATION DEMAND AND SUPPLY: AN INTEGRATED MODELLING APPROACH USING MATLAB
 HYDROLOGY, IRRIGATION DEMAND AND SUPPLY: AN INTEGRATED MODELLING APPROACH USING MATLAB B.Veendrick and N.F.D. Ward (Pattle Delamore Partners Ltd ) ABSTRACT The environmental effects and performance of
Simulation of Climate Change Impact on Runoff Using Rainfall Scenarios that Consider Daily Patterns of Change from GCMs
 Simulation of Climate Change Impact on Runoff Using Rainfall Scenarios that Consider Daily Patterns of Change from GCMs F.H.S. Chiew a,b, T.I. Harrold c, L. Siriwardena b, R.N. Jones d and R. Srikanthan
Hydro-climatic modelling workshop UNSW - MDB Water policy challenges and innovation
 Hydro-climatic modelling workshop UNSW - MDB Water policy challenges and innovation Presenter: Jason Alexandra Director Water Policy Coordination April 2009 Overview 1. Background 2. Challenges 3. Brief
Climate Change and Sustainable Development in Botswana
 Session : Adaptation and Development Climate Change and Sustainable Development in Botswana Opha Pauline Dube University of Botswana Climate change is the strongest signal ever that the global economic
Climate Change, Water and Security in the Mediterranean implications for science and policy (a perspective from the CLIMB project)
") Climate Change, Water and Security in the Mediterranean implications for science and policy (a perspective from the CLIMB project) 4th International Conference 25-26 November 2013, Cádiz Ralf Ludwig &
Climate Change, Water and Security in the Mediterranean implications for science and policy (a perspective from the CLIMB project) 4th International Conference 25-26 November 2013, Cádiz Ralf Ludwig &
WATER FROM THE CLOUDS
 WATER FROM THE CLOUDS 814 mm per year on land or 110 000 km 3 56% is evapotranspirated by forests and natural landscapes 5% is evapotranspirated by rainfed agriculture 39% available for human uses (irrigation,
ZIMBABWE CASE STUDY ZIMBABWE: COPING WITH DROUGHT AND CLIMATE CHANGE DECEMBER Country. Region. Key Result Area. UNDP Project ID 3785
 ZIMBABWE: COPING WITH DROUGHT AND CLIMATE CHANGE DECEMBER 2010 Country Zimbabwe [http://www.adaptationlearning.net/country-profiles/zw] Region Eastern Africa Key Result Area Agriculture/Food Security Disaster
ESTIMATION OF CLIMATE CHANGE IMPACT ON WATER RESOURCES BY USING BILAN WATER BALANCE MODEL
 ESTIMATION OF CLIMATE CHANGE IMPACT ON WATER RESOURCES BY USING BILAN WATER BALANCE MODEL Stanislav Horacek, Ladislav Kasparek, Oldrich Novicky T. G. Masaryk Water Research Institute Prague, Czech Republic
The Environmental and Economic Impacts of the Nam Theun 2 Hydroelectric Project on Communities Living in the Xe Bang Fai River Basin 16 March 2004
 TERRA 409 Soi Rohitsuk, Pracharajbampen Road Huay Kwang, Bangkok 10320 Thailand Tel: (66) 02 691 0718/19/20; Fax: (66) 02 691 0714; e-mail terraper@ksc.net.th The Environmental and Economic Impacts of
Drought Vulnerability Index
 Drought Vulnerability Index Agricultural University of Athens Hellas Christos A. Karavitis Stavros Alexandris Vassilia Fassouli Dimitris Tsesmelis Dimitris Stamatakos Nikos Skondras AUA Hellas Assessment
CARIBBEAN COUNTRIES FACED DROUGHT CONDITIONS DURING 2010
 CARIBBEAN COUNTRIES FACED DROUGHT CONDITIONS DURING 2010 DROUGHT CONDITIONS ATTRIBUTED TO EL NIÑO Walter Hays From the Global Alliance for Disaster Reduction With contributions from NEMO Secretariat, Saint
MEASUREMENT OF GROUNDWATER TEMPERATURE FOR UNDERGROUND THERMAL UTILIZATION
 MEASUREMENT OF GROUNDWATER TEMPERATURE FOR UNDERGROUND THERMAL UTILIZATION Kasumi YASUKAWA 1, Youhei UCHIDA 1, Norio TENMA 1, Somkid BUAPANG 2 and Hirofumi MURAOKA 1 1 GSJ/AIST, AIST Tsukuba Central 7,
Impact of Climate Change on River Discharge in Namsane River Basin Lao PDR. Ketsana XAIYASARN (Mr) Lao NaBonal Mekong CommiDee Secretariat, Lao PDR
 Lao NaBonal Mekong CommiDee Secretariat, Lao PDR") Impact of Climate Change on River Discharge in Namsane River Basin Lao PDR Ketsana XAIYASARN (Mr) Lao NaBonal Mekong CommiDee Secretariat, Lao PDR IntroducBon o o o o o Lao PDR situate in hearth of Indochina
Impact of Climate Change on River Discharge in Namsane River Basin Lao PDR Ketsana XAIYASARN (Mr) Lao NaBonal Mekong CommiDee Secretariat, Lao PDR IntroducBon o o o o o Lao PDR situate in hearth of Indochina
M.L. Kavvas, Z. Q. Chen, M. Anderson, L. Liang, N. Ohara Hydrologic Research Laboratory, Civil and Environmental Engineering, UC Davis
 Assessment of the Restoration Activities on Water Balance and Water Quality at Last Chance Creek Watershed Using Watershed Environmental Hydrology (WEHY) Model M.L. Kavvas, Z. Q. Chen, M. Anderson, L.
This project was conducted to support the Netherlands Ministry of Foreign Affair s Inclusive Green Growth aim of increasing water use efficiency by
 October 2016 This project was conducted to support the Netherlands Ministry of Foreign Affair s Inclusive Green Growth aim of increasing water use efficiency by 25% in Dutch financed projects. The project
The Council Study. Sustainable Management and Development of the Mekong River Including Impacts of Mainstream Hydropower Projects
 The Council Study Sustainable Management and Development of the Mekong River Including Impacts of Mainstream Hydropower Projects Henry Manguerra, Ph.D., P.E. Study Coordinator, MRCS 4 th BDP Forum on the
I. Lessons learned from the El Niño
 Managing Climate Risks through Climate Information Applications: The Indonesian Experience i A.R. Subbiah, ii Lolita Bildan, and Kareff Rafisura Asian Disaster Preparedness Center In the past two decades,
Outline of Presentation
 Climate Change Adaptation in the Agriculture and Water Sectors in the Philippines Juan M. Pulhin Pulhin,, Ph.D. Professor and Scientist II University of the Philippines Los Baños Inception Workshop on
OPTIMISATION OF HYDROPOWER IN A MULTI-OBJECTIVE CONTEXT
 Proc. Int. Conf. on Water Environment, Energy and Society (WEES-2009), (eds. S. K. Jain, V. P. Singh, V. Kumar, OPTIMISATION OF HYDROPOWER IN A MULTI-OBJECTIVE CONTEXT Dan Rosbjerg 1 * Institute of Environment
Utilization of water resources and its effects on the hydrological environment of the Tarim River basin in Xinjiang, China
 Water Resources Systems Water Availability and Global Change (Proceedings of symposium HS02n held during IUGG2003 al Sapporo. July 2003). IAHS Publ. no. 280. 2003. 23 Utilization of water resources and
Expanding irrigated agriculture in the floodplains of Cambodia. Prepared by Ponh Sachak for the 4 th Regional Stakeholder Forum
 Expanding irrigated agriculture in the floodplains of Cambodia Prepared by Ponh Sachak for the 4 th Regional Stakeholder Forum 20-22 November 2014 Content 1. Introduction 2. Water Resources in Cambodia
5. HYDROLOGICAL CONDITIONS IN THE MEKONG DELTA. 5.1 Key International Monitoring Stations in the Mekong Delta
 5. HYDROLOGICAL CONDITIONS IN THE MEKONG DELTA 5.1 Key International Monitoring Stations in the Mekong Delta 5.1.1 International Monitoring Stations from Phnom Penh to the Mekong Delta The Mekong River
New vision for new. Water in the 21 st. challenges. century: Vision on water resources monitoring in. Vito Colloquium on. the 21 st century,
 Vito Colloquium on Vision on water resources monitoring in the 21 st century, Antwerpen, November 26, 2009 Water in the 21 st New vision for new century: challenges Global Crises Global water resources
Climate Change, Food and Water Security in Bangladesh
 12 29 March 2016 Climate Change, Food and Water Security in Bangladesh Haweya Ismail Research Analyst Global Food and Water Crises Research Programme Key Points Bangladesh s geographical location, poverty
Implications of Climate Change on Water Management in Bangladesh
 Implications of Climate Change on Water Management in Bangladesh February 6, 28 Jahir Uddin Chowdhury Professor Institute of Water and Flood Management BUET, Dhaka-1, Bangladesh 1. Introduction Bangladesh
ANNUAL PLATTE RIVER SURFACE WATER FLOW SUMMARY
 ANNUAL PLATTE RIVER SURFACE WATER FLOW SUMMARY 4/3/213 Platte River Recovery Implementation Program 213 ANNUAL SURFACE WATER FLOW SUMMARY DRAFT Prepared by staff of the Platte River Recovery Implementation
Application of SWAT Model in land-use. change in the Nile River Basin: A Review
 Application of SWAT Model in land-use change in the Nile River Basin: A Review By: Marwa Ali, Okke Batelaan and Willy Bauwens 15-6-2011 Application of SWAT Model in land-use 1 change in the Nile River
Vulnerabilities to Climate Change Impacts and Strengthening Disaster Risk Management in East Asian Cities
 Hanoi, Vietnam 2008 Primer Reducing Vulnerabilities to Climate Change Impacts and Strengthening Disaster Risk Management in East Asian Cities I/ CITY DESCRIPTION A. Hanoi Topography and demography characteristics
Chinese River Basins Yellow River, Huai, Interior Basins. Preliminary results of the GCI II survey
 http://www.unmultimedia.org/photo/guidelines.jsp IISD GWSP Conference on the Water-Energy-Food Security Nexus May 1 5 2012 Chinese River Basins Yellow River, Huai, Interior Basins Preliminary results of
IPCC WG II Chapter 3 Freshwater Resources and Their Management
 IPCC WG II Chapter 3 Freshwater Resources and Their Management Impacts increasingly harmful & more costly to adapt as global temperature increases May imperil sustainable development goals Semi-arid /
Education, Research, Training and Capacity Building Activities in AIT
 Education, Research, Training and Capacity Building Activities in AIT (Research & Training Node for Sentinel Asia) Manzul Hazarika Ph.D. Associate Director, Geoinformatics Center Asian Institute of Technology
Monitoring, Assessment, Prediction and Meteorological service of Agricultural Drought in China
 Monitoring, Assessment, Prediction and Meteorological service of Agricultural Drought in China Wang Shili China Meteorological Administration January, 2005, Kobe Content Characteristics of agrometerological
Effects of Paddy Field conversion to urban use on watershed hydrology in Southern China
 Effects of Paddy Field conversion to urban use on watershed hydrology in Southern China Di Fang, Mengsheng Qin, Hong Qian, Lei Sun, Lu Hao Nanjing University of Information Science and Technology Background
Climate change and impacts on hydrometeorological processes, agro-climatic and water resources
 Climate change and impacts on hydrometeorological processes, agro-climatic and water resources Prof. V.Е.Chub Minister, General Director of the Centre of Hydrometeorological Service at the Cabinet of Ministers
Assessing Climate Change Impacts on Water Resources in the Beas Basin &
 Assessing Climate Change Impacts on Water Resources in the Beas Basin & Possible lessons for future management of the Ganga Adebayo Adeloye Heriot-Watt University, Edinburgh, UK MICCI: Overview of Beas
global science solutions
 global science solutions Tim Martin: Riverside Technology, inc. Fort Collins, Colorado, USA 2.4: Water Security Information and Tools to Support Global Water Security International Symposium on Synergistic
HYDROLOGICAL DROUGHT INDEX AT THE IRRIGATION AREA IN PEMALI-COMAL RIVER BASIN
 HYDROLOGICAL DROUGHT INDEX AT THE IRRIGATION AREA IN PEMALI-COMAL RIVER BASIN Waluyo Hatmoko 1, R. Wahyudi Triweko 2 and Iwan K. Hadihardaja 3 ABSTRACT Drought index is an important tool to detect the
The 4th GEOSS AWCI ICG Meeting Kyoto, 6-7 February WEB-DHM and IWRM
 The 4th GEOSS AWCI ICG Meeting Kyoto, 6-7 February 29 WEB-DHM and IWRM Lei Wang a, Toshio Koike a, Cho Thanda Nyunt a, Oliver Cristian Saavedra Valeriano a, Tran Van Sap b, Tsugito Nagano c a Department
Mission. Selected Accomplishments from Walnut Gulch. Facilities. To develop knowledge and technology to conserve water and soil in semi-arid lands
 USDA-ARS Southwest Watershed Research Center Mission Sound Science for Watershed Decisions To develop knowledge and technology to conserve water and soil in semi-arid lands ARS Watershed Locations Selected
Water management innovation for meeting Climate change effects and European Water Framework Directive targets: Pilot study Lankheet
 Water management innovation for meeting Climate change effects and European Water Framework Directive targets: Pilot study Lankheet E.P. Querner, P.J.T. van Bakel and H.M. Mulder Alterra, Centre for Water
Report on the Review of the. Water Scarcity. European. and Droughts Policy. Environment
 Report on the Review of the European Water Scarcity and Droughts Policy Environment Cover picture: M.Brättemark EUROPEAN COMMISSION Brussels, 14.11.2012 COM(2012) 672 final COMMUNICATION FROM THE COMMISSION
U.S. Army Corps of Engineers Reservoir Operations Maria Placht, Institute for Water Resources, USACE 49
 U.S. Army Corps of Engineers Reservoir Operations Maria Placht, Institute for Water Resources, USACE 49 Context The U.S. Army Corps of Engineers (the Corps) is responsible for a variety of water resourcerelated
1.6 Influence of Human Activities and Land use Changes on Hydrologic Cycle
 1.6 Influence of Human Activities and Land use Changes on Hydrologic Cycle Watersheds are subjected to many types of changes, major or minor, for various reasons. Some of these are natural changes and
The Impacts of Climate Change on Portland s Water Supply
 The Impacts of Climate Change on Portland s Water Supply Richard Palmer and Margaret Hahn University of Washington Department of Civil and Environmental Engineering Joe Dvorak, Dennis Kessler, Azad Mohammadi
Stanley J. Woodcock, Michael Thiemann, and Larry E. Brazil Riverside Technology, inc., Fort Collins, Colorado
 7.5 FRASER RIVER EXTENDED STREAMFLOW PREDICTION SYSTEM Stanley J. Woodcock, Michael Thiemann, and Larry E. Brazil Riverside Technology, inc., Fort Collins, Colorado Esther Vincent and Andy Pineda * Northern
Climate Change Impact and Adaptation Study for the Lower Mekong Basin
 USAID Mekong Adaptation and Resilience to Climate Change Climate Change Impact and Adaptation Study for the Lower Mekong Basin KEY FINAL RESULTS USAID Mekong Adaptation and Resilience to Climate Change
The Water Survey of Canada Stream and Lake Gauging Network
 The Water Survey of Canada Stream and Lake Gauging Network Past and Future Hydroclimatic Variability: Applications to Water Resource Management in the Prairie Provinces The Water Survey of Canada Stream
Socio-economic Indicators for Vulnerability Assessment in the Arab Region
 Socio-economic Indicators for Vulnerability Assessment in the Arab Region Tarek Sadek Water Resources Section Sustainable Development & Productivity Division-ESCWA Presentation outline Concepts of vulnerability
West Africa: the 2017 Season
 West Africa: the 2017 Season Late season dryness affects Sahelian areas Bulletin # 5 October 2017 1 Contents Highlights 1. HIGHLIGHTS...2 2. THE SEASON AT A GLANCE...3 3. MAY TO JULY 2017...4 4. AUGUST