Climate Change: Implications from Macroeconomic Models for India April 14, Macro Workstream ICRIER, April 14 th, 2014
|
|
|
- Colin Cook
- 6 years ago
- Views:
Transcription
1 Climate Change: Implications from Macroeconomic Models for India April 14, 2014 Macro Workstream ICRIER, April 14 th, 2014
2 Macroeconomic Indicators 12 GDP growth (annual %) Employment to Population ratio (%) GDP growth (annual %) Employment to Population ratio (%) GDP per capita (Current USD) GDP per capita (Current USD) Share in Employment (%) Agriculture Industry Services incl. construction
3 Economic Growth, Sustainability and Climate Change Current paradigm - sustaining economic growth and promoting inclusiveness Commitment: voluntary mitigation goal of reducing the emissions intensity of its Gross Domestic Product (GDP) by per cent, over 2005 levels, by 2020 Assessment of Macro models, incorporating climate change
4 Emission Indicators India CO2 emissions (metric tons per capita) India CO2 emissions (kg per 2005 PPP $ of GDP) 0.53
5 Carbon emissions in India (MtCO2) Source: Understanding Energy Challenges in India Policy, Players and Issues. OECD/IEA, 2012
6
7
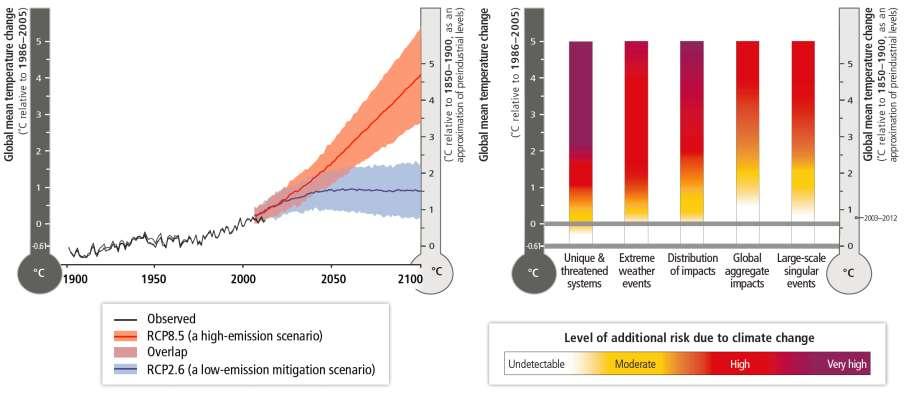
8 Projected Risks for Asia Present Near Term ( Long Term 2 C ( ) 4 C Very Low Risk- Level Very High Increased Flood Damage to Infrastructure, Livelihoods, and Settlements Heat- Related Human Mortality Increased Drought- Related Water and Food Shortage
9 CO 2 emission (kg/ppp$ of GDP) India s Carbon Intensity ( ) CO 2 emissions (kg per PPP $ of GDP) Years Source: World Bank Database Note: Carbon dioxide emissions are those stemming from the burning of fossil fuels (solid, liquid, and gas fuels and gas flaring) and the manufacture of cement.
10 toe/$1000 GDP Source: OECD database; available through OECD s ilibrary India s Energy Intensity ( ) Tonnes of oil equivalent (toe) per thousand 2000 US dollars of GDP calculated using PPPs Years The ratios are calculated by dividing each country's annual TPES by each country's annual GDP expressed in constant 2000 prices and converted to US dollars using purchasing power parities (PPPs) for the year 2000.
11 Gt CO2 eq India s Sectoral GHG Emission (1994, 2000 and 2007) India s I st National communication to UNFCC on GHG Emission India s 2 nd National communication to UNFCC on GHG Emission INCCA* Prepared an inventory of GHG emission for the year , Energy Industrial Process Agriculture Waste Source: India's Second National Communication to UNFCC, 2012 *India : Greenhouse Gas Emission 2007, INCCA Indian Network for Climate Change Assessment, 2007
12 Economic Growth, Sustainability and Climate Change What are the emerging pathways? With a special focus on: Synergies (co-benefits, low regret strategies) trade-offs (GDP, emission constraints, poverty)
13 Coverage of available studies: 50+ peer reviewed journal articles, book chapters, reports 3 energy economy models supported by Ministry of Environment and Forests ; (released in 2009) Aim: build GHG emissions profile till Energy economy and impact model combinations : Linear Programming (LP); Computable General Equilibrium (CGE); Studies from independent researchers and organisations, prior and post this set Low carbon expert group (Planning Commission)
 Carbon emission, GDP, Climate Policy Carbon emission, GDP,")

14 Aspects of the papers reviewed 17 % (9) 39 % (19) Carbon Emission, GDP 44 % (22) Carbon emission, GDP, Climate Policy Carbon emission, GDP, Poverty, Climate Policy Note: Percentage of paper reviewed with the mentioned three main aspects Figure in Parenthesis represents the number of papers
15 Assumptions, methodology, findings and limitations
16 Descriptions from 8 recent studies Study Model Type Time frame Energy efficiency Gaba et al. (2011) Engineering-based bottom-up model In particular electricity generation Parikh et al. (2014) LP- Activity analysis model Autonomous EE improvements 1 1.2% pa NCAER-CGE (Pohit et al 2009) Shukla et al. (2008) Saveyn et al. (2012) Chaturvedi and Shukla (2013) Shukla and Chaturvedi (2012) IEG-CGE (Pradhan and Ghosh 2012) Sequential, CGE model (37Sectors) Mix of models ; integrated modelling framework for LCS CGE - GEM-E3 global model. Global Change Assessment Model (GCAM- IIM) Global Change Assessment Model (GCAM- IIM) Recursive dynamic CGE; building on DART Autonomous EE improvement 1.5% pa Across sectors, special mention of industrial production technology Yes Emphasis on end use energy efficiency Low carbon technologies in electricity generation In OECD scenario leads to energy intensity of GDP falling by 85% between with climate mitigation policy; 38% by 2020
17 Study Gaba et al. (2011) Parikh et al. (2014) NCAER-CGE (Pohit et al 2009) Shukla et al. (2008) Saveyn et al. (2012) Chaturvedi and Shukla (2013) Shukla and Chaturvedi (2012) IEG-CGE (Pradhan and Ghosh 2012) Scenario Descriptions from 8 recent studies Five Year Plans fully implemented; Delayed Implementation as per historical performance; All-Out Stretch FYP, with rise in EE & and low carbon energy Accelerated Visionary Development policies for human well-being. Carbon budget scenarios (corresponding to 2 deg C stabilization target) BAU Reference scenario: No new mitigation policies or scenarios Base - GDP gr. 8%; target for stabilization ( ppm CO 2 e); Carbon tax - target ppm CO 2 e Sustainable society: Cumulative carbon budget for Asian Modeling Emission scenarios - For carbon price path - Low -CO2 Price $10; Middle CO2 Price $30 High - CO2 Price $50 6 scenarios: 1 reference and 2 climate mitigation With reference assumptions for end use EE improvement & Advanced assumptions BAU with and without targets for clean energy sources in electricity generation. Carbon price with and without such clean energy electricity targets BAU: OECD growth scenario (4.3% in 2050); Higher growth scenario (5.9% in 2050) 2 policy regimes (for temp. at 2 deg C) - i. Global carbon tax; ii. Emissions
18 Model Power and Model Limitations What is included: energy efficiency, health costs, leadership Equilibrium properties: Unemployment, capacity gaps Cross-border flows: Trade, finance, capital Carbon policy tax, emissions trading, revenue use
19 Model Power : What is included? Study Gaba et al. (2011) Parikh et al. (2014) NCAER-CGE (Pohit et al 2009) Health Costs Not included Not included Shukla et al. (2008) Saveyn et al. (2012) Chaturvedi and Shukla (2013) Shukla and Chaturvedi (2012) IEG-CGE (Pradhan and Ghosh 2012) Not modelled; however, benefits of improved air quality through reduced SO2 is one indicator for a low carbon society Not included Significant co-benefits of EE improvements in terms of energy security from reduced import bills, Reduced local air pollutants. Possibility of reduced health cost due to improved air quality as a co-benefit but not explicitly modelled Not included
20 Model Power : What is included? Study Gaba et al. (2011) Parikh et al. (2014) NCAER-CGE (Pohit et al 2009) Shukla et al. (2008) Saveyn et al. (2012) Role of cross border flows (trade, finance) Regional trade in lower-carbon energy sources recommended for low carbon pathway Sustainability scenario also assumes a high degree of regional cooperation among the countries in southern Asia for energy and electricity trade and effective use of shared water and forest resources. Chaturvedi and Shukla (2013) Shukla and Chaturvedi (2012) IEG-CGE (Pradhan and Ghosh 2012) Additional gains in hydro and wind potentials from regional cooperation with neighbouring countries. A larger south Asian market for energy and electricity in which Indian firms would have a greater opportunity to participate in joint ventures.
21 Study In-built transitions: Avenues for Action? Gaba et al. (2011) T & D loss reduction most cost-effective - Approx. 20% reduction in CO2 from grid electricity with reduction in T & D losses, construction of supercritical power plants Parikh et al. (2014) Shukla et al. (2008) Saveyn et al. (2012) Chaturvedi and Shukla (2013) Shukla and Chaturvedi (2012) IEG-CGE (Pradhan and Ghosh 2012) Some options for meeting global carbon budget corresponding to 2 deg C target Increase in share of renewables in total generation by 0.18% per year Mitigation mainly in electricity sector - initially due to fuel switching up to 2030, beyond which due to CCS in power generation, steel and cement industry. Increase in share of natural gas. End use EE significant impact on transportation and building sectors Setting clean energy electricity generation targets internalises co-benefits from reduced air pollution, increased energy security and reduced climate change risks Creation of a CCS, thermal electricity sector
22 Study Gaba et al. (2011) In-built transitions: Avenues for Action? Tighter mandatory energy efficiency standards for household appliances lowers electricity consumption by a third. Parikh et al. (2014) Increase in share of railways in freight movement from 35% in 2010 to 67% by 2050 Reducing petroleum product inputs in transport sector by 2% per year Shukla et al. (2008) Higher adoption of renewables, specially biomass, and improvements in device efficiencies also responsible for mitigation. Saveyn et al. (2012) Chaturvedi and Shukla (2013) Shukla and Chaturvedi (2012) IEG-CGE (Pradhan and Ghosh 2012) Interventions in transport and some highly energy intensive sectors (metal and chemical industries) contribute most. Substantial shift towards electricity consumption esp. for transport and industrial sectors, with a stringent climate policy. Low carbon technologies compete among themselves and substitute each other, thereby enhancing the need for subsidy or carbon price; e.g. Solar electricity, requires subsidy throughout the century to achieve its targets
23 Study Descriptions from 8 recent studies Carbon policy and revenues Gaba et al. (2011) Parikh et al. (2014) NCAER-CGE (Pohit et al 2009) Shukla et al. (2008) Saveyn et al. (2012) Chaturvedi and Shukla (2013) Shukla and Chaturvedi (2012) IEG-CGE (Pradhan and Ghosh 2012) In CT scenario in 2050 Carbon tax increases to $100/tCO2 and GDP decreases by 1.35% compared to Tax revenues from the carbon tax are invested back into the economy. Carbon tax for penetration of renewables Carbon tax leads to reduction of final energy demand (net of rebound effect from EE improvements) Feedback effects of subsidy and taxes on current and future GDP are not included in the present analysis. Emissions trading permits; Global Carbon tax on coal, oil and gas products: carbon prices rise more post 2040, since abatement opportunities more in earlier years (Partially from

 Shukla et al. (2008) Parikh et al.")
24 Share of Renewables (%) BAU CT % Share of renewable energy in total energy, with and without climate policy in 2050 ET CT 33 BAU SS BAU 14 LC1 44 LC2 41 Scenarios BAU - Business as Usual CT - Carbon Tax ET - Emissions Trading SS - Sustainable Society LC1 - Low Carbon 1 LC2 - Low Carbon 2 0 Pradhan and Ghosh (2012) Shukla et al. (2008) Parikh et al. (2014a)* * Parikh et al. (2014a) - share of renewables in total electricity generation
 Scenarios BAU - Business as Usual CT - Carbon Tax VD - Visionary Development LC1 - Low Carbon 1 LC2 - Low Carbon 2")
25 Per capita emissions (Mt) Per capita emissions in VD BAU CT Pradhan-Ghosh (2012); OECD scenario 13.1 LC1 LC Parikh et al. (2014a) Scenarios BAU - Business as Usual CT - Carbon Tax VD - Visionary Development LC1 - Low Carbon 1 LC2 - Low Carbon 2
26 Model Limitations: What is not included? Leadership and collective action premiums Model scenarios and assumptions on the in-built dynamics have implications for governance and institutional measures, but do not explicitly model these. Emissions tend to peak around , with a climate policy regime in place (e.g. Pradhan and Ghosh at 2.1 MT per capita in 2040)
27 Model Limitations: What is not included? Long term impacts; Looking beyond the short term Transferring resources (carbon tax revenues or capital inflows) to the weaker sections of society or subsidising other sectors of the economy could reduce (or reverse) the adverse effect. Forecasting issues: Structural uncertainties, non-assignment of probabilities; non marginal changes Changes in international prices of fossil fuels are modelled using future price projections, and usually remain invariant to policy scenarios In most India models, domestic energy prices are endogenous (NCAER-CGE, MoEF IRADe, TERI MoEF). In general, price elasticity as based on Indian data tends to be low; while the international price projections (exogenous) usually assume some escalations.
28 Model Limitations: What is not included? Discussion of nonequilibrium properties with involuntary unemployme nt; Capacity gaps Most models assume full employment with intersectoral mobility in case of factors of production. Alternative closure assumptions in the CGE framework could for instance be built in, but generally not seen. Similarly, subsidies are also part of the price equation, and not looked at separately. Overall impacts through a carbon tax which changes (raises) prices are the common approach.
29 No last word on welfare changes! Paper Time frame Emission reduction Economic Loss Kirit S. Parikh (2011) Cumulative carbon emission reduces from 337 Gt in base case to Gt under constrains 12.5% loss in GDP Shukla et al. (2008) Decrease in cumulative emission 62.6 billion tco % loss in GDP Shukla and Dhar (2011) Decrease in cumulative emission around 60.8 billion ton 6.7% loss in GDP
30 Paper Time frame Emission reduction Economic Loss Shukla et al. (2009) Calvin et al. (2012) Murthy et al. (1997) Reduced carbon emissions 1% economic around 5.1 billion-ton of CO2 growth each year to the region sustained over a 20 year period Emissions per unit of GDP falls to 20 25% below 2005 levels in CO2 emissions reduces from 5.8% to 4.8% Pradhan and Ghosh (2012) Target fixed at 450 ppm; corresponding to long term temp rise of 2 deg C Decline of % in GDP growth rate, except for
31 Options Table 1 : Mitigation Options and Potential: Emissions of selected electricity supply technologies (gco2eq/kwh) Currently Commercially Available Technologies Lifecycle emissions* (gco2eq/kwh) Coal PC 820 Gas - Combined Cycle 490 Biomass CHP 230 Hydropower 24 Nuclear 12 Concentrated Solar Power 27 Solar PV - rooftop 41 Solar PV - utility 48 Pre-commercial Technologies CCS - Coal - PC 220 CCS - Coal 200 IGCC-CCS - Gas - Combined Cycle 170 * Represents the median value Source: As reported in IPCC, AR5, WG III calculations
32 Is a low carbon transition pathway consistent with attaining the goals set for the economy? 25% emission intensity reduction over 2005 levels possible by 2020 with GDP growth rate of 8-9% in short term (Interim report, Expert Committee, Planning Commission) 29% (WB 2011), 24-25% (Parikh 2014) Critical challenges of poverty reduction in the near and medium term; resource constraints to economic growth already identified energy, water and land use. Climate change a threat multiplier, adding to constraints, and competition over resources under BAU Low carbon path offers potential economic gains, apart from climate mitigation benefits Energy security : EE improvements, share of renewables Health Co-benefits: Air pollution major issue already in cities Technological innovation and its attendant implications for investment gains; impacts on quality of life (varying extent in most models) Learning: A strong climate policy can induce transitional change
33 Discussion
The Economics of Climate Change Nicholas Stern. Second IG Patel lecture New Delhi 26 October 2007
 The Economics of Climate Change Nicholas Stern Second IG Patel lecture New Delhi 26 October 2007 1 The economics of climate change Impacts, Risks, Costs: Global Possible Impacts on India Planning for Adaptation
IPCC AR4: Long term Emissions Pathways
 IGES TERI Policy Research Workshop On the road to Paris: The readiness of key countries for COP21 and beyond The Energy and Resources Institute (TERI), India 6 7 January 2015 Global GHG Emissions Pathways
Implications of Abundant Natural Gas
 Implications of Abundant Natural Gas JAE EDMONDS AND HAEWON MCJEON APRIL 213 April 29, 213 1 Gas and the Global Energy System Gas is has been a growing component of the global energy system for some time.
Technology, development and climate: the need for an integrated approach Bert Metz, European Climate Foundation
 Technology, development and climate: the need for an integrated approach Bert Metz, European Climate Foundation Key messages: 1. Climate change is a development problem (causes and impacts) 2. Solving
GHG emissions per capita. (tco 2. e/cap) Source: UNDP, data for 2015 Source: World Bank Indicators, data for 2012 Source: IEA, data for 2013
 Source: UNDP, data for 2015 Source: World Bank Indicators, data for 2012 Source: IEA, data for 2013") CLIMATE ACTION TRACKER BROWN TO GREEN: G2 TRANSITION TO A LOW CARBON ECONOMY Turkey This country profile assesses Turkey s past, present and indications of future performance towards a low-carbon economy
CLIMATE ACTION TRACKER BROWN TO GREEN: G2 TRANSITION TO A LOW CARBON ECONOMY Turkey This country profile assesses Turkey s past, present and indications of future performance towards a low-carbon economy
Chapter 7. Indonesia Country Report. September 2016
 Chapter 7 Indonesia Country Report September 2016 This chapter should be cited as Malik, C. (2016), Indonesia Country Report in Kimura, S. and P. Han (eds.) in Energy Outlook and Energy Saving Potential
Deep Decarbonization Pathway Case: Indonesia Energy Sector
 3 rd Annual Meeting Low Carbon Asia Research Network (LoCARNet) Bogor 24-26 November 2014 Deep Decarbonization Pathway Case: Indonesia Energy Sector Ucok WR Siagian, Retno G Dewi and Iwan Hendrawan Center
GHG emissions per capita. (tco 2. e/cap) Source: UNDP, data for 2015 Source: World Bank Indicators, data for 2012 Source: IEA, data for 2013
 Source: UNDP, data for 2015 Source: World Bank Indicators, data for 2012 Source: IEA, data for 2013") CLIMATE ACTION TRACKER BROWN TO GREEN: G2 TRANSITION TO A LOW CARBON ECONOMY Saudi Arabia This country profile assesses Saudi Arabia s past, present and indications of future performance towards a low-carbon
CLIMATE ACTION TRACKER BROWN TO GREEN: G2 TRANSITION TO A LOW CARBON ECONOMY Saudi Arabia This country profile assesses Saudi Arabia s past, present and indications of future performance towards a low-carbon
Transition to a Low-Carbon Economy in Poland. Erika Jorgensen and Leszek Kasek World Bank, Europe and Central Asia Region December 17, 2010 Warsaw
 Transition to a Low-Carbon Economy in Poland Erika Jorgensen and Leszek Kasek World Bank, Europe and Central Asia Region December 17, 2010 Warsaw Poland s energy mix is dominated by coal to such an extent
BP Energy Outlook 2017 edition
 BP Energy Outlook 2017 edition Bob Dudley Group chief executive bp.com/energyoutlook #BPstats BP Energy Outlook 2017 edition Spencer Dale Group chief economist bp.com/energyoutlook #BPstats Economic backdrop
Energy Perspectives for Asia
 Energy Perspectives for Asia By Rajiv Ranjan Mishra Nov 21, 2017 Energy Asia Population Asia 4.06 billion 55% of World 8X of EU Expected to be 8.5 billion by 2030 Source: World Bank, 2016; UN GDP Per Capita
GHG emissions per capita. Share of global GHG emissions. e/cap) (tco
 (tco") CLIMATE ACTION TRACKER BROWN TO GREEN: G2 TRANSITION TO A LOW CARBON ECONOMY India This country profile assesses India s past, present and indications of future performance towards a low-carbon economy
CLIMATE ACTION TRACKER BROWN TO GREEN: G2 TRANSITION TO A LOW CARBON ECONOMY India This country profile assesses India s past, present and indications of future performance towards a low-carbon economy
Mind the Science Science-based target setting methodology. 22/05/2014 Giel Linthorst, Jeroen de Beer,
 Mind the Science Science-based target setting methodology 22/05/2014 Giel Linthorst, g.linthorst@ecofys.com Jeroen de Beer, j.debeer@ecofys.com GHG emissions accelerate despite reduction efforts. Most
CONTENTS TABLE OF PART A GLOBAL ENERGY TRENDS PART B SPECIAL FOCUS ON RENEWABLE ENERGY OECD/IEA, 2016 ANNEXES
 TABLE OF CONTENTS PART A GLOBAL ENERGY TRENDS PART B SPECIAL FOCUS ON RENEWABLE ENERGY ANNEXES INTRODUCTION AND SCOPE 1 OVERVIEW 2 OIL MARKET OUTLOOK 3 NATURAL GAS MARKET OUTLOOK 4 COAL MARKET OUTLOOK
Development, Technologies and Stabilization
 Energy and Climate Change Mitigation in India: Development, Technologies and Stabilization GTSP Technical Review May 23, 2007 JGCRI, College Park, MD 20740 USA P.R. Shukla Indian Institute of Management,
Finding an Optimal Path to 2050 Decarbonization Goals
 Finding an Optimal Path to 2050 Decarbonization Goals John Bistline, Ph.D. Technical Leader 3 rd IEA-EPRI Workshop Paris October 17, 2016 Substantial Effort Beyond NDCs Will Be Required Billion tonnes
Methodology for calculating subsidies to renewables
 1 Introduction Each of the World Energy Outlook scenarios envisages growth in the use of renewable energy sources over the Outlook period. World Energy Outlook 2012 includes estimates of the subsidies
Future Scenarios for China s Carbon Emissions
 Future Scenarios for China s Carbon Emissions Jim Watson and Tao Wang Kennedy School of Government, Harvard University, 7 th July 2008 Overview 1 Energy and emissions trends in China 2 Who owns China s
Politique et sécurité énergétique dans le contexte des nouvelles énergies
 Politique et sécurité énergétique dans le contexte des nouvelles énergies Didier Houssin Director, Energy Markets and Security International Energy Agency Colloque L Energie : enjeux socio-économiques
Emissions Intensity CHAPTER 5 EMISSIONS INTENSITY 25
 C H A P T E R 5 Emissions Intensity Emissions intensity is the level of GHG emissions per unit of economic activity, usually measured at the national level as GDP. 25 Intensities vary widely across countries,
17 th February 2015 BP Energy Outlook bp.com/energyoutlook #BPstats BP p.l.c. 2015
 17 th February 215 BP bp.com/energyoutlook #BPstats Economic backdrop GDP Trillion, $211 PPP 24 Other Non-OECD Asia 18 OECD Contribution to GDP growth Trillion $211 PPP, 213-35 9 Population Income per
Economic Benefits of Bangladesh India Electricity Trade 1
 Economic Benefits of Bangladesh India Electricity Trade 1 Economic Benefits of Bangladesh India Electricity Trade Modeling Study Summary Report October 2017 2 Economic Benefits of Bangladesh India Electricity
Global 2 C Scenarios Norway and the Road Towards the Low Emission Society Arendal, 8. August, 2013
 Global 2 C Scenarios Norway and the Road Towards the Low Emission Society Arendal, 8. August, 2013 Audun Rosland Director - Climate Departement Norwegian Environment Agency Billion tco 2 e 2 C Challenge
Pragmatic Policy Options for Copenhagen and Beyond
 Pragmatic Policy Options for Copenhagen and Beyond Elliot Diringer Pew Center on Global Climate Change at GTSP Technical Review Joint Global Change Research Institute May 28, 2009 Overview The Negotiating
Overview on Indonesia Market Readiness Barcelona PMR Meeting, May, 2011
 Overview on Indonesia Market Readiness Barcelona PMR Meeting, 30-31 May, 2011 Structure of Presentation 1. Policy context: Domestic mitigation objectives and role of market instrument(s) 1. Policy context,
GHG emissions per capita. (tco 2. e/cap) Source: UNDP, data for 2015 Source: World Bank Indicators, data for 2012 Source: IEA, data for 2013
 Source: UNDP, data for 2015 Source: World Bank Indicators, data for 2012 Source: IEA, data for 2013") BROWN TO GREEN: G2 TRANSITION TO A LOW CARBON ECONOMY CLIMATE ACTION TRACKER France This country profile assesses France s past, present and indications of future performance towards a low-carbon economy
BROWN TO GREEN: G2 TRANSITION TO A LOW CARBON ECONOMY CLIMATE ACTION TRACKER France This country profile assesses France s past, present and indications of future performance towards a low-carbon economy
GE OIL & GAS ANNUAL MEETING 2016 Florence, Italy, 1-2 February
 Navigating energy transition Keisuke Sadamori Director for Energy Markets and Security IEA GE OIL & GAS ANNUAL MEETING 2016 Florence, Italy, 1-2 February 2016 General Electric Company - All rights reserved
Chapter: 1.1 Energy Scenario
 Chapter: 1.1 Energy Scenario Part-I: Objective type questions and answers 1. The energy sources, that are either found or stored in nature are a) Secondary Energy Sources b) Primary Energy Sources c) both
Nuclear Energy and Greenhouse Gas Emissions Avoidance in the EU
 Position Paper Nuclear Energy and Greenhouse Gas Emissions Avoidance in the EU The European Atomic Forum (FORATOM) is the Brussels-based trade association for the nuclear energy industry in Europe. The
THE GLOBAL COMMISSION ON THE ECONOMY AND CLIMATE
 THE GLOBAL COMMISSION ON THE ECONOMY AND CLIMATE Better Growth, Better Climate: The New Climate Economy Report IMF-WB Annual meetings, 8 October 2014 0 The New Climate Economy Partnership: - to re-examine
UNDERSTANDING THE IMPACTS OF NEW TECHNOLOGIES
 UNDERSTANDING THE IMPACTS OF NEW TECHNOLOGIES REDUCING CO 2 EMISSIONS AND OIL DEPENDENCE Chris Nichols National Energy Technology Laboratory Nichols, USAEE Oct 2010 Presentation Overview 2 In current EPA-developed
CLIMATE CHANGE 2014 Mitigation of Climate Change
 dreamstime CLIMATE CHANGE 2014 Mitigation of Climate Change Sectoral and Cross Sectoral Mitigation Joyashree Roy CLA Industry chapter, IPCC Working Group III Working Group III, SED, Bonn GHG emissions
K. J. Sreekanth, 2 S. Jayaraj, 3 N. Sudarsan 1, 2, 3 Department of Mechanical Engineering, National Institute of Technology, Calicut , INDIA
 Certified Emission Reduction (CER) Opportunities in Rural Domestic Energy Sector 1 K. J. Sreekanth, 2 S. Jayaraj, 3 N. Sudarsan 1, 2, 3 Department of Mechanical Engineering, National Institute of Technology,
CHINA 2050 HIGH RENEWABLE ENERGY PENETRATION SCENARIO AND ROADMAP STUDY. Energy Research Institute National Development and Reform Commission
 CHINA 2050 HIGH RENEWABLE ENERGY PENETRATION SCENARIO AND ROADMAP STUDY Energy Research Institute National Development and Reform Commission ENERGY RESEARCH INSTITUTE NATIONAL DEVELOPMENT AND REFORM COMMISSION
Climate Change and Energy Package
 Climate Change and Energy Package The 4th International Conference NEUF 2008 Warszawa, 6 June 2008 Piotr J. Tulej Head of Unit Energy and Environment Directorate-General Environment European Commission
CONTENTS PART A TABLE OF GLOBAL ENERGY TRENDS PART B SPECIAL FOCUS ON NATURAL GAS PART C CHINA ENERGY OUTLOOK ANNEXES
 TABLE OF CONTENTS PART A PART B GLOBAL ENERGY TRENDS SPECIAL FOCUS ON NATURAL GAS PART C CHINA ENERGY OUTLOOK ANNEXES INTRODUCTION AND SCOPE 1 OVERVIEW 2 ENERGY, EMISSIONS AND UNIVERSAL ACCESS 3 OUTLOOK
Future emissions of air pollutants in Indonesia: SO 2 and NO x
 Future emissions of air pollutants in Indonesia: SO and NO x Armi Susandi Max Planck Institute for Meteorology Bundesstrasse, D- Hamburg, Germany Phone: +9--8- Fax.:+9---98 email: susandi@dkrz.de Abstract
Economic and Energy Outlook of Japan for FY2015
 19 December 2014 The 418th Forum on Research Work Economic and Energy Outlook of Japan for FY2015 Overview What about benefit of oil price plunge for stagnating Japanese economy after VAT increase? YANAGISAWA
Asian Energy Outlook up to 2035
 Asian Energy Outlook up to 2035 A Joint Study to Develop the Asian Energy Outlook by experts from Asian Petroleum Producing-Consuming Countries April 18, 2011 *This outlook was made in February 2011, therefore
Medium Term Renewable Energy Market Report Michael Waldron Senior Energy Market Analyst Renewable Energy Division International Energy Agency
 Medium Term Renewable Energy Market Report 13 Michael Waldron Senior Energy Market Analyst Renewable Energy Division International Energy Agency OECD/IEA 13 Methodology and Scope OECD/IEA 13 Analysis of
Scenario Analysis of Power Mix in Taiwan
 Scenario Analysis of Power Mix in Taiwan Chia-Hao Liu, Ching-Han Deng, Chia-An Chang* and Fu-Kuang Ko Institute of Nuclear Energy Research Abstract Carbon emissions have become a critical issue concerned
Th T e h e P R P IM I E M S E S E n E e n r e gy g M o M d o e d l e A.. G en e e n r e al a l O ver e vie i w e E3 E M M Lab
 The PRIMES Energy Model Energy-Economy-Environment Environment Modeling Laboratory National Technical University of Athens November 2007, Brussels The PRIMES Energy Model A. General Overview PRIMES ENERGY
Belgium Energy efficiency report
 Belgium Energy efficiency report Objectives: 27.5 TWh of end-user energy savings in 216 12% share of renewables for electricity suppliers in 212 Overview - (% / year) Primary intensity (EU=) 1 132 - -1.8%
Belgium Energy efficiency report
 Belgium Energy efficiency report Objectives: 27.5 TWh of end-user energy savings in 216, including 2.8 TWh in industry Overview - (%/year) Primary intensity (EU=1)¹ 136 -- -1.4% - CO 2 intensity (EU=1)
Fuels Used in Electricity Generation
 Fuels Used in Electricity Generation for Energy and Climate Change Research Seminar May 17 th, 2012 Washington, DC by, Office of Electricity, Coal, Nuclear and Renewables Analysis Energy Information Administration
PART IV Benefits for Cities in Climate Change Action
 PART IV Benefits for Cities in Climate Change Action Cities Have Much to Gain from Embracing the Low-carbon Agenda Although climate change is a pressing issue, many local governments are reluctant or unaware
Brazil Energy efficiency report
 Brazil Energy efficiency report Objective: 16 TWh of electricity savings by 23 Overview - (%/year) Primary intensity (EU=1)¹ 114 - -.1% -- CO 2 intensity (EU=1) 79 ++ -.8% -- CO 2 emissions per capita
WIND POWER TARGETS FOR EUROPE: 75,000 MW by 2010
 About EWEA EWEA is the voice of the wind industry actively promoting the utilisation of wind power in Europe and worldwide. EWEA members from over 4 countries include 2 companies, organisations, and research
Luxembourg Energy efficiency report
 Luxembourg Energy efficiency report Objectives: 1.6 TWh of end-use energy savings, or about 9%, by 216 Overview - (% / year) Primary intensity (EU=1) 1 97 + -.7% -- CO 2 intensity (EU=1) 114 - -.2% --
Netherlands Energy efficiency report
 Netherlands Energy efficiency report Objectives: 51 TWh of end-use energy savings by 216 2%/year of energy savings over 211-22 Overview - (% / year) Primary intensity (EU=1) 1 18 - -.6% -- CO 2 intensity
& ECONOMIC STATISTICS
 2011 EDMC HANDBOOK of ENERGY & ECONOMIC STATISTICS in JAPAN CONTENTS Japan Chapter I. Energy and Economics 1.Economic Indices... 4 ( 1 ) GDP and Major Energy Related Indicators... 5 ( 2 ) National Accounts
The IPCC Special Report on Renewable Energy Sources and Climate Change Mitigation Prof. Dr. Ottmar Edenhofer
 johnthescone The IPCC Special Report on Renewable Energy Sources and Climate Change Mitigation 24th September 2011, The New School for Social Research, New York Prof. Dr. Ottmar Edenhofer Co-Chair of the
Mexico Energy efficiency report
 Mexico Energy efficiency report Objective: energy savings target of 2% for 12 and 18% for 30 Overview - (%/year) Primary intensity (EU=100)¹ 101-0.2% -- CO2 intensity (EU=100) 111 - -0.2% -- CO 2 emissions
Dr. Jyoti Parikh Executive Director Integrated Research and Action for Development (IRADe)
") South Asia Investor s Workshop on Cross-Border Electricity Trade South Asia Regional Initiative for Energy Integration(SARI/EI) 24 th -25 th September, 2014 New Delhi, India Dr. Jyoti Parikh Executive
South Asia Investor s Workshop on Cross-Border Electricity Trade South Asia Regional Initiative for Energy Integration(SARI/EI) 24 th -25 th September, 2014 New Delhi, India Dr. Jyoti Parikh Executive
2052 A Global Forecast for the Next Forty Years: The role of the Club of Rome
 252 A Global Forecast for the Next Forty Years: The role of the Club of Rome Jorgen Randers Professor Center for Climate Strategy Norwegian Business School BI J Randers 1 Club of Rome Fundraiser Berlin,
ECONOMIC MODELING OF THE GLOBAL ADOPTION OF CARBON CAPTURE AND SEQUESTRATION TECHNOLOGIES
 ECONOMIC MODELING OF THE GLOBAL ADOPTION OF CARBON CAPTURE AND SEQUESTRATION TECHNOLOGIES J. R. McFarland 1, H. J. Herzog 2, and J. Reilly 3 1 Technology and Policy Program, M.I.T., Cambridge, MA. 02139,
Electricity Markets. Rapid Conference May 17, Mike Rencheck Rencheck Consulting LLC
 Electricity Markets Rapid Conference May 17, 2016 Mike Rencheck Rencheck Consulting LLC Topics Market Formation - Basics 2016 / 2017 Forecasts Natural Gas, Renewable Portfolio Standards, and Climate Change
Synopsis of a Study by the World Bank for Government of India
 India: Options for Low Carbon Development Synopsis of a Study by the World Bank for Government of India THE WORLD BANK South Asia Sustainable Development Department December 2009 THE WORLD BANK South Asia
Role of Renewable Energy in Combating Climate Change by
 Role of Renewable Energy in Combating Climate Change by Ramesh Kumar Jalan, Ph.D. Resource Person & Moderator Climate Change Community, Solution Exchange, United Nations Development Programme 55, Lodhi
Competitive energy landscape in Europe
 President of Energy Sector, South West Europe, Siemens Competitive energy landscape in Europe Brussels, siemens.com/answers Agenda Europe s competitiveness depends on an affordable and reliable energy
Low Carbon Development in Africa
 ClimDev-Africa Low Carbon Development in Africa Youba SOKONA African Climate Policy Centre (ACPC) Climate Change Meets Policy Outline This presentation covers: Climate change in Africa Developmental challenges
BP Energy Outlook 2017 edition
 BP Energy Outlook 217 edition Margaret Chen Head of China Economist bp.com/energyoutlook #BPstats Economic backdrop Contributions to GDP growth by factor Contributions to GDP growth by region % per annum
Water Policy and Poverty Reduction in Rural Area: A Comparative Economywide Analysis for Morocco and Tunisia
 Water Policy and Poverty Reduction in Rural Area: A Comparative Economywide Analysis for Morocco and Tunisia Workshop on Agricultural Trade and Food Security in the Euro-Med Area Antalya, Turkey, September
Estonia Energy efficiency report
 Estonia Energy efficiency report Objectives: 2.1 TWh of end-user energy savings by 2016 25% share of renewables in final energy consumption by 2020 4.8% share of renewables in electricity production by
Energy technology roadmaps. Introduction to Energy Technology Roadmaps
 Introduction to Energy Technology Roadmaps OECD/IEA 2012 Overview Global context for energy technology roadmaps About technology roadmaps How-to-guide and roadmap process Examples of IEA roadmaps Key technologies
Chapter 1 Purpose of the Study
 Chapter 1 Purpose of the Study The risk of adverse climate change from global warming forced in part by growing greenhouse gas emissions is serious. While projections vary, there is now wide acceptance
Sustainable Energy. Ecologically Sustainable Energy. Implications for the Sydney Region
 Sustainable Energy Implications for the Sydney Region Dr Mark Diesendorf Institute of Environmental Studies, UNSW m.diesendorf@unsw.edu.au 1 Ecologically Sustainable Energy Efficient energy use and energy
Potential for CCS in India: Opportunities and Barriers
 Potential for CCS in India: Opportunities and Barriers Pradeep Kumar Dadhich Senior Fellow, TERI, New Delhi, India Presented United Nations Department of Economic and Social Affairs : Expert Group Meeting
Decent work and the environmental dimension in the 2030 Agenda
 Decent work and the environmental dimension in the 2030 Agenda Moustapha Kamal Gueye Policy specialist, Green Jobs Programme, ILO 1 Learning objectives 1. To understand better how environmental issues
Chapter 4. Cambodia Country Report. September 2016
 Chapter 4 Cambodia Country Report September 2016 This chapter should be cited as Sarasy, C. (2016), Cambodia Country Report in Kimura, S. and P. Han (eds.) in Energy Outlook and Energy Saving Potential
BP Energy Outlook 2016 edition
 BP Energy Outlook 216 edition Spencer Dale, group chief economist Outlook to 235 bp.com/energyoutlook #BPstats Disclaimer This presentation contains forward-looking statements, particularly those regarding
Korea s Green Growth Vision and Five-Year Plan
 Korea s Green Growth Vision and Five-Year Plan Nov 2009 JinBae Hong Director, Presidential Committee on Green Growth Why is Korea striving for Green Growth? Climate change impact - average temperature
Comparative analysis of greenhouse gas emissions from major cities of India
 International Journal of Renewable Energy and Environmental Engineering ISSN 2348-0157, Vol. 02, No. 01, January 2014 Comparative analysis of greenhouse gas emissions from major cities of India SRIDEVI
NEW BRUNSWICK AND CLIMATE CHANGE
 NEW BRUNSWICK AND CLIMATE CHANGE Progress Report Summary 2014 2015 DELIVERING SUSTAINED RESULTS NEW BRUNSWICK AND CLIMATE CHANGE Delivering sustained results Climate change represents an urgent and potentially
Discussion on the Threat of Electrification to Residential Natural Gas Demand
 Discussion on the Threat of Electrification to Residential Natural Gas Demand Prepared for the American Gas Association State Affairs Committee Tuesday, October 10 h, 2017 Mike Sloan Managing Director
China s Energy Efficiency Policies PRADEEP PERERA PRINCIPAL ENERGY SPECIALIST EAST ASIA DEPARTMENT ASIAN DEVELOPMENT BANK
 China s Energy Efficiency Policies PRADEEP PERERA PRINCIPAL ENERGY SPECIALIST EAST ASIA DEPARTMENT ASIAN DEVELOPMENT BANK 1 PRC s Energy Consumption Mix 12% 22% 5% 25% 58% 11% 3% 9% 13% Housing Commercial
U.S. Carbon Dioxide Emissions in 2009: A Retrospective Review
 U.S. Carbon Dioxide Emissions in 2009: A Retrospective Review The U.S. Energy Information Administration (EIA) recently expanded its reporting of energyrelated carbon dioxide emissions starting in the
Stop and Switch Suicidal Subsidies and The Climate Solution
 Stop and Switch Suicidal Subsidies and The Climate Solution Introduction: the big missing climate solution Today, we are fixed on a world energy economic scenario that will lead to a global temperature
Understanding INDCs. Overview of the MILES Project. Thomas Spencer, IDDRI [And the whole MILES consortium!]
![Understanding INDCs. Overview of the MILES Project. Thomas Spencer, IDDRI [And the whole MILES consortium!]](/thumbs/75/72795520.jpg "Understanding INDCs. Overview of the MILES Project. Thomas Spencer, IDDRI [And the whole MILES consortium!]") Understanding INDCs Overview of the MILES Project Thomas Spencer, IDDRI [And the whole MILES consortium!] thomas.spencer@iddri.org Institut du Développement Durable et des Relations Internationales 41
Understanding INDCs Overview of the MILES Project Thomas Spencer, IDDRI [And the whole MILES consortium!] thomas.spencer@iddri.org Institut du Développement Durable et des Relations Internationales 41
Modelling the economic impact of New Zealand s post-2020 climate change contribution
 Modelling the economic impact of New Zealand s post-2020 climate change contribution Modelling the economic impact of New Zealand s post-2020 climate change contribution Adam Daigneault Prepared for:
Table of Contents. 1. Basic Viewpoints for Energy Policy has evolved from. 2. No energy is perfect in light of 3E+S
 1 2 Table of Contents 1. Basic Viewpoints for Energy Policy has evolved from 3E to 3E+S 2. No energy is perfect in light of 3E+S 3. What has resulted from all the reactors being off line 4. Is nuclear
EU Energy Roadmap: Learning and intermittency. Johannes Bollen
 EU Energy Roadmap: Learning and intermittency Johannes Bollen MERGE-CPB model Intertemporal Optimization Welfare 9 regions, Pareto-efficiency top-down production, bottom-up energy (vintages electricity)
Roadmap for Solar PV. Michael Waldron Renewable Energy Division International Energy Agency
 Roadmap for Solar PV Michael Waldron Renewable Energy Division International Energy Agency OECD/IEA 2014 IEA work on renewables IEA renewables website: http://www.iea.org/topics/renewables/ Renewable Policies
Client Name/Presentation Title
 Client Name/Presentation Title MARCH 2 Introduction This presentation will address the following topics: Comparative levelized cost of energy for various technologies on a $/MWh basis, including sensitivities,
INDONESIA REGIONAL OVERVIEW
 Since the Asian Financial Crisis of the late 1990s, Indonesia s economy has grown at a rapid pace. As one of the leading developing economies, and a member of the G20 of the world s most influential economies,
WORLD ENERGY OUTLOOK Dr. Fatih Birol Chief Economist Head, Economic Analysis Division
 WORLD ENERGY OUTLOOK 2002 Dr. Fatih Birol Chief Economist Head, Economic Analysis Division World Energy Outlook Series World Energy Outlook 1998 World Energy Outlook - 1999 Insights: Looking at Energy
Review of existing emissions pathways and evaluation of decarbonisation rates
 Review of existing emissions pathways and evaluation of decarbonisation rates June 2014 Authors: Olivier Dessens 1, Gabrial Anandarajah 1, and Ajay Gambhir 2. 1 UCL Energy Institute 2 Grantham Institute,
Transport, Energy and CO2: Moving Toward Sustainability
 INTERNATIONAL AGENCY Transport, Energy and CO2: François Cuenot, IEA Expert Group Meeting on Transport for Sustainable Development, 27 August 2009 Index Transport Sector in the big picture Oil demand,
Analyses market and policy trends for electricity, heat and transport Investigates the strategic drivers for RE deployment Benchmarks the impact and c
 Paolo Frankl Head Renewable Energy Division International Energy Agency Institute of Energy Economics, Japan (IEEJ) Energy Seminar Tokyo, 7 March 2012 OECD/IEA 2011 Analyses market and policy trends for
Co-authors: Dr. Popi KONIDARI, Anna FLESSA M.Sc. National and Kapodistrian University of Athens - Energy Policy and Development Centre
 PROMITHEAS 4 Knowledge transfer and research needs for preparing mitigation/adaptation policy portfolios (Contract No. 265182) Evaluation of Mitigation / Adaptation policy portfolios for Bulgaria Author:
Sri Lanka s Market Readiness Proposal
 Sri Lanka s Market Readiness Proposal 17 th Meeting of the Partnership Assembly (PA17) Tokyo, Japan 24 26 October, 2017 Ministry of Mahaweli Development and Environment Government of Sri Lanka Outline
Analysis of Fossil Fuel Subsidies in Kazakhstan
 Analysis of Fossil Fuel Subsidies in Kazakhstan Lyazzat Nugumanova* *Lyazzat Nugumanova Justus Liebig University of Giessen PhD Student Zeughaus, Senckenberbergstrasse 3, D-35390 Giessen 0641-99-37063
E 3 M Lab, Institute of Communication and Computer Systems. The MENA-EDS Model. Middle East and North Africa Energy Demand and Supply Model
 E 3 M Lab, Institute of Communication and Computer Systems The MENA-EDS Model Middle East and North Africa Energy Demand and Supply Model September, 2012 Table of Contents 1. INTRODUCTION... 3 2. SECTORAL
Hà Nội, ngày 09 tháng 10 năm 2009
 BỘ TÀI NGUYÊN VÀ MÔI TRƯỜNG Hà Nội, ngày 09 tháng 10 năm 2009 VIET NAM CLEAN TECHNOLOGY FUND INVESTMENT PLAN PRESENTATION TO CTF TRUST FUND COMMITTEE Tran Thi Minh Ha, Director General of International
An Environmental Outlook to 2050: focussing on Climate Change
 An Environmental Outlook to 2050: focussing on Climate Change Rob Dellink OECD Environment Directorate Chapter co-authors: Virginie Marchal (ENV), Detlef van Vuuren (PBL), Christa Clapp (ENV), Jean Chateau
Energy Policy: the négawatt Scenario for France by Yves Marignac NegaWatt, France
 sufficiency, efficiency, renewables Getting Ready for Zero Emissions and 100% Renewable Energy: Plans and Scenarios to Pave the Way for the Transition 10 December, 2015-11:15-12:45 - Room 2 Side event
ITALY % 34, , G20 average BROWN TO GREEN: THE G20 TRANSITION TO A LOW-CARBON ECONOMY 2017 CLIMATE ACTION TRACKER
 BROWN TO GREEN: THE G2 TRANSITION TO A LOW-CARBON ECONOMY 217 HUMAN DEVELOPMENT INDEX 1.89.7 G2 average Source: UNDP, 216 This country profile assesses s past, present and indications of future performance
Paul Scherrer Institut
 Wir schaffen Wissen heute für morgen Paul Scherrer Institut Evangelos Panos, Martin Densing, Kathrin Volkart Achieving universal electricity access by 2030 in a sustainable way IEW 2015, Abou Dhabi PSI,
The challenges of a changing energy landscape
 The challenges of a changing energy landscape October 26 th 2016 Maria Pedroso Ferreira EDP Energy Planning maria.pedrosoferreira@edp.pt Agenda 1 A changing energy landscape 2 Challenges and opportunities