HYDROLOGY REPORT HEACOCK & CACTUS CHANNELS MORENO VALLEY, CALIFORNIA NOVEMBER 2005 REVISED APRIL 2006 REVISED AUGUST 2006
|
|
|
- Kory Manning
- 6 years ago
- Views:
Transcription


1 HYDROLOGY REPORT HEACOCK & CACTUS CHANNELS MORENO VALLEY, CALIFORNIA NOVEMBER 2005 REVISED APRIL 2006 REVISED AUGUST 2006 RIVERSIDE COUNTY FLOOD CONTROL AND WATER CONSERVATION DISTRICT
2 TABLE OF CONTENTS GENERAL DESCRIPTION... 1 Introduction... 1 Purpose... 1 Study Area... 1 Existing Watershed... 1 Existing Condition... 4 Cactus Channel... 4 Heacock Channel...4 HYDROLOGIC MODEL... 4 Existing & Future Conditions... 4 Data and Program Resources... 5 Precipitation... 5 Precipitation Loss... 6 Percent Impervious Cover... 6 Routing Method... 6 HEC-1 RESULTS... 8 VALIDATION OF HEC-1 RESULTS... 9 CONCLUSION REFERENCES LIST OF FIGURES Figure 1 VICINITY MAP... 2 Figure 2 SUNNYMEAD WATERSHED... 3 LIST OF TABLES Table 1 Pigeon Pass Rain Gauge... 5 Table 2 Summary of Areally Adjusted Precipitation... 6 Table 3 Percent Impervious Cover... 7 Table 4 Summary of HEC-1 Model Peak Discharges... 8 Table 5 USGS Selected stream Gauges... 9 Table 6 FFA ProgramOutput for Warm Creek Gaged Site & USGS Regression Analysis LIST OF EXHIBITS Exhibit 1 Hydrology Map Exhibit 2 Land Use Map Appendix "A" - HEACOCK & CACTUS CHANNELS, HEC-1 OUTPUT FILES Including Hydrology Maps - i -
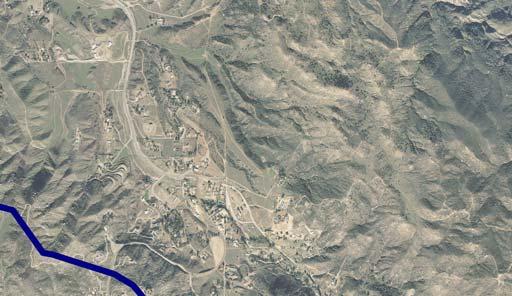
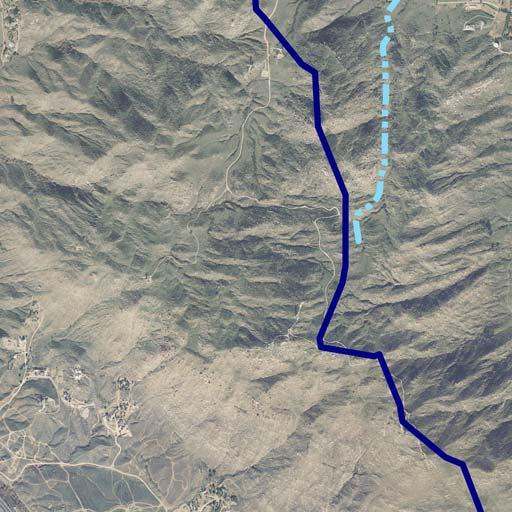
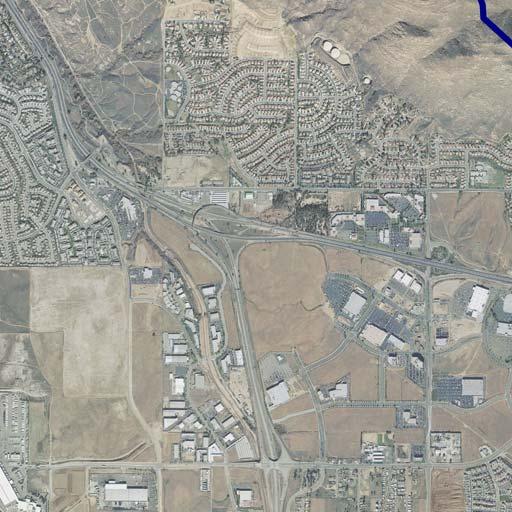
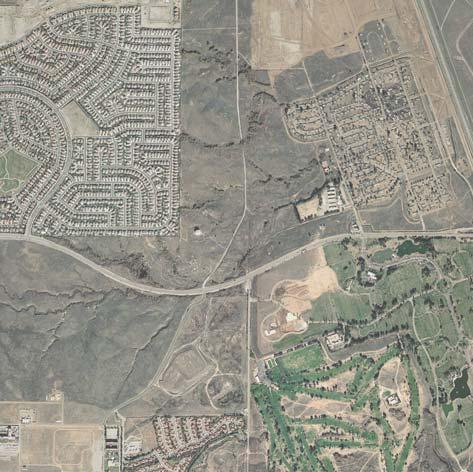
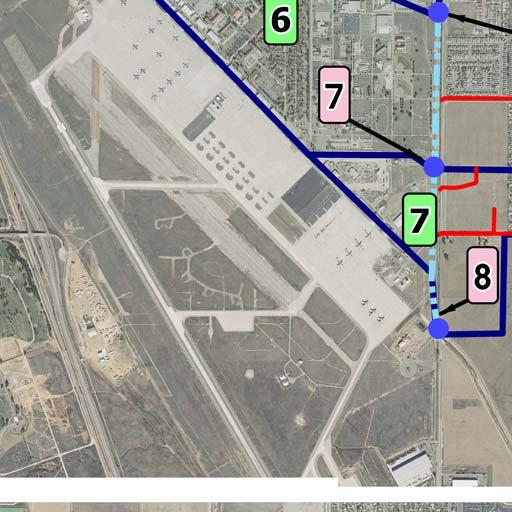
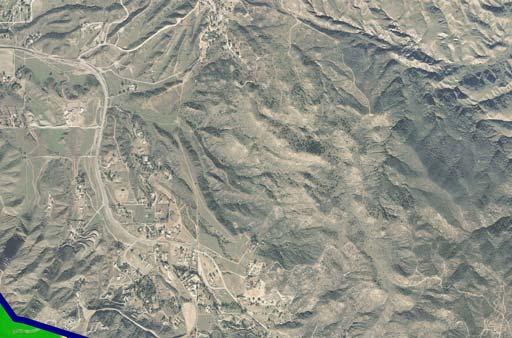
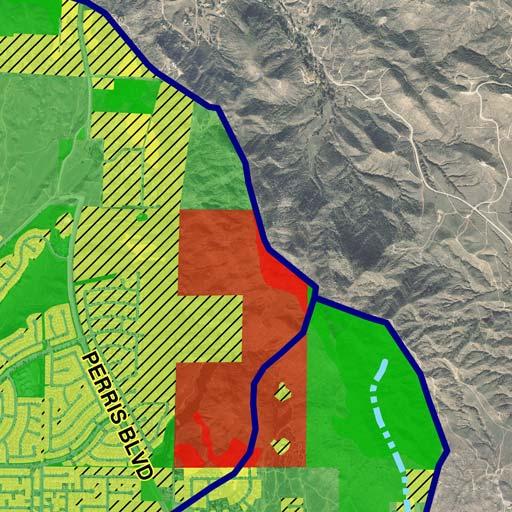
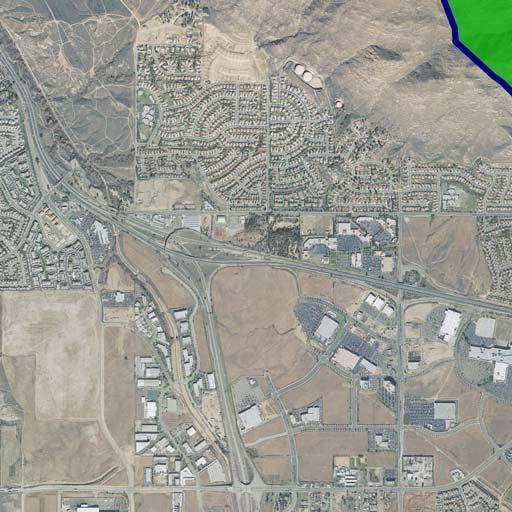
3 GENERAL DESCRIPTION Introduction This report presents the results of the existing condition hydrology study for flood control facilities along Heacock Avenue and Cactus Street, in the city of Moreno Valley, Riverside County, State of California as shown in Figure 1 VICINITY MAP. The report is prepared by the Riverside County Flood Control and Water Conservation District (District) which is the lead local sponsor agency providing in-kind services to the United States Army Corps of Engineers (Corps). Purpose The purpose of this study is to determine the peak flows along the Heacock Avenue and Cactus Street Channels for the purpose of having the Corps design these flood control facilities to provide critically needed flood protection to March Air Reserve Base (MARB) and adjacent residential and commercial areas within the city of Moreno Valley. Study Area The study area is located in western Riverside County, west and south of the city of Moreno Valley, southeast of the city of Riverside, and north of the city of Perris, encompassing MARB, approximately 60 miles east of Los Angeles and 90 miles northeast of San Diego. The boundary of the study area is the Sunnymead watershed as shown in Figure 2 SUNNYMEAD WATERSHED, and it includes two earthen channels that are subject to flooding within the MARB, as well as residential and commercial property in the city of Moreno Valley. Cactus Channel flows west to east into Heacock Channel, which flows north to south, then outlets into the Perris Valley Storm Drain Lateral A, which flows west to east. Existing Watershed The Sunnymead watershed of approximately 20 square miles (12,800 acres) is tributary to this location. The headwaters of the watershed begin along the ridgeline of the Box Springs Mountains to the north of the city of Moreno Valley. Elevations in this mountain region reach a height of 3,700 feet at Point Reach, to a low point of 1,670 feet at Pigeon Pass Dam. Pigeon Pass Dam was constructed by the District in 1957 and has 912 acre-feet of storage volume to the spillway. The dam has significant flood retention capabilities with a peak discharge of 120 cfs during a 100-year frequency storm. Downstream of the dam, flows enter a concrete-lined trapezoidal channel that varies from a 2-foot bottom, 5-foot deep channel built in 1966, to a 14-foot bottom, 7-foot deep section built in South of the Pigeon Pass Dam, development has continued on the alluvial fan area
4 PIGEON PASS DAM LEGEND: Figure 1 - VICINITY MAP - 2 -


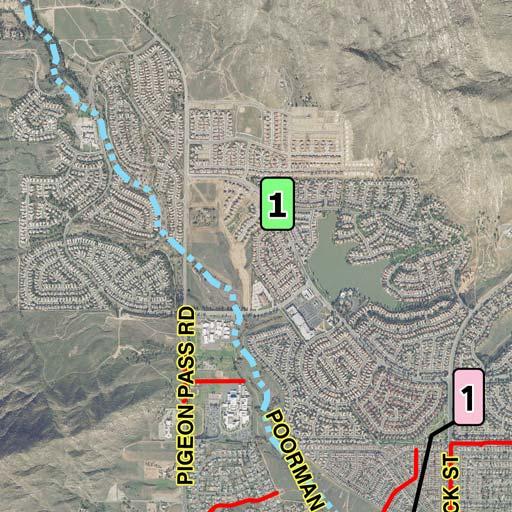
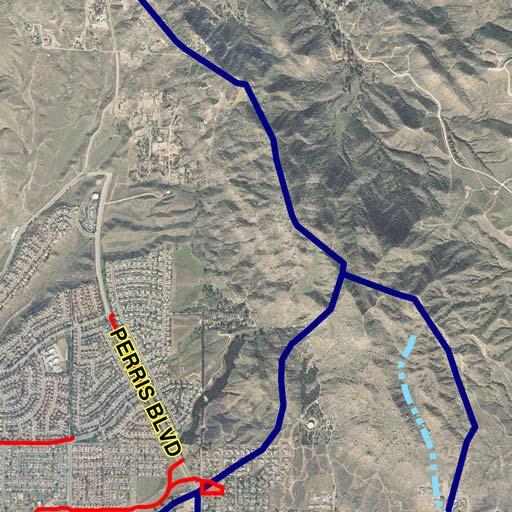
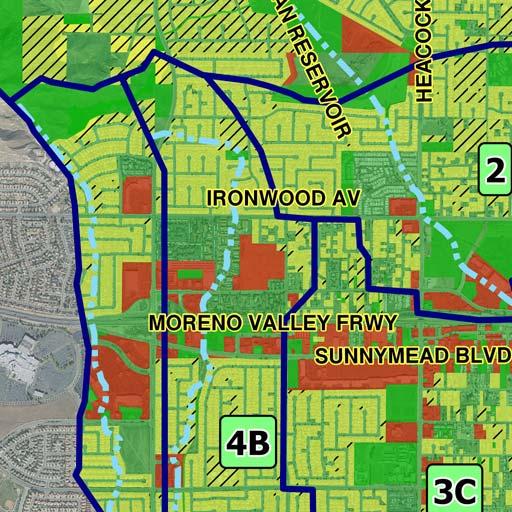
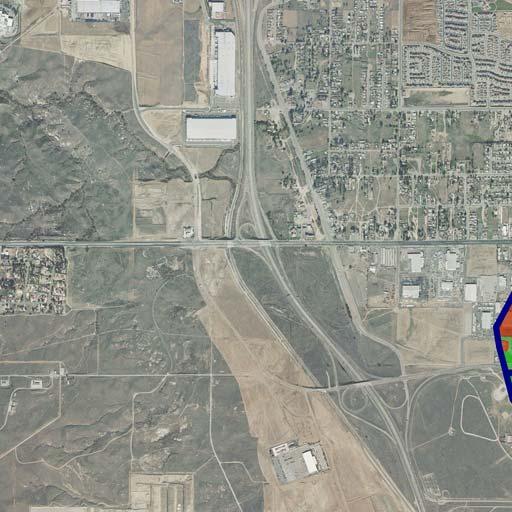
5 Figure 2 - SUNNYMEAD WATERSHED - 3 -

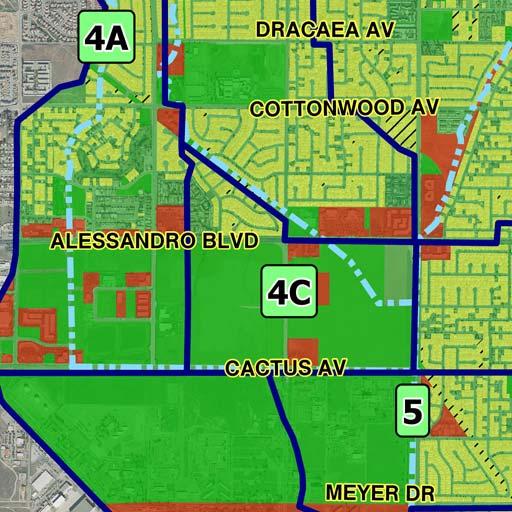
6 Existing Condition Cactus Channel Cactus Channel is a vegetated earthen channel located south of Cactus Street and north of MARB. The earthen channel collects flows discharging from storm drains along Elsworth, Frederick and Graham Streets, as well as local sheet flows from the north. These storm drains collect and convey runoff from a commercial area within the city of Moreno Valley just north of the channel. Cactus Channel receives sheet flows and flows from six additional small culverts that discharge at various locations. Flooding has been noted along Cactus Channel, more frequently at the intersections of Cactus Avenue and Elsworth Street, and Cactus Avenue and Graham Street. Once the channel reaches its limited capacity, flows easily overtop the banks flooding the roadway to the north and sheet flowing across MARB to the south. This condition consistently occurs during small to moderate storms due to the undersized and vegetated condition of the channel. On October 20, 2004, the Acting Installation Commander closed the runway and sent non-mission essential personnel home due to the flooded conditions. MARB has been the primary departure point for the United States Marines and cargo from Camp Pendleton and Twentynine Palms Marine Corps bases. (See pictures below) Cactus Channel Looking East Cactus Channel Flooding Heacock Channel Heacock Channel, a concrete trapezoidal channel, varies in size from a 14-foot bottom width, 8-foot deep section at its upstream terminus at Heacock Street and Alessandro Boulevard, to a 16-foot bottom width, 9-foot deep section with 1.5:1 (Horizontal:Vertical) sideslopes as it approaches Cactus Street. The south end of the improved Heacock Channel is a double 11-foot wide, 10-foot deep box culvert, which is also the north end of the subject Heacock Avenue channel at Cactus Street. The natural wash downstream of Cactus Street is in various states of disrepair with minimal capacity. Downstream of Cactus, there is significant erosion within the first 0.5 mile of the channel. This 2-mile reach of the Heacock Channel conveys approximately 75 percent of the runoff from the Sunnymead watershed. During the winter storms of 2004 (approximately 10-yr storm events), Heacock Channel overtopped between John F. Kennedy Drive and Iris Avenue. The inadequate capacity of Heacock Channel also caused the local tributary storm drains to back up easterly on Iris Avenue and Gentian Avenue. Road closures were - 4 -
7 implemented at Heacock Street, Cardinal Street, Iris Street, Indian Street and Gentian Avenue at Heacock Street due to flooding hazard. (See pictures below) Heacock Channel Looking South Heacock Channel Looking North below Cactus Ave. HYDROLOGIC MODEL Existing & Future Conditions The existing/base condition is considered the same as the future condition for the Heacock and Cactus Channels, see Exhibit 1 - "Hydrology Map". This assumption is based on the fact that the watershed is almost fully developed and most flood control facilities upstream and downstream of the Heacock Channel have been constructed. All assumptions in the development of the hydrologic model assumed full development. Few areas are still in the process of being developed, such as the area north of the Cactus Channel which contributes a small percent of the runoff to the Cactus Channel and, therefore, is assumed to be fully developed. The City of Moreno Valley provided planning information regarding the potential construction of two basins at the northwest corner of Cactus Avenue and Heacock Street. However, due to the small tributary area, the proposed basins are not considered in the hydrologic model for the Cactus Channel. Data and Program Resources This study was prepared using the Corps' HEC-1 program version 4.1, LAPRE-1 which is a preprocessor program to HEC-1, USGS 7.5 Minute topographic quad maps, the Sunnymead Master Drainage Plan and point precipitation rainfall frequency estimates from the District's Hydrologic Data Collection Section, USGS National hydrology datasets, and area reduction factors from the District's Hydrology Manual. These resources were used to identify the representative tributary watershed areas, watercourses and other data needed for this study. Precipitation The District maintains records of point precipitation data through rain gauge stations within Riverside County. The District analyzes this data based on methods described by the State of California, Department of Water Resources (DWR) in Bulletin Number 195. Evaluation of one rain gauge frequency analysis data representative of the Sunnymead watershed is shown in Table 1 Pigeon Pass Rain Gauge. The District's Hydrology Manual also tabulates a rainfall pattern in Plate E-5.9 for use with the - 5 -
8 Synthetic Unit Hydrograph Method. The rainfall pattern used in the development of the flood hydrographs is from the Indio storm of September 24, 1939, the largest thunderstorm of record in the Whitewater River basin. The pattern used in the HEC-1 analysis is for the 3-hour storm and is considered to represent a reasonable distribution of rainfall which will cause critical runoff condition during major storm events for this watershed. Point rainfall was then adjusted by areal adjustment factor for 9 square miles and 20 square miles. The areal adjustment factors were derived from Plate E-5.8 of the District's Hydrology Manual which is based on NOAA Atlas 2. These factors were applied to the following frequencies: 2, 5, 10, 25, 50, 100, 200 and 500 year for the 3-hour storm. Table 2 - Summary of Areally Adjusted Precipitation represents a summary of the areally adjusted precipitation for various frequencies. Table 1 - Pigeon Pass Rain Gauge Short Duration-Precipitation Frequency Data Return Period In Years 5M 10M 15M 30M 1H 2H 3H 6H 12H 24H TOTAL n/a n/a n/a n/a n/a n/a n/a n/a n/a n/a n/a PMP n/a Record Maximum Record Year 1981/ / / / / / / / / / N (Years) Mean
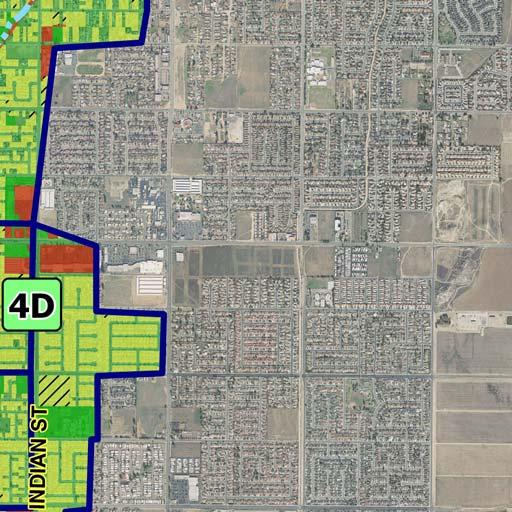
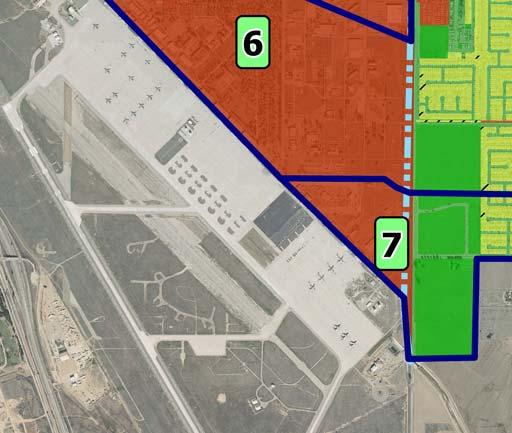
9 Table 2 - Summary of Areally Adjusted Precipitation Point Precipitation Frequency for Pigeon Areally Adjusted Pass Rain Gauge Data Return Period (Years) Unadjusted 3-hour Precp.(in/hr) DA=8.948sm (97.5%) DA=19.993sm (94.5%) Rate Loss Rate loss was modeled using the initial and constant loss rate method which is implemented using the LU card in the HEC-1 model. During the final calibration procedures and to validate the HEC-1 results, the initial and constant loss rate values were estimated as 0.1-inch and 0.35 inch per hour respectively for storms with 500-, 200- and 100- year return periods. However, for storms with 50-, 25-, 10-, 5- and 2- year return periods, the initial and constant loss rate values were estimated as 0.1 inch and 0.40 inch per hour, respectively. Percent Impervious Cover Percent impervious cover for each subarea was determined by areally weighting the percent impervious cover assigned to each land use as recommended by Plate E-6.3 of the District's Hydrology Manual. Based on engineering judgment, the percent impervious cover for the various subareas have been changed to a maximum percent impervious cover of 50%. See Table 3 - Percent Impervious Cover for a summary of the values used in the HEC-1 model. The Land Use Map is presented in Exhibit 2 - "Land Use Map". Routing Method Flood routing in the existing flood control facilities was based on the Muskingum-Cunge method. Input parameters for this method was based on information from the as-built drawings for the existing flood control facilities, however, a minimum of 0.12 hour for the Muskingum-Cunge coefficient "K" factor was adopted based on engineering judgment
10 SUBAREA Area 1 Area 2 Area 3A Area 3B Area 3C Area 4B Table 3 - Percent Impervious Cover % IMP % IMP % IMP % IMP % ASSIGNED % Calc'd Used % ASSIGNED % Calc'd Used PRESENT LAND COVERAGE IMPERVIOUS Future Future SUBAREA PRESENT LAND COVERAGE IMPERVIOUS Future Future 52 Natural - Agricultural Natural - Agricultural Light Urban Light Urban Acre Residential Acre Residential /2 Acre Residential /2 Acre Residential /4 Acre Residential /4 Acre Residential Conds 65 0 Area 4D Conds Apartments 80 0 Apartments Mobile Home Park 75 0 Mobile Home Park 75 0 Buisness & Industrial Buisness & Industrial Natural - Agricultural Natural - Agricultural Light Urban Light Urban Acre Residential Acre Residential /2 Acre Residential /2 Acre Residential /4 Acre Residential /4 Acre Residential Conds 65 0 Area 4A Conds 65 0 Apartments 80 0 Apartments 80 0 Mobile Home Park 75 0 Mobile Home Park Buisness & Industrial Buisness & Industrial Natural - Agricultural Natural - Agricultural Light Urban Light Urban Acre Residential Acre Residential /2 Acre Residential /2 Acre Residential /4 Acre Residential /4 Acre Residential 50 2 Conds 65 0 Conds 65 0 Area 4C Apartments 80 0 Apartments 80 0 Mobile Home Park 75 0 Mobile Home Park Buisness & Industrial Buisness & Industrial (ultimate) Natural - Agricultural Natural - Agricultural Light Urban Light Urban Acre Residential Acre Residential /2 Acre Residential /2 Acre Residential /4 Acre Residential /4 Acre Residential Conds 65 0 Conds 65 0 Area 5 Apartments 80 0 Apartments 80 0 Mobile Home Park 75 0 Mobile Home Park 75 0 Buisness & Industrial Buisness & Industrial Natural - Agricultural Natural - Agricultural Light Urban 8 4 Light Urban Acre Residential Acre Residential /2 Acre Residential /2 Acre Residential /4 Acre Residential /4 Acre Residential Conds 65 0 Conds 65 0 Apartments 80 0 Area 6 Apartments 80 0 Mobile Home Park 75 0 Mobile Home Park 75 0 Buisness & Industrial Buisness & Industrial Natural - Agricultural Natural - Agricultural Light Urban 8 0 Light Urban Acre Residential Acre Residential /2 Acre Residential /2 Acre Residential /4 Acre Residential /4 Acre Residential Conds 65 0 Conds 65 0 Apartments 80 0 Area 7 Apartments 80 0 Mobile Home Park 75 0 Mobile Home Park Buisness & Industrial Buisness & Industrial
11 HEC-1 RESULTS The Corps' HEC-1 computer program was used to determine peak discharges for the 2-, 5-, 10-, 25-, 50-, 100-, 200- and 500-year storm events. HEC-1 output files for Heacock and Cactus Channels at various concentration points for each storm event are presented in Appendix A. Summary of the peak discharge results are shown in Table 4 - Summary of HEC-1 Model Peak Discharges. Table 4 - Summary of HEC-1 Model Peak Discharges Conc. Discharges (ft 3 /s) Point # Location DA (mi) YR 200-YR 100-YR 50-YR 25-YR 10-YR 5-YR 2-YR 1 Upstream of Pigeon Pass Reservoir Downstream of Pigeon Pass Reservoir Upstream of Festival Development Basin Downstream of Festival Development Basin Downstream of confluence for Sunnymead Ch. Stage 1 & Pigeon Pass Ch Heacock Alessandro Blvd B Downstream of confluence for Heacock Ch. & Sunnymead MDP Line F A Cactus Ch. Tributary to Area 4A AC Cactus Ch. just upstream of Heacock Ch. confluence tributary to Areas 4A & 4C Downstream of confluence for Heacock Ch. & Cactus Ch Downstream of confluence for Heacock Ch. & MARB lateral south of Meyer Dr./JFK Dr Downstream of confluence for Heacock Ch. & MARB lateral north of Iris Avenue Upstream of confluence for Heacock Ch. & MARB lateral south of Iris Avenue
12 VALIDATION OF HEC-1 RESULTS The District evaluated the reasonableness of flood discharge estimates obtained from the HEC-1 model by comparing the discharge values to the discharge values obtained from various data sets developed by the following procedures: Research of available published stream gauge data, near the project site, from U.S.Geological Survey (USGS). Three stream gauges were selected based on drainage area and proximity to the project site. The three stream gauges are listed in Table 5 - USGS Selected Stream Gauges Table 5 - USGS Selected Stream Gauges Gauge # Gauge Name Gauge Records (Years) USGS Bautista Creek North Hemet, CA. 22 USGS Cajon Creek North Keenbrook, CA. 58 USGS Warm Creek Floodway San Bernardino, CA. 20 USGS data sets were used as input into a Flood Frequency Analysis (FFA) program developed by the Corps. In the FFA program, a Log-Pearson Type III distribution was used to analyze the data to compute the frequency curve in accordance with "Guidelines for Determining Flood Flow Frequency", Bulletin 17B by Water Resources Council, September After researching the National Oceanic & Atmospheric Administration (NOAA) data, annual precipitation records were checked for all three gauges. The Cajon Creek stream gauge showed a high annual precipitation and, therefore, was not considered for the calibration since it is not representative of the Sunnymead watershed. The first data set was developed for each gauge based on the yield values obtained from the FFA program output file for 500-, 200-, 100-, 50-, 25-, 10-, 2-year storm events. These values were then transposed to the Heacock site by using the yield discharge values and multiplying it by the unregulated drainage area of 9 square miles for Pigeon Pass Reservoir. These values are summarized in Table 6 - FFA Program Output for Warm Creek Gaged Site & USGS Regression Analysis The second data set was developed based on the USGS regression equations obtained from "Nationwide Summary of U.S. Geological Survey Reqional Regression Equations for Estimating Magnitude and Frequency of Floods for Ungaged Sites, 1993" by USGS, Water-Resources Investigations Report This reference listed regression equations for regions within each State. For southern California, the South Lahontan-Colorado Desert Region set of equations were selected since it simulates a desert type environment. These equations were used for the transposition of the values for the gaged site obtained from the FFA output file to the ungaged Heacock site by multiplying the discharge values by the ratio obtained from dividing the USGS regression Q's at Heacock over the regression Q's at the gaged site. These values are also summarized in Table 6. Based on a comparison of all data sets, the regression analysis for the Warm Creek stream gauge results show a discharge at Pigeon Pass estimated at 3,713 cfs. The HEC-1 model results show an estimated discharge of 4,176 cfs at Pigeon Pass Dam. Based on that, the District concludes that the results of the HEC-1 model, attached as Appendix A, provides a reasonable estimate of discharges
13 Table 6 - FFA Program Output for Warm Creek Gaged Site & USGS Regression Analysis FFA results Warm Creek San Bernardino, CA NOAA average Annual Precipitation = 15.0 inches Drainage Area = 47.8 square miles Heacock-Pigeon Pass (Q@gage adjusted by drainage area ratio) Heacock Site Elevation = 1485 above MSL NAVD 88 NOAA average Annual Precipitation = 13.8 inches Drainage Area = square miles USGS Regression Equation South Lahontan Colorado Desert Region Un-gaged Site at Heacock- Pigeon Pass Gaged Warm Creek Heacock- Pigeon Pass (Q@gage adjusted by USGS Regression ratio Freq. Event From FFA output File Discharge Computed HEC-1 results (cfs) (cfs) (cfs) (cfs) (cfs) CONCLUSION The District performed a HEC-1 hydrologic model for Heacock and Cactus Channels at various concentration points. Results of the HEC-1 model output files for 2-, 5-, 10-, 25-, 50-, 100-, 200- and 500-year storm events are included in Appendix A and summarized in Table 4 - Summary of HEC-1 Model Peak Discharges. Based on the HEC-1 model and the calibration procedures followed in this report, the District concludes that the results of the HEC-1 model attached provide a reasonable estimate of the peak discharges for Heacock and Cactus Channels project
14 REFERENCES 1. Riverside County Flood Control and Water Conservation District - Hydrology Manual 2. Riverside County Flood Control and Water Conservation District - Sunnymead Master Drainage Plan 3. State of California, the Resources Agency, Department of Water Resources Rainfall Analysis for Drainage Design, Volume I "Short-Duration Precipitation Frequency Data" Bulletin # U.S. Army Corps of Engineers, Los Angeles District, LAPRE-1 (Preprocessor to HEC-1), Users Manual 5. U.S. Army Corps of Engineers, the Hydrologic Engineering Center HEC-1 Flood Hydrograph Package Users Manual 6. U.S. Army Corps of Engineers, the Hydrologic Engineering Center HEC-FFA Flood Frequency Analysis, Users Manual 7. USGS - Nationwide Summary of U.S. Geological Survey Reqional Regression Equations for Estimating Magnitude and Frequency of Floods for Ungaged Sites, 1993" by USGS, Water- Resources Investigations Report


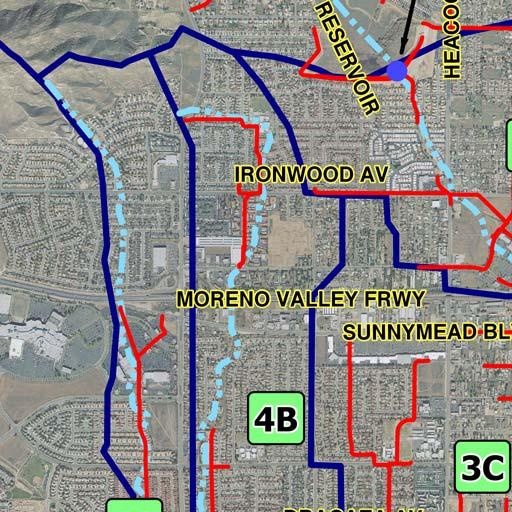
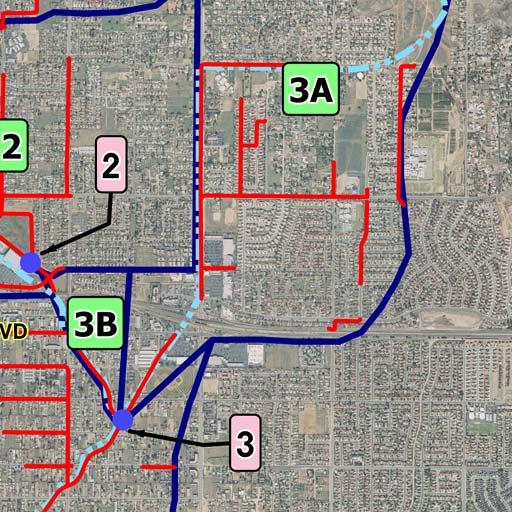

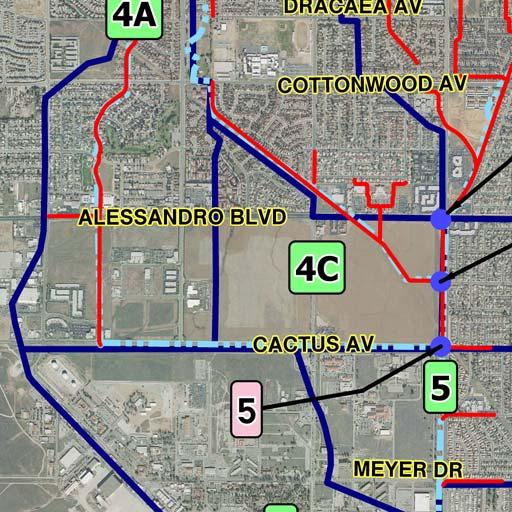


15 RIVERSIDE COUNTY FLOOD CONTROL AND WATER CONSERVATION DISTRICT RIVERSIDE, CALIFORNIA Legend A AREA ROADS 2 CONCENTRATION POINTS 3C HYDROLOGY AREAS RCFC FACILITIES AREA FLOWLINES EXHIBIT 1 HYDROLOGY MAP SCALE 1"=3000' Miles Kilometers (MAP REVISED 06APR06)


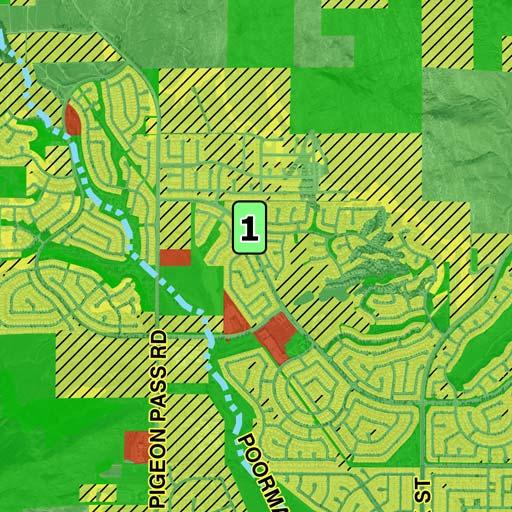


16 RIVERSIDE COUNTY FLOOD CONTROL AND WATER CONSERVATION DISTRICT RIVERSIDE, CALIFORNIA Legend A A AREA ROADS HYDROLOGY AREAS AREA FLOWLINES FINAL LAND USE ANALYSIS COMMERCIAL/INDUSTRIAL LIGHT URBAN NATURAL URBAN EXHIBIT 2 LAND USE MAP SCALE 1"=3000' Miles Kilometers (MAP REVISED 06APR06)
17 APPENDIX "A" HEACOCK & CACTUS CHANNELS HEC-1 OUTPUT FILES - 13-
18 Full HEC-1 output is not included in hard copy (please see digital copy on enclosed CD)
Culvert Sizing procedures for the 100-Year Peak Flow
 CULVERT SIZING PROCEDURES FOR THE 100-YEAR PEAK FLOW 343 APPENDIX A: Culvert Sizing procedures for the 100-Year Peak Flow A. INTRODUCTION Several methods have been developed for estimating the peak flood
Appendix B. Storm Drain System Data
 MENIFEE VALLEY CAMPUS MASTER PLAN FINAL EIR MT. SAN JACINTO COMMUNITY COLLEGE DISTRICT Appendix Appendix B. Storm Drain System Data June 2017 MENIFEE VALLEY CAMPUS MASTER PLAN FINAL EIR MT. SAN JACINTO
Chapter 6. Hydrology. 6.0 Introduction. 6.1 Design Rainfall
 6.0 Introduction This chapter summarizes methodology for determining rainfall and runoff information for the design of stormwater management facilities in the City. The methodology is based on the procedures
Stream Reaches and Hydrologic Units
 Chapter United States 6 Department of Agriculture Natural Resources Conservation Service Chapter 6 Stream Reaches and Hydrologic Units Rain clouds Cloud formation Precipitation Surface runoff Evaporation
CITY OF REDLANDS MASTER PLAN OF DRAINAGE San Bernardino County, California
 CITY OF REDLANDS MASTER PLAN OF DRAINAGE San Bernardino County, California Prepared for City of Redlands 35 Cajon Street Redlands, California 92373 Prepared by 14725 Alton Parkway Irvine, CA 92618 Contact
THE CROSSROADS IN WINCHESTER 4. DRAINAGE PLAN. 4. Drainage Plan. a. Drainage Plan Description
 THE CROSSROADS IN WINCHESTER 4. DRAINAGE PLAN 4. Drainage Plan a. Drainage Plan Description The Specific Plan area drains naturally into two separate watersheds: approximately 6 percent of the Specific
Chapter 6 Hydrology TABLE OF CONTENTS CHAPTER 6 - HYDROLOGY
 Chapter 6 Hydrology TABLE OF CONTENTS CHAPTER 6 - HYDROLOGY... 6-1 6.1 Introduction... 6-1 6.1.1 Objective... 6-1 6.1.2 Definition... 6-1 6.1.3 Factors Affecting Floods... 6-1 6.1.4 Sources of Information...
6.0 Runoff. 6.1 Introduction. 6.2 Flood Control Design Runoff
 October 2003, Revised February 2005 Chapter 6.0, Runoff Page 1 6.1 Introduction 6.0 Runoff The timing, peak rates of discharge, and volume of stormwater runoff are the primary considerations in the design
APPENDIX IV. APPROVED METHODS FOR QUANTIFYING HYDROLOGIC CONDITIONS OF CONCERN (NORTH ORANGE COUNTY)
") APPENDIX IV. APPROVED METHODS FOR QUANTIFYING HYDROLOGIC CONDITIONS OF CONCERN (NORTH ORANGE COUNTY) Hydromodification design criteria for the North Orange County permit area are based on the 2- yr, 24-hr
APPENDIX IV. APPROVED METHODS FOR QUANTIFYING HYDROLOGIC CONDITIONS OF CONCERN (NORTH ORANGE COUNTY) Hydromodification design criteria for the North Orange County permit area are based on the 2- yr, 24-hr
Ponds. Pond A water impoundment made by excavating a pit, or constructing a dam or an embankment.
 POND SITE SELECTION AND CONSTRUCTION Uses, Planning, & Design David Krietemeyer Area Engineer USDA-NRCS June 20, 2008 Uses Considerations for Location of Commonly Used Terms Pond A water impoundment made
Location Drainage Study
 Location Drainage Study PROJECT ROUTE: LIMITS: MUNICIPALITY/COUNTY: JOB NUMBER: IL 47 at Burlington Road 750ft NW to 750ft SE of IL 47(Burlington), & 1000ft S to 1000ft N of Burlington (IL47) Kane County
HYDROLOGIC MODELING CONSISTENCY AND SENSITIVITY TO WATERSHED SIZE
 HYDROLOGIC MODELING CONSISTENCY AND SENSITIVITY TO WATERSHED SIZE by James C.Y. Guo. Professor, Civil Engineering, U. Of Colorado at Denver, James.Guo@cudenver.edu.. And Eric Hsu, Project Engineer, Parson
Bexar County Flood Warning System. Curtis Beitel, PE, CFM, Anthony Henry and Wayne Tschirhart, PE, PMP
 Bexar County Flood Warning System Curtis Beitel, PE, CFM, Anthony Henry and Wayne Tschirhart, PE, PMP Software Overview 2 Processes Hydrometric DB Event Manager Automatic Low = Every 6 hours High = Every
Overview of NRCS (SCS) TR-20 By Dr. R.M. Ragan
 TR-20 By Dr. R.M. Ragan") Overview of NRCS (SCS) TR-20 By Dr. R.M. Ragan TR-20 is a computer program for the simulation of runoff occurring from a single storm event. The program develops flood hydrographs from runoff and routes
Overview of NRCS (SCS) TR-20 By Dr. R.M. Ragan TR-20 is a computer program for the simulation of runoff occurring from a single storm event. The program develops flood hydrographs from runoff and routes
Hydrology for Folsom Dam Water Control Manual Update
 Hydrology for Folsom Dam Water Control Manual Update Brian Walker, EIT Civil Engineer, Hydrology Section U.S. Army Corps of Engineers Sacramento District 1325 J Street Sacramento, CA 95816 Tel: (916) 557-7376
Suspended Sediment Discharges in Streams
 US Army Corps of Engineers Hydrologic Engineering Center Suspended Sediment Discharges in Streams April 1969 Approved for Public Release. Distribution Unlimited. TP-19 REPORT DOCUMENTATION PAGE Form Approved
4.1 Browns Canal Introduction Sub-basin Information
 Section 4 Withlacoochee Basin 4.1 Browns Canal 4.1.1 Introduction The information presented in this sub-basin plan for Browns Canal is intended to provide the reader with information necessary to understand
The surface water hydrology of the site has been logically divided into six phases of monitoring, analyses, and investigation as outlined below:
 SURFACE WATER HYDROLOGY The surface water hydrology of the site has been logically divided into six phases of monitoring, analyses, and investigation as outlined below: Sample Station Locations and Descriptions
December 7, Dr. Christine Pomeroy University of Utah Civil and Environmental Engineering MCE Salt Lake City, UT. Dear Dr.
 December 7, 2012 Dr. Christine Pomeroy University of Utah Civil and Environmental Engineering MCE 2042 Salt Lake City, UT 84112 Dear Dr. Pomeroy, The following document is the final report of the Red Butte
Lyon Creek Cedar Way Stormwater Detention Dam Operation and Maintenance Manual
 Lyon Creek Cedar Way Stormwater Detention Dam Operation and Maintenance Manual Prepared by: Mike Shaw Stormwater Program Manager City of Mountlake Terrace January 2010 Section I General Information This
Project Drainage Report
 Design Manual Chapter 2 - Stormwater 2A - General Information 2A-4 Project Drainage Report A. Purpose The purpose of the project drainage report is to identify and propose specific solutions to stormwater
STORM WATER MANAGEMENT REPORT
 Silvercreek Junction STORM WATER MANAGEMENT REPORT Howitt Creek at the Silvercreek Parkway Site Guelph, Ontario August, 2008 TSH File 22304A-04 August 19, 2008 STORMWATER MANAGEMENT REPORT Howitt Creek
SAN GORGONIO PASS CAMPUS - PHASE I
 SAN GORGONIO PASS CAMPUS - PHASE I Banning, CA DRAINAGE STUDY June 16, 2010 Reference 106-195 PREPARED BY: Encompass Associates, Inc. 5699 Cousins Place Rancho Cucamonga, CA 91737 909-684-0093 Fax-909-586-6979
ND Detention Project Development Update
 ND Detention Project Development Update Upper Red River Basin Halstad, MN = 8 Upstream Subwatersheds Fargo, ND = 3 Upstream Subwatersheds Halstad, MN Fargo, ND Wild Rice Otter Tail Bois de Sioux Upstream
VOLUME 1 TABLE OF CONTENTS
 Santiago Hills Phase II Planned Community and East Orange Planned Community Area 1 Issue Date: 2, May 20055 VOLUME 1 TABLE OF CONTENTS SECTION 1: INTRODUCTION... 1-1 1.1 PROJECT DESCRIPTION... 1-1 1.2
Section 600 Runoff Table of Contents
 Section 600 Runoff Table of Contents 601 INTRODUCTION...600-1 602 RATIONAL METHOD...600-1 602.1 Rational Method Formula...600-2 602.2 Time of Concentration...600-2 602.3 Intensity...600-4 602.4 Runoff
I(n)Kn. A Qp = (PRF) --- (8) tp Where A is the watershed area in square miles and PRF is the unit hydrograph peak rate factor.
Kn. A Qp = (PRF) --- (8) tp Where A is the watershed area in square miles and PRF is the unit hydrograph peak rate factor.") AN ALTERNATE APPROACH FOR ESTIMATING SCS UNIT HYDROGRAPH PEAK RATE FACTORS (PRFS) IN SOUTHWEST FLORIDA Himat Solanki Southwest Florida Water Management District 115 Corporation Way, Venice, Florida 34292
AN ALTERNATE APPROACH FOR ESTIMATING SCS UNIT HYDROGRAPH PEAK RATE FACTORS (PRFS) IN SOUTHWEST FLORIDA Himat Solanki Southwest Florida Water Management District 115 Corporation Way, Venice, Florida 34292
Stormwater Management Studies PDS Engineering Services Division ES Policy # 3-01
 Stormwater Management Studies PDS Engineering Services Division Revised Date: 2/28/08 INTRODUCTION The City of Overland Park requires submission of a stormwater management study as part of the development
Chehalis Basin Strategy Causes of Extreme Flooding. October 11, 2016 Policy Workshop
 Chehalis Basin Strategy Causes of Extreme Flooding October 11, 2016 Policy Workshop Agenda Hydrology o Precipitation o Flow Climate Change Effects Land Use o Channel straightening and incision o Riparian
DRAFT. Jacob Torres, P.E.; Nick Fang, Ph.D., P.E.
 \ Memorandum SSPEED Center at Rice University Department of Civil & Environmental Engineering 6100 Main MS-317 Houston, Texas 77005-1827 sspeed.rice.edu tel: 713-348-4977 To Andy Yung, P.E. CFM; Lane Lease,
Summary of Detention Pond Calculation Canyon Estates American Canyon, California
 July 15, 2015 Bellecci & Associates, Inc Summary of Detention Pond Calculation Canyon Estates American Canyon, California 1. Methodology: Method: Unit Hydrograph Software: Bentley Pond Pack Version 8i
San Antonio Water System Mitchell Lake Constructed Wetlands Below the Dam Preliminary Hydrologic Analysis
 San Antonio Water System enhancement. This recommendation was based on limited water quality data provided by SAWS and using a free-water surface constructed wetland with approximately 112 acres of wetted
iswm TM Technical Manual Hydrology:
 : 1.0 2.0 Downstream Assessment 3.0 Streambank Protection 4.0 Water Balance 5.0 Rainfall Tables 6.0 Hydrologic Soils Data Table of Contents 1.0... HO-1 1.1 Estimating Runoff... HO-1 1.1.1 Introduction
Bird Track Springs Basis of Design Report APPENDIX HYDROLOGIC ANALYSIS FOR BIRD TRACK RESTORATION PROJECT
 Bird Track Springs Basis of Design Report APPENDIX C HYDROLOGIC ANALYSIS FOR BIRD TRACK RESTORATION PROJECT Technical Memorandum Date March 1, 2016 To: From: RE: Mike Knutson, Bureau of Reclamation Nick
Alternative Approaches to Water Resource System Simulation
 US Army Corps of Engineers Hydrologic Engineering Center Alternative Approaches to Water Resource System Simulation May 1972 Approved for Public Release. Distribution Unlimited. TP-32 REPORT DOCUMENTATION
Here is an overview of the material I will present over the next 20 minutes or so. We ll start with statistics, move on to physics, and look at
 1 Here is an overview of the material I will present over the next 20 minutes or so. We ll start with statistics, move on to physics, and look at climate change issues. Then we will move onto discussion
Prepared for Urban Drainage and Flood Control District
 BERM FAILURE TECHNICAL ANALYSES SOUTH PLATTE GRAVEL PIT EVALUATION CRITERIA Prepared for Urban Drainage and Flood Control District Wright Water Engineers, Inc. January 2013 121-030.000 TABLE OF CONTENTS
1. Stream Network. The most common approach to quantitatively describing stream networks was postulated by Strahler (1952).
.") 1. Stream Network The most common approach to quantitatively describing stream networks was postulated by Strahler (1952). First Order Streams streams with no tributaries. Second Order Streams begin at
1. Stream Network The most common approach to quantitatively describing stream networks was postulated by Strahler (1952). First Order Streams streams with no tributaries. Second Order Streams begin at
Natural Condition Report
 Natural Condition Report Ventura River Watershed Hydrology Model Prepared for: Ventura County Watershed Protection District Ventura, CA Prepared by: 1230 Columbia St., Ste. 1000 San Diego, CA 92101 Fax
NEW CASTLE CONSERVATION DISTRICT. through. (Name of Municipality) PLAN REVIEW APPLICATION DRAINAGE, STORMWATER MANAGEMENT, EROSION & SEDIMENT CONTROL
 PLAN REVIEW APPLICATION DRAINAGE, STORMWATER MANAGEMENT, EROSION & SEDIMENT CONTROL") NEW CASTLE CONSERVATION DISTRICT through (Name of Municipality) PLAN REVIEW APPLICATION DRAINAGE, STORMWATER MANAGEMENT, EROSION & SEDIMENT CONTROL Office use only: Received by Municipality: Received by
NEW CASTLE CONSERVATION DISTRICT through (Name of Municipality) PLAN REVIEW APPLICATION DRAINAGE, STORMWATER MANAGEMENT, EROSION & SEDIMENT CONTROL Office use only: Received by Municipality: Received by
Lower Ohio and Middle Mississippi Rivers Flood Management
 Lower Ohio and Middle Mississippi Rivers Flood Management Abstract The Great Lakes and Ohio River Division Water Management Team of the U.S. Army Corps of Engineers (USACE) is responsible for reducing
Hydrology and Water Management. Dr. Mujahid Khan, UET Peshawar
 Hydrology and Water Management Dr. Mujahid Khan, UET Peshawar Course Outline Hydrologic Cycle and its Processes Water Balance Approach Estimation and Analysis of Precipitation Data Infiltration and Runoff
Outlet Structure Modeling
 Watershed Modeling using HEC-RAS Outlet Structure Modeling Jeff Wickenkamp, P.E., CFM, D.WRE Patrick Lach, P.E. Hey and Associates, Inc. Water Resources, Wetlands and Ecology Outline of Presentation Why
COON CREEK WATERSHED DISTRICT PERMIT REVIEW. Spring Lake Park Schools Westwood Middle School st Avenue NE, Spring Lake Park, MN 55432
 PAN 16-112, Westwood Middle School, Page 1 of 6 COON CREEK WATERSHED DISTRICT PERMIT REVIEW MEETING DATE: August 22, 2016 AGENDA NUMBER: 10 FILE NUMBER: 16-112 ITEM: Westwood Middle School RECOMMENDATION:
CLARK COUNTY REGIONAL FLOOD CONTROL DISTRICT HYDROLOGIC CRITERIA AND DRAINAGE DESIGN MANUAL
 CLARK COUNTY REGIONAL FLOOD CONTROL DISTRICT HYDROLOGIC CRITERIA AND DRAINAGE DESIGN MANUAL SECTION 600 STORM RUNOFF TABLE OF CONTENTS 601 INTRODUCTION 603 601.1 - Basin Characteristics 603 602 TIME OF
CHAPTER 3 STORMWATER HYDROLOGY. Table of Contents SECTION 3.1 METHODS FOR ESTIMATING STORMWATER RUNOFF
 CHAPTER 3 STORMWATER HYDROLOGY Table of Contents SECTION 3.1 METHODS FOR ESTIMATING STORMWATER RUNOFF 3.1.1 Introduction to Hydrologic Methods...3.1-1 3.1.2 Symbols and Definitions...3.1-3 3.1.3 Rainfall
2
 1 2 3 4 5 6 The program is designed for surface water hydrology simulation. It includes components for representing precipitation, evaporation, and snowmelt; the atmospheric conditions over a watershed.
5th Street Bridge Replacement Project Yuba City, California Location Hydraulic Study Report Bridge No. 18C0012
 EA 03-0L2324 Yuba City, California Location Hydraulic Study Report Submitted to: Prepared by: November 2012 Table of Contents Executive Summary... iii Acronyms... v 1 General Description... 1 1.1 Project
REQUEST FOR QUALIFICATIONS FOR DAYTON VALLEY AREA DRAINAGE MASTER PLAN
 REQUEST FOR QUALIFICATIONS FOR DAYTON VALLEY AREA DRAINAGE MASTER PLAN Statement of Qualifications due Friday, November 3, 2017 at 12:00 PM (Pacific Time) To the Carson Water Subconservancy District Office
Pre-Treatment Bioretention Cells Bioswales IOWA STORMWATER MANAGEMENT MANUAL DECEMBER 16, 2015
 Pre-Treatment Bioretention Cells Bioswales IOWA STORMWATER MANAGEMENT MANUAL DECEMBER 16, 2015 Urban Runoff Background How we got here What Problem?? Provenance of the Problem Unified Sizing Criteria What
Uncertainty in Hydrologic Modelling for PMF Estimation
 Uncertainty in Hydrologic Modelling for PMF Estimation Introduction Estimation of the Probable Maximum Flood (PMF) has become a core component of the hydrotechnical design of dam structures 1. There is
EVALUATION OF METAL TRANSPORT INTO AND OUT OF TERRACE RESERVOIR, CONEJOS COUNTY, COLORADO, APRIL 1994 THROUGH MARCH 1995
 EVALUATION OF METAL TRANSPORT INTO AND OUT OF TERRACE RESERVOIR, CONEJOS COUNTY, COLORADO, APRIL 1994 THROUGH MARCH 1995 By Sheryl A. Ferguson U.S. Geological Survey, WRD 201 W. 8th Street, Suite 200 Pueblo,
EFFECT OF UPSTREAM DEVELOPMENT ON THE CLEAR CREEK AREA
 EFFECT OF UPSTREAM DEVELOPMENT ON THE CLEAR CREEK AREA Technical Memorandum Farming in the Floodplain Project Prepared for May 2017 PCC Farmland Trust Photo credit: Google Earth TABLE OF CONTENTS Page
Rhode Island Stormwater Design and Installations Standards Manual
 Rhode Island Stormwater Design and Installations Standards Manual Public Workshop Required Management Volume Calculations and Redevelopment Considerations March 22, 2011 Presentation Outline Recap of How
4.1 General Methodology and Data Base Development
 Chapter 4 METHODOLOGY 4.1 General and Data Base Development This report project utilized several computer software models and analysis techniques to create the numeric data on which decisions for this
Impact of Climatic Changes on Downstream Hydraulic Geometry and its Influence on Flood Hydrograph Routing Applied to the Bluestone Dam Watershed
 Impact of Climatic Changes on Downstream Hydraulic Geometry and its Influence on Flood Hydrograph Routing Applied to the Bluestone Dam Watershed PLAN B TECHNICAL REPORT SUMMER 2015 Prepared By: Nicholas
UNIT HYDROGRAPH AND EFFECTIVE RAINFALL S INFLUENCE OVER THE STORM RUNOFF HYDROGRAPH
 UNIT HYDROGRAPH AND EFFECTIVE RAINFALL S INFLUENCE OVER THE STORM RUNOFF HYDROGRAPH INTRODUCTION Water is a common chemical substance essential for the existence of life and exhibits many notable and unique
TECHNICAL MEMORANDUM. SUBJECT: Determination of watershed historic peak flow rates as the basis for detention basin design
 TECHNICAL MEMORANDUM FROM: Ken MacKenzie and Ryan Taylor SUBJECT: Determination of watershed historic peak flow rates as the basis for detention basin design DATE: June 7, 2012 The purpose of this memorandum
Constructed Wetland Channel T-9
 Description A constructed wetland channel is a conveyance BMP that is built, in part, to enhance stormwater quality. Constructed wetland channels use dense vegetation to slow down runoff and allow time
FINDINGS: Olsson used a three-step analysis strategy to develop a benefit cost ratio that would indicate the relative feasibility of this project.
 EXECUTIVE SUMMARY FINDINGS: Based on the results of this feasibility study, the Platte Republican Diversion Project would be cost-effective. With minimal improvements to the channel, and the existing bridge
Stormwater Local Design Manual For Houston County, Georgia
 Stormwater Local Design Manual For Houston County, Georgia Adopted November 15, 2005 TABLE OF CONTENTS 1. FORWARD... 1 2. GENERAL LEVEL OF SERVICE STANDARDS... 2 2.1. DETENTION REQUIREMENTS... 2 2.1.1.
Engineering Hydrology Class 3
 Engineering Hydrology Class 3 Topics and Goals: I.Develop s (estimate precipitation) II.Develop simple constant intensity design storm III.Develop SCS design storm Ocean s Why do we want to derive the?
Comparison of Predicted and Observed Flood Flows in Pajarito Canyon Following the 2000 Cerro Grande Fire
 University of New Mexico UNM Digital Repository Water Resources Professional Project Reports Water Resources 12-12-2008 Comparison of Predicted and Observed Flood Flows in Pajarito Canyon Following the
Information for File # PRH
 Information for File # 2016-02602-PRH Applicant Corps Contact Tom Morley Paul Hauser Address 152 Baker Drive, Redwood Falls, MN 56283 E-Mail Paul.R.Hauser@usace.army.mil Phone 651-290-5357 Primary County
Hydrologic Engineering Center. Training Course on. Hydrologic Modeling with HEC-HMS. Davis, CA. Course Description
 Hydrologic Engineering Center Training Course on Hydrologic Modeling with HEC-HMS Davis, CA Course Description The course provides an introduction to HEC-HMS for new users, focusing both on using the program
Hydrology for Folsom Dam Water Control Manual Update
 Hydrology for Folsom Dam Water Control Manual Update Brian Walker, EIT Civil Engineer, Hydrology Section U.S. Army Corps of Engineers Sacramento District 1325 J Street Sacramento, CA 95816 Tel: (916) 557-7376
MODEL Stormwater Local Design Manual. City of Centerville
 MODEL Stormwater Local Design Manual City of Centerville Adopted December 6, 2005 TABLE OF CONTENTS 1. FORWARD... 1 2. GENERAL LEVEL OF SERVICE STANDARDS... 1 2.1. DETENTION REQUIREMENTS... 1 2.1.1. Discharge
Appendix D - Evaluation of Interim Solutions
 Appendix D - Evaluation of Interim Solutions D.1 Introduction The implementation of long-term improvements is projected to take 5 to 8 years. To reduce the number of years of flooding impacts, the partner
New Castle County, DE. Floodplain Regulations
 New Castle County, DE Floodplain Regulations John J. Gysling, PE CFM Department of Land Use New Castle County, DE February 26, 2009 Today s Presentation Floodplain Protection and Uses Terms and Definitions
HOMELAND / ROMOLAND AREA DRAINAGE PLAN
 RIVERSIDE COUNTY CALIFORNIA HOMELAND / ROMOLAND AREA DRAINAGE PLAN Amendment No. 3 JULY 2014 By the Riverside County Board of Supervisors Prepared and Adopted Pursuant to Government Code Section 66483,
STORMWATER RUNOFF AND WATER QUALITY IMPACT REVIEW
 SUBCHAPTER 8 STORMWATER RUNOFF AND WATER QUALITY IMPACT REVIEW 7:45-8.1 Purpose and scope of review Except for those projects expressly exempted by this chapter or waived by the Commission, the Commission
Gwinnett County Stormwater System Assessment Program
 Gwinnett County Stormwater System Assessment Program Jonathan Semerjian, PE Dept. of Water Resources Stormwater Management Sam Fleming, PE Dewberry Presentation Overview Project Background Drivers Enhanced
3 PROJECT DESCRIPTION
 3.1 PROJECT OVERVIEW 3 PROJECT DESCRIPTION The Rocklin 60 project (proposed project) includes the subdivision of 56.9 acres of land, construction of 179 single-family, detached dwelling units, and installation
King County Flood Control District approves grants for flood prevention projects Regional projects to benefit from district funds
 News Release Contact: Al Sanders 206-477-1016 August 31, 2015 Flood Control District approves grants for flood prevention projects Regional projects to benefit from district funds The Flood Control District
OVERVIEW OF RESERVOIR OPERATIONS AND FLOOD RISK MANAGEMENT
 OVERVIEW OF RESERVOIR OPERATIONS AND FLOOD RISK MANAGEMENT 255 255 255 237 237 237 0 0 0 217 217 217 163 163 163 200 200 200 COLUMBIA RIVER BASIN 131 132 122 239 65 53 80 119 27 110 135 120 252 174.59
APPENDIX G HYDRAULIC GRADE LINE
 Storm Drainage 13-G-1 APPENDIX G HYDRAULIC GRADE LINE 1.0 Introduction The hydraulic grade line is used to aid the designer in determining the acceptability of a proposed or evaluation of an existing storm
Constructed Wetland Pond T-8
 Constructed Wetland Pond T-8 Description A constructed wetlands pond is a shallow retention pond designed to permit the growth of wetland plants such as rushes, willows, and cattails. Constructed wetlands
Phase II Report on Hydrology, Hydraulics, and Low Water Dams
 Phase II Report on Hydrology, Hydraulics, and Low Water Dams Arkansas River Corridor Tulsa, OK May 2005 Submitted To: U. S. Army Corps of Engineers Tulsa District Prepared by: The GUERNSEY Team 5555 N.
Estimating Future Floods to Manage Flood Risk
 Estimating Future Floods to Manage Flood Risk Michael Anderson California State Climatologist Extreme Precipitation Symposium 2012 Talk Overview Statistics Physics Climate Change Flood Management and the
Urbanization effects on the hydrology of the Atlanta area, Georgia (USA)
") 14/06/01 Impact of Human Activity on Groundwater Dynamics (Proceedings of a symposium held during the Sixth IAHS Scientific Assembly at Maastricht, The Netherlands, July 2001). IAHS Publ. no. 269, 2001.
14/06/01 Impact of Human Activity on Groundwater Dynamics (Proceedings of a symposium held during the Sixth IAHS Scientific Assembly at Maastricht, The Netherlands, July 2001). IAHS Publ. no. 269, 2001.
Chapter 12 Storage. Contents. Overview... 1
 Chapter 12 Storage Contents Overview... 1 Implementation of Regional, Sub-regional, and On-site Detention Facilities... 2 Regional Detention... 2 Subregional Detention... 5 Onsite Detention... 6 Detention
EMERGENCY STORAGE PROJECT
 EMERGENCY STORAGE PROJECT San Vicente Pumping Station/Surge Control Facility Carryover Storage and San Vicente Dam Raise EIR/EIS San Vicente Dam Raise Briefing Summary DATE: Oct. 18, 2006 ORGANIZATION:
TIFT COUNTY, GEORGIA AND INCORPORATED AREAS. Tift County. Revised: September 29, 2010 FLOOD INSURANCE STUDY NUMBER 13277CV000A
 TIFT COUNTY, GEORGIA AND INCORPORATED AREAS Community Name Community Number Tift County OMEGA, CITY OF 130552 TIFT COUNTY (UNINCORPORATED AREAS) 130404 TIFTON, CITY OF 130171 TY TY, CITY OF 130172 Revised:
TABLE OF CONTENTS 4.17 UTILITIES AND SERVICE SYSTEMS...
 TABLE OF CONTENTS 4.17 UTILITIES AND SERVICE SYSTEMS... 4.17-1 4.17.0 Introduction... 4.17-1 4.17.1 Methodology... 4.17-2 4.17.2 Existing Conditions... 4.17-2 4.17.3 Impacts... 4.17-4 4.17.4 Applicant-Proposed
Village of Mamaroneck Flood Mitigation Status Report
 Village of Mamaroneck Flood Mitigation Status Report Introduction Flooding is a regional problem that must be addressed with regional solutions; There are no quick-fix answers; This is an ongoing process;
SCOTT RIVER HYDROLOGY AND INTEGRATED SURFACE WATER / GROUNDWATER MODELING
 SCOTT RIVER HYDROLOGY AND INTEGRATED SURFACE WATER / GROUNDWATER MODELING 1.0 Study Goals and Objectives The overall goal of the Scott River hydrology and integrated surface water / groundwater modeling
MAGNITUDE AND FREQUENCY OF FLOODS IN RURAL BASINS OF SOUTH CAROLINA, NORTH CAROLINA, AND GEORGIA
 MAGNITUDE AND FREQUENCY OF FLOODS IN RURAL BASINS OF SOUTH CAROLINA, NORTH CAROLINA, AND GEORGIA Toby D. Feaster 1, John C. Weaver 2, and Anthony J. Gotvald 3 AUTHORS: 1 Hydrologist, U.S. Geological Survey,
Chapter 3 Calculating the WQCV and Volume Reduction
 Contents 1.0 Introduction... 1 2.0 Hydrologic Basis of the WQCV... 1 2.1 Development of the WQCV... 1 2.2 Optimizing the Capture Volume... 3 2.3 Attenuation of the WQCV (BMP Drain Time)... 4 2.4 Excess
Fort Leonard Wood, Missouri. September 2013
 Fort Leonard Wood, Missouri September 2013 1 Presenters Shannon Kelly, Physical Scientist Clean Water Act Program Manager Directorate of Public Works Environmental Division Environmental Compliance Branch
NOTICE OF PREPARATION
 NOTICE OF PREPARATION Date: June 12, 2014 To: From: Subject: Governor s Office of Planning and Research/State Clearinghouse Unit, Responsible Agencies, Trustee Agencies, and Interested Parties Announcement
Chapter 6 DOCUMENTATION OF HYDRAULIC STUDIES SOUTH DAKOTA DRAINAGE MANUAL
 Chapter 6 DOCUMENTATION OF HYDRAULIC STUDIES SOUTH DAKOTA DRAINAGE MANUAL October 2011 Table of Contents Section Page 6.1 INTRODUCTION...6-1 6.1.1 General...6-1 6.1.2 Purpose...6-1 6.1.3 Objectives...6-2
SAN BRUNO CREEK / COLMA CREEK RESILIENCY STUDY FINAL REPORT
 SAN BRUNO CREEK / COLMA CREEK RESILIENCY STUDY FINAL REPORT Prepared for: San Francisco International Airport RFP: 8354.1 Prepared by: August 2015 M&N Job No: 7981 Final Report Page E-1 EXECUTIVE SUMMARY
FLOOD INSURANCE STUDY
 FLOOD INSURANCE STUDY DONA ANA COUNTY, NEW MEXICO AND INCORPORATED AREAS VOLUME 1 OF 2 COMMUNITY NAME COMMUNITY NUMBER ANTHONY, TOWN OF 350061 DONA ANA COUNTY 350012 (UNINCORPORATED AREAS) HATCH, VILLAGE
5.9 HYDROLOGY AND WATER QUALITY
 5.9 This section of the Draft Environmental Impact Report (DEIR) evaluates the potential impacts to hydrology and water quality conditions in the City of Banning from implementation of the proposed Rancho
SANTA ANA RIVER/ SAN TIMOTEO CREEK 1 LEVEE SYSTEM SAN BERNARDINO COUNTY, CALIFORNIA NLD SYSTEM ID #
 SANTA ANA RIVER/ SAN TIMOTEO CREEK 1 LEVEE SYSTEM SAN BERNARDINO COUNTY, CALIFORNIA NLD SYSTEM ID # 3805030015 PERIODIC INSPECTION REPORT NO. 1 GENERALIZED EXECUTIVE SUMMARY FINAL SYSTEM RATING: UNACCEPTABLE
Lake Houston Dam Comprehensive Evaluation of an Ambursen Dam
 Lake Houston Dam Comprehensive Evaluation of an Ambursen Dam ASDSO September 10, 2008 John Rutledge - Freese & Nichols, Inc. Chuck Easton - Freese & Nichols, Inc. Janis Murphy - Freese & Nichols, Inc.
Table of Contents. Overview... 1
 Chapter 3 Chapter 3 Table of Contents Overview... 1 Rainfall... 2 3-2-1 Rainfall Depths and Intensities... 2 3-2-2 Design Storm Distribution for Colorado Urban Hydrograph Procedure (CUHP)... 5 3-2-3 Temporal
Does Water Resources Management in the Snake River Basin Matter for the Lower Columbia River? Or Is the Snake River Part of Another Watershed?
 Does Water Resources Management in the Snake River Basin Matter for the Lower Columbia River? Or Is the Snake River Part of Another Watershed? John C. Tracy, Director Idaho Water Resources Research Institute
E. STORMWATER MANAGEMENT
 E. STORMWATER MANAGEMENT 1. Existing Conditions The Project Site is located within the Lower Hudson Watershed. According to the New York State Department of Environmental Conservation (NYSDEC), Lower Hudson