This page is intentionally left blank.
|
|
|
- Buck Cain
- 6 years ago
- Views:
Transcription
1
2 This page is intentionally left blank.

3 STATE OF CALIFORNIA CALIFORNIA NATURAL RESOURCES AGENCY EDMUND G. BROWN JR., Governor DEPARTMENT OF WATER RESOURCES 1416 NINTH STREET, P.O. BOX SACRAMENTO, CA (916) November 21, 2016 Blanca Beltran Public Works Director City of Dinuba 1088 E. Kamm Avenue Dinuba, California RE: Urban Water Management Plan Requirements Addressed Dear Ms. Beltran: The Department of Water Resources (DWR) has reviewed the City of Dinuba s 2015 Urban Water Management Plan (UWMP) received on November 9, The California Water Code (CWC) directs DWR to report to the legislature once every five years on the status of submitted UWMPs. In meeting this legislative reporting requirement, DWR reviews all submitted UWMPs. DWR s review of the City of Dinuba s 2015 plan has found that the UWMP addresses the requirements of the CWC. DWR s review of plans is limited to assessing whether suppliers have addressed the required legislative elements. In its review, DWR does not evaluate or analyze the supplier s UWMP data, projections, or water management strategies. This letter acknowledges that the City of Dinuba s 2015 UWMP addresses the CWC requirements. The results of the review will be provided to DWR s Financial Assistance Branch. If you have any questions regarding the review of the UWMP or urban water management planning please call Gwen Huff at Sincerely, Vicki Lake Unit Chief Urban Water Use Efficiency (916) Electronic cc: Keasha Blew, P&P
4 This page is intentionally left blank.
5 Errata Sheets 2015 Urban Water Management Plan Errata Sheet for Minor Corrections to City of Dinuba 2015 Urban Water Management Plan (UWMP) This errata sheet logs minor content errors that were identified after final adoption of the City of Dinuba 2015 UWMP. DWR has determined that these corrections are minor and do not require the UWMP to be amended. These data errors have been corrected in the Department of Water Resources (DWR) UWMP database at This errata sheet has been filed with the UWMP in all locations where it is made publicly available, including the California State Library. Name and agency of the person filing errata sheet: Keasha Blew Name Provost & Pritchard Consulting Group Agency # Description of Correction Location Rationale Date Error Corrected 1 Table 6-3 Wastewater Treatment Page 43 & Changed volume reported in Discharged Treated Wastewater and Discharge within Appendix D from 0 to 709MG in order to November 8, 2016 Service Area in 2015 properly report the fate of the treated wastewater 2 Table 6-8 Retail Water Supplies Current and Projected Page 50 & Appendix D Recycled water volume was reduced from 730 MG to 0 MG for 2030 and 2035 and from 1,460 MG to 0 MG in 2040 because there is no funding for proposed recycled water projects in the foreseeable future. Total available water was changed from: 3,188 MG to 2,458 MG for 2030, 3,582 MG to2,852 MG for 2035, and 4,766 MG to 3,306 MG for November 8, 2016
6 Errata Sheets 2015 Urban Water Management Plan Table 6-3: Wastewater Treatment and Discharge within Service Area in 2015 Name of Wastewater Treatment Plant City of Dinuba Wastewater Reclamation Facility Discharge Location Name or Identifier Ponds 1-12 Discharge Location Description 6675 Avenue 412 Dinuba Method of Disposal Percolation Ponds Does this Include Wastewater Generated Outside the Service Area? No Treatment Level Second Wastewater Treated 709 MG Discharged Treated Wastewater MG Recycled Within Service Area 2015 Volumes Recycled Outside of Service Area, in other UWMP Recycled Outside of Service Area, not in other UMWP Total Wastewater Generated in UWMP Area 709 MG
7 Table 6-8: Retail Water Supplies Current and Projected Errata Sheets 2015 Urban Water Management Plan Source Type Purchased Water Groundwater Surface Water Detail Kings Subbasin Actual Volume Level of Treatment of Source Water Reasonably Available Volume Reasonably Available Volume Reasonably Available Volume Reasonably Available Volume Reasonably Available Volume 1,578 Drinking 1,830 2,123 2,458 2,852 3,306 Recycled Water Tertiary ,460 Desalinated Water Stormwater Use Transfers Exchanges Other Total 1,578 1,830 2,123 3,188 2,458 Notes: Not directly used by City. Provide in-lieu groundwater recharge and reduces stress on aquifer 3,582 2,852 4,766 3,306
8 This page is intentionally left blank.
9 Keasha Blew From: Sent: To: Cc: Subject: Attachments: Follow Up Flag: Flag Status: Huff, Wednesday, October 26, :10 PM Blanca Beltran Keasha Blew Dinuba 2015 UWMP Review Errata Sheet for Minor Corrections.docx Follow up Flagged Blanca I just left a phone message for you and here is the follow up . We have reviewed the 2015 Urban Water Management Plan for the City of Dinuba and found that is addresses the requirements of the Water Code. However, we found a few items that will need correction. These are minor corrections and will not require a public hearing or a formal adoption process. Some of the corrections will be made by submitting an errata (see attached sample errata) and others by going back into the database to correct data entry errors. This is a relatively straightforward process and I will assist you as we go through it. Errata - Corrections to UWMP Table 6-3, page 43. Change volume reported in Discharged Treated Wastewater from 0 to 709MG in order to properly report the fate of the treated wastewater. There is a discrepancy between Table 6-8 (page 50) and Table 7-2 (page 53) in the projected water supplies reported for the years The narrative directly above Table 7-2 states that the recycled water volume is not included in Table 7-2 because there is no funding in the foreseeable future. You must determine whether or not to include the recycled supply as part of projected supply and then modify one of these tables so that the projected supply is consistent in Table 6-8 and Table 7-2. WUEdata - data entry corrections in DWR database only DWR Table 6-3 change to reflect errata correction above. DWR Table 6-8 or 7-2 change to reflect errata correction above. DWR Table 7-1 change data in column Percent of Annual Average to what is reported in UWMP Table 7-1 page 52. DWR Tables 7-3 and 7-4 change volumes in column 2040 to read 3,306MG rather than 3,036MG. Please complete the errata sheet and then contact me. I will go through the submittal of the errata and data entry correction process with you at that time. Once these steps are done, the review of the UWMP will be complete. Please feel free to contact me if you have any questions or would like to discuss this further. Sincerely, Gwen Huff Gwen Huff Senior Environmental Scientist Urban Water Use Efficiency Unit Department of Water Resources gwen.huff@water.ca.gov 1
10 This page is intentionally left blank.


11 URBAN WATER MANAGEMENT PLAN 2015 UPDATE WITH ERRATA SHEETS City of Dinuba June 2016 Prepared for: City of Dinuba Prepared by: Provost & Pritchard Consulting Group 286 W Cromwell Ave, Fresno, CA 93711
12 This page is intentionally left blank.
13 City of Dinuba 2015 Urban Water Management Plan Table of Contents Executive Summary... ES-1 1 Introduction and Overview Overview Purpose Background Urban Water Management Planning Act Amendments to UWMPA Previous Urban Water Management Plan Other Planning Documents in Relation to UWMP UWMP Tables Plan Preparation Plan Characteristics Coordination Plan Adoption, Submittal, and Implementation Notice of Public Hearing Public Hearing and Adoption Plan Submittal Public Availability Plan Implementation System Description Service Area Physical Description Location Land Use Water Facilities Climate Service Area Population and Demographics Other Demographic Factors System Water Use Water Use by Sector Distribution System Water Losses Provost & Pritchard Consulting Group June 2016 i

14 City of Dinuba 2015 Urban Water Management Plan 4.3 Water Savings from Codes, Standards, Ordinances, or Land Use Plans Water Use for Lower Income Households Baseline and Targets Updated Calculations from 2010 UWMP Target Method Census Data SBX7-7 Verification Baseline Periods Service Area Population Gross Water Use Baseline Daily Per Capita Water Use and 2020 Targets Selection of Target Method Year Baseline 2020 Target Confirmation Interim Urban Water Use Target Baselines and Targets Summary Compliance Daily per Capita Water Use Target Compliance Adjustments to 2015 Gross Water Use System Supplies Water Supply Facilities Purchased Water Groundwater Sigma from Owen Groundwater Basin Description Groundwater Management Overdraft Conditions Historical Pumping Groundwater Recharge, Storage and Banking Surface Water Stormwater Other Non-Potable Water Provost & Pritchard Consulting Group June 2016 ii
15 City of Dinuba 2015 Urban Water Management Plan 6.7 Wastewater and Recycled Water Recycled Water Coordination Wastewater Collection, Treatment, and Disposal Recycled Water Systems Recycled Water Beneficial Uses Actions to Encourage and Optimize Future Recycled Water Use Desalinated Water Opportunities Brackish Water and/or Groundwater Desalination Seawater Desalination Exchanges or Transfers Future Water Projects Summary of Existing and Planned Sources of Water Water Supply Reliability Constraints on Water Sources Reliability by Type of Year Supply and Demand Assessment Regional Supply Reliability Water Shortage Contingency Planning Stages of Action Prohibitions on End Users and Penalties Consumption Reduction Methods by Agencies Determining Reductions Revenue and Expenditure Impacts/Measures to Overcome Impacts Resolution or Ordinance Catastrophic Supply Interruption Minimum Supply Next Three Years Demand Management Measures (DMM) DMMs Water Waste Prevention Ordinances Metering Conservation Pricing Public Education and Outreach Provost & Pritchard Consulting Group June 2016 iii
16 City of Dinuba 2015 Urban Water Management Plan Programs to Assess and Manage Distribution System Real Loss Water Conservation Program Coordination and Staffing Support Other Demand Management Measures Planned Implementation to Achieve Water Use Targets California Urban Water Conservation Council Completed UWMP Checklist Bibliography/References List of Figures Figure 3-1: Regional Location Map Figure 3-2: Mean Monthly Temperature and Rainfall Figure 5-1: Water Service Area Map Figure 5-2: Graph of Daily per Capita Water Use Figure 6-1: 2003 Existing Pipe Network - Boyle 2008 Water Master Plan Figure 6-2: Kings Groundwater Sub-Basin List of Tables It should be noted that tables within the body of the document may be different than those required by DWR and provided in Appendix D. Table 1-1: 2015 Changes to the Water Code...3 Table 2-1: Public Water Systems...5 Table 2-2: Plan Identification...6 Table 2-3: Agency Identification...6 Table 2-4: Coordination with Appropriate Agencies...7 Table 2-5: Notification to Cities and Counties...8 Table 3-1: Land Use Categories Table 3-2: Monthly Average Climate Data Table 3-3: Population Current and Projected Table 4-1: Historic Water Use Table 4-2: Demands for Potable and Raw Water- Actual and Projected Table 4-3: Total Water Demands Table 4-4: Water Loss Summary Table 4-5: Inclusion in Water Use Projections Table 4-6: Low-Income Projected Water Demands Table 5-1: Gallons Per Capita per Day Table 5-2: Baselines and Targets Summary Provost & Pritchard Consulting Group June 2016 iv
17 City of Dinuba 2015 Urban Water Management Plan Table 6-1: Groundwater Volume Pumped Table 6-2: Wastewater Generated within Service Area in Table 6-3: Wastewater Treatment and Discharge within Service Area in Table 6-4: Current and Projected Recycled Water Use Table 6-5: 2010 UWMP Recycled Water Use Projection Table 6-6: Methods to Expand Future Recycled Water Use Table 6-7: Future Water Supply Projects Table 6-8: Retail Water Supplies Current and Projected Table 7-1: Bases of Water Year Data Table 7-2: Normal Year Supply and Demand Comparison Table 7-3: Multiple Dry Year Supply and Demand Comparison Table 8-1: Stages of Water Shortage Contingency Plan Table 8-2: Water Shortage Contingency Restrictions and Prohibitions on End Users Table 8-3: Water Shortage Contingency - Consumption Reduction Methods Table 8-4: Water Shortage Contingency Minimum Supply Next Three Years APPENDIX Appendix A... Adoption Resolution Appendix B... Community Coordination & Notification Appendix C... Maps Appendix D... Tables Appendix E... Ordinances Appendix F... Plan Submittals Provost & Pritchard Consulting Group June 2016 v
18 Abbreviations City of Dinuba 2015 Urban Water Management Plan AB... State Assembly Bill AC... Asbestos Concrete AID... Alta Irrigation District af... acre-feet afy... acre-feet per year ASCE... American Society of Civil Engineers AWWA... American Water Works Society BMP... Best Management Practice CAFR... Comprehensive Annual Finance Report CUWCC... California Urban Water Conservation Council CWC... California Water Code DBCP...Dibromochloropropane DMM... Demand Management Measures DOF... Department of Finance DWR... Department of Water Resources GIS... Geographic Information System gpcd... gallons per capita per day IRWM... Integrated Regional Water Management KRCD... Kings River Conservation District MG... Million Gallons mgd... million gallons per day NOAA... National Oceanic and Atmospheric Administration psi... pounds per square inch PVC... Poly-Vinyl Chloride PWS... Public Water System RWQCB... Regional Water Quality Control Board SB... State Senate Bill SCADA... Supervisory Control And Data Acquisition SGMA... Sustainable Groundwater Management Act SOI... Sphere Of Influence SWRCB... State Water Resources Control Board UWMP... Urban Water Management Plan UWMPA... Urban Water Management Planning Act WSCP... Water Shortage Contingency Plan WWRF... Wastewater Reclamation Facility Provost & Pritchard Consulting Group June 2016 vi
19 City of Dinuba 2015 Urban Water Management Plan Executive Summary This 2015 Urban Water Management Plan (UWMP) has been prepared for the City of Dinuba (City) by Provost & Pritchard Consulting Group as an individual UWMP. This 2015 UWMP describes current and future water use, reliability of water sources, and existing and planned conservation measures. This UWMP covers the years and supersedes the City s 2010 UWMP. This UWMP complies with the Urban Water Management Planning Act (UWMPA). This planning act was established by Assembly Bill 797 (AB797), September 21, UWMPs must be prepared by any water supplier that provides water either directly or indirectly for 3,000 or more customers or more than 3,000 acre-feet per year (afy). UWMPs must be updated every five years. The UWMPA has been changed in the last five years to include increased requirements for sections on recycled water use and water shortage contingency plans. Due to inconsistencies in recycled water definitions in the 2010 UWMPs, the Department of Water Resources (DWR) clarified recycled water and usages. There has been a decreased requirement in demand management measures requiring less quantitative and more qualitative analysis. The 2015 UWMP correlates with the interim requirements for the Water Conservation Act of 2009 Senate Bill x7-7 (SBX7-7). SBX7-7 requires statewide per capita water use reduction of 20 percent by the year The interim and final 2020 targets for SBX7-7 were determined in the 2010 UWMP. The 2015 UWMP is the last opportunity to adjust the baseline consumption in gallons per capita per day (gpcd) and thereby adjust the target gpcd. The document below is a comprehensive overview of the City of Dinuba Public Water System. It should not only serve to comply with the UWMPA and SBX7-7, but also as a short and long range planning document for water supply, a data source for the development of a regional water supply plan, a document for preparing and updating General Plans, and a key component of an Integrated Regional Water Management Plan. The City of Dinuba Public Water System (PWS) is a retail agency, providing water directly to customers. They currently serve 5,649 homes, businesses, and other facilities within the City. Of the 23,966 residents of the City of Dinuba, the majority rely on the City PWS with a few outlying properties possessing private wells. The 10-year baseline per capita water use for the Dinuba PWS is 222 gpcd, with goals of 200 gpcd for interim year 2015 and 179 gpcd for final target year The actual per capita consumption for 2015 was 180 gpcd putting the City of Dinuba well below their 2015 interim goal. Prior to the water conservation acts mentioned above, the City had taken initiative in developing and implementing water conservation practices and policies. Demand management measures and consumption reduction methods have developed over time to address declining groundwater levels and prevention of water quality degradation. The City has mechanisms in place to enforce conservation in the event of drought or other supply issues. They are also prepared to respond to supply interruption in the event of an emergency. Provost & Pritchard Consulting Group June 2016 ES-1
20 This page is intentionally left blank.
21 1 Introduction and Overview 1.1 Overview Section One: Introduction 2015 Urban Water Management Plan This document presents the 2015 Urban Water Management Plan (Plan or UWMP) for the City of Dinuba (City) service area. This chapter describes the general purpose of the Plan and background information on UWMP requirements and changes. This Plan satisfies requirements for a retail UWMP and covers the years 2011 to This Plan is an update to the 2010 UWMP submitted by the City in The California Water Code (CWC) 10644(a) requires urban water suppliers to file with the Department of Water Resources (DWR), the California State Library, and any City or County within which the supplier provides water, a copy of its Urban Water Management Plan. UWMP s are to be prepared every five years by urban water suppliers with 3,000 or more service connections or supplying 3,000 or more acre-feet of water per year. 1.2 Purpose The UWMP is a planning tool that generally guides the actions of water management agencies. It provides managers and the public with a broad perspective on a number of water supply issues. It is not a substitute for project-specific planning documents, nor was it intended to be, when mandated by the State Legislature. For example, the Legislature mandated that a plan include a section which describes the opportunities for exchanges or water transfers on a short-term or long-term basis. (California Urban Water Management Planning Act, Article 2, Section 10630(d).) The identification of such opportunities, and the inclusion of those opportunities in a general water service reliability analysis, neither commits a water management agency to pursue a particular water exchange/transfer opportunity, nor precludes a water management agency from exploring exchange/transfer opportunities not identified in the Plan. When specific projects are chosen to be implemented, detailed project plans are developed, environmental analysis, if required, is prepared, and financial and operational plans are detailed. In short, this Plan is a management tool, providing a framework for action, but not functioning as a detailed project development or action. It is important that this Plan be viewed as a long-term, general planning document, rather than as an exact blueprint for supply and demand management. Water management in California is not a matter of certainty, and planning projections may change in response to a number of factors. The California Urban Water Management Planning Act (Act or UWMPA) requires preparation of a plan that: Accomplishes water supply planning over a 20-year period in five year increments with an optional 5 additional years. Provost & Pritchard Consulting Group June
22 Section One: Introduction 2015 Urban Water Management Plan Identifies and quantifies adequate water supplies for existing and future demands, in normal, single-dry, and multiple-dry years. Implements conservation and efficient use of urban water supplies. The City of Dinuba has prepared this updated version of its Urban Water Management Plan for The Dinuba UWMP is a requirement of the state in an effort to assist resource planning and to ensure adequate water supplies are available for future use. The UWMP is also required to qualify for certain State grants, loans, and drought assistance. The purpose of this UWMP is to serve as baseline document and source of information for DWR and to serve the City of Dinuba as: A short and long range planning document for water supply; A data source for the development of a regional water supply plan; A source document for the City of Dinuba in preparing updated General Plans; and A key component of an Integrated Regional Water Management (IRWM) Plan. A secondary purpose of the UWMP is to provide for a plan or series of plans during water drought situations. 1.3 Background Urban Water Management Planning Act In 1983, State Senate Bill (SB) 797 altered Division 6 of the CWC by establishing the UWMPA. The UWMP is a requirement of the UWMPA (Division 6, Part 2.6 of the CWC ). The UWMPs must be updated every five years and submitted to the Department of Water Resources. Every entity that becomes an urban water supplier shall adopt an UWMP within one year after it has become an urban water supplier. The submittal must meet all requirements of the Act, including the most current amendments. The Act applies to urban water suppliers with 3,000 or more service connections or those delivering more than 3,000 acre-feet (af) of water annually. The City reports water production and consumption monthly and annually with respect to their fiscal year which starts July 1st. As of the end of fiscal year 2014/2015, the City had 5,742 water connections and is therefore required to prepare an UWMP. UWMP requirements differ for retail and wholesale water agencies; the City of Dinuba is a retail water agency and this UWMP satisfies the retail agency requirements Amendments to UWMPA Since 1983, several amendments to the original UWMPA have increased the requirements of the UWMPs. One such amendment required projections for water use to extend 20 years at 5-year intervals. Recently, this has been increased to include an optional additional five years providing for a 25-year projection. Provost & Pritchard Consulting Group June
23 Section One: Introduction 2015 Urban Water Management Plan Various other amendments have increased requirements to include sections on recycled water use, demand management measures (DMMs), and water shortage contingency plans (WSCP). Recycled water use sections were added to assist in evaluation of alternate water supplies for future use when projections exceed the existing water supplies. Demand management measures must be clearly described including which measures are being implemented and which are scheduled for implementation in the future. Water contingency plans are to be prepared and coordinated with other water suppliers in the area for use during times of drought. Pertinent bills that have passed are noted in Table 1-1 below. Table 1-1: 2015 Changes to the Water Code Bill SB610 and AB901 SB318 AB105 Water Conservation Bill (2009) AB 2067 SB 1420 SB 1036 Requirements Consideration of water availability when reviewing new large developments Investigate possibilities of developing desalinated water Submit UWMP to State Library Urban water suppliers to reduce the statewide average per capita daily water consumption by 20% by December 31, 2020 Revises requirements on Demand Management Measures Requires electronic submittal, standard forms and tables, and a report on distribution system losses Urban suppliers to include energy-related information (optional) and analyze and define artificial water features Previous Urban Water Management Plan The City of Dinuba s 2010 UWMP was adopted by the City Council in June 2012 as Resolution Following adoption, the 2010 UWMP and subsequent amendment (Resolution ) were submitted to and approved by DWR. A copy of this UWMP resides in the State Library. This 2015 UWMP serves to update the existing 2010 UWMP and complies with all new requirements and regulations Other Planning Documents in Relation to UWMP The City of Dinuba used information from several existing planning documents and reports to aid in the production of the UWMP. These documents are listed below: 2006 Dinuba General Plan Update Background Report 2008 Dinuba Water Master Plan 2012 City of Dinuba Municipal Service Review 2010 and 2015 City of Dinuba Comprehensive Annual Financial Report Provost & Pritchard Consulting Group June
24 Section One: Introduction 2015 Urban Water Management Plan 2003 Dinuba s Emergency Operations Plan 2013/14 Kings River Service Area Annual Groundwater Report June 2010 Alta Irrigation District Amended Groundwater Management Plan UWMP Tables As a requirement of the UWMP the Department of Water Resources has developed standardized tables to assist water managers in calculating per capita consumption, baseline consumption, and water reduction targets. These tables are a required attachment to the UWMP document. However, they are not required in the body of the text and can be altered as needed to better reflect the water system. It should be noted that the tables in the body of this document are not identical to the tables provided in the attachments required by DWR. Some tables have been modified to meet specific or unique reporting needs for the City of Dinuba. Titles and substance may vary. Standardized tables required by DWR are located in Attachment D. Provost & Pritchard Consulting Group June
25 Section Two: Plan Preparation 2015 Urban Water Management Plan 2 Plan Preparation 2.1 Plan Characteristics The City manages and operates the City of Dinuba Public Water System (PWS), as defined by the California Health and Safety Code. The PWS number and the number of connections and water delivered in 2015 are shown in the table below. The City delivers water directly to customers and is therefore considered a retail water agency. Data in this UWMP is presented in million gallons (MG) for each fiscal year (July-June). This is a deviation from the previous UWMP which reported water volume in acre-feet. This adjustment was made to better reflect the District s standard reporting procedures and for easy comparison in per capita consumption. The City reports internally in both 100 cubic feet and MG. Table 2-1: Public Water Systems Public Water System Number Public Water System Name Number of Municipal Connections 2015 Volume of Water Supplied City of Dinuba Public Water System 5,742 1,578 MG The City of Dinuba Public Water System prepared an independent UWMP because it is the sole water supplier for the City. However, the City participates in several regional water management alliances; most notably, with the Alta Irrigation District (AID), the Kings River Conservation District (KRCD), and the Upper Kings Basin Integrated Regional Water Management Authority, actively assisting in meeting the goals and objectives of local and regional efforts. The City of Dinuba plans on implementing the 2015 UWMP in order to achieve the goal of reducing water usage within the limits of its service area and continuing their involvement in regional efforts, which target decreased groundwater usage and protection of groundwater quality. Copies of groundwater management plans and other groundwater surveys can be accessed online through the AID 1 or KRCD 2 websites Provost & Pritchard Consulting Group June
26 Section Two: Plan Preparation 2015 Urban Water Management Plan Table 2-2: Plan Identification Individual UWMP Regional UWMP N/A Does this Regional UWMP include a Regional Alliance? Table 2-3: Agency Identification Name of Agency City of Dinuba Agency is a wholesaler Agency is a retailer Fiscal or Calendar Year UWMP Tables Are in Calendar Years UWMP Tables Are in Fiscal Years Day 01 Month July Units of Measure Acre Feet (AF) 2.2 Coordination Legal Requirements: Million Gallons (MG) Hundred Cubic Feet (CCF) 10620(d)(2) Each urban water supplier shall coordinate the preparation of its plan with other appropriate agencies in the area, including other water suppliers that share a common source, water management agencies, and relevant public agencies, to the extent practicable (b) Every urban water supplier required to prepare a plan pursuant to this part shall, at least 60 days prior to the public hearing on the plan required by 10642, notify any city or county within which the supplier provides water supplies that the urban water supplier will be reviewing the plan and considering amendments or changes to the plan. The urban water supplier may consult with, and obtain comments from, a city or county that receives notice pursuant to this subdivision (b) The urban water supplier shall provide that portion of its urban water management plan prepared pursuant to this article to any city or county within which it provides water supplies no later than 60 days after the submission of its urban water management plan. The Public, the local government, and local water district authorities were encouraged to participate in the planning and drafting of the 2015 UWMP. The City of Dinuba resides within several districts with which they coordinate regularly. The City sent out 60 day notices on March 9, 2016 to the County of Tulare, the Alta Irrigation District, and the Kings River Conservation District. Public outreach has been conducted using multiple mediums. The City Provost & Pritchard Consulting Group June
27 Section Two: Plan Preparation 2015 Urban Water Management Plan website and social media contain notices about the drafting of the UWMP. Interested parties were informed that an electronic draft and final copy would be available upon request and a downloadable copy was made available on the City website 3. A public notice was published in the Dinuba Sentinel on May 26, 2016 and June 2, 2016 to notify the public that a hearing would be held to adopt the UWMP on June 14, A copy of the Plan was made available at the Public Works Office in Dinuba. No comments were received about the 2015 UWMP. It was adopted June 14, Table 2-4: Coordination with Appropriate Agencies Coordinating Agencies Participated in Plan Development Commented on the Draft Attended Public Meetings Was Sent Copy of the Draft Plan Was Sent a Notice of Intention to Adopt County of Tulare X X Alta Irrigation District X X Kings River Conservation X X District General Public DWR 2.3 Plan Adoption, Submittal, and Implementation Notice of Public Hearing Legal Requirements: CWC (b) Every urban water supplier required to prepare a plan shall at least 60 days prior to the public hearing on the plan notify any city or county within which the supplier provides waters supplies that the urban water supplier will be reviewing the plan and considering amendments or changes to the plan. CWC The urban water supplier shall provide notice of the time and place of hearing to any city or county within which the supplier provides water supplies. A privately owned water supplier shall provide an equivalent notice within its service area. Written notifications were provided to Tulare County, AID, and KRCD to inform them of the City s intent to draft their UWMP. They were notified in a separate letter of the completion of the Final UWMP and date and time of the public hearing. Copies of the letters can be reviewed in Attachment B. 3 Provost & Pritchard Consulting Group June
 2.3.2 Public Hearing and Adoption Legal Requirements: CWC 10642 Prior to adopting a plan, the urban water supplier shall hold a public hearing thereon. CWC 10608.")
28 Section Two: Plan Preparation 2015 Urban Water Management Plan Table 2-5: Notification to Cities and Counties Names of Cities and Counties Tulare County 60 Day Notice (CWC (b)) Notice of Public Hearing (CWC 10642) Public Hearing and Adoption Legal Requirements: CWC Prior to adopting a plan, the urban water supplier shall hold a public hearing thereon. CWC (a) In complying with this part, an urban retail water supplier shall conduct at least one public hearing to accomplish all of the following: (1) Allow community input regarding the urban retail water supplier s implementation plan for complying with this part. (2) Consider the economic impacts of the urban retail water supplier s implementation plan for complying with this part. (3) Adopt a method, pursuant to subdivision (b) of Section for determining its urban water use target. (RETAIL AGENCIES ONLY) CWC After the hearing, the plan shall be adopted as prepared or as modified after the hearing The City held a public hearing on June 14, 2016, on 1088 East Kamm Avenue in Dinuba, at 6:30 PM, to adopt the 2015 Dinuba UWMP and hear comments from the public and other interested parties. A copy of the adoption resolution is included in Appendix A. Prior to the public hearing, notices were published in the Dinuba Sentinel announcing the pending hearing no comments were received prior to or at the public hearing Plan Submittal Legal Requirements: CWC 10621(d) An urban water supplier shall update and submit its 2015 plan to the department by July 1, CWC 10644(a) An urban water supplier shall submit to the department, the California State Library, and any city or county within which the supplier provides water supplies a copy of its plan no later than 30 days after adoption. CWC (b) The urban water supplier shall provide that portion of its urban water management plan prepared pursuant to this article to any city or county within which it provides water supplies no later than 60 days after the submission of its urban water management plan. The final adopted Dinuba 2015 UWMP will be sent to the Department of Water Resources prior to July 1, A copy of the UWMP will also be available at the State Resource Library and the County of Tulare. The county and library will receive a copy no later than July 14, 2016, 30 days after City adoption. Provost & Pritchard Consulting Group June
29 Section Two: Plan Preparation 2015 Urban Water Management Plan Public Availability Legal Requirements: CWC Not later than 30 days after filing a copy of its plan with the department, the urban water supplier and the department shall make the plan available for public review during normal business hours. After adoption and submission of the 2015 City of Dinuba UWMP with DWR, the Final UWMP was made available to the public on the City of Dinuba website and in hard copy at the public works office, located at 1088 East Kamm Avenue in Dinuba Plan Implementation Legal Requirements: CWC An urban water supplier shall implement its plan adopted pursuant to this chapter in accordance with the schedule set forth in its plan. This Plan will serve as a mechanism for water conservation and management efforts by the City of Dinuba. The City has taken great strides to reduce per capita consumption and achieve 2020 and 2015 interim goals during the last five years. The City actively reaches out to customers via social media, flyers, mailers, and events. They offer direction to customers for rebates and financial assistance from State programs 4. The City notifies customers when dramatic increases in water usage are identified and assists them in locating and correcting issues. They also have a comprehensive contingency plan that allows them to restrict non-essential water use during times of extreme drought. With the evaluation and eventual replacement of the current water rate structure, the City will have the revenue to explore additional conservation options. These will include studies on groundwater recharge and wastewater reclamation. Additionally, they will be able to undertake capital improvement projects that address water loss, leak detection, potential metering inconsistencies, and water quality. The completion of the UWMP will also give the City the opportunity to apply for state grants and funding that can assist Dinuba in project planning and implementation. 4 Provost & Pritchard Consulting Group June
 Describe the service area climate. 3.1.1 Location The City of Dinuba is located in the northwest corner of Tulare County, approximately 14 miles north of Visalia and 27 miles southeast of the Fresno/Clovis metropolitan area.")
30 Section Three: System Description 2015 Urban Water Management Plan 3 System Description 3.1 Service Area Physical Description Legal Requirements: 10631(a) Describe the service area of the supplier (a) Describe the service area climate Location The City of Dinuba is located in the northwest corner of Tulare County, approximately 14 miles north of Visalia and 27 miles southeast of the Fresno/Clovis metropolitan area. The City of Dinuba also lies approximately 13 miles east of Highway 99 and 9 miles west of the foothills of the Sierra Nevada Mountain Range. The City is relatively flat with an elevation of approximately 330 feet above sea level. It covers an approximate total area of 6.5 square miles. The area surrounding the City of Dinuba and outside its sphere of influence (SOI) consists mainly of land designated for urban reserve/agricultural use. The main body of water within the vicinity of the City of Dinuba is the Kings River. The Kings River runs north and south in direction and lies approximately five miles to the west of Dinuba. Due to the large amount of agricultural land surrounding the City there have been many irrigation canals and waterways constructed to deliver water from the Kings River to the adjacent farmlands. The main California highways serving the area surrounding the City of Dinuba include State Route 198 (15 miles south), State Route 99 (13 miles west), State Route 63 (Rd miles east), and State Route 201 (Ave mile south). The Tulare County highways that also serve the Dinuba area include County Rd J40 (El Monte Way/Ave. 416) and County Hwy J19 (Alta Ave./Rd 80). The nearest passenger railways to Dinuba are Hanford Amtrak (21 miles southwest) and Fresno Amtrak (26 miles northwest). Additionally, the nearest major airports to the City of Dinuba are the Visalia Municipal Airport (15 miles south) and Fresno Yosemite International Airport (24 miles northwest). Provost & Pritchard Consulting Group June

31 Section Three: System Description 2015 Urban Water Management Plan Figure 3-1: Regional Location Map Provost & Pritchard Consulting Group June
32 Section Three: System Description 2015 Urban Water Management Plan Land Use The City of Dinuba covers 6.5 square miles or about 4,141 acres according to the 2010 US Census. The City is largely open land and farmland making up nearly 50% of the total land use. Single family homes make up one third of land use, with the remainder of land being divided between commercial, industrial, and multi-family homes. Because the most recent general plan for the City is 10 years old, it was necessary to extrapolate the data to reflect the current conditions regarding land use. Table 3-1 below breaks down land use categories as percent acreage by usage type. In the 2006 Dinuba General Plan Background Report residential land use demand was broken into five categories: low density, medium-low density, medium density, medium-high density, and high density. For the purposes of this UWMP it was assumed that low density, medium low, and medium density residential units were single family units and medium high and high density residential units were multi-family units. It should be noted that the 2006 General Plan did not account for land annexation in September A reference to the 1997 General Plan estimates residential land use to increase by 3% annually. Table 3-1: Land Use Categories Land Use Type Area Percent of Total (acres) (%) Single Family Residential 1, % Multi-Family Residential 83 2% Industrial % Commercial % Agricultural % Open Space 1, % Total 4, % Source: Dinuba General Plan Background Report (2006) Water Facilities The City of Dinuba s water system consists of eight active wells that supply groundwater to a distribution pipe network. Three additional wells are planned for future construction. The City has two elevated steel storage tanks with a total capacity of 1.25 MG. A 2 MG ground level storage tank was constructed in 2009 in the northeast section of the City. One pressure zone exists throughout the Dinuba system, which is maintained between 45 and 58 psi. Dinuba s distribution system was designed and constructed as the town expanded. The water mains are a mixture of steel, asbestos cement (AC), and newer poly-vinyl chloride (PVC.) Water is distributed through a grid system of buried pipelines that supply services and provide fire protection via fire hydrants and suppression systems at buildings so equipped. The pipeline Provost & Pritchard Consulting Group June
33 Section Three: System Description 2015 Urban Water Management Plan sizes within the system vary between 2 inches and 12 inches in diameter with a total of 74.0 miles of water main. The dead ends are flushed through fire hydrants quarterly. Figure 6-1 shows a map of the 2003 existing pipe network from the 2008 Water Master Plan by Boyle Engineering Climate The City of Dinuba is located within Tulare County, which experiences a semi-arid type of climate. The summers are typically very dry and hot, while the winters are cool with moderate moisture levels (see Figure 3-2: Mean Monthly Temperature and Rainfall 5 ). The summer months (June, July, and August) experience an average high temperature of 94.9 F and the winter months (November, December, and January) have an average minimum temperature of 38.2 F. The average rainfall in the area surrounding the City of Dinuba is approximately inches per year. See Table 3-2: Monthly Average Climate Data Mean Monthly Temperature (F) Mean Monthly Rainfall (in) Figure 3-2: Mean Monthly Temperature and Rainfall The amount of precipitation varies considerably from year to year, with precipitation largely confined to the late fall, winter, and early spring months. Water consumption during the summer months is typically much greater than winter months due to high temperatures and low amounts of rainfall. The table below shows monthly average evapotranspiration, precipitation, and temperature for the area. 5 NOAA Weather Station, Hanford, CA. Provost & Pritchard Consulting Group June
34 Table 3-2: Monthly Average Climate Data Month Standard Monthly Average ETo (inches) Section Three: System Description 2015 Urban Water Management Plan Monthly Average Rainfall (inches) Monthly Average Temperature (ºF) Min. Max. January February March April May June July August September October November December Annual Total/Average Source: CIMIS (Orange Cove Station), WRCC (Visalia Station) 3.2 Service Area Population and Demographics Legal Requirements: CWC Section (a) Describe the service area of the supplier, including current and projected population... The projected population estimates shall be based upon data from the state, regional, or local service agency population projections within the service area of the urban water supplier and shall be in five-year increments to 20 years or as far as data is available. The current and projected population estimates for the City of Dinuba are shown in Table 3-3, which encompasses the entire area served by the water distribution system. Both the current and historic population estimate (2015) were provided by the Department of the Finance (DOF) with the exception of the year 2010, which uses population data gathered from the 2010 census. This population data was projected to Based on this data, from 2000 to 2015, the average annual population increase was 2.5%. However, projections from the Quad Knopf, Inc., Dinuba General Plan Background Report, October 2006, use a 3% population increase. Despite the economic down turn in 2008, the City maintained consistent growth; therefore, the 2015 UWMP will continue to apply a 3% growth rate to future projections. There are a small number of homes, farms, and other developed parcels that lie within the City limits, but outside the water service area map (Figure 5-1). The most notable being a mobile home park and cluster of homes in north Dinuba. Although not included in the service map, the homes in north Dinuba are supplied with a 12 inch water main that runs along Alta Avenue. The Provost & Pritchard Consulting Group June
35 Section Three: System Description 2015 Urban Water Management Plan number of homes outside the service area is assumed to be less than 100 and make up about 1% of the population. This difference was neglected in the analyses, and water supplies and demands are based on the full city population. Table 3-3: Population Current and Projected Data Source Service Area Population 1 23,966 27,561 31,695 36,449 41,917 48,204 DOF 1 Service area population is defined as the population served by the distribution system. Source: Department of Finance Data was used for 2015 data 3.3 Other Demographic Factors Legal Requirements: CWC (a) Describe the service area of the supplier, including... other demographic factors affecting the supplier's water management planning. The City of Dinuba is an agricultural based community surrounded by large areas of farmland. The food production and packing industry is the most dominant local industry. Ruiz Foods stands alone as the largest single employer in the City with approximately 1,775 employees. Family Tree Farms, although outside the City limits, is the next largest employer with about 600 employees from Dinuba and nearby communities. Wal-Mart and the Best Buy distribution centers follow Family Tree Farms with about 400 employees each. Tulare County has one of the highest unemployment rates in the State, due in large part to the agricultural base and the prevalence of seasonal employment. It is possible that the City is still recovering from the effects of the national recession. According to data from the State of California Employment Development Department, November 2015, Dinuba s unemployment rate was 4.5% higher than Tulare County s, 50.9% higher than California s, and nearly 58.6% higher than the national average. Dinuba s unemployment rate was 11.6% compared to Tulare County s rate of 11.1%. California s rate was 5.7% and the national rate was 4.8%. 28.6% of the total population remains below the poverty level. Water conservation and usage reduction measures in communities with high levels of unemployment and poverty, such as Dinuba, prove to be difficult. Many households cannot afford to update older appliances or handle increased water rates. Provost & Pritchard Consulting Group June
36 Section Four: System Water Use 2015 Urban Water Management Plan 4 System Water Use The City of Dinuba Public Water System meters all potable water provided to customers from City wells. Single family homes are the largest consumers of water in the City. Multi-family, commercial, and industrial customers account for the majority of other water uses. Additionally, the City categorizes several other types of water use including construction use and discounted water for seniors. Water for the Housing Authority of Dinuba is also reported seperately. They provide affordable housing for lower income families. The housing authority manages the Euclid Village Apartments which has 57 units, and an additional 80 homes that range from single family to triplex units. The Housing Authority is billed directly for all water used by residences they manage. Use categories unmetered/unbilled and losses are also included in water use types. They were calculated using the American Water Works Association (AWWA) water audit software. The software assesses differences between supply and consumption meters, categorizing and quantifying unaccounted for water. 4.1 Water Use by Sector Legal Requirements: CWC 10631(e) (1) Quantify, to the extent records are available, past and current water use, over the same five-year increments described in subdivision (a), and projected water use, identifying the uses among water use sectors, including, but not necessarily limited to, all of the following uses: (A) Single-family residential. (B) Multifamily. (C) Commercial. (D) Industrial. (E) Institutional and governmental. (F) Landscape. (G) Sales to other agencies. (H) Saline water intrusion barriers, groundwater recharge, or conjunctive use, or any combination thereof. (I) Agricultural. (2) The water use projections shall be in the same five-year increments described in subdivision (a). The City of Dinuba is 100% metered. City employees read customer meters monthly and report annual totals by fiscal year. As such, they are able to reasonably account for the water use in their service area. Meter accuracy and human error can contribute to some discrepancies between supply meters and customer meters; however, these variances are addressed and accounted for in the AWWA Water Audit as described in Section 4.2. Provost & Pritchard Consulting Group June
37 Section Four: System Water Use 2015 Urban Water Management Plan Water use types are shown in the tables below. They are separated into historic water use and current and projected water use. Historic use, displayed in Table 4-1, includes fewer use categories than current and projected use (Table 4-2). The City recently incorporated additional categories to reflect DWR use types. This allows water savings and waste to be directly linked to specific use classifications, allowing water managers to better quantify consumption and tailor management plans to address targeted audiences. Table 4-1: Historic Water Use Use Type Level of Treatment Historic Use (MG) Single Family Drinking Multi-Family Drinking Commercial Drinking Industrial Drinking Institutional/Governmental Drinking Total 1,329 1,469 Water use is projected to 2040 to estimate future water needs and assist Dinuba PWS managers in planning for water acquisition and conservation. Water projections are calculated at a 3% annual rate for all use types based on population growth as determined by the Dinuba General Plan. Actual use in 2015 is the basis for projection calculations rather than the historic baseline or the 2020 per capita use target. The 2015 water use was chosen as the baseline for projections because the 2015 per capita use (180 gpcd) nearly met the 2020 target (179 gpcd). This allows for flexibility should population growth or development exceed projections, but remains conservative and attainable. Baselines and per capita use targets are explained further in Chapter 5. Provost & Pritchard Consulting Group June
38 Section Four: System Water Use 2015 Urban Water Management Plan Table 4-2: Demands for Potable and Raw Water- Actual and Projected 2015 Actual Use Type Level of Volume Treatment Single Family Drinking ,130 1,310 1,519 1,761 Multi-Family Drinking Commercial Drinking Industrial Drinking Institutional/Governmental Drinking Other - Schools Drinking Other- Housing Authority Drinking Other Construction Drinking Other - Senior Drinking Other Unbilled/Unmetered Drinking Losses Drinking Total 1,578 1,830 2,123 2,458 2,852 3,306 Provost & Pritchard Consulting Group June
39 Table 4-3: Total Water Demands Section Four: System Water Use 2015 Urban Water Management Plan Description Potable and Raw Water 1,578 1,830 2,123 2,458 2,852 3,306 Recycled Water Demand ,460 Total Water Demand 1,578 1,830 2,123 3,188 3,582 4, Distribution System Water Losses Legal Requirements: CWC 10631(e)(1) and (2) Quantify, to the extent records are available, past and current water use over the same five-year increments described in subdivision (a), and projected water use, identifying the uses among water use sectors, including, but not necessarily limited to, all of the following uses: (J) Distribution system water loss CWC (e)(3) (A) For the 2015 urban water management plan update, the distribution system water loss shall be quantified for the most recent 12-month period available. For all subsequent updates, the distribution system water loss shall be quantified for each of the five years preceding the plan update. (B) The distribution system water loss quantification shall be reported in accordance with a worksheet approved or developed by the department through a public process. The water loss quantification worksheet shall be based on the water system balance methodology developed by the American Water Works Association. System water losses were calculated using AWWA Free Water Audit Software. The software uses inputs from volume of water supplied, volume of water delivered, and metering error percentages (not used) to quantify and classify discrepancies between production meters and consumption meters. Using the AWWA software, the difference between production and consumption was 130 MG. The software uses default percentages of water supplied to calculate unmetered authorized consumption. This value is not included in total loss. Unmetered unauthorized use, apparent loss and real loss is also calculated using default percentages of total loss. Authorized, unmetered activities include line flushing for mains and hydrants, firefighting, and other municipal activities that use water, but are not metered. The software assumes 1.25% of the total volume supplied is used for authorized, unmetered consumption, which is 19.7 MG per year. Therefore, apparent and real losses make up approximately 110 MG per year. This value is then broken into apparent loss, caused by unauthorized unmetered consumption, metering errors, and data handling inaccuracies, and real loss (leakage from the system). Table 4-3 below shows total water losses for 2015 calculated by AWWA software. Values for all loss types can be found in Appendix D. Provost & Pritchard Consulting Group June
40 Section Four: System Water Use 2015 Urban Water Management Plan Table 4-4: Water Loss Summary Reporting Period Start Date (Month/Year) Loss (MG) July Water Savings from Codes, Standards, Ordinances, or Land Use Plans Legal Requirements: CWC (e)(4) (A) If available and applicable to an urban water supplier, water use projections may display and account for the water savings estimated to result from adopted codes, standards, ordinances, or transportation and land use plans identified by the urban water supplier, as applicable to the service area. (B) To the extent that an urban water supplier reports the information described in subparagraph (A), an urban water supplier shall do both of the following: (i) Provide citations of the various codes, standards, ordinances, or transportation and land use plans utilized in making the projections.(ii) Indicate the extent that the water use projections consider savings from codes, standards, ordinances, or transportation and land use plans. Water use projections that do not account for these water savings shall be noted of that fact. Ordinances have been adopted to reduce water waste. These ordinances and policies are better described in Chapters 8 and 9. Savings due to ordinance implementation are not calculated at this time. However, reductions in consumption are apparent in annual water use reporting. Table 4-5: Inclusion in Water Use Projections Passive Savings Included Lower Income Included No Yes 4.4 Water Use for Lower Income Households Legal Requirements: CWC (a) The water use projections required by Section shall include projected water use for single family and multifamily residential housing needed for lower income households, as defined in Section of the Health and Safety Code, as identified in the housing element of any city, county, or city and county in the service area of the supplier. California Health and Safety Code (a) "Lower income households" means persons and families whose income does not exceed the qualifying limits for lower income families In the event the federal standards are discontinued, the department shall, by regulation, establish income limits for lower income households for all geographic areas of the state at 80 percent of area median income, adjusted for family size and revised annually. The City records water used by the Housing Authority, which provide subsidized housing to low income families, in its own water use category. However, the Housing Authority only consumes Provost & Pritchard Consulting Group June
41 Section Four: System Water Use 2015 Urban Water Management Plan 1% of the total water supply. Therefore, this quantity is not reflective of the low income population so alternative methods were required to assess their use. Based on 2010 census data, from 2009 to 2013, 28.6% of Dinuba s residents are below the poverty level. Disproportionate poverty and unemployment are the result of seasonal, agricultural jobs, which make up a large portion of Dinuba s economy. It can be assumed that 28.6% of residential water demands are from low income families. The proportion of existing single family and multi-family residences were considered when projecting water demands. It is assumed that low income families are distributed between single family and multi-family homes based on land use percentages as noted in Table 3-1. However, this UWMP does not account for reduced water demand in multi-family residences due to lower outdoor use. Table 4-6 shows current and projected low income water demands. Table 4-6: Low-Income Projected Water Demands Low Income Water Demands Single-family residential Multi-family residential Total Units : Million Gallons Provost & Pritchard Consulting Group June
42 5 Baseline and Targets 5.1 Updated Calculations from 2010 UWMP Legal Requirements: Section Five: Baseline and Targets 2015 Urban Water Management Plan CWC (g) An urban retail water supplier may update its 2020 urban water use target in its 2015 urban water management plan required pursuant to Part 2.6 (commencing with Section 10610). Methodologies DWR 2010, Methodology 2 Service Area Population Page 27 - Water suppliers may revise population estimates for baseline years between 2000 and 2010 when 2010 census information becomes available. DWR will examine discrepancy between the actual population estimate and DOF s projections for 2010; if significant discrepancies are discovered, DWR may require some or all suppliers to update their baseline population estimates. For the 2015 UWMP, the method for obtaining the 2020 water use target and the baseline period remain unchanged from the 2010 UWMP. However, discrepancies between the 2010 UWMP population data and the current Department of Finance (DOF) population data were corrected. It is possible that rounding and reporting errors from the 2010 UWMP exist. Additionally, the 2010 UWMP was prepared using a mixture of water volume units including million gallons per day (mgd), gallons per capita daily (gpcd), and acre-feet per year (afy). These inconsistencies have been corrected for the 2015 UWMP. Potable water and effluent will be reported in MG which is consistent with the City s meters and reporting methods. The SBX7-7 tables convert standard volumes to gpcd to determine compliance with water reductions. The methodology and results described below are documented in SBX7-7 Tables found in Appendix D. All reference to these tables should be viewed in this attachment and no table in the body of the UWMP document should be thought to act as a substitute to any of the DWR tables provided in tandem with the UWMP Guidelines. Some of the SBX7-7 tables in Appendix D are generally described and the results presented below Target Method In the 2010 UWMP, the 2020 water use target and 2015 interim water use target were calculated using the hydrologic region method (Method 3). Because of the City s self imposed conservation in prior years, primarily metering, consumption was already well below the Tulare Lake regional baseline of 285 gpcd. Use of other target methods would establish a per capita consumption much lower than that of the hydrological region and would be unsustainable. Due to discrepancies in the population data from the 2010 UWMP and the DOF, the baseline was recalculated for both the 10-year and 5-year baseline periods. The baseline adjustment caused the interim target to increase slightly. Regardless, the City s implementation of water use restrictions due to severe drought ensured that 2015 goals were met regardless of changes in baseline calculations. Provost & Pritchard Consulting Group June
43 Section Five: Baseline and Targets 2015 Urban Water Management Plan Census Data The population data used in the 2010 UWMP was replaced with data from the 2010 Census 6 and the Department of Finance 7. There are a small number of households that lie outside the water service area, but within the City boundary. These homes are supplied with water using private, domestic wells. The number of homes outside the service area is less than 100. It is assumed that these homes make up less than 1% of the population and are considered negligible for analysis purposes SBX7-7 Verification The following information refers to SBX7-7 verification tables, which assist water agencies in determining their target gpcd and compliance with 2015 water reduction targets determined in the 2010 UWMP. All SBX7-7 Verification Tables can be located in Appendix D. 5.2 Baseline Periods Legal Requirements: CWC (e) An urban retail water supplier shall include in its urban water management plan... the baseline daily per capita water use along with the bases for determining those estimates, including references to supporting data. (g) An urban retail water supplier may update its 2020 urban water use target in its 2015 urban water management plan required pursuant to Part 2.6 (commencing with Section 10610). The baseline period was not adjusted in the 2015 UWMP. The 10-year baseline ranges from 2001 to 2010 and the 5-year baseline ranges from 2006 to However, population data was changed to reflect DOF data and a new baseline gpcd was calculated for each year. Consumption averages for the 10-year baseline period are 222 gpcd and 220 gpcd for the 5-year baseline period. 5.3 Service Area Population Legal Requirements: CWC (e) An urban retail water supplier shall include in its urban water management plan due in 2015 the baseline daily per capita water use, along with the bases for determining those estimates, including references to supporting data. (f) When calculating per capita values for the purposes of this chapter, an urban retail water supplier shall determine population using federal, state, and local population reports and projections. CWC (a) (2) The plan shall include any standardized forms, tables, or displays specified by the department Provost & Pritchard Consulting Group June
44 Section Five: Baseline and Targets 2015 Urban Water Management Plan As of December 2015, the population of Dinuba was estimated to be 23,966. Population data was obtained from the US Census Bureau and DOF websites. A small percentage of the population lies outside of the water service boundary. However, the total number of homes outside of the water service area is assumed to be less than 100. Homes in North Dinuba are not included in this service map provided by the Department of Public Health; however, they are served by the City with a 12 inch water main running up Alta Avenue. Developed areas not served by the City make up a small population; as such, their water consumption is considered insignificant. SBX7-7 Table 3 in Appendix D provides population data. The map below shows the water service boundary within the City. It should be noted that most of the land outside of the water service boundary is empty land or farmland. Provost & Pritchard Consulting Group June


45 Section Five: Baseline and Targets 2015 Urban Water Management Plan Figure 5-1: Water Service Area Map Provost & Pritchard Consulting Group June
46 Section Five: Baseline and Targets 2015 Urban Water Management Plan 5.4 Gross Water Use Legal Requirements: CWC (g) Gross Water Use means the total volume of water, whether treated or untreated, entering the distribution system of an urban retail water supplier, excluding all of the following: (1) Recycled water that is delivered within the service area of an urban retail water supplier or its urban wholesale water supplier (2) The net volume of water that the urban retail water supplier places into long term storage (3) The volume of water the urban retail water supplier conveys for use by another urban water supplier (4) The volume of water delivered for agricultural use, except as otherwise provided in subdivision (f) of Section California Code of Regulations Title 23 Division 2 Chapter 5.1 Article Section 596 (a) An urban retail water supplier that has a substantial percentage of industrial water use in its service area is eligible to exclude the process water use of existing industrial water customers from the calculation of its gross water use to avoid a disproportionate burden on another customer sector. The City of Dinuba relies solely on groundwater. Totals for groundwater pumped into the system are reported annually in the Comprehensive Annual Financial Report. The City had eight active wells providing water to customers during the 2015 fiscal year. 1,578 MG of water were supplied by the City public water system. This total does not include landscape water for the golf course and parks, which use water from City and agricultural wells contaminated with DBCP. No exclusions for industrial process water were used because the industrial sector only accounts for about 12% of water consumption and data for industrial consumption during the baseline period is not readily available. There are no transfers of water into or out of the City. See SBX Table 4 Annual Gross Water Use in Appendix D. 5.5 Baseline Daily Per Capita Water Use The 10-year average water use baseline was recalculated to be 222 gpcd. This was adjusted from the 2010 gpcd of 216. Differences in baseline consumption were due to revised population numbers. The 5-year average baseline was calculated to be 220 gpcd (See Table 5-1 Gallons per Capita per Day). The table below also shows calculated 2015 interim daily per capita consumption addressed in Section 5.6. Provost & Pritchard Consulting Group June
47 Table 5-1: Gallons Per Capita per Day Baseline Year Service Area Population Section Five: Baseline and Targets 2015 Urban Water Management Plan Annual Gross Water Use (MG) Daily Per Capita Water Use (gpcd) 10 to 15 Year Baseline gpcd Year ,067 1, Year ,427 1, Year ,249 1, Year ,515 1, Year ,989 1, Year ,179 1, Year ,562 1, Year ,610 1, Year ,914 1, Year ,453 1, Year Average Baseline gpcd Compliance Year gpcd ,966 1, and 2020 Targets Legal Requirements: CWC (e) An urban retail water supplier shall include in its urban water management plan... urban water use target, interim urban water use target, along with the basis for determining those estimates, including references to supporting data ( (e)). CWC (g) An urban retail water supplier may update its 2020 urban water use target in its 2015 urban water management plan Selection of Target Method Target method 3 Hydrological Regional Target Method was used to determine the 2020 gpcd goal. Because of the City s self imposed conservation in prior years, consumption was already well below the regional gpcd. The City has had water conservation ordinances in place since 1989 and continues to be proactive in water management. The entire water system is metered and customers are charged volumetric rates to encourage conservation. Use of other methods would establish a consumption target much lower than that of the hydrological region and would be unsustainable. Other target methods include a 20% reduction of total baseline, Performance Standards, which requires detailed use information, and Savings by Water Use Sector, which requires detailed water savings information. Of the last two methods, the required information is not available. Provost & Pritchard Consulting Group June
48 Section Five: Baseline and Targets 2015 Urban Water Management Plan The Hydrological Regional Target Method is based upon conservation targets that were established for the state as a whole to reach the 20% water use reduction mandated in the 20x2020 program. The State was broken into 10 distinct hydrological regions. Baseline consumption for each region was calculated and compared to the statewide baseline. The 2020 conservation goals were then adjusted for each region based on the regional baseline values. The City of Dinuba lies in the Tulare Lake hydrologic region which has higher baseline consumption than most regions, using an average of 285 gpcd. The Tulare Lake region 2020 goal is 188 gpcd which is a reduction of 34%. The hydrological region method uses the regional target as a baseline for reductions in individual agencies. 95% of this regional target is the local agency 2020 target. For a water agency in the Tulare Lake hydrological region using this method, the 2020 target will be 188 gpcd X 0.95=179 gpcd. The 2015 interim target varies for different water suppliers based on individual baseline gpcd. The baseline for the City of Dinuba is 222 gpcd. Using this, a 2015 interim target of 200 gpcd was calculated. (See SBX Table 7-E: Target Method, in Appendix D) Year Baseline 2020 Target Confirmation Legal Requirements: CWC Notwithstanding the method adopted by an urban retail water supplier pursuant to Section , an urban retail water supplier's per capita daily water use reduction shall be no less than 5 percent of base daily per capita water use as defined in paragraph (3) of subdivision (b) of Section This section does not apply to an urban retail water supplier with a base daily per capita water use at or below 100 gallons per capita per day. The 5-year baseline target confirmation verifies that the calculated 2020 target is less than or equal to 95% of the 5-year baseline gpcd. 95% of the 5-year baseline is the maximum allowable 2020 target. The purpose of the 5-year baseline is to help ensure the future conservation goals are at least 5% lower then recent water usage. The maximum allowable target is 200 gpcd X 0.95 = 190 gpcd. This is greater than the 2020 target which is 179 gpcd. (See SBX Table 7-F Confirm Minimum Reduction for 2020 Target, in Appendix D) Interim Urban Water Use Target Largely due to water restrictions put into place during the last few drought years, the City of Dinuba has met and exceeded their previously calculated 2015 interim water use target of 198 gpcd (due to population adjustments the 2015 target has changed from 198 to 200 gpcd). The City is currently averaging 180 gpcd annually. They are near reaching their 2020 target of 179 gpcd. Provost & Pritchard Consulting Group June
49 Section Five: Baseline and Targets 2015 Urban Water Management Plan Baselines and Targets Summary Table 5-2: Baselines and Targets Summary Baseline Period Start Years (From SBX7-7 Table 1) End Years (From SBX7-7 Table 1) Average GPCD 2015 Interim Target Confirmed 2020 Target 10 Year Year Compliance Daily per Capita Water Use Legal Requirements: CWC (e) Compliance daily per-capita water use means the gross water use during the final year of the reporting period CWC (a) Each urban retail water supplier shall meet its interim urban water use target by December 31, CWC (e) An urban retail water supplier shall include in its urban water management plan due in compliance daily per capita water use, along with the bases for determining those estimates, including references to supporting data Target Compliance The City of Dinuba met and far exceeded the 2015 target. The 2015 target gpcd was recalculated to be 200 gpcd. The actual 2015 gpcd is 180 gpcd. This is only one gallon away from the 2020 goal of 179 gpcd. This dramatic decrease in consumption from 2010 is likely due to mandatory water reductions ordered by the Governor during the most recent drought. Figure 5-2 shows annual gpcd for the City from 2001 to This graph illustrates the City s trend toward compliance with the interim 2015 target and convergence with the 2020 target. Large spikes in consumption are typically in response to drought years. (See SBX Table Compliance, in Appendix D). Provost & Pritchard Consulting Group June
50 Section Five: Baseline and Targets 2015 Urban Water Management Plan Water Use Per Capita, Gallons Per Capita Per Day (GPCD) Average Daily per Capita Water Use in GPCD target = target = Year (Based on Fiscal Year from 7/01-6/30) Figure 5-2: Graph of Daily per Capita Water Use Adjustments to 2015 Gross Water Use Legal Requirements: CWC (d) When determining compliance daily per capita water use, an urban retail water supplier may consider the following factors: Differences in evapotranspiration and rainfall in the baseline period compared to the compliance reporting period. Substantial changes to commercial or industrial water use resulting from increased business output and economic development that have occurred during the reporting period. Substantial changes to institutional water use resulting from fire suppression services or other extraordinary events, or from new or expanded operations, that have occurred during the reporting period. If the urban retail water supplier elects to adjust its estimate of compliance daily per capita water use due to one or more of the factors described in paragraph (1), it shall provide the basis for, and data supporting, the adjustment in the report required by Section Methodology Document, Methodology 4 This section discusses adjustments to compliance-year GPCD because of changes in distribution area caused by mergers, annexation, and other scenarios that occur between the baseline and compliance years. No adjustments were made to the daily per capita water use. Provost & Pritchard Consulting Group June
51 6 System Supplies Section Six: System Supplies 2015 Urban Water Management Plan Legal Requirements: 10631(b) Identify and quantify, to the extent practicable, the existing and planned sources of water available to the supplier over the same five-year increments described in subdivision (a). Currently, the City of Dinuba uses only groundwater. There are no current plans to implement the use of other water sources, including recycled water. However, the City is aware that there are other potential water supply sources, listed in order of importance, they are/could be: 1. Additional Groundwater 2. Recycled water 3. Shallow aquifer groundwater (treated) 4. Surface water 6.1 Water Supply Facilities Dinuba s water supply source consists of a series of domestic wells that are scattered throughout the service area. The city operates eight (8) drinking water wells. They also maintain two elevated storage tanks that have a 1.25 million gallon capacity. In addition to the elevated tanks, there is the Northeast Water Reservoir. This reservoir provides an emergency supply of domestic water for the City. The Northeast Water Reservoir Project constructed a two million gallon, ground level tank and booster pump station in the northeast section of the City. The distribution system piping network consists of 74 miles of water main and buried pipelines between 2 and 12 in diameter. Ends are flushed via fire hydrants quarterly. The distribution system is run through a Supervisory Control and Data Acquisition (SCADA) system, which uses water pressure in the mentioned elevated tanks to determine tank level and prompt well pumps. The City of Dinuba also provides water service to commercial, industrial, and public facilities located within the City limits. In addition to the eight drinking water wells, the City uses water from wells contaminated with dibromochloroproplane (DBCP) to irrigate 95.5 acres of parks and schools. The golf course is irrigated by a shallow aquifer well adjacent to the wastewater treatment facility that was previously used for agriculture. Figure 6-1 shows the 2003 existing pipe network, elevated tanks, and wells from the 2008 City of Dinuba Water Master Plan. The 2 MG ground level tank and some of the newer wells are not shown. Provost & Pritchard Consulting Group June


52 Section Six: System Supplies 2015 Urban Water Management Plan Figure 6-1: 2003 Existing Pipe Network - Boyle 2008 Water Master Plan Provost & Pritchard Consulting Group June
53 Section Six: System Supplies 2015 Urban Water Management Plan 6.2 Purchased Water The City of Dinuba does not purchase water from an outside supplier. 6.3 Groundwater The only source of water for the City of Dinuba s distribution system is groundwater. The City lies in the Kings Groundwater Sub-basin. It is also within the boundary of the Alta Irrigation District (AID). The City manages groundwater resources in conjunction with AID, who provides water for irrigation to farmers in the area. The Kings Groundwater Sub-basin is not adjudicated, but has been designated critically overdrafted by DWR Sigma from Owen Groundwater Basin Description Legal Requirements: CWC (b) If groundwater is identified as an existing or planned source of water available to the supplier, all of the following information shall be included in the plan: (2) A description of any groundwater basin or basins from which the urban water supplier pumps groundwater. The City of Dinuba is located within the Kings Groundwater Sub-basin of the San Joaquin Valley Groundwater Basin (see Figure 6-2). The Kings Groundwater Sub-basin covers approximately 1,530 square miles (976,000 acres) and reaches across 3 counties (Fresno, Tulare, and Kings). The basin is bound by the San Joaquin River to the north and the South Fork of the Kings River to the south. The eastern boundary is the alluvium-granitic rock interface of the Sierra Nevada foothills and to the east it is bound by the Delta-Mendota and Westside Subbasins. The City s groundwater wells are dispersed fairly evenly within Dinuba s city limits. Future groundwater wells are proposed to be evenly dispersed between urban and rural areas. The Kings Sub-basin aquifer is made up of permeable, layered lenses, of clay, silt, sand, course aggregate or gravel, cobbles, and boulders. Below is an excerpt from the DWR Bulletin describing the Kings Sub-basin physical characteristics. The Kings Sub-basin groundwater aquifer system consists of unconsolidated continental deposits. These deposits are an older series of Tertiary and Quaternary age overlain by a younger series of deposits of Quaternary age. The Quaternary age deposits are divided into older alluvium, lacustrine and marsh deposits, younger alluvium, and flood-basin deposits. The older alluvium is an important aquifer in the subbasin. It consists of intercalated lenses of clay, silt, silty and sandy clay, clayey and silty sand, sand, gravel, cobbles, and boulders. It is, generally, fine grained near the trough of the valley. Lacustrine and 8 Page and LeBlanc 1969, from California Department of Water Resources, Bulletin 118, Provost & Pritchard Consulting Group June


54 Section Six: System Supplies 2015 Urban Water Management Plan marsh deposits are interbedded with the older alluvium in the western portion of the subbasin. The younger alluvium is a sedimentary deposit of fluvial arkosic beds that overlies the older alluvium and is interbedded with the flood-basin deposits. Its lithology is similar to the underlying older alluvium. Beneath river channels, the younger alluvium is highly permeable. Beneath flood plains, it may be of poor permeability. The flood-basin deposits occur along the Fresno Slough and James Bypass. They consist of sand, silt, and clay. The continental deposits of Tertiary and Quaternary age crop out beneath the extreme southeastern part of the sub-basin and yield small amounts of water to wells. The deposits of Quaternary age are exposed over most of the area and yield more than 90 percent of the water pumped from wells. 9 Figure 6-2: Kings Groundwater Sub-Basin 9 Page and LeBlanc 1969, from California Department of Water Resources, Bulletin 118, Provost & Pritchard Consulting Group June
55 Section Six: System Supplies 2015 Urban Water Management Plan Groundwater Management Legal Requirements: CWC (b) If groundwater is identified as an existing or planned source of water available to the supplier, all of the following information shall be included in the plan: A copy of any groundwater management plan adopted by the urban water supplier or any other specific authorization for groundwater management. For basins that a court or the board has adjudicated the rights to pump groundwater, a copy of the order or decree adopted by the court or the board and a description of the amount of groundwater the urban water supplier has the legal right to pump under the order or decree. The City of Dinuba is within the boundary of the Alta Irrigation District. AID adopted its first Groundwater Management Plan in The Plan was updated in 2010 to comply with state water law. Although many customers of AID use both surface and groundwater, Dinuba uses groundwater only. AID has been monitoring groundwater levels for over 75 years. This data is compiled into the Kings River Service Area Annual Groundwater Report 10 along with other groundwater level measurements from all over the Kings Basin. According to the 2010 AID Groundwater Management Plan 11, water level measurements show a downward trend in groundwater elevations. Groundwater overdraft for the area is approximated at 22,000 acrefeet/year. However, due to severe drought over several years, overdraft may be far more severe than stated in the Groundwater Management Plan. The primary economy within the Alta Irrigation District is agriculture. It was estimated in 2010 that the average crop demand for irrigation was 325,000 acre-feet; however, the average surface supply was 148,416 acre-feet. The inability to supply farmers with an adequate amount of surface water has resulted in a strong reliance on alternate water sources. With the recent drought and unavailability of surface water, farmers have grown more dependent on groundwater, increasing the likelihood of overdraft. Management of groundwater resources is more critical now than ever. The 2010 AID Groundwater Management Plan included 15 management proposals. Those that would directly benefit the City of Dinuba included: Water level and quality monitoring; Direct and indirect groundwater recharge; Water conservation / regulations; Groundwater banking; Pumping restrictions; and Additional storage. As funding becomes available it will be feasible for the City and AID to investigate these options. 10 Kings River Conservation District, Annual Groundwater Report, Alta Irrigation District, Groundwater Management Plan, Provost & Pritchard Consulting Group June
56 Section Six: System Supplies 2015 Urban Water Management Plan Overdraft Conditions Legal Requirements: CWC 10631(b)(2).For basins that have not been adjudicated, (provide) information as to whether the department has identified the basin or basins as overdrafted or has projected that the basin will become overdrafted if present management conditions continue, in the most current official departmental bulletin that characterizes the condition of the groundwater basin, and a detailed description of the efforts being undertaken by the urban water supplier to eliminate the long-term overdraft condition. The groundwater levels in the Kings Basin have shown significant decreases in elevation due to drought and pumping overdraft. In the early 1900s, the Alta Irrigation District had a groundwater table that averaged less than 10 feet below ground level. However, drought, development, and unreliable surface water supplies have put additional strain on groundwater resources. Droughts in the years , , and dryer than normal winter in 2013 and 2014 caused groundwater levels to decline 20 to 40 feet in most areas. According to the 2013/2014 Kings River Conservation District Annual Groundwater Report, the current ground-surface to watersurface distance in the Dinuba area is approximately 60 feet. The report also estimates that the change in storage for the Kings Sub-basin, from 2003 to 2014, has decreased by 287,858 acrefeet/year. DWR Bulletin identified the Kings Sub-basin as being in a critical condition of overdraft. The overdraft status was not re-evaluated in DWR Bulletin , however the DWR Bulletin recognizes water suppliers in the basin as conducting recharge efforts in order to maintain a viable water supply Historical Pumping Legal Requirements: CWC (b) If groundwater is identified as an existing or planned source of water available to the supplier, all of the following information shall be included in the plan: 3) (Provide a) detailed description and analysis of the location, amount, and sufficiency of groundwater pumped by the urban water supplier for the past five years. The description and analysis shall be based on information that is reasonably available, including, but not limited to, historic use records. The City of Dinuba records groundwater pumping by fiscal year and reports this information in their Comprehensive Annual Financial Report 12 (CAFR). The CAFR reports the number of operating City wells, service connections, and total volume of water pumped. Well locations can be seen on Figure 6-1. They are all located within the City limits. The City pumped a total of 1,578 MG in Although depth to water levels have been increasing in the area, the City wells provide a reliable source of water. 12 Dinuba Annual Financial Report, Provost & Pritchard Consulting Group June
57 Section Six: System Supplies 2015 Urban Water Management Plan Table 6-1: Groundwater Volume Pumped Basin Sub-Basin San Joaquin Valley Kings 1,671 1,996 1,570 1,790 1,578 Total 1,671 1,996 1,570 1,790 1,578 Units : MG Groundwater Recharge, Storage and Banking The City of Dinuba stores all stormwater and wastewater in drainage basins and percolation ponds. Stormwater stored in drainage basins is allowed to percolate into the ground for as long as possible, before being pumped into AID irrigation canals to be used for agricultural purposes. Wastewater is disposed of in percolation ponds, which recharge groundwater. To date, no beneficial use for wastewater effluent, as defined by DWR, has been approved without further treatment, which is unfeasible at this time. However, groundwater from an old agricultural well adjacent to the wastewater percolation ponds is used to irrigate the golf course. Additionally, the City, in partnership with the Alta Irrigation District, developed a 28 acre ground water recharge facility that seasonally collects urban drainage water from approximately 800 acres of the community. It is also used to store excess irrigation water available to the AID. There are several smaller stormwater catch basins, publicly and privately owned, throughout the City. Water from these basins is allowed to percolate into soil recharging the shallow aquifer, which is then pumped for agricultural irrigation. 6.4 Surface Water The City of Dinuba does not currently use surface water. In the future the City may explore opportunities to purchase surface water from AID for groundwater recharge within the City limits. 6.5 Stormwater In Dinuba there are no points where stormwater discharges into any waters of the US or natural drainage ways. Presently, stormwater discharges into City or privately owned and maintained detention or retention basins. Drainage water is allowed maximum recharge opportunities before being pumped into irrigation canals. In 2009, a dedicated groundwater recharge basin was constructed to help reduce flooding as well as promote groundwater recharge. The basin covers 28 acres of land. Additionally, several smaller basins are located around the City. Combined, these smaller basins cover an extra 29.5 acres 13. The basins serve approximately 1,900 acres of developed land and have the potential capacity to recharge nearly 515 MG annually, assuming one hundred percent infiltration and ignoring evapotranspiration , Quad Knopf, City of Dinuba Municipal Services Review; Provost & Pritchard Consulting Group June
58 Section Six: System Supplies 2015 Urban Water Management Plan 6.6 Other Non-Potable Water Former city wells and agricultural wells that are unusable as a potable water source are used for irrigation in City parks and schools. These venues are listed below: Rose Ann Vulch Park (10 acres), which is irrigated from former City Well #2 is contaminated with DBCP; Felix Delgado Park (8 acres) and Wilson Elementary School playground (8 acres), which are irrigated from former City Well #7 is contaminated with DBCP. KC Vista Park (18.5 acres), which is irrigated from a modified on-site agricultural well that is contaminated with DBCP. Lincoln Elementary School playground (8 acres), which is irrigated from a modified on-site agricultural well that is contaminated with DBCP. Roosevelt Elementary School playground (10 acres), which is irrigated from a modified on-site agricultural well that is contaminated with DBCP. Jefferson Elementary School playground (8 acres), which is irrigated from a modified on-site agricultural well that is contaminated with DBCP. Washington Intermediate School athletic fields (15 acres), which is irrigated from a modified on-site agricultural well that is contaminated with DBCP. Dinuba High School athletic fields (20 acres), which is irrigated from a modified onsite agricultural well that is contaminated with DBCP. Ridge Creek Golf Course (240 acres), which is irrigated from a 12 acre lake fed by a former shallow agricultural well adjacent to the golf course and the WWRF The majority of these contaminated wells are not metered. Of the wells that are metered, none are monitored or recorded for reasons other than maintenance, so extracted groundwater volumes are estimated. Using the American Society of Civil Engineers (ASCE) Standardized Reference Evapotranspiration Equation, it is assumed these parks and schools use about 540 MG of groundwater from wells contaminated with DCPB annually. Water delivered to these locations for irrigation is not accounted for in the total per capita consumption reported in Chapter 5. These wells are independent of the City PWS or have been removed from the PWS. They are not currently billed or tracked. 6.7 Wastewater and Recycled Water Recycled Water Coordination Legal Requirements: CWC The plan shall provide, to the extent available, information on recycled water and its potential for use as a water source in the service area of the urban water supplier. The preparation of the plan shall be coordinated with local water, wastewater, groundwater, and planning agencies that operate within the supplier's service area. Provost & Pritchard Consulting Group June
59 Section Six: System Supplies 2015 Urban Water Management Plan Due to budget constraints, the City was unable to implement recycled water projects between the years The City submitted the Dinuba Recreation Conservation & Reclamation project proposal to the Kings Basin Water Authority for consideration in the Integrated Regional Water Management (IRWM) grant solicitation. The City has completed the preliminary design for the project. Their proposal to the Kings Basin Water Authority requested funding to prepare the final plans and specifications for construction of a tertiary water treatment and distribution system that will supply water for agriculture and landscaping, as well as ease the dependence on deep aquifer groundwater. The City s proposal was not selected for a funding solicitation by the Kings Basin Water Authority. There are currently no plans to proceed with design until funding becomes available. The City still has a long-term interest in implementing recycled water use and will continue to seek funding opportunities. Because of clarifications to the term recycled water, water that was once considered recycled for the 2010 UWMP must be recategorized. See Table 6-5 for 2010 recycled water projections and 2015 recycled water use comparison. The City received authorization from California Regional Water Quality Control Board (RWQCB) to use wastewater directly for irrigation in 1995; however, there are currently no agreements in place with local farmers that would provide direct discharge to fields, and thus, classify treated wastewater as recycled water. Recycled water is defined as water which, as a result of treatment of waste, is suitable for direct use. Treated wastewater that is allowed to percolate back into the ground is not considered recycled unless treated to tertiary standards and then extracted for use. Regardless, the City does practice using shallow groundwater that has been recharged by wastewater percolation ponds for irrigation of the golf course and agricultural purposes. Water from contaminated wells used to irrigate parks and schools was also incorrectly labeled as recycled water in the previous UWMP Wastewater Collection, Treatment, and Disposal Legal Requirements: CWC (a) (Describe) the wastewater collection and treatment systems in the supplier's service area, including a quantification of the amount of wastewater collected and treated and the methods of wastewater disposal. CWC (b) (Describe) the quantity of treated wastewater that meets recycled water standards, is being discharged, and is otherwise available for use in a recycled water project. The City operates a wastewater reclamation facility (WWRF) that received and treated 709 MG of effluent in The effluent is treated to secondary treatment standards, then delivered to retention ponds on-site that percolate into the shallow aquifer. There are eleven active ponds, which have an approximate volume of 22 million gallons, and one emergency pond. The groundwater near the percolation ponds is then pumped and reused for irrigation and agricultural purposes. In 2006, the City initiated a study to determine the feasibility of delivering groundwater extracted from beneath the WWRF ponds to the community for additional irrigation of landscaped areas. Preliminary samples taken from test wells located in the vicinity of the WWRF indicated that groundwater extracted 100 feet below the WWRF disposal ponds met Provost & Pritchard Consulting Group June

60 Section Six: System Supplies 2015 Urban Water Management Plan Title 22 standards. However, regulatory agencies indicated to the City that this water would have to be filtered and disinfected before it could be reused. These requirements would make this process economically infeasible. The City has long term interest in utilizing wastewater and will continue to search for funding opportunities to plan, design, and construct recycled water facilities. Exploring options for delivery of treated effluent to agricultural fields for irrigation and agreements between potential recycled water users and the City will be considered as well. Table 6-2: Wastewater Generated within Service Area in 2015 Wastewater Collection Agency City of Dinuba Wastewater Treatment Agency City of Dinuba Treatment Plant Name City of Dinuba Wastewater Reclamation Facility Is WWRF Located Within Service Area? Total Wastewater Collected from Service Area Was Volume Measured or Estimated? Volume of Wastewater Collected from the Service Area 2015 Yes Measured 709 MG 709 MG Provost & Pritchard Consulting Group June
61 Section Six: System Supplies 2015 Urban Water Management Plan Table 6-3: Wastewater Treatment and Discharge within Service Area in 2015 Name of Wastewater Treatment Plant Discharge Location Name or Identifier Discharge Location Description Method of Disposal Does this Include Wastewater Generated Outside the Service Area? Treatment Level Wastewater Treated Discharged Treated Waste-water Recycled Within Service Area 2015 Volumes Recycled Outside of Service Area, in other UWMP Recycled Outside of Service Area, not in other UMWP City of Dinuba Wastewater Reclamation Facility Ponds Avenue 412 Dinuba Percolation Ponds No Second 709 MG Total Wastewater Generated in UWMP Area 709 MG Provost & Pritchard Consulting Group June
62 Six: System Supplies 2015 Urban Water Management Plan Recycled Water Systems Legal Requirements: CWC 10633(c) (Describe) the recycled water currently being used in the supplier's service area, including, but not limited to, the type, place, and quantity of use. There are no recycled water systems in the City of Dinuba Recycled Water Beneficial Uses Legal Requirements: CWC 10633(d) (Describe and quantify) the potential uses of recycled water, including, but not limited to, agricultural irrigation, landscape irrigation, wildlife habitat enhancement, wetlands, industrial reuse, groundwater recharge, indirect potable reuse, and other appropriate uses, and a determination with regard to the technical and economic feasibility of serving those uses. CWC 10633(e) (Describe) the projected use of recycled water within the supplier s service area at the end of 5, 10, 15 and 20 years CWC 10633(e) (Describe) the projected use of recycled water within the supplier's service area at the end of 5, 10, 15, and 20 years, and a description of the actual use of recycled water in comparison to uses previously projected pursuant to this subdivision. It would be possible to use recycled water for landscaping and irrigation. However, the requirement to perform additional treatment makes this option economically unfeasible. The City currently allows stormwater and treated effluent to percolate into the shallow groundwater aquifer. The water is then pumped and used to irrigate crops and the golf course. There are no agreements in place for access to this water. Plans to design and construct a recycled water treatment and delivery system are in the preliminary design phase and funding to finish design is not available at this time. The City plans to continue tracking funding opportunities for recycled water projects. See Table 6-4 for projected recycled water beneficial uses and quantities pending the construction of the Dinuba Recreation Conservation & Reclamation Project. The first phase of this project proposes to improve the existing WWRF in order to treat 730 MG of effluent to tertiary standards annually; and, construct a distribution system to transport recycled water for agricultural and landscape irrigation. Groundwater recharge and/or surface water augmentation (for agricultural irrigation) will be considered for the complete build out, which will treat 1,460 MG annually to tertiary standards. Provost & Pritchard Consulting Group June
63 Section Six: System Supplies 2015 Urban Water Management Plan Table 6-4: Current and Projected Recycled Water Use Name of Agency Producing (Treating) the Recycled Water Name of Agency Operating (Distributing) the Recycled Water Beneficial Use Type Agricultural irrigation (Sales to AID) General Description of 2015 Uses City of Dinuba Wastewater Reclamation City of Dinuba Wastewater Reclamation Facility Level of Treatment Tertiary Landscape Irrigation Tertiary Golf Course Irrigation Tertiary Groundwater recharge Tertiary Surface water augmentation Tertiary TOTAL ,460 Provost & Pritchard Consulting Group June
64 Table 6-5: 2010 UWMP Recycled Water Use Projection Section Six: System Supplies 2015 Urban Water Management Plan Use Type 2010 Projection for 2015 (MG) 2015 Actual Use Sales to other agencies 0 0 Agricultural irrigation 0 0 Landscape irrigation (ex golf courses) Golf course irrigation Groundwater recharge 0 0 Other (define) 0 0 Total Actions to Encourage and Optimize Future Recycled Water Use Legal Requirements: CWC 10633(f) (Describe the) actions, including financial incentives, which may be taken to encourage the use of recycled water, and the projected results of these actions in terms of acre- feet of recycled water used per year. CWC 10633(g) (Provide a) plan for optimizing the use of recycled water in the supplier's service area, including actions to facilitate the installation of dual distribution systems, to promote recirculating uses, to facilitate the increased use of treated wastewater that meets recycled water standards, and to overcome any obstacles to achieving that increased use. There is the potential to incentivize use of recycled water among agricultural users considering the recent hardships of increasing prices and regulations on surface water. Low cost irrigation water could potentially be provided to local farmers or the Alta Irrigation District from recycled water treated by the City. Unfortunately, there is no delivery system in place that can transport water to fields surrounding the City. Plans to construct an upgraded treatment and distribution system have yet to be funded. Provost & Pritchard Consulting Group June
65 Section Six: System Supplies 2015 Urban Water Management Plan Table 6-6: Methods to Expand Future Recycled Water Use Actions Dinuba Recreation Conservation & Reclamation Project Phase 1 Dinuba Recreation Conservation & Reclamation Project Phase 2 Description Construction of recycled water treatment and distribution facility Expansion of recycled water treatment facility Planned Implementation Year Expected increase in recycled water supply (MG) Total 1, Desalinated Water Opportunities Legal Requirements: 10631(i) Describe the opportunities for development of desalinated water, including, but not limited to, ocean water, brackish water, and groundwater, as a long-term supply Brackish Water and/or Groundwater Desalination The groundwater that the City relies on is not brackish or in need of desalination. However, there is a small amount of shallow brackish groundwater located along the western portion of the Kings River Subbasin. There are currently no signs of brackish water within the groundwater in the area surrounding the City of Dinuba. Should brackish groundwater be found in the future, the City will consider this option Seawater Desalination Due to the geographic location of the City, desalination of seawater for use by the City is not practical or economically feasible. Provost & Pritchard Consulting Group June
66 Section Six: System Supplies 2015 Urban Water Management Plan 6.9 Exchanges or Transfers Legal Requirements: 10631(d) Describe the opportunities for exchanges or transfers of water on a short-term or long-term basis. Transfer opportunities of surface water could potentially exist with the Alta Irrigation District due to the fact that the City of Dinuba lies within the boundaries of AID. The drawback of utilizing surface water for domestic purposes is that it is not treated at a level appropriate for domestic consumption. A surface water treatment plant would be required to properly treat the water, which would unnecessarily increase capital and operating costs for the City. Another reason for not utilizing surface water is that it is only typically available in the Dinuba area for 4 months each year, which would make construction of a surface water treatment plant difficult to justify. However, raw surface water could potentially be used for groundwater recharge within the City limits. The City may explore this option in the future Future Water Projects Legal Requirements: CWC 10631(g) The urban water supplier shall include a detailed description of expected future projects and programs that the urban water supplier may implement to increase the amount of the water supply available to the urban water supplier in average, single-dry, and multiple-dry water years. The description shall identify specific projects and include a description of the increase in water supply that is expected to be available from each project. The description shall include an estimate with regard to the implementation timeline for each project or program. The 2010 UWMP referred to three future well projects for the City of Dinuba. These projects have been put on hold and have been programmed for future construction due to severe fiscal impacts that resulted from revenue reductions because of drought conservation efforts. See the table below for reference to these projects. In addition to groundwater supply projects, the City is in the early design stages for upgrades to the WWRF that would treat water to tertiary conditions. This would provide opportunities for the City to use recycled water for irrigation, landscaping, and recharge. Recycled water would also be available for irrigation. The original timeline for this project was to have the first phase constructed by However, funding limitations have likely set this project back and the actual construction date is unknown. For the purposes of this UWMP, the recycled water project proposal information is supplied. However, the recycled water volumes are not used in projected water supplies elsewhere because of uncertainty of availability. Provost & Pritchard Consulting Group June
67 Section Six: System Supplies 2015 Urban Water Management Plan Table 6-7: Future Water Supply Projects Action Joint Project with other agencies Description Y/N Agency Construction No Construction of New Well 21 Construction No Construction of New Well 22 Construction No Construction of New Well 23 Planned Implementation Year Expected Increase in Water Supply (MG) Summary of Existing and Planned Sources of Water Legal Requirements CWC (b)identify and quantify, to the extent practicable, the existing and planned sources of water available to the supplier over the same five-year increments described in subdivision 10631(a). (4) (Provide a) detailed description and analysis of the amount and location of groundwater that is projected to be pumped by the urban water supplier. The description and analysis shall be based on information that is reasonably available, including, but not limited to, historic use records. The City of Dinuba relies exclusively on groundwater pumped from the non-adjudicated Kings Sub-basin. Plans to add three wells with an annual capacity of 402 MG each have been put on hold due to reduced revenues as the result of mandatory conservation water restrictions. Plans to implement recycled water systems are also waiting for funding, but when active should provide an additional 1,460 MG of water annually for landscaping and irrigation and potentially recharge and augmentation of ground and surface water at full build out. Table 6-8 below summarizes all existing and projected future water supplies. It should be noted that recycled water projected for future use will replace water from contaminated wells and shallow aquifer that provide water for golf course and landscaping discussed in Section 6.6 Other Non-Potable Water. Remaining water will be transferred to Alta Irrigation District or used for groundwater recharge. For the purposes of the UWMP recycled water will not be factored into projected water demands (Table 4.2) due to the uncertainty of availability. Provost & Pritchard Consulting Group June
68 Table 6-8: Retail Water Supplies Current and Projected Source Type Detail Actual Volume Section Six: System Supplies 2015 Urban Water Management Plan Level of Treatment of Source Water Reasonably Available Volume Reasonably Available Volume Reasonably Available Volume Reasonably Available Volume Reasonably Available Volume Purchased Water Groundwater Kings Sub-basin 1,578 Drinking 1,830 2,123 2,458 2,852 3,306 Surface Water Recycled Water Tertiary ,460 Desalinated Water Stormwater Use Transfers Exchanges Other Total 1,578 1,830 2,123 3,188 3,582 4,766 Notes: Not directly used by City. Provide in-lieu groundwater recharge and reduces stress on aquifer Provost & Pritchard Consulting Group June
69 7 Water Supply Reliability 7.1 Constraints on Water Sources Legal Requirements: Section Seven: Water Supply Reliability 2015 Urban Water Management Plan CWC 10631(c)(2) For any water source that may not be available at a consistent level of use, given specific legal, environmental, water quality, or climatic factors, describe plans to supplement or replace that source with alternative sources or water demand management measures, to the extent practicable. CWC Section The plan shall include information, to the extent practicable, relating to the quality of existing sources of water available to the supplier over the same five-year increments as described in subdivision (a) of Section 10631, and the manner in which water quality affects water management strategies and supply reliability. Estimates from the 2008 Dinuba Water Master Plan stated that about 3,500 af (1,140 MG) per year of deep groundwater could be pumped by the City without creating groundwater overdraft. In 2015 the City pumped 1,578 million gallons (MG) of water. This leaves an assumed overdraft of 438 MG. Shallow groundwater is also available, but due to water quality concerns, additional treatment would be necessary. In addition, shallow groundwater supply would require a more intentional recharge program to ensure that a sustainable yield could be accomplished. The City conducted a water quality report in They had no drinking water standard violations. However, the City has had to remove some of their wells from the distribution system due to chemical contamination. These wells are either repurposed or destroyed. Sources of contamination are generally DBCP, a soil fumigant that was used as a pesticide on roots. Other sources include MTBE, a gasoline additive, and nitrates. Considering the City has eight active wells and is planning on adding an additional three, groundwater contamination should not affect supply. Although, if water quality declines, it may affect individual wells resulting in more demand on non-impacted wells. According to the Water Master Plan, the City can expect to rely solely on groundwater for the next few decades, but treatment of shallow groundwater and recharge efforts may be necessary. Because a treatment system for recycled water is not yet in place and is currently unfunded, potential treated water volumes will not be considered in water supply reliability. 7.2 Reliability by Type of Year Legal Requirements: CWC 10631(c) (1) Describe the reliability of the water supply and vulnerability to seasonal or climatic shortage, to the extent practicable, and provide data for each of the following: (A) an average water year, (B) a single dry water year, (C) multiple dry water years. Provost & Pritchard Consulting Group June
70 Section Seven: Water Supply Reliability 2015 Urban Water Management Plan It is expected by the City that all water requests will be satisfied completely by groundwater. Because the City relies solely on non-adjudicated groundwater, seasonal variation and climate change do not currently affect water supplies. However, agriculture and other industries have started to rely more heavily on groundwater due to the lack of available surface water. This increase in agricultural consumption, in addition to population growth in the City of Dinuba, will likely impact the static water levels and unrestricted pumping will continue to increase overdraft conditions. It is important to note that the Sustainable Groundwater Management Act (SGMA), though not in effect for the 2015 UWMPs, will likely impose future restrictions on the groundwater pumping. The table below contains annual precipitation data for average and dry years. This data was obtained from the San Joaquin/Hanford NOAA weather station (location indicator KO18). Hanford is approximately 21 miles southwest of Dinuba. Precipitation data was used rather than volume of water available because of the unrestricted groundwater pumping. Without pumping curtailment, the volume available is equal to the demand and remains at 100%, regardless of climatic conditions. Table 7-1: Bases of Water Year Data Water Year Type Base Year(s) Available Supplies if Year Type Repeats Annual Percent of Precipitation (in) Annual Average ** Average Water Year % Single-Dry Water Year % Multiple-Dry Water Years 1 st Year % Multiple-Dry Water Years 2 nd Year % Multiple-Dry Water Years 3 rd Year % **Annual precipitation data Supply and Demand Assessment Legal Requirements: CWC 10635(a) Every urban water supplier shall include, as part of its urban water management plan, an assessment of the reliability of its water service to its customers during normal, dry, and multiple dry water years. This water supply and demand assessment shall compare the total water supply sources available to the water supplier with the total projected water use over the next 20 years, in five-year increments, for a normal water year, a single dry water year, and multiple dry water years. The water service reliability assessment shall be based upon the information compiled pursuant to Section 10631, including available data from state, regional or local agency population projections within the service area of the urban water supplier. Because there are currently no restrictions on pumping the Kings Sub-basin other than those established in this UWMP, projected water demand is equal to supply, regardless of climatic conditions. Regardless, self imposed restrictions have long been in place by the City of Dinuba Provost & Pritchard Consulting Group June
71 Section Seven: Water Supply Reliability 2015 Urban Water Management Plan and Alta Irrigation District (AID) to monitor groundwater consumption. Unfortunately, measuring groundwater supply requires thorough modeling and analysis, something currently unavailable to the City of Dinuba, making the quantification of supply reductions complicated. Groundwater elevation levels are taken regularly to monitor groundwater, but actual supply volumes are only assumed. Should future plans incorporate groundwater restrictions, this UWMP will be updated accordingly. This plan does not include potential recycled water in future supply because there is no funding in the foreseeable future. Upon funding of the Dinuba Recreation, Conservation, and Reclamation project, the UWMP will be amended to incorporate recycled water into overall water supply reliability. Water from this project is intended for irrigation and will likely not affect residential use or groundwater pumping. It may, however, augment surface water for AID and help to supply irrigation customers. Table 7-2: Normal Year Supply and Demand Comparison Water Use Water Use (MG) Supply Totals 1,578 1,830 2,123 2,458 2,852 3,306 Demand Totals 1,578 1,830 2,123 2,458 2,852 3,306 Difference Table 7-3: Multiple Dry Year Supply and Demand Comparison Year 1 Year 2 Year 3 Water Use (MG) Supply totals 1,830 2,123 2,458 2,852 3,306 Demand totals 1,830 2,123 2,458 2,852 3,306 Difference Supply totals 1,830 2,123 2,458 2,852 3,306 Demand totals 1,830 2,123 2,458 2,852 3,306 Difference Supply totals 1,830 2,123 2,458 2,852 3,306 Demand totals 1,830 2,123 2,458 2,852 3,306 Difference Provost & Pritchard Consulting Group June
72 Section Seven: Water Supply Reliability 2015 Urban Water Management Plan 7.4 Regional Supply Reliability Legal Requirements CWC (f) An urban water supplier shall describe in the plan water management tools and options used by that entity that will maximize resources and minimize the need to import water from other regions. The City of Dinuba has been diligent in implementing measures that manage water consumption. They work closely with other stakeholders in the Kings Groundwater Sub-basin, which is the City s sole source of water. They also work closely with Alta Irrigation District, the local irrigation district, to employ water management measures that will benefit all parties. They monitor and report water levels and quality of City well water to Kings River Conservation District allowing the district to provide a comprehensive annual report of basin health. In addition to combined efforts with local districts, the City implements policies and demand management measures that assist in monitoring and managing water supplies. Public outreach and information is the foundation of water management for the City. The public is informed about ordinances that are in effect and are guided to resources that can help to manage water waste on an individual level. Provost & Pritchard Consulting Group June
73 Section Eight: Water Shortage Contingency Planning 2015 Urban Water Management Plan 8 Water Shortage Contingency Planning The City of Dinuba Municipal Code addresses water conservation and waste. Voluntary and mandatory conservation efforts are addressed as well as implementation and enforceable restrictions. A separate policy (No 89-3 and Ordinance 723) describes how contingency stages will be decided, enacted, and terminated. Agency actions to encourage, enforce, and monitor water waste and consumption were implemented with the resolution that amended the 2010 UWMP to include specific demand management measures (See Appendix E). 8.1 Stages of Action Legal Requirements: CWC (a) (1) Stages of action to be undertaken by the urban water supplier in response to water supply shortages, including up to a 50 percent reduction in water supply, and an outline of specific water supply conditions which are applicable to each stage. Water conservation measures are implemented based on groundwater elevation changes, annual precipitation, and general hydrologic conditions. There are no hard triggers that enact any one stage. Such triggers are more appropriate to an agency that has available surface water supply or groundwater pumping restrictions. Rather, stages are enacted by the City Council based on subjective analysis that considers overall hydrologic conditions. Reductions can also go into effect in the event of groundwater contamination, mechanical failure, or at the orders of the Governor. The contingency plan, as written by the City, has stages 1-3; however, a stage 0 was added for the purposes of illustrating conservation measures that are enforced at all times. Stage 1 is voluntary conservation which encourages conservation year round beyond the mandatory measures of stage 0, but the City begins actively promoting Stage 1 conservation when water supplies are assumed to be decreased by 10%. Conservation efforts are not mandatory during this stage or enforceable. Stage 2 takes effect when water supply is assumed to be at 25% of normal based on overall hydrological conditions. Stage 3 becomes active at a 50% water supply. The City is considering updating their Water Shortage Contingency Plan (WSCP). This plan will be updated accordingly should the WSCP be modified. Provost & Pritchard Consulting Group June
74 Table 8-1: Stages of Water Shortage Contingency Plan Stage Section Eight: Water Shortage Contingency Planning 2015 Urban Water Management Plan Percent Supply Reduction Complete One or Both Water Reduction Conditions 0 0% Mandatory, Always in affect 1 10% Voluntary 2 25% Mandatory, Temporary 3 50% Mandatory, Temporary 8.2 Prohibitions on End Users and Penalties Legal Requirement CWC (a) (4) Additional, mandatory prohibitions against specific water use practices during water shortages, including, but not limited to, prohibiting the use of potable water for street cleaning. (5) Consumption reduction methods in the most restrictive stages. Each urban water supplier may use any type of consumption reduction methods in its water shortage contingency analysis that would reduce water use, are appropriate for its area, and have the ability to achieve a water use reduction consistent with up to a 50 percent reduction in water supply. CWC (a) (6) Penalties or charges for excessive use, where applicable. Water shortage restrictions at various stages of drought are outlined below in Table 8-2. Penalties and the complete conservation ordinance and policies can be viewed in Appendix E. Non-compliance is an infraction of the Dinuba Municipal Code and is subject to fines and other corrective actions. Each day that the customer is out of compliance can be considered a separate infraction. Provost & Pritchard Consulting Group June
75 Section Eight: Water Shortage Contingency Planning 2015 Urban Water Management Plan Table 8-2: Water Shortage Contingency Restrictions and Prohibitions on End Users Stage Restrictions and Prohibitions to End Users Additional Explanation or Reference Landscape - Restrict or prohibit runoff 0 from landscape irrigation Any excessive runoff Yes Other - Customers must repair leaks, 0 breaks, and malfunctions in a timely manner 48 hours Yes 0 Other - Require automatic shut of hoses Yes 0 Landscape - Limit landscape irrigation to specific times 1 Other Landscape - Limit landscape irrigation to specific times No watering between 11:00AM and 6:00PM May 1st to September 30th Voluntary - all nonmandatory are encouraged 7:00PM to 10AM only. Also includes filling of pools, and washing of cars Yes Landscape - Prohibit certain types of Shut off nozzle, bucket, or landscape irrigation drip irrigation only Yes Other - Prohibit use of potable water for washing hard surfaces Yes Water Features - Restrict water use for decorative water features, such as Features must have pump to fountains recycle water Yes CII - Restaurants may only serve water upon request Yes Other - Prohibit vehicle washing except at facilities using recycled or recirculation water Yes Other water feature or swimming pool restriction Filling prohibited Yes Landscape - Limit landscape irrigation to specific days Yes Landscape - Limit landscape irrigation to specific times 8:00 PM to 12:00 AM Yes 8.3 Consumption Reduction Methods by Agencies Legal Requirements: Penalty, Charge or Other Enforcement? Y/N CWC (a) (5) Consumption reduction methods in the most restrictive stages. Each urban water supplier may use any type of consumption reduction methods in its water shortage contingency analysis that would reduce water use, are appropriate for its area, and have the ability to achieve a water use reduction consistent with up to a 50 percent reduction in water supply. Yes No Provost & Pritchard Consulting Group June
76 Section Eight: Water Shortage Contingency Planning 2015 Urban Water Management Plan Following the submittal and comments on the Final Dinuba 2010 UWMP, the City amended the document with Resolution , which detailed demand management measures (DMM) that the City would put into action. This resolution was passed in September 2014 and is in various stages of completion. Successful implementation of account monitoring, ordinances, and enforcement mechanisms allow the City to pinpoint waste, establish cause, and if necessary, enforce policy to remediate situations. These policies also allow the City to council customers one on one and direct them to efficiency solutions and assistance programs to help with compliance. Public information and outreach is a large part of the City s outreach program. It is further explained in Chapter 9 of this document. The City is working on educational brochures to bring awareness to school age children. The City, although lacking funding of their own, directs customers to state rebates through social media and public websites. The City has yet to start a leak detection program that is more rigorous than what they have done in the past, but will undertake this task when funds are allocated, which should begin after a revised rate schedule is proposed and adopted by the Dinuba City Council in Table 8-3: Water Shortage Contingency - Consumption Reduction Methods Stage Consumption Reduction Methods by Water Supplier Additional Explanation or Reference 1 Provide Rebates on Plumbing Fixtures and Devices 1 Provide Rebates for Turf Replacement 2 Expand Public Information Campaign 2 Improve Customer Billing 3 Decrease Line Flushing 3 Offer Water Use Surveys Provides information to link consumers with rebate programs Provides information to link consumers with rebate programs The City uses online media, mailers, and fliers to address the public Insert mailers into bills on conservation methods and enforcement measures Duration of line flushing decreased One on one counseling for interested customers or excessive use 3 Increase Water Waste Patrols Provost & Pritchard Consulting Group June
77 8.4 Determining Reductions Legal Requirements: Section Eight: Water Shortage Contingency Planning 2015 Urban Water Management Plan CWC 10632(a) (9) A mechanism for determining actual reductions in water use pursuant to the urban water shortage contingency analysis. The City s delivery and supply system has been metered since All new construction is required to be metered. Usage is easily compared from month to month or annually. Dinuba s Public Works Department maintains records that separate water use types, as well makes it easy to track residential water usage versus industrial or commercial water usage. At this time, it is infeasible for the City to analyze water use for each consumption reduction measure. Water savings trends can be observed, but actual savings for each restriction or reduction method cannot be calculated at this time. 8.5 Revenue and Expenditure Impacts/Measures to Overcome Impacts Legal Requirements: CWC (a) (7) An analysis of the impacts of each of the actions and conditions described in paragraphs (1) to (6), inclusive, on the revenues and expenditures of the urban water supplier, and proposed measures to overcome those impacts, such as the development of reserves and rate adjustments. The City has a tiered billing system. There is a flat rate for the first 1,200 cubic feet, after which the City charges per 100 cubic feet. The recent drought has caused a decrease in revenue due to water restrictions. Amendments to the 2010 Dinuba UWMP called for a water rate structure review with the purpose of altering rates to promote conservation while ensuring steady cash flow to fund operations. This review is currently underway via comprehensive rate study and will be presented to the City Council in Resolution or Ordinance The water shortage contingency plan is embodied in Ordinance 723. This ordinance includes the municipal code Water Conservation Ordinance of the City of Dinuba (formerly 13.04) and amendment 89-3 which defines conservation stages and mechanisms for implementing and terminating restrictions. See Appendix E for copies of ordinances and contingency plan. City Ordinance 723 defines water waste and expressly prohibits such waste at all times. This includes faulty plumbing and excessive run-off among other forms of waste. The Ordinance goes on further to address prohibitions that will come into effect in the event of drought conditions. Enforcement agents and penalties are named and environmental impacts of such waste on drought stricken areas are described. The City Manager is responsible for implementation and termination of drought restrictions. Provost & Pritchard Consulting Group June
78 8.7 Catastrophic Supply Interruption Section Eight: Water Shortage Contingency Planning 2015 Urban Water Management Plan Legal Requirements: CWC 10632(a)(3) Actions to be undertaken by the urban water supplier to prepare for, and implement during, a catastrophic interruption of water supplies including, but not limited to, a regional power outage, an earthquake, or other disaster. The City relies on its Emergency Operations Plan to standardize response to emergencies involving multiple jurisdictions or agencies. The Plan uses the Standardized Emergency Management System common to most Incident Action Plans. The City is also part of several mutual aid agreements, which provide a mechanism for the City to receive goods or services from other entities (communities or non-profit organizations) in times of disaster. Dinuba is located in Mutual Aid Region V. The Emergency Operations Plan covers natural, technological, and domestic hazards, which include scenarios from earthquakes to terrorism. Continuity of government and specific duties are outlined in the Plan as well as methods to encourage and promote disaster awareness. In addition to the Emergency Operations Plan, the Public Works Department, who oversees the Dinuba Water District, has checks in place to maintain water supply for a period of time in the event of an emergency. There is a maximum emergency supply of 3 million gallons of water stored in elevated and above ground tanks. The wells are also hooked up to generators that can provide up to a day of uninterrupted, supplemental power should the City s grid be shut down. If long term needs cannot be met internally, systems of agreements are set up to receive disaster relief and supplies from neighboring communities and non-profit organizations. 8.8 Minimum Supply Next Three Years Legal Requirements: CWC (a) (2) An estimate of the minimum water supply available during each of the next three water years based on the driest three-year historic sequence for the agency's water supply. Based on NOAA weather data from the Hanford station (21 miles from Dinuba), the driest three year stretch on record was from During this period there was only a total of inches of rain with 1947 being the driest year with only 3.55 inches of rain. The next driest three year period was from with a total of inches was the driest recorded year with only 3.05 inches of rain. During the most recent three year drought water needs were met using groundwater. Groundwater would be able to meet water demands should another three year drought occur beginning Provost & Pritchard Consulting Group June
79 Section Eight: Water Shortage Contingency Planning 2015 Urban Water Management Plan Table 8-4: Water Shortage Contingency Minimum Supply Next Three Years Available Water Supply (MG) 1,625 1,674 1,724 Provost & Pritchard Consulting Group June
80 Section Nine: Demand Management Measures (DMM) 2015 Urban Water Management Plan 9 Demand Management Measures (DMM) Legal Requirements: CWC (f) (A) A narrative shall describe the water demand management measure that the supplier plans to implement to achieve its water use targets pursuant to Section (B)The narrative pursuant to this paragraph shall include descriptions of the following water demand management measures: (i) Water waste prevention ordinances. (ii) Metering. (iii) Conservation pricing. (iv) Public education and outreach. (v) Programs to assess and manage distribution system real loss. (vi) Water conservation program coordination and staffing support. (vii) Other demand management measures that have a significant impact on water use as measured in gallons per capita per day, including innovative measures, if implemented. CWC (f) Provide a description of the supplier's water demand management measures. This description shall include all of the following: (1) (A) a narrative description that addresses the nature and extent of each water demand management measure implemented over the past five years. 9.1 DMMs Water Waste Prevention Ordinances The City of Dinuba Municipal Code 14 has several water waste prevention ordinances, policies and other water regulations that prevent waste and damage. Chapter 13 of the Dinuba Municipal Code is dedicated to ordinances regarding water conservation and regulation. They also provide vehicles for funding future water storage projects with regard to development and ordinances defining enforcement and penalties for non compliance. The City s Municipal Code Chapter 13 Water Regulations prohibits the damage of any Public Water System (PWS) feature or water system. It prohibits the construction of wells within the City limits and describes policy regarding water service. The Water Conservation ordinance is the policy that embodies the WSCP described in Chapter 8 of this document. More detail can be found in Sections See Appendix E for portions of the Dinuba Municipal Code cited below, passed September 22, Provost & Pritchard Consulting Group June
81 Enforcement Violation-Infraction Enforcement Water Regulation All Water Conservation All Planned Extra-Capacity Water Facilities All Metering Section Nine: Demand Management Measures (DMM) 2015 Urban Water Management Plan The City has been fully metered since All new construction is required to be metered. There are currently no plans to update any of the metering systems. However, the oldest meters are replaced as frequently as possible as are those that have quit working or show major malfunctions. The meters are nearly 25% remotely recorded and the remainder are manually recorded. Meters are not calibrated or tested for accuracy unless an obvious inconsistency is found that cannot be linked to real loss. The wells are metered and linked to a SCADA system. However, there are inconsistencies between the manual meter readings (done weekly at a minimum) and the SCADA readings; therefore, manual readings are used for recording purposes. Should the funding become available, the City would update the SCADA system to provide more accurate results Conservation Pricing The City of Dinuba is currently undergoing review for pricing mechanisms. Conservation efforts for the past few years have upset the flow of revenue to the Public Works Department. This has impeded the ability of the City to implement some of the more costly consumption reduction methods and systems. The new rate structure will be proposed in summer of 2016, likely implemented shortly thereafter, and is expected to include a conservation pricing structure Public Education and Outreach The City of Dinuba provides public education and outreach in several forms of media. They have several online sources. The City website, contains information about the latest water restrictions, water supply levels, links to the California State Water Board and other water agencies, water rate information, municipal ordinances, and reports about the City s water consumption and finances. They also have a Facebook page and Twitter The Facebook page has links to the website and phone numbers for rebates through the State and guidance for conservation. The Twitter account is fairly new and will likely be utilized in the same manner as the Facebook page. The City posts flyers regarding water conservation efforts, conservation stages, watering schedules, etc. In addition to online sources, the City also includes useful information in utility bills and mailers. See Appendix B for outreach examples. Provost & Pritchard Consulting Group June
82 Section Nine: Demand Management Measures (DMM) 2015 Urban Water Management Plan Programs to Assess and Manage Distribution System Real Loss The City s water system has been added to and improved since the system was constructed prior to As the City has grown, additional service line, meters, and valves, have been added. With each iteration, newer and more sophisticated technology is implemented to reduce the amount of real loss, allowing the Public Works Department to recognize and respond to system malfunctions promptly. The City has 100% of service lines metered to account for all water delivered to customers. Of these meters approximately 25% are automatic reading meters rather than manual meters. Meters are typically located at curb-in-meter-boxes to reduce customer responsibility of water lines on private property, and allow quick and easy access to meters and valves owned by the City. Meters are replaced in the event of failure or severe malfunction; however, no comprehensive plan to replace older and outdated meters is feasible at this time. Individual meters are not connected to a SCADA system so meters must be read monthly. Supply wells are metered as well. These well meters are connected to a SCADA system, but are also read manually each week to prevent inaccurate recording of supply data. The City hopes to upgrade the SCADA system to provide more reliable readings. None of the meters on supply or consumption side are corrected for potential errors in measurement and no meter testing procedures exist at this time. In addition to meter maintenance and replacement, the City implements an extensive valve maintenance and inspection program. The City Public Works Department dedicates 500 hours per year to inspecting, repairing, and mapping valves. The locations and conditions are recorded on a map and priority and condition are assessed. Hydrants are maintained by the Fire Department annually for flow. The City is currently looking into leak detection and considering methods and costs. The recent drought and decrease in revenue from water conservation efforts has put financial hardship on the City public works programs causing many preventative plans to be put on hold. Water main replacement and rehabilitation is on an as-needed basis. The City intends to inventory and prioritize water main replacement, but currently, replacement is only done when obvious need is demonstrated. This is, once again, due to budget constraints. Additional water main replacement and rehabilitation could help to reduce leakage losses. However, the City has a large proportion of community members that are underemployed and low income for which rate increases and additional fees and taxes are a hardship. It should be noted that when street rehabilitation occurs, the City replaces all water mains, valves, and hydrants and is able to map locations in GIS for more permanent and accurate records. System water losses were calculated using AWWA Free Water Audit Software. The software uses inputs from volume of water supplied, volume of water delivered, metering error percentage, and metering confidence levels to calculate apparent, unauthorized, and real losses. Authorized, unmetered consumption is assumed to be 19.7 MG/year. This value is then broken into apparent loss, caused by metering errors, data handling inaccuracies, and unauthorized, unmetered water consumption; and real loss, caused by leakage from pipes, valves, or other Provost & Pritchard Consulting Group June
83 Section Nine: Demand Management Measures (DMM) 2015 Urban Water Management Plan supply line components.. The complete AWWA software spreadsheets can be viewed in Appendix D Water Conservation Program Coordination and Staffing Support There is no designated water conservation coordinator. Tasks are generally divided between the Public Works Director, City Engineer, and the Public Works Utility Supervisor. The Public Works Department would like to hire a full time water conservation coordinator, but funds are not available at this time Other Demand Management Measures Although the City does not possess funds to offer rebates and incentives for water conservation implementation, they direct customers to State funded rebate programs. The City uses social media, flyers, mailers, and other public outreach measures to promote low flow toilet and turf replacement for customers. They have a rigorous account monitoring system to detect unusual consumption and target potential leaks. The City counsels customers in efficient water use and performs individual water audits for those interested. 9.2 Planned Implementation to Achieve Water Use Targets Legal Requirements CWC (f) Provide a description of the supplier's water demand management measures. This description shall include all of the following: (1) (A) The narrative shall describe the water demand management measures that the supplier plans to implement to achieve its water use targets pursuant to Section The City has taken major steps toward achieving their 2020 goal. The City has been 100% metered for decades. They monitor customer usage monthly for excessive use or potential waste. The City tracks losses closely to determine customer needs and compliance. Should a customer show excessive water use, the City will take measures to assist them in becoming compliant. Complete water audits are available for customers that require assistance with water saving appliances and techniques. The City will continue to work toward instituting a city wide program to detect and repair leaks. In conjunction with Alta Irrigation District (AID), the City will continue to seek funding to plan, design, and construct recharge basins and a wastewater reclamation facility that treats water to tertiary standards. The City will continue to seek funding to replace and rehabilitate water mains and meters and explore and construct new water sources. The City will expand its public outreach to include educational materials for schools on water conservation and information to the public on conservation methods and incentives. As funding becomes available the City will enact and fund a program to provide $100 rebates for the replacement of toilets with ultra-low flush toilets. They will continue to promote rebate Provost & Pritchard Consulting Group June
84 Section Nine: Demand Management Measures (DMM) 2015 Urban Water Management Plan programs to encourage customers to purchase high efficiency washing machines and drought tolerant landscaping. The City s rate structure study will set in place a system to equalize annual costs and provide funds to operate and maintain the distribution system. The recent drought has caused severe financial hardship to the City Public Works Department. The need for system management remains constant despite decreased revenue. Altering the rate structure will allow a consistent income despite seasonal usage, and could help fund additional conservation programs. 9.3 California Urban Water Conservation Council Legal Requirement CWC (i) For purposes of this part, urban water suppliers that are members of the California Urban Water Conservation Council shall be deemed in compliance with the requirements of subdivision (f) by complying with all the provisions of the "Memorandum of Understanding Regarding Urban Water Conservation in California," dated December 10, 2008, as it may be amended, and by submitting the annual reports required by Section 6.2 of that memorandum. The City of Dinuba is not a member of the California Urban Water Conservation Council. Provost & Pritchard Consulting Group June
85 Section Eleven: Bibliography/References 2015 Urban Water Management Plan 10 Completed UWMP Checklist It should be noted that tables within the body of the document may be different than those required by DWR and provided in Appendix D. CWC Section UWMP Requirement Subject Guidebook Location (b) Retail suppliers shall adopt a 2020 Baselines and Section 5.7 water use target using one of four Targets and App E (e) methods. Retail suppliers shall provide baseline daily per capita water use, urban water use target, interim urban water use target, and compliance daily per capita water use, along with the bases for determining those estimates, including references to supporting data Retail suppliers per capita daily water use reduction shall be no less than 5 percent of base daily per capita water use of the 5 year baseline. This does not apply if the suppliers base GPCD is at or below (a) (d)(2) (a) Retail suppliers shall meet their interim target by December 31, If the retail supplier adjusts its compliance GPCD using weather normalization, economic adjustment, or extraordinary events, it shall provide the basis for, and data supporting the adjustment. Retail suppliers shall conduct a public hearing to discuss adoption, implementation, and economic impact of water use targets. Baselines and Targets Baselines and Targets Baselines and Targets Baselines and Targets Plan Adoption, Submittal, and Implementation Chapter 5 and App E Section Section 5.8 and App E Section Section 10.3 UWMP Location Section Page 25 Chapter 5 Page 21 Section Page 25 Section Page 26 Section Page 28 Section Page 7 Provost & Pritchard Consulting Group June
86 Section Eleven: Bibliography/References 2015 Urban Water Management Plan CWC Section UWMP Requirement Subject Guidebook Location Wholesale suppliers shall include an assessment of present and proposed future measures, programs, and policies to help their retail water suppliers achieve targeted water use reductions Retail suppliers shall report on their progress in meeting their water use targets. The data shall be reported using a standardized form (b) 10620(d)(2) 10620(f) 10621(b) 10621(d) Every person that becomes an urban water supplier shall adopt an urban water management plan within one year after it has become an urban water supplier. Coordinate the preparation of its plan with other appropriate agencies in the area, including other water suppliers that share a common source, water management agencies, and relevant public agencies, to the extent practicable. Describe water management tools and options to maximize resources and minimize the need to import water from other regions. Notify, at least 60 days prior to the public hearing, any city or county within which the supplier provides water that the urban water supplier will be reviewing the plan and considering amendments or changes to the plan. Each urban water supplier shall update and submit its 2015 plan to the department by July 1, Baselines and Targets Baselines and Targets Section 5.1 Section 5.8 and App E UWMP Location N/A Section 5.7 Page 26 Plan Preparation Section 2.1 Section Page 2 Plan Preparation Section Section 2.2 Page 6 Water Supply Reliability Assessment Plan Adoption, Submittal, and Implementation Plan Adoption, Submittal, and Implementation Section 7.4 Section 7.4 Page 49 Section Sections and 10.4 Section Page 7 Section Page 8 Provost & Pritchard Consulting Group June
87 Section Eleven: Bibliography/References 2015 Urban Water Management Plan CWC Section UWMP Requirement Subject Guidebook Location 10631(a) 10631(a) 10631(a) 10631(a) 10631(a) 10631(b) 10631(b) 10631(b)(1) Describe the water supplier service area. Describe the climate of the service area of the supplier. Indicate the current population of the service area. Provide population projections for 2020, 2025, 2030, and Describe other demographic factors affecting the supplier s water management planning. Identify and quantify the existing and planned sources of water available for 2015, 2020, 2025, 2030, and Indicate whether groundwater is an existing or planned source of water available to the supplier. Indicate whether a groundwater management plan has been adopted by the water supplier or if there is any other specific authorization for groundwater management. Include a copy of the plan or authorization. System Description System Description System Description and Baselines and Targets System Description System Description UWMP Location Section 3.1 Section 3.1 Page 10 Section 3.3 Sections 3.4 and 5.4 Section Page 13 Section 3.2 Page 14 Section 3.4 Section 3.2 Page 14 Section 3.4 Section 3.3 Page 15 System Supplies Chapter 6 Section 6.11 Page 44 System Supplies Section 6.2 Section 6.3 Page 31 System Supplies Section Section Page (b)(2) Describe the groundwater basin. System Supplies Section Section Page (b)(2) Indicate if the basin has been adjudicated and include a copy of the court order or decree and a description of the amount of water the supplier has the legal right to pump. System Supplies Section Section 6.3 Page 31 Provost & Pritchard Consulting Group June
88 Section Eleven: Bibliography/References 2015 Urban Water Management Plan CWC Section UWMP Requirement Subject Guidebook Location 10631(b)(2) 10631(b)(3) 10631(b)(4) 10631(c)(1) 10631(c)(1) 10631(c)(2) 10631(d) 10631(e)(1) 10631(e)(3)(A) For unadjudicated basins, indicate whether or not the department has identified the basin as overdrafted, or projected to become overdrafted. Describe efforts by the supplier to eliminate the long-term overdraft condition. Provide a detailed description and analysis of the location, amount, and sufficiency of groundwater pumped by the urban water supplier for the past five years Provide a detailed description and analysis of the amount and location of groundwater that is projected to be pumped. Describe the reliability of the water supply and vulnerability to seasonal or climatic shortage. Provide data for an average water year, a single dry water year, and multiple dry water years For any water source that may not be available at a consistent level of use, describe plans to supplement or replace that source. Describe the opportunities for exchanges or transfers of water on a short-term or long-term basis. Quantify past, current, and projected water use, identifying the uses among water use sectors. Report the distribution system water loss for the most recent 12- month period available. UWMP Location System Supplies Section Section 6.3 Page 31 System Supplies Section Section Page 34 System Supplies Sections 6.2 and 6.9 Water Supply Reliability Assessment Water Supply Reliability Assessment Water Supply Reliability Assessment Section 6.10 Section 6.11 Page 43 Section 7.1 Chapter 7 Page 46 Section 7.2 Section 7.3 Page 47 Section 7.1 Section 7.2 Page 48 System Supplies Section 6.7 Section 6.9 Page 42 System Water Use Section 4.2 System Water Use Section 4.3 Section Page 16 Section Page 18 Provost & Pritchard Consulting Group June
89 Section Eleven: Bibliography/References 2015 Urban Water Management Plan CWC Section UWMP Requirement Subject Guidebook Location 10631(f)(1) 10631(f)(2) 10631(g) 10631(h) 10631(i) 10631(j) Retail suppliers shall provide a description of the nature and extent of each demand management measure implemented over the past five years. The description will address specific measures listed in code. Wholesale suppliers shall describe specific demand management measures listed in code, their distribution system asset management program, and supplier assistance program. Describe the expected future water supply projects and programs that may be undertaken by the water supplier to address water supply reliability in average, single-dry, and multiple-dry years. Describe desalinated water project opportunities for longterm supply. CUWCC members may submit their CUWCC BMP annual reports in lieu of, or in addition to, describing the DMM implementation in their UWMPs. This option is only allowable if the supplier has been found to be in full compliance with the CUWCC MOU. Retail suppliers will include documentation that they have provided their wholesale supplier(s) if any - with water use projections from that source. Demand Management Measures Demand Management Measures Sections 9.2 and 9.3 Sections 9.1 and 9.3 UWMP Location Section 8.3 Page 54 N/A System Supplies Section 6.8 Section 6.10 Page 45 System Supplies Section 6.6 Section 6.8 Page 44 Demand Management Measures Section 9.5 Section 9.3 Page 62 System Supplies Section N/A Provost & Pritchard Consulting Group June
90 Section Eleven: Bibliography/References 2015 Urban Water Management Plan CWC Section UWMP Requirement Subject Guidebook Location 10631(j) (a) 10632(a) and 10632(a)(1) 10632(a)(2) 10632(a)(3) 10632(a)(4) 10632(a)(5) 10632(a)(6) Wholesale suppliers will include documentation that they have provided their urban water suppliers with identification and quantification of the existing and planned sources of water available from the wholesale to the urban supplier during various water year types. Include projected water use needed for lower income housing projected in the service area of the supplier. Provide an urban water shortage contingency analysis that specifies stages of action and an outline of specific water supply conditions at each stage. Provide an estimate of the minimum water supply available during each of the next three water years based on the driest three-year historic sequence for the agency. Identify actions to be undertaken by the urban water supplier in case of a catastrophic interruption of water supplies. Identify mandatory prohibitions against specific water use practices during water shortages. Specify consumption reduction methods in the most restrictive stages. Indicated penalties or charges for excessive use, where applicable. System Supplies Section N/A System Water Use Section 4.5 Water Shortage Contingency Planning Water Shortage Contingency Planning Water Shortage Contingency Planning Water Shortage Contingency Planning Water Shortage Contingency Planning Water Shortage Contingency Planning UWMP Location Section Page 19 Section 8.1 Chapter 8 Page 52 Section 8.9 Section 8.8 Page 57 Section 8.8 Section 8.7 Page 56 Section 8.2 Section 8.2 Page 53 Section 8.4 Section 8.3 Page 54 Section 8.3 Section 8.6 Page 56 Provost & Pritchard Consulting Group June
91 Section Eleven: Bibliography/References 2015 Urban Water Management Plan CWC Section UWMP Requirement Subject Guidebook Location 10632(a)(7) 10632(a)(8) 10632(a)(9) Provide an analysis of the impacts of each of the actions and conditions in the water shortage contingency analysis on the revenues and expenditures of the urban water supplier, and proposed measures to overcome those impacts. Provide a draft water shortage contingency resolution or ordinance. Indicate a mechanism for determining actual reductions in water use pursuant to the water shortage contingency analysis For wastewater and recycled water, coordinate with local water, wastewater, groundwater, and planning agencies that operate within the supplier's service area (a) 10633(b) 10633(c) Describe the wastewater collection and treatment systems in the supplier's service area. Include quantification of the amount of wastewater collected and treated and the methods of wastewater disposal. Describe the quantity of treated wastewater that meets recycled water standards, is being discharged, and is otherwise available for use in a recycled water project. Describe the recycled water currently being used in the supplier's service area. Water Shortage Contingency Planning Water Shortage Contingency Planning Water Shortage Contingency Planning System Supplies (Recycled Water) System Supplies (Recycled Water) System Supplies (Recycled Water) System Supplies (Recycled Water) UWMP Location Section 8.6 Section 8.5 Page 56 Section 8.7 Appendix E Section 8.5 Section 8.4 Page 55 Section Section Section Section and Section Page 37 Section Page 38 Section Page 41 Section Page 41 Provost & Pritchard Consulting Group June
92 Section Eleven: Bibliography/References 2015 Urban Water Management Plan CWC Section UWMP Requirement Subject Guidebook Location 10633(d) 10633(e) 10633(f) 10633(g) Describe and quantify the potential uses of recycled water and provide a determination of the technical and economic feasibility of those uses. Describe the projected use of recycled water within the supplier's service area at the end of 5, 10, 15, and 20 years, and a description of the actual use of recycled water in comparison to uses previously projected. Describe the actions which may be taken to encourage the use of recycled water and the projected results of these actions in terms of acre-feet of recycled water used per year. Provide a plan for optimizing the use of recycled water in the supplier's service area Provide information on the quality of existing sources of water available to the supplier and the manner in which water quality affects water management strategies and supply reliability 10635(a) Assess the water supply reliability during normal, dry, and multiple dry water years by comparing the total water supply sources available to the water supplier with the total projected water use over the next 20 years. System Supplies (Recycled Water) System Supplies (Recycled Water) System Supplies (Recycled Water) System Supplies (Recycled Water) Water Supply Reliability Assessment Water Supply Reliability Assessment Section Section Section Section UWMP Location Section Page 37 Section Page 41 Section Page 43 Section Page 43 Section 7.1 Section 7.1 Page 48 Section 7.3 Section 7.3 Page 50 Provost & Pritchard Consulting Group June
93 Section Eleven: Bibliography/References 2015 Urban Water Management Plan CWC Section UWMP Requirement Subject Guidebook Location 10635(b) Provide supporting documentation that Water Shortage Contingency Plan has been, or will be, provided to any city or county within which it provides water, no later than 60 days after the submission of the plan to DWR Provide supporting documentation that the water supplier has encouraged active involvement of diverse social, cultural, and economic elements of the population within the service area prior to and during the preparation of the plan Provide supporting documentation that the urban water supplier made the plan available for public inspection, published notice of the public hearing, and held a public hearing about the plan The water supplier is to provide the time and place of the hearing to any city or county within which the supplier provides water Provide supporting documentation that the plan has been adopted as prepared or modified (a) Provide supporting documentation that the urban water supplier has submitted this UWMP to the California State Library. Plan Adoption, Submittal, and Implementation Section UWMP Location Appendix B Plan Preparation Section Appendix B Plan Adoption, Submittal, and Implementation Plan Adoption, Submittal, and Implementation Plan Adoption, Submittal, and Implementation Plan Adoption, Submittal, and Implementation Sections , 10.3, and 10.5 Sections Section Section Appendix B Public Notice Appendix A Appendix A Appendix F Provost & Pritchard Consulting Group June
94 Section Eleven: Bibliography/References 2015 Urban Water Management Plan CWC Section UWMP Requirement Subject Guidebook Location 10644(a)(1) Provide supporting Plan Adoption, Section documentation that the urban Submittal, and water supplier has submitted this Implementation UWMP to any city or county within which the supplier provides water no later than 30 days after adoption (a)(2) The plan, or amendments to the plan, submitted to the department shall be submitted electronically Provide supporting documentation that, not later than 30 days after filing a copy of its plan with the department, the supplier has or will make the plan available for public review during normal business hours. Plan Adoption, Submittal, and Implementation Plan Adoption, Submittal, and Implementation Sections and Section 10.5 UWMP Location Appendix F Appendix F Appendix F Provost & Pritchard Consulting Group June
95 11 Bibliography/References Websites and Communications Alta Irrigation District, < City of Dinuba, < Section Eleven: Bibliography/References 2015 Urban Water Management Plan Department of Finance, < Kings Basin Water Authority, < Kings River Conservation District, < Tulare County Local Agency Formation Commission, < U.S. Census Bureau, < Documents Alta Irrigation District, Amended Groundwater Management Plan, 2010; Boyle Engineering Corporation, City of Dinuba Water Master Plan, January California Department of Water Resources, 2015 Urban Water Management Plans - Guidebook for Urban Water Suppliers, 2015; California Department of Water Resources, California s Groundwater Bulletin 118, Update 2003; City of Dinuba City of Dinuba Housing Element, November 2015; City of Dinuba, City of Dinuba, California, Annual Adopted Budget, ; City of Dinuba, City of Dinuba Comprehensive Annual Financial Report, 2010; City of Dinuba, City of Dinuba Comprehensive Annual Financial Report, 2015; City of Dinuba, City of Dinuba Emergency Operations Plan, 2003 Provost & Pritchard Consulting Group June
96 Section Eleven: Bibliography/References 2015 Urban Water Management Plan City of Dinuba, City of Dinuba General Plan Background Report, Kings River Conservation District, Kings River Service Area Annual Groundwater Report, ; Quad Knopf, City of Dinuba Municipal Services Review, 2012; State of California, 20x2020 Water Conservation Plan, February 2010; Provost & Pritchard Consulting Group June
97 City of Dinuba 2015 Urban Water Management Plan Appendix A Adoption Resolution
98 This page is intentionally left blank.
99
100
101
102
103 City of Dinuba 2015 Urban Water Management Plan Appendix B Community Coordination 60 Day Notification & Notice of Public Hearing Letters Public Hearing Notice Community Outreach
104 This page is intentionally left blank.


105 Appendix B


106 Appendix B


107 Appendix B


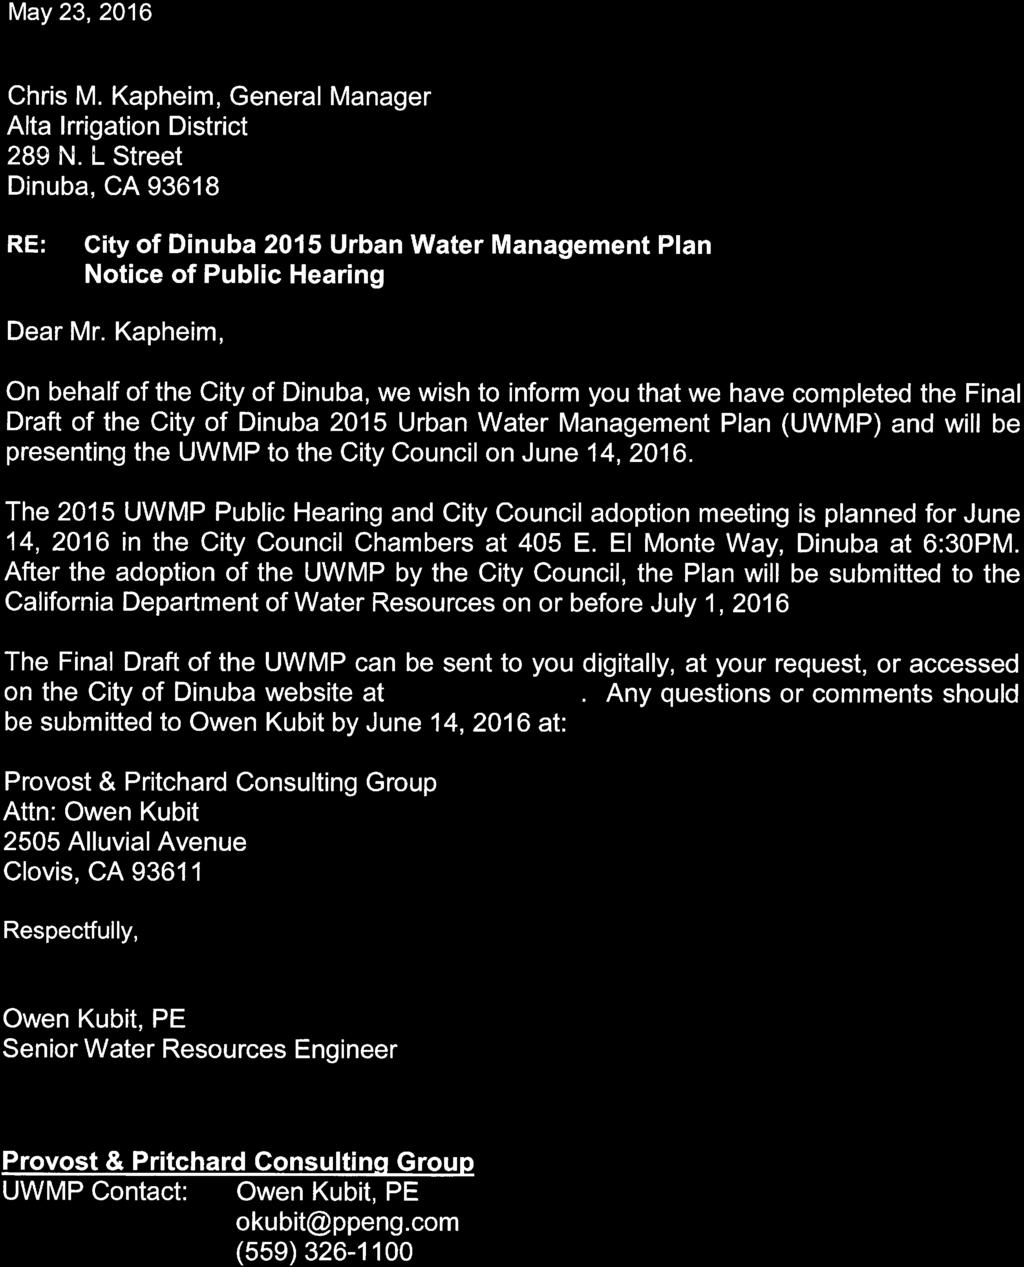

108
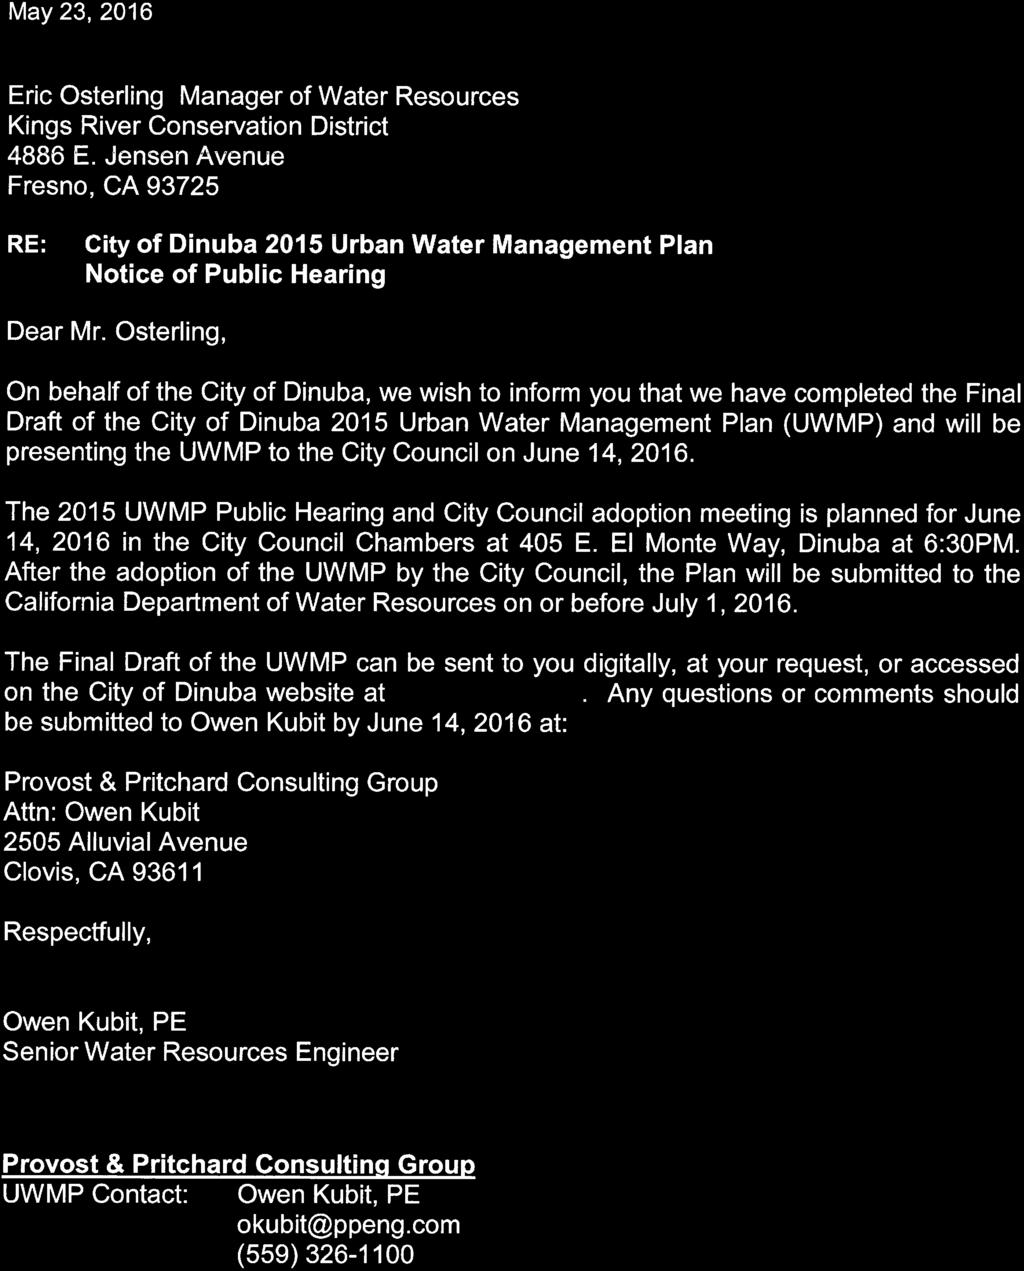

109
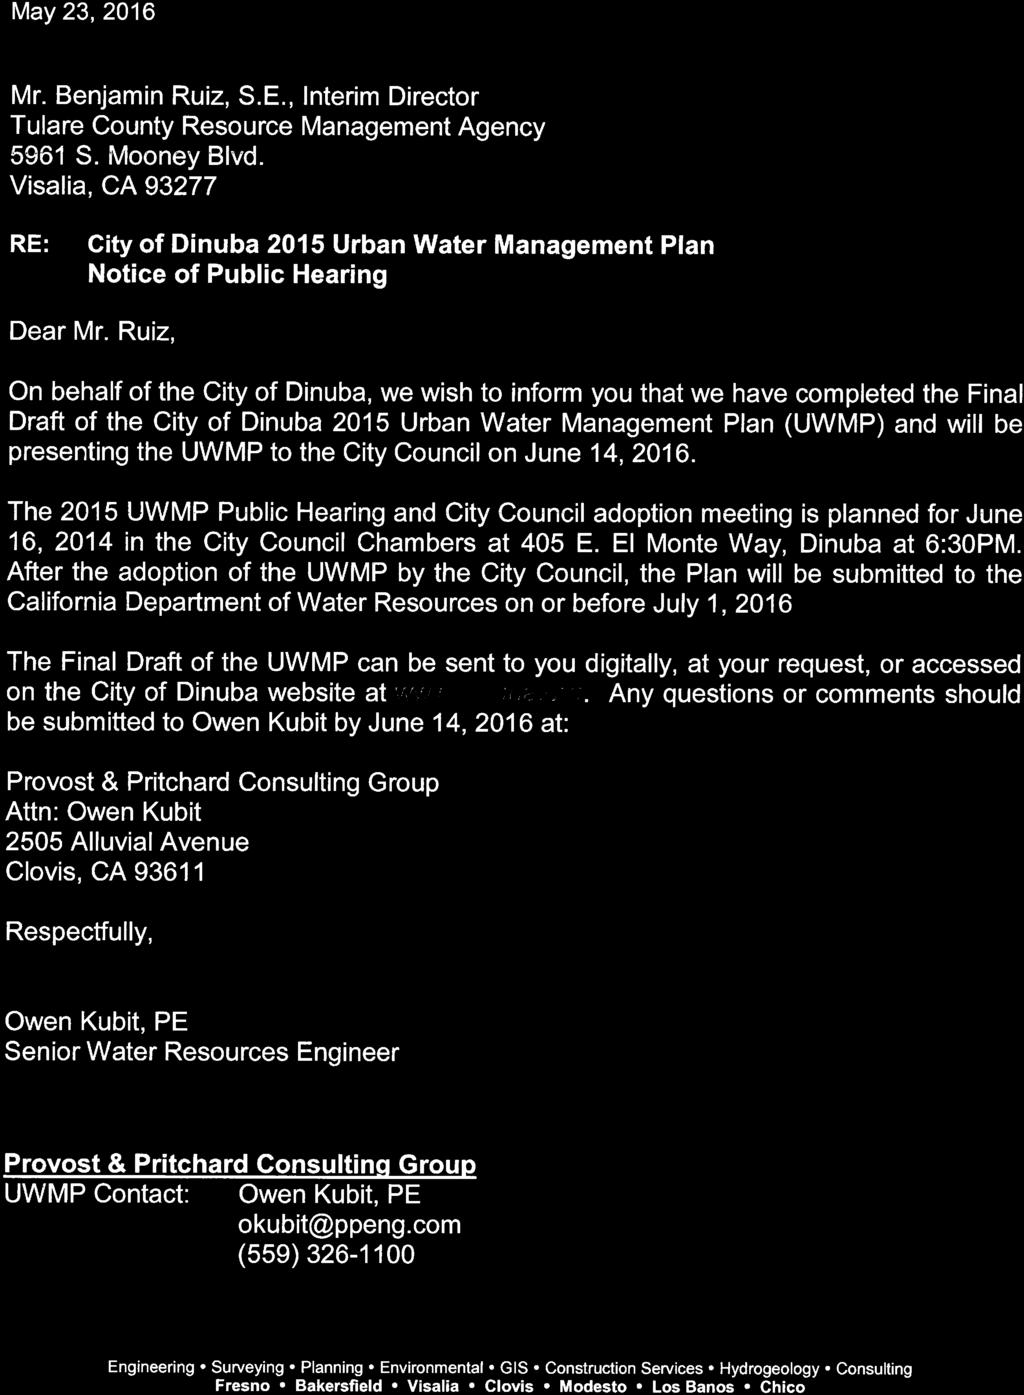

110

111 Appendix B

112 Appendix B
113 Appendix B
114 This page is intentionally left blank.
115 City of Dinuba 2015 Urban Water Management Plan Appendix C Maps Location Map Water Service Area Map Groundwater Basin and Sub-basin Pipe Network
116 This page is intentionally left blank.

, Esri (Thailand), TomTom, 2012 City of Dinuba Location Map 1/22/2016 : G:\Dinuba_City")
117 Appendix C Sanger Sacramento Fowler Parlier Orange Cove ^_ Tulare Co. Reedley City of Dinuba Selma F r e s n o C o. T u l a r e C o.? E?ÎE Dinuba Kingsburg A«H Cutler K i n g s C o. A«H Miles I 286 W. Cromwell Ave. Fresno, CA (559) Legend City of Dinuba County Line Sources: Esri, DeLorme, NAVTEQ, USGS, Intermap, ipc, NRCAN, Esri Japan, METI, Esri China (Hong Kong), Esri (Thailand), TomTom, 2012 City of Dinuba Location Map 1/22/2016 : G:\Dinuba_City of-1525\ general Engineering Svcs\500-Water\501-UWMP\GIS\Map\Vicinity Map.mxd
118


119 Appendix C Road 52 Road 64 Road 68 Road 72 Road 76 Alta Crawford F r e s n o C o. T u l a r e C o. Nebraska El Monte Avenue 412 Kamm Avenue 404 A«H Avenue Miles I 286 W. Cromwell Ave. Fresno, CA (559) Legend Sphere of Influence Boundary City of Dinuba Boundary Water Service Area County Line City of Dinuba Water Service Area Map 3/29/2016 : G:\Dinuba_City of-1525\ general Engineering Svcs\500-Water\501-UWMP\GIS\Map\Site Map.mxd
120


121 Appendix C CHOWCHILLA Madera #S Madera Co. ÄÅ 168 MADERA Firebaugh DELTA- #S MENDOTA ÄÅ 145 #S Clovis Fresno Co. Mendota #S ÄÅ 180 #S Kerman ÄÅ 99 #S Fresno #S Sanger ÄÅ 198 ÄÅ 33 San Joaquin #S KINGS Orange Fowler #S Parlier Cove #S Tulare Co. #S Reedley #S ÄÅ 41 Selma #S Dinuba ÄÅ 245 #S ÄÅ Kingsburg #S ÄÅ 201 WESTSIDE Kings Co. ÄÅ 63 ÄÅ 216 PLEASANT VALLEY Miles #S Hanford Visalia Lemoore #S #S #S Farmersville #S #S Exeter ÄÅ KAWEAH ÄÅ 198 ÄÅ 63 ÄÅ TULARE Tulare ÄÅ 43 #S LAKE #S ÄÅ Huron 137 #S Lindsay I 2505 Alluvial Avenue Clovis, CA (559) #S City City of Dinuba Kings Subbasin Boundary Groundwater Subbasin Boundary San Joaquin Valley Groundwater Basin Tulare Lake Hydrologic Region 3/22/2016 : G:\Dinuba_City of-1525\ general Engineering Svcs\500-Water\501-UWMP\GIS\Map\Dinuba_gwbasin_map.mxd County Line City of Dinuba Groundwater Basin and Subbasin Map
122

123 Appendix C
124
125 City of Dinuba 2015 Urban Water Management Plan Appendix D Tables UWMP Standardized Tables SBX7-7 Tables AWWA Water Loss Tables
126 This page is intentionally left blank.


127 City of Dinuba 2015 Urban Water Management Plan Appendix D UWMP Standardized Tables It should be noted that tables within the body of the document may be different than those required by DWR and provided in Appendix D.


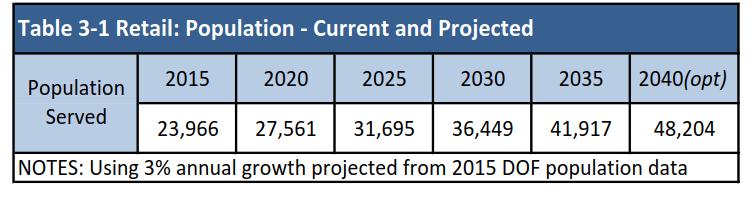
128 City of Dinuba 2015 Urban Water Management Plan Appendix D


129 City of Dinuba 2015 Urban Water Management Plan Appendix D


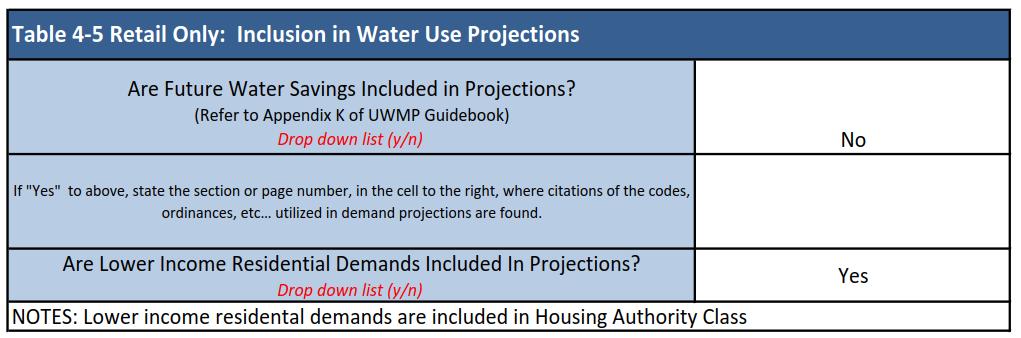
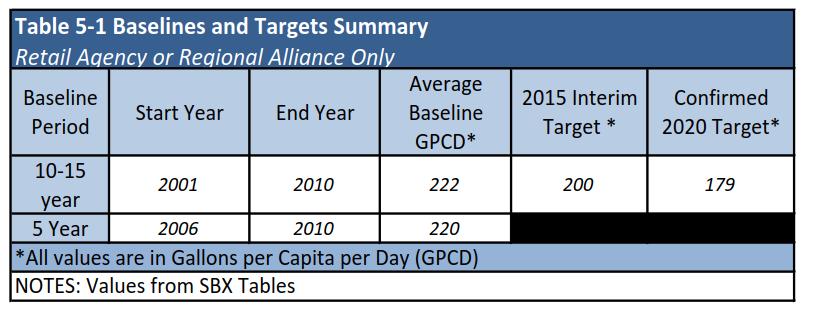
130 City of Dinuba 2015 Urban Water Management Plan Appendix D


131 City of Dinuba 2015 Urban Water Management Plan Appendix D


132 City of Dinuba 2015 Urban Water Management Plan Appendix D


133 City of Dinuba 2015 Urban Water Management Plan Appendix D


134 City of Dinuba 2015 Urban Water Management Plan Appendix D

135 City of Dinuba 2015 Urban Water Management Plan Appendix D

136 Appendix D


137 City of Dinuba 2015 Urban Water Management Plan Appendix D

138 City of Dinuba 2015 Urban Water Management Plan Appendix D

139 City of Dinuba 2015 Urban Water Management Plan Appendix D

140 City of Dinuba 2015 Urban Water Management Plan Appendix D

141 City of Dinuba 2015 Urban Water Management Plan Appendix D


142 City of Dinuba 2015 Urban Water Management Plan Appendix D

143 City of Dinuba 2015 Urban Water Management Plan Appendix D
144 Appendix D SB X7-7 Table 0: Units of Measure Used in UWMP* (select one from the drop down list) Million Gallons *The unit of measure must be consistent with Table 2-3 NOTES:
145 Appendix D SB X7-7 Table-1: Baseline Period Ranges Baseline 10- to 15-year baseline period 5-year baseline period Parameter Value Units 2008 total water deliveries 1,682 Million Gallons 2008 total volume of delivered recycled water - Million Gallons 2008 recycled water as a percent of total deliveries 0.00% Percent Number of years in baseline period 1, 2 10 Years Year beginning baseline period range 2001 Year ending baseline period range Number of years in baseline period 5 Years Year beginning baseline period range 2006 Year ending baseline period range If the 2008 recycled water percent is less than 10 percent, then the first baseline period is a continuous 10-year period. If the amount of recycled water 2 delivered in 2008 is 10 percent or greater, the first baseline period is a continuous 10- to 15-year period. The Water Code requires that the baseline period is between 10 and 15 years. However, DWR recognizes that some water suppliers may not have the minimum 10 years of baseline data. 3 The ending year must be between December 31, 2004 and December 31, The ending year must be between December 31, 2007 and December 31, NOTES:
146 Appendix D SB X7-7 Table 2: Method for Population Estimates Method Used to Determine Population (may check more than one) 1. Department of Finance (DOF) DOF Table E-8 ( ) and ( ) and DOF Table E-5 ( ) when available 2. Persons-per-Connection Method 3. DWR Population Tool NOTES: 4. Other DWR recommends pre-review
147 Appendix D SB X7-7 Table 3: Service Area Population Year Population 10 to 15 Year Baseline Population Year ,067 Year ,427 Year ,249 Year ,515 Year ,989 Year ,179 Year ,562 Year ,610 Year ,914 Year ,453 Year 11 Year 12 Year 13 Year 14 Year 15 5 Year Baseline Population Year ,179 Year ,562 Year ,610 Year ,914 Year , Compliance Year Population ,966 NOTES:
148 Appendix D SB X7-7 Table 4: Annual Gross Water Use * Baseline Year Fm SB X7-7 Table 3 Exported Water Change in Dist. System Storage (+/-) Indirect Recycled Water This column will remain blank until SB X7-7 Table 4-B is completed. Water Delivered for Agricultural Use Process Water This column will remain blank until SB X7-7 Table 4-D is completed. 10 Year Baseline - Gross Water Use Year , ,403 Year , ,497 Year , ,523 Year , ,502 Year , ,450 Year , ,478 Year , ,653 Year , ,682 Year , ,671 Year , , year baseline average gross water use 1,553 5 Year Baseline - Gross Water Use Year , ,478 Year , ,653 Year , ,682 Year , ,671 Year , ,671 5 year baseline average gross water use 1, Compliance Year - Gross Water Use , ,578 * NOTE that the units of measure must remain consistent throughout the UWMP, as reported in Table 2-3 NOTES: Volume Into Distribution System This column will remain blank until SB X7-7 Table 4-A is completed. Deductions Annual Gross Water Use
149 Appendix D SB X7-7 Table 4-A: Volume Entering the Distribution System(s) Complete one table for each source. Name of Source Groundwater This water source is: The supplier's own water source A purchased or imported source Baseline Year Fm SB X7-7 Table 3 Volume Entering Distribution System Meter Error Adjustment* Optional (+/-) Corrected Volume Entering Distribution System 10 to 15 Year Baseline - Water into Distribution System Year ,403 1,403 Year ,497 1,497 Year ,523 1,523 Year ,502 1,502 Year ,450 1,450 Year ,478 1,478 Year ,653 1,653 Year ,682 1,682 Year ,671 1,671 Year ,671 1,671 Year Year Year Year Year Year Baseline - Water into Distribution System Year ,478 1,478 Year ,653 1,653 Year ,682 1,682 Year ,671 1,671 Year ,671 1, Compliance Year - Water into Distribution System ,578 1,578 NOTES: * Meter Error Adjustment - See guidance in Methodology 1, Step 3 of Methodologies Document
150 Appendix D SB X7-7 Table 5: Gallons Per Capita Per Day (GPCD) Baseline Year Fm SB X7-7 Table 3 10 to 15 Year Baseline GPCD Service Area Population Fm SB X7-7 Table 3 Annual Gross Water Use Fm SB X7-7 Table 4 Daily Per Capita Water Use (GPCD) Year ,067 1, Year ,427 1, Year ,249 1, Year ,515 1, Year ,989 1, Year ,179 1, Year ,562 1, Year ,610 1, Year ,914 1, Year ,453 1, Year Year Year Year Year Year Average Baseline GPCD 5 Year Baseline GPCD Baseline Year Fm SB X7-7 Table 3 Service Area Population Fm SB X7-7 Table 3 Gross Water Use Fm SB X7-7 Table Daily Per Capita Water Use Year ,179 1, Year ,562 1, Year ,610 1, Year ,914 1, Year ,453 1, Year Average Baseline GPCD 2015 Compliance Year GPCD NOTES: ,966 1,
151 Appendix D SB X7-7 Table 6: Gallons per Capita per Day Summary From Table SB X7-7 Table Year Baseline GPCD 5 Year Baseline GPCD Compliance Year GPCD 180 NOTES:
152 Appendix D SB X7-7 Table 7: 2020 Target Method Select Only One Target Method NOTES: Method 1 Method 2 Supporting Documentation SB X7-7 Table 7A SB X7-7 Tables 7B, 7C, and 7D Contact DWR for these tables Method 3 SB X7-7 Table 7-E Method 4 Method 4 Calculator
153 Appendix D SB X7-7 Table 7-E: Target Method 3 Agency May Select More Than One as Applicable Percentage of Service Area in This Hydrological Region Hydrologic Region "2020 Plan" Regional Targets Method 3 Regional Targets (95%) North Coast North Lahontan Sacramento River San Francisco Bay San Joaquin River Central Coast % Tulare Lake South Lahontan South Coast Colorado River NOTES: Target (If more than one region is selected, this value is calculated.) 179
154 Appendix D SB X7-7 Table 7-F: Confirm Minimum Reduction for 2020 Target 5 Year Baseline GPCD From SB X7-7 Table 5 Maximum 2020 Target 1 Calculated Confirmed 2020 Target Target Maximum 2020 Target is 95% of the 5 Year Baseline GPCD Target is calculated based on the selected Target Method, see SB X7-7 Table 7 and corresponding tables for agency's calculated target. NOTES:
155 Appendix D SB X7-7 Table 8: 2015 Interim Target GPCD Confirmed 2020 Target Fm SB X7-7 Table 7-F year Baseline GPCD Fm SB X7-7 Table Interim Target GPCD NOTES:
156 Appendix D SB X7-7 Table 9: 2015 Compliance Actual 2015 GPCD 2015 Interim Target GPCD Optional Adjustments (in GPCD) Enter "0" if Adjustment Not Used Extraordinary Events Weather Normalization Economic Adjustment TOTAL Adjustments Adjusted 2015 GPCD 2015 GPCD (Adjusted if applicable) Did Supplier Achieve Targeted Reduction for 2015? NOTES: From Methodology 8 (Optional) From Methodology 8 (Optional) From Methodology 8 (Optional) YES
 Reporting Year: 2015 7/2014-6/2015 Please enter data in the white cells below.")
 using the drop-down list to the left of the input cell.")
157 Appendix D AWWA Free Water Audit Software: Reporting Worksheet WAS v5.0 American Water Works Association. Copyright 2014, All Rights Reserved.? Click to access definition + Click to add a comment Water Audit Report for: City of Dinuba Public Water System ( ) Reporting Year: /2014-6/2015 Please enter data in the white cells below. Where available, metered values should be used; if metered values are unavailable please estimate a value. Indicate your confidence in the accuracy of the input data by grading each component (n/a or 1-10) using the drop-down list to the left of the input cell. Hover the mouse over the cell to obtain a description of the grades All volumes to be entered as: MILLION GALLONS (US) PER YEAR Master Meter and Supply Error Adjustments WATER SUPPLIED < Enter grading in column 'E' and 'J' > Pcnt: Value: AUTHORIZED CONSUMPTION To select the correct data grading for each input, determine the highest grade where the utility meets or exceeds all criteria for that grade and all grades below it. Volume from own sources: +? 7 1, MG/Yr +? 2 MG/Yr Water imported: +? n/a MG/Yr +? MG/Yr Water exported: +? n/a MG/Yr +? MG/Yr Enter negative % or value for under-registration WATER SUPPLIED: 1, MG/Yr Enter positive % or value for over-registration. Click here:? Billed metered: +? 7 1, MG/Yr for help using option Billed unmetered: +? MG/Yr buttons below Unbilled metered: +? MG/Yr Pcnt: Value: Unbilled unmetered: +? MG/Yr 1.25% MG/Yr Default option selected for Unbilled unmetered - a grading of 5 is applied but not displayed AUTHORIZED CONSUMPTION:? 1, MG/Yr Use buttons to select percentage of water supplied OR WATER LOSSES (Water Supplied - Authorized Consumption) MG/Yr value Apparent Losses Pcnt: Value: Unauthorized consumption: +? MG/Yr 0.25% MG/Yr Default option selected for unauthorized consumption - a grading of 5 is applied but not displayed Customer metering inaccuracies: +? MG/Yr 1.00% MG/Yr Systematic data handling errors: +? MG/Yr 0.25% MG/Yr Default option selected for Systematic data handling errors - a grading of 5 is applied but not displayed Apparent Losses:? MG/Yr Real Losses (Current Annual Real Losses or CARL) Real Losses = Water Losses - Apparent Losses: WATER LOSSES:? MG/Yr MG/Yr NON-REVENUE WATER = Water Losses + Unbilled Metered + Unbilled Unmetered SYSTEM DATA NON-REVENUE WATER: MG/Yr Length of mains: +? miles Number of active AND inactive service connections: +? 8 5,742 Service connection density:? 78 conn./mile main? Are customer meters typically located at the curbstop or property line? Yes (length of service line, beyond the property Average length of customer service line: +? ft boundary, that is the responsibility of the utility) Average length of customer service line has been set to zero and a data grading score of 10 has been applied Average operating pressure: +? psi COST DATA Total annual cost of operating water system: +? 10 $2,692,825 $/Year Customer retail unit cost (applied to Apparent Losses): +? 5 $1.74 $/100 cubic feet (ccf) Variable production cost (applied to Real Losses): +? 8 $ $/Million gallons Use Customer Retail Unit Cost to value real losses WATER AUDIT DATA VALIDITY SCORE: *** YOUR SCORE IS: 67 out of 100 *** A weighted scale for the components of consumption and water loss is included in the calculation of the Water Audit Data Validity Score PRIORITY AREAS FOR ATTENTION: Based on the information provided, audit accuracy can be improved by addressing the following components: 1: Volume from own sources 2: Customer metering inaccuracies 3: Customer retail unit cost (applied to Apparent Losses) AWWA Free Water Audit Software v5.0 Reporting Worksheet 1
158 Appendix D AWWA Free Water Audit Software: System Attributes and Performance Indicators WAS v5.0 American Water Works Association. Copyright 2014, All Rights Reserved. Water Audit Report for: City of Dinuba Public Water System ( ) Reporting Year: /2014-6/2015 System Attributes: Performance Indicators: Financial: *** YOUR WATER AUDIT DATA VALIDITY SCORE IS: 67 out of 100 *** Apparent Losses: MG/Yr + Real Losses: MG/Yr = Water Losses: MG/Yr? Unavoidable Annual Real Losses (UARL): MG/Yr Annual cost of Apparent Losses: $51,360 Annual cost of Real Losses: $203,835 Valued at Customer Retail Unit Cost Return to Reporting Worksheet to change this assumpiton Non-revenue water as percent by volume of Water Supplied: 10.3% Non-revenue water as percent by cost of operating system: 14.1% Real Losses valued at Customer Retail Unit Cost Operational Efficiency: Apparent Losses per service connection per day: Real Losses per service connection per day: Real Losses per length of main per day*: Real Losses per service connection per day per psi pressure: gallons/connection/day gallons/connection/day N/A 0.81 gallons/connection/day/psi From Above, Real Losses = Current Annual Real Losses (CARL): million gallons/year? Infrastructure Leakage Index (ILI) [CARL/UARL]: 3.66 * This performance indicator applies for systems with a low service connection density of less than 32 service connections/mile of pipeline AWWA Free Water Audit Software v5.0 Performance Indicators 1
159 Appendix D AWWA Free Water Audit Software: Water Balance WAS v5.0 American Water Works Association. Copyright 2014, All Rights Reserved. Own Sources (Adjusted for known errors) Water Exported Water Audit Report for: City of Dinuba Public Water System ( ) Reporting Year: /2014-6/2015 Data Validity Score: 67 Authorized Consumption Billed Authorized Consumption Billed Water Exported Billed Metered Consumption (water exported is removed) 1, Revenue Water 1, Billed Unmetered Consumption 1, , Unbilled Metered Consumption Unbilled Authorized Consumption 1, Unbilled Unmetered Consumption Water Supplied Unauthorized Consumption Apparent Losses , Customer Metering Inaccuracies Systematic Data Handling Errors Water Losses Water Imported Leakage on Transmission and/or Distribution Mains Real Losses Not broken down Leakage and Overflows at Utility's Storage Tanks Not broken down Leakage on Service Connections Not broken down Non-Revenue Water (NRW) AWWA Free Water Audit Software v5.0 Water Balance 1
160 Appendix D The graphic below is a visual representation of the Water Balance with bar heights propotional to the volume of the audit components 100% 90% AWWA Free Water Audit Software: Dashboard Water Audit Report for: City of Dinuba Public Water System ( ) Reporting Year: /2014-6/2015 Show me the VOLUME of Non-Revenue Water Data Validity Score: 67 Show me the COST of Non-Revenue Water 250,000 Total Cost of NRW =$366,148 WAS v5.0 American Water Works Association. Copyright 2014, All Rights Reserved. 80% 70% 200,000 60% 50% Cost $ 150,000 40% 30% 100,000 20% 10% 50,000 0% Water Exported Water Exported Water Exported Water Exported Water Exported 0 Unbilled metered (valued at Cust.Ret.Unit Cost) Water Imported Volume From Own Sources Water Supplied Authorized Consumption Water Losses Billed Auth. Cons. Unbilled Auth. Cons. Apparent Losses Revenue Water Non Revenue Water Unbilled unmetered (valued at Cust.Ret.Unit Cost) Unauth. consumption Cust. metering inaccuracies Syst. data handling errors Real Losses Real Losses (valued at Cust.Ret.Unit Cost) AWWA Free Water Audit Software v5.0 Dashboard 1
161 Appendix D AWWA Free Water Audit Software: Determining Water Loss Standing WAS v5.0 American Water Works Association. Copyright 2014, All Rights Reserved. Water Audit Report for: City of Dinuba Public Water System ( ) Reporting Year: /2014-6/2015 Data Validity Score: 67 Functional Focus Area Level I (0-25) Water Loss Control Planning Guide Water Audit Data Validity Level / Score Level II (26-50) Level III (51-70) Level IV (71-90) Level V (91-100) Audit Data Collection Launch auditing and loss control team; address production metering deficiencies Analyze business process for customer metering and billing functions and water supply operations. Identify data gaps. Establish/revise policies and procedures for data collection Refine data collection practices and establish as routine business process Annual water audit is a reliable gauge of year-to-year water efficiency standing Short-term loss control Research information on leak detection programs. Begin flowcharting analysis of customer billing system Conduct loss assessment investigations on a sample portion of the system: customer meter testing, leak survey, unauthorized consumption, etc. Establish ongoing mechanisms for customer meter accuracy testing, active leakage control and infrastructure monitoring Refine, enhance or expand ongoing programs based upon economic justification Stay abreast of improvements in metering, meter reading, billing, leakage management and infrastructure rehabilitation Long-term loss control Begin to assess long-term needs requiring large expenditure: customer meter replacement, water main replacement program, new customer billing system or Automatic Meter Reading (AMR) system. Begin to assemble economic business case for long-term needs based upon improved data becoming available through the water audit process. Conduct detailed planning, budgeting and launch of comprehensive improvements for metering, billing or infrastructure management Continue incremental improvements in short-term and long-term loss control interventions Target-setting Establish long-term apparent and real loss reduction goals (+10 year horizon) Establish mid-range (5 year horizon) apparent and real loss reduction goals Evaluate and refine loss control goals on a yearly basis Benchmarking Preliminary Comparisons - can begin to rely upon the Infrastructure Leakage Index (ILI) for performance comparisons for real losses (see below table) Performance Benchmarking - ILI is meaningful in comparing real loss standing Identify Best Practices/ Best in class - the ILI is very reliable as a real loss performance indicator for best in class service For validity scores of 50 or below, the shaded blocks should not be focus areas until better data validity is achieved. AWWA Free Water Audit Software v5.0 Loss Control Planning 1
162 Appendix D Once data have been entered into the Reporting Worksheet, the performance indicators are automatically calculated. How does a water utility operator know how well his or her system is performing? The AWWA Water Loss Control Committee provided the following table to assist water utilities is gauging an approximate Infrastructure Leakage Index (ILI) that is appropriate for their water system and local conditions. The lower the amount of leakage and real losses that exist in the system, then the lower the ILI value will be. Note: this table offers an approximate guideline for leakage reduction target-setting. The best means of setting such targets include performing an economic assessment of various loss control methods. However, this table is useful if such an assessment is not possible. General Guidelines for Setting a Target ILI (without doing a full economic analysis of leakage control options) Target ILI Range Financial Considerations Operational Considerations Water Resources Considerations > > Water resources are costly to develop or purchase; ability to increase revenues via water rates is greatly limited because of regulation or low ratepayer affordability. Water resources can be developed or purchased at reasonable expense; periodic water rate increases can be feasibly imposed and are tolerated by the customer population. Cost to purchase or obtain/treat water is low, as are rates charged to customers. Operating with system leakage above this level would require expansion of existing infrastructure and/or additional water resources to meet the demand. Existing water supply infrastructure capability is sufficient to meet long-term demand as long as reasonable leakage management controls are in place. Superior reliability, capacity and integrity of the water supply infrastructure make it relatively immune to supply shortages. Available resources are greatly limited and are very difficult and/or environmentally unsound to develop. Water resources are believed to be sufficient to meet long-term needs, but demand management interventions (leakage management, water conservation) are included in the long-term planning. Water resources are plentiful, reliable, and easily extracted. Greater than 8.0 Less than 1.0 Although operational and financial considerations may allow a long-term ILI greater than 8.0, such a level of leakage is not an effective utilization of water as a resource. Setting a target level greater than other than as an incremental goal to a smaller long-term target - is discouraged. If the calculated Infrastructure Leakage Index (ILI) value for your system is 1.0 or less, two possibilities exist. a) you are maintaining your leakage at low levels in a class with the top worldwide performers in leakage control. b) A portion of your data may be flawed, causing your losses to be greatly understated. This is likely if you calculate a low ILI value but do not employ extensive leakage control practices in your operations. In such cases it is beneficial to validate the data by performing field measurements to confirm the accuracy of production and customer meters, or to identify any other potential sources of error in the data. AWWA Free Water Audit Software v5.0 Loss Control Planning 2
163 City of Dinuba 2015 Urban Water Management Plan Appendix E Ordinances Water Conservation Ordinance and Contingency Plan Enforcement Ordinance Landscape Ordinance
164 This page is intentionally left blank.

165 Appendix E

166 Appendix E

167 Appendix E

168 Appendix E

169 Appendix E

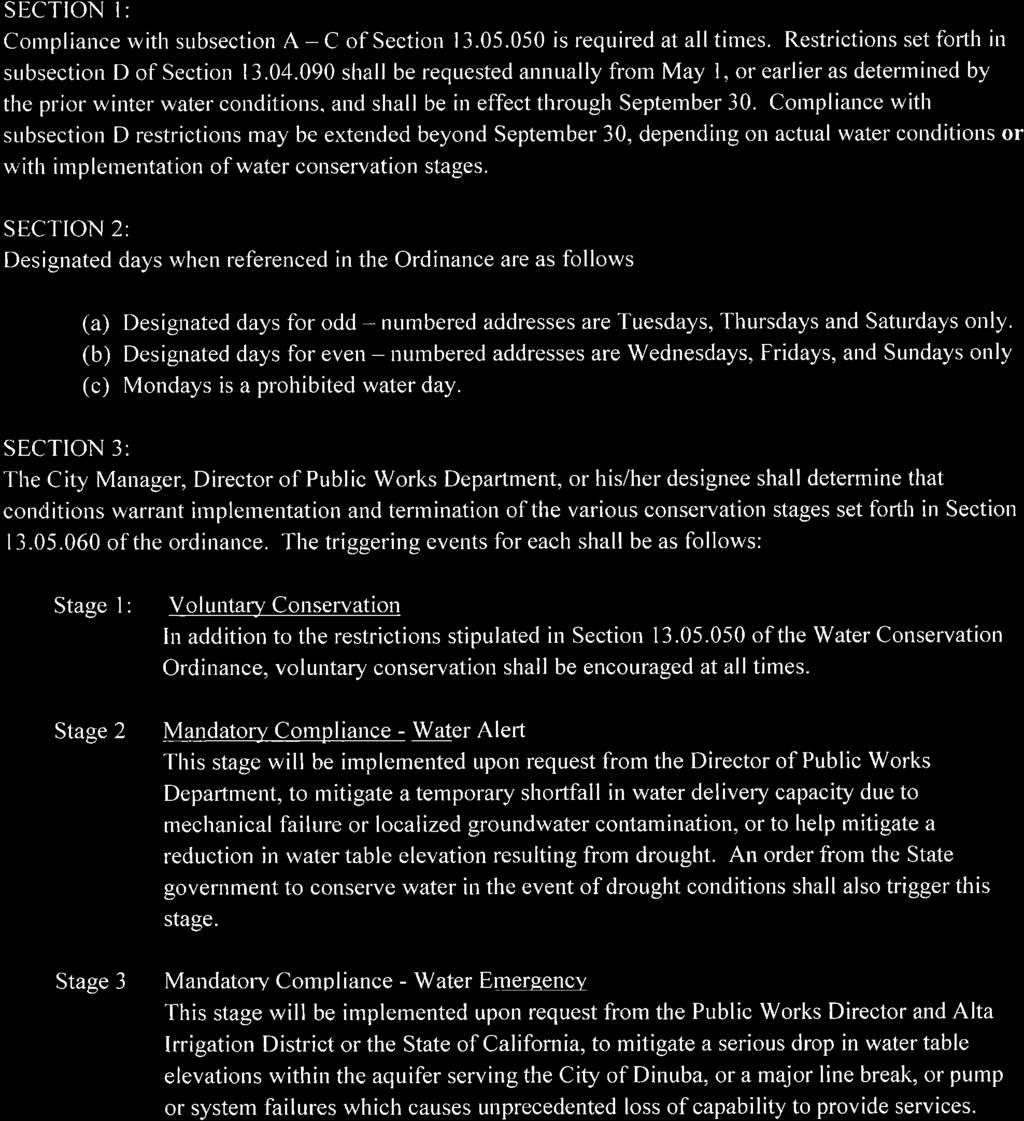
170 Appendix E

171 Appendix E
172 3/2/2016 Chapter 1.16 GENERAL PENALTY Appendix E Sections: Violation Infraction Violation reserved as misdemeanor Prisoners required to labor Nuisance abatement Violation Infraction. Chapter 1.16 GENERAL PENALTY Any person, firm or corporation violating any of the provisions or failing to comply with any of the requirements of this code (including but not limited to Title 14, Buildings and Construction, and Title 16, Subdivisions, and Title 17, Zoning), except as specifically reserved, shall be guilty of an infraction and upon conviction thereof, shall be punishable by a fine not exceeding the maximum then allowable by state law for an infraction. At present, pursuant to Government Code Section 36900, the maximum penalty for an infraction is a fine not exceeding one hundred dollars for a first violation, a fine not exceeding two hundred dollars for a second violation of the same ordinance within one year and a fine not exceeding five hundred dollars for each additional violation of the same ordinance within one year. Except as otherwise provided by law, all provisions of law or ordinance relating to misdemeanors, shall apply to infractions. (Ord , 1996: Ord , 1990: Ord , 1978; Ord , 1973) Violation reserved as misdemeanor. Any person, firm or corporation violating any of the provisions or failing to comply with any of the requirements of this code which is specifically made a misdemeanor (including but not necessarily limited to Chapter 5.34, Chapter 5.68, or Section ), shall be guilty of a misdemeanor and upon conviction thereof, shall be punishable by a fine or imprisonment or both not exceeding the maximum then allowable by state law for a misdemeanor. At present, pursuant to Government Code Section 36901, the maximum penalty for a misdemeanor is a fine not exceeding one thousand dollars and imprisonment not exceeding six months, or both. (Ord , 1996: Ord , 1978) Prisoners required to labor. Persons imprisoned in the city jail for violation of this code may be required to labor on public property or works within the city. (Ord ( 0044), 1954) Nuisance abatement. Whenever a public nuisance is maintained or exists in this city, either under general law or defined to be such under this code, it shall be the duty of the police of this city, and they are authorized and empowered, to summarily abate the same by removal, destruction or abatement of the act or thing constituting such nuisance. (Ord ( 0045), 1954)
173 Appendix E
174 Model Water Efficient Landscape Ordinance September 10, 2009 Appendix E
175 Appendix E Index Page 490. Purpose Applicability Definitions Provisions for New Construction or Rehabilitated Landscapes Compliance with Landscape Documentation Package Penalties Elements of the Landscape Documentation Package Water Efficient Landscape Worksheet Soil Management Report Landscape Design Plan Irrigation Design Plan Grading Design Plan Certificate of Completion Irrigation Scheduling Landscape and Irrigation Maintenance Schedule Irrigation Audit, Irrigation Survey, and Irrigation Water Use Analysis Irrigation Efficiency Recycled Water Stormwater Management Public Education Environmental Review Provisions for Existing Landscapes Irrigation Audit, Irrigation Survey, and Irrigation Water Use Analysis Water Waste Prevention Effective Precipitation 18 Appendices 19 Appendix A. Reference Evapotranspiration (ETo) Table 19 Appendix B. Sample Water Efficient Landscape Worksheet 28 Section B1. Maximum Applied Water Allowance (MAWA) 29 Section B2. Estimated Total Water Use (ETWU) 30 Appendix C. Sample Certificate of Completion 31
176 Appendix E California Code of Regulations Title 23. Waters Division 2. Department of Water Resources Chapter 2.7. Model Water Efficient Landscape Ordinance 490. Purpose. (a) The State Legislature has found: (1) that the waters of the state are of limited supply and are subject to ever increasing demands; (2) that the continuation of California s economic prosperity is dependent on the availability of adequate supplies of water for future uses; (3) that it is the policy of the State to promote the conservation and efficient use of water and to prevent the waste of this valuable resource; (4) that landscapes are essential to the quality of life in California by providing areas for active and passive recreation and as an enhancement to the environment by cleaning air and water, preventing erosion, offering fire protection, and replacing ecosystems lost to development; and (5) that landscape design, installation, maintenance and management can and should be water efficient; and (6) that Section 2 of Article X of the California Constitution specifies that the right to use water is limited to the amount reasonably required for the beneficial use to be served and the right does not and shall not extend to waste or unreasonable method of use. (b) Consistent with these legislative findings, the purpose of this model ordinance is to: (1) promote the values and benefits of landscapes while recognizing the need to invest water and other resources as efficiently as possible; (2) establish a structure for planning, designing, installing, maintaining and managing water efficient landscapes in new construction and rehabilitated projects; (3) establish provisions for water management practices and water waste prevention for existing landscapes; (4) use water efficiently without waste by setting a Maximum Applied Water Allowance as an upper limit for water use and reduce water use to the lowest practical amount; (5) promote the benefits of consistent landscape ordinances with neighboring local and regional agencies; (6) encourage local agencies and water purveyors to use economic incentives that promote the efficient use of water, such as implementing a tiered-rate structure; and (7) encourage local agencies to designate the necessary authority that implements and enforces the provisions of the Model Water Efficient Landscape Ordinance or its local landscape ordinance. Note: Authority cited: Section 65593, Government Code. Reference: Sections 65591, 65593, 65596, Government Code Applicability (a) After January 1, 2010, this ordinance shall apply to all of the following landscape projects: (1) new construction and rehabilitated landscapes for public agency projects and private development projects with a landscape area equal to or greater than 2,500 square feet requiring a building or landscape permit, plan check or design review; (2) new construction and rehabilitated landscapes which are developer-installed in single-family and multi-family projects with a landscape area equal to or greater than 2,500 square feet requiring a building or landscape permit, plan check, or design review; 1
177 Appendix E (3) new construction landscapes which are homeowner-provided and/or homeowner-hired in singlefamily and multi-family residential projects with a total project landscape area equal to or greater than 5,000 square feet requiring a building or landscape permit, plan check or design review; (4) existing landscapes limited to Sections 493, and 493.2; and (5) cemeteries. Recognizing the special landscape management needs of cemeteries, new and rehabilitated cemeteries are limited to Sections 492.4, and ; and existing cemeteries are limited to Sections 493, and (b) This ordinance does not apply to: (1) registered local, state or federal historical sites; (2) ecological restoration projects that do not require a permanent irrigation system; (3) mined-land reclamation projects that do not require a permanent irrigation system; or (4) plant collections, as part of botanical gardens and arboretums open to the public. Note: Authority Cited: Section 65595, Government Code. Reference: Section 65596, Government Code Definitions. The terms used in this ordinance have the meaning set forth below: (a) applied water means the portion of water supplied by the irrigation system to the landscape. (b) automatic irrigation controller means an automatic timing device used to remotely control valves that operate an irrigation system. Automatic irrigation controllers schedule irrigation events using either evapotranspiration (weather-based) or soil moisture data. (c) backflow prevention device means a safety device used to prevent pollution or contamination of the water supply due to the reverse flow of water from the irrigation system. (d) Certificate of Completion means the document required under Section (e) certified irrigation designer means a person certified to design irrigation systems by an accredited academic institution a professional trade organization or other program such as the US Environmental Protection Agency s WaterSense irrigation designer certification program and Irrigation Association s Certified Irrigation Designer program. (f) certified landscape irrigation auditor means a person certified to perform landscape irrigation audits by an accredited academic institution, a professional trade organization or other program such as the US Environmental Protection Agency s WaterSense irrigation auditor certification program and Irrigation Association s Certified Landscape Irrigation Auditor program. (g) check valve or anti-drain valve means a valve located under a sprinkler head, or other location in the irrigation system, to hold water in the system to prevent drainage from sprinkler heads when the sprinkler is off. (h) common interest developments means community apartment projects, condominium projects, planned developments, and stock cooperatives per Civil Code Section (i) conversion factor (0.62) means the number that converts acre-inches per acre per year to gallons per square foot per year (j) drip irrigation means any non-spray low volume irrigation system utilizing emission devices with a flow rate measured in gallons per hour. Low volume irrigation systems are specifically designed to apply small volumes of water slowly at or near the root zone of plants. (k) ecological restoration project means a project where the site is intentionally altered to establish a defined, indigenous, historic ecosystem. (l) effective precipitation or usable rainfall (Eppt) means the portion of total precipitation which becomes available for plant growth. (m) emitter means a drip irrigation emission device that delivers water slowly from the system to the soil. (n) established landscape means the point at which plants in the landscape have developed significant root growth into the soil. Typically, most plants are established after one or two years of growth. 2
178 Appendix E (o) establishment period of the plants means the first year after installing the plant in the landscape or the first two years if irrigation will be terminated after establishment. Typically, most plants are established after one or two years of growth. (p) Estimated Total Water Use (ETWU) means the total water used for the landscape as described in Section (q) ET adjustment factor (ETAF) means a factor of 0.7, that, when applied to reference evapotranspiration, adjusts for plant factors and irrigation efficiency, two major influences upon the amount of water that needs to be applied to the landscape. A combined plant mix with a site-wide average of 0.5 is the basis of the plant factor portion of this calculation. For purposes of the ETAF, the average irrigation efficiency is Therefore, the ET Adjustment Factor is (0.7)=(0.5/0.71). ETAF for a Special Landscape Area shall not exceed 1.0. ETAF for existing non-rehabilitated landscapes is 0.8. (r) evapotranspiration rate means the quantity of water evaporated from adjacent soil and other surfaces and transpired by plants during a specified time. (s) flow rate means the rate at which water flows through pipes, valves and emission devices, measured in gallons per minute, gallons per hour, or cubic feet per second. (t) hardscapes means any durable material (pervious and non-pervious). (u) homeowner-provided landscaping means any landscaping either installed by a private individual for a single family residence or installed by a licensed contractor hired by a homeowner. A homeowner, for purposes of this ordinance, is a person who occupies the dwelling he or she owns. This excludes speculative homes, which are not owner-occupied dwellings. (v) hydrozone means a portion of the landscaped area having plants with similar water needs. A hydrozone may be irrigated or non-irrigated. (w) infiltration rate means the rate of water entry into the soil expressed as a depth of water per unit of time (e.g., inches per hour). (x) invasive plant species means species of plants not historically found in California that spread outside cultivated areas and can damage environmental or economic resources. Invasive species may be regulated by county agricultural agencies as noxious species. Noxious weeds means any weed designated by the Weed Control Regulations in the Weed Control Act and identified on a Regional District noxious weed control list. Lists of invasive plants are maintained at the California Invasive Plant Inventory and USDA invasive and noxious weeds database. (y) irrigation audit means an in-depth evaluation of the performance of an irrigation system conducted by a Certified Landscape Irrigation Auditor. An irrigation audit includes, but is not limited to: inspection, system tune-up, system test with distribution uniformity or emission uniformity, reporting overspray or runoff that causes overland flow, and preparation of an irrigation schedule. (z) irrigation efficiency (IE) means the measurement of the amount of water beneficially used divided by the amount of water applied. Irrigation efficiency is derived from measurements and estimates of irrigation system characteristics and management practices. The minimum average irrigation efficiency for purposes of this ordinance is Greater irrigation efficiency can be expected from well designed and maintained systems. (aa) irrigation survey means an evaluation of an irrigation system that is less detailed than an irrigation audit. An irrigation survey includes, but is not limited to: inspection, system test, and written recommendations to improve performance of the irrigation system. (bb) irrigation water use analysis means an analysis of water use data based on meter readings and billing data. (cc) landscape architect means a person who holds a license to practice landscape architecture in the state of California Business and Professions Code, Section (dd) landscape area means all the planting areas, turf areas, and water features in a landscape design plan subject to the Maximum Applied Water Allowance calculation. The landscape area does not include footprints of buildings or structures, sidewalks, driveways, parking lots, decks, patios, gravel or 3
179 Appendix E stone walks, other pervious or non-pervious hardscapes, and other non-irrigated areas designated for non-development (e.g., open spaces and existing native vegetation). (ee) landscape contractor means a person licensed by the state of California to construct, maintain, repair, install, or subcontract the development of landscape systems. (ff) Landscape Documentation Package means the documents required under Section (gg) landscape project means total area of landscape in a project as defined in landscape area for the purposes of this ordinance, meeting requirements under Section (hh) lateral line means the water delivery pipeline that supplies water to the emitters or sprinklers from the valve. (ii) local agency means a city or county, including a charter city or charter county, that is responsible for adopting and implementing the ordinance. The local agency is also responsible for the enforcement of this ordinance, including but not limited to, approval of a permit and plan check or design review of a project. (jj) local water purveyor means any entity, including a public agency, city, county, or private water company that provides retail water service. (kk) low volume irrigation means the application of irrigation water at low pressure through a system of tubing or lateral lines and low-volume emitters such as drip, drip lines, and bubblers. Low volume irrigation systems are specifically designed to apply small volumes of water slowly at or near the root zone of plants. (ll) main line means the pressurized pipeline that delivers water from the water source to the valve or outlet. (mm) Maximum Applied Water Allowance (MAWA) means the upper limit of annual applied water for the established landscaped area as specified in Section It is based upon the area s reference evapotranspiration, the ET Adjustment Factor, and the size of the landscape area. The Estimated Total Water Use shall not exceed the Maximum Applied Water Allowance. Special Landscape Areas, including recreation areas, areas permanently and solely dedicated to edible plants such as orchards and vegetable gardens, and areas irrigated with recycled water are subject to the MAWA with an ETAF not to exceed 1.0. (nn) microclimate means the climate of a small, specific area that may contrast with the climate of the overall landscape area due to factors such as wind, sun exposure, plant density, or proximity to reflective surfaces. (oo) mined-land reclamation projects means any surface mining operation with a reclamation plan approved in accordance with the Surface Mining and Reclamation Act of (pp) mulch means any organic material such as leaves, bark, straw, compost, or inorganic mineral materials such as rocks, gravel, and decomposed granite left loose and applied to the soil surface for the beneficial purposes of reducing evaporation, suppressing weeds, moderating soil temperature, and preventing soil erosion. (qq) new construction means, for the purposes of this ordinance, a new building with a landscape or other new landscape, such as a park, playground, or greenbelt without an associated building. (rr) operating pressure means the pressure at which the parts of an irrigation system are designed by the manufacturer to operate. (ss) overhead sprinkler irrigation systems means systems that deliver water through the air (e.g., spray heads and rotors). (tt) overspray means the irrigation water which is delivered beyond the target area. (uu) permit means an authorizing document issued by local agencies for new construction or rehabilitated landscapes. (vv) pervious means any surface or material that allows the passage of water through the material and into the underlying soil. (ww) plant factor or plant water use factor is a factor, when multiplied by ETo, estimates the amount of water needed by plants. For purposes of this ordinance, the plant factor range for low water 4
180 Appendix E use plants is 0 to 0.3, the plant factor range for moderate water use plants is 0.4 to 0.6, and the plant factor range for high water use plants is 0.7 to 1.0. Plant factors cited in this ordinance are derived from the Department of Water Resources 2000 publication Water Use Classification of Landscape Species. (xx) precipitation rate means the rate of application of water measured in inches per hour. (yy) project applicant means the individual or entity submitting a Landscape Documentation Package required under Section 492.3, to request a permit, plan check, or design review from the local agency. A project applicant may be the property owner or his or her designee. (zz) rain sensor or rain sensing shutoff device means a component which automatically suspends an irrigation event when it rains. (aaa) record drawing or as-builts means a set of reproducible drawings which show significant changes in the work made during construction and which are usually based on drawings marked up in the field and other data furnished by the contractor. (bbb) recreational area means areas dedicated to active play such as parks, sports fields, and golf courses where turf provides a playing surface. (ccc) recycled water, reclaimed water, or treated sewage effluent water means treated or recycled waste water of a quality suitable for non-potable uses such as landscape irrigation and water features. This water is not intended for human consumption. (ddd) reference evapotranspiration or ETo means a standard measurement of environmental parameters which affect the water use of plants. ETo is expressed in inches per day, month, or year as represented in Section 495.1, and is an estimate of the evapotranspiration of a large field of four- to seven-inch tall, cool-season grass that is well watered. Reference evapotranspiration is used as the basis of determining the Maximum Applied Water Allowance so that regional differences in climate can be accommodated. (eee) rehabilitated landscape means any re-landscaping project that requires a permit, plan check, or design review, meets the requirements of Section 490.1, and the modified landscape area is equal to or greater than 2,500 square feet, is 50% of the total landscape area, and the modifications are completed within one year. (fff) runoff means water which is not absorbed by the soil or landscape to which it is applied and flows from the landscape area. For example, runoff may result from water that is applied at too great a rate (application rate exceeds infiltration rate) or when there is a slope. (ggg) soil moisture sensing device or soil moisture sensor means a device that measures the amount of water in the soil. The device may also suspend or initiate an irrigation event. (hhh) soil texture means the classification of soil based on its percentage of sand, silt, and clay. (iii) Special Landscape Area (SLA) means an area of the landscape dedicated solely to edible plants, areas irrigated with recycled water, water features using recycled water and areas dedicated to active play such as parks, sports fields, golf courses, and where turf provides a playing surface. (jjj) sprinkler head means a device which delivers water through a nozzle. (kkk) static water pressure means the pipeline or municipal water supply pressure when water is not flowing. (lll) station means an area served by one valve or by a set of valves that operate simultaneously. (mmm) swing joint means an irrigation component that provides a flexible, leak-free connection between the emission device and lateral pipeline to allow movement in any direction and to prevent equipment damage. (nnn) turf means a ground cover surface of mowed grass. Annual bluegrass, Kentucky bluegrass, Perennial ryegrass, Red fescue, and Tall fescue are cool-season grasses. Bermudagrass, Kikuyugrass, Seashore Paspalum, St. Augustinegrass, Zoysiagrass, and Buffalo grass are warm-season grasses. (ooo) valve means a device used to control the flow of water in the irrigation system. (ppp) water conserving plant species means a plant species identified as having a low plant factor. (qqq) water feature means a design element where open water performs an aesthetic or recreational function. Water features include ponds, lakes, waterfalls, fountains, artificial streams, spas, and 5
181 Appendix E swimming pools (where water is artificially supplied). The surface area of water features is included in the high water use hydrozone of the landscape area. Constructed wetlands used for on-site wastewater treatment or stormwater best management practices that are not irrigated and used solely for water treatment or stormwater retention are not water features and, therefore, are not subject to the water budget calculation. (rrr) watering window means the time of day irrigation is allowed. (sss) WUCOLS means the Water Use Classification of Landscape Species published by the University of California Cooperative Extension, the Department of Water Resources and the Bureau of Reclamation, Note: Authority Cited: Section 65595, Government Code. Reference: Sections 65592, 65596, Government Code Provisions for New Construction or Rehabilitated Landscapes. (a) A local agency may designate another agency, such as a water purveyor, to implement some or all of the requirements contained in this ordinance. Local agencies may collaborate with water purveyors to define each entity s specific responsibilities relating to this ordinance. Note: Authority Cited: Section 65595, Government Code. Reference: Section 65596, Government Code Compliance with Landscape Documentation Package. (a) Prior to construction, the local agency shall: (1) provide the project applicant with the ordinance and procedures for permits, plan checks, or design reviews; (2) review the Landscape Documentation Package submitted by the project applicant; (3) approve or deny the Landscape Documentation Package; (4) issue a permit or approve the plan check or design review for the project applicant; and (5) upon approval of the Landscape Documentation Package, submit a copy of the Water Efficient Landscape Worksheet to the local water purveyor. (b) Prior to construction, the project applicant shall: (1) submit a Landscape Documentation Package to the local agency. (c) Upon approval of the Landscape Documentation Package by the local agency, the project applicant shall: (1) receive a permit or approval of the plan check or design review and record the date of the permit in the Certificate of Completion; (2) submit a copy of the approved Landscape Documentation Package along with the record drawings, and any other information to the property owner or his/her designee; and (3) submit a copy of the Water Efficient Landscape Worksheet to the local water purveyor. Note: Authority Cited: Section 65595, Government Code. Reference: Section 65596, Government Code Penalties. (a) A local agency may establish and administer penalties to the project applicant for non-compliance with the ordinance to the extent permitted by law. Note: Authority Cited: Section 65595, Government Code. Reference: Section 65596, Government Code. 6
182 Appendix E Elements of the Landscape Documentation Package. (a) The Landscape Documentation Package shall include the following six (6) elements: (1) project information; (A) date (B) project applicant (C) project address (if available, parcel and/or lot number(s)) (D) total landscape area (square feet) (E) project type (e.g., new, rehabilitated, public, private, cemetery, homeowner-installed) (F) water supply type (e.g., potable, recycled, well) and identify the local retail water purveyor if the applicant is not served by a private well (G) checklist of all documents in Landscape Documentation Package (H) project contacts to include contact information for the project applicant and property owner (I) applicant signature and date with statement, I agree to comply with the requirements of the water efficient landscape ordinance and submit a complete Landscape Documentation Package. (2) Water Efficient Landscape Worksheet; (A) hydrozone information table (B) water budget calculations 1. Maximum Applied Water Allowance (MAWA) 2. Estimated Total Water Use (ETWU) (3) soil management report; (4) landscape design plan; (5) irrigation design plan; and (6) grading design plan. Note: Authority Cited: Section 65595, Government Code. Reference: Section 65596, Government Code Water Efficient Landscape Worksheet. (a) A project applicant shall complete the Water Efficient Landscape Worksheet which contains two sections (see sample worksheet in Appendix B): (1) a hydrozone information table (see Appendix B, Section A) for the landscape project; and (2) a water budget calculation (see Appendix B, Section B) for the landscape project. For the calculation of the Maximum Applied Water Allowance and Estimated Total Water Use, a project applicant shall use the ETo values from the Reference Evapotranspiration Table in Appendix A. For geographic areas not covered in Appendix A, use data from other cities located nearby in the same reference evapotranspiration zone, as found in the CIMIS Reference Evapotranspiration Zones Map, Department of Water Resources, (b) Water budget calculations shall adhere to the following requirements: (1) The plant factor used shall be from WUCOLS. The plant factor ranges from 0 to 0.3 for low water use plants, from 0.4 to 0.6 for moderate water use plants, and from 0.7 to 1.0 for high water use plants. (2) All water features shall be included in the high water use hydrozone and temporarily irrigated areas shall be included in the low water use hydrozone. (3) All Special Landscape Areas shall be identified and their water use calculated as described below. (4) ETAF for Special Landscape Areas shall not exceed 1.0. (c) Maximum Applied Water Allowance The Maximum Applied Water Allowance shall be calculated using the equation: MAWA = (ETo) (0.62) [(0.7 x LA) + (0.3 x SLA)] 7
183 Appendix E The example calculations below are hypothetical to demonstrate proper use of the equations and do not represent an existing and/or planned landscape project. The ETo values used in these calculations are from the Reference Evapotranspiration Table in Appendix A, for planning purposes only. For actual irrigation scheduling, automatic irrigation controllers are required and shall use current reference evapotranspiration data, such as from the California Irrigation Management Information System (CIMIS), other equivalent data, or soil moisture sensor data. (1) Example MAWA calculation: a hypothetical landscape project in Fresno, CA with an irrigated landscape area of 50,000 square feet without any Special Landscape Area (SLA= 0, no edible plants, recreational areas, or use of recycled water). To calculate MAWA, the annual reference evapotranspiration value for Fresno is 51.1 inches as listed in the Reference Evapotranspiration Table in Appendix A. MAWA = (ETo) (0.62) [(0.7 x LA) + (0.3 x SLA)] MAWA = Maximum Applied Water Allowance (gallons per year) ETo = Reference Evapotranspiration (inches per year) 0.62 = Conversion Factor (to gallons) 0.7 = ET Adjustment Factor (ETAF) LA = Landscape Area including SLA (square feet) 0.3 = Additional Water Allowance for SLA SLA = Special Landscape Area (square feet) MAWA = (51.1 inches) (0.62) [(0.7 x 50,000 square feet) + (0.3 x 0)] = 1,108,870 gallons per year To convert from gallons per year to hundred-cubic-feet per year: = 1,108,870/748 = 1,482 hundred-cubic-feet per year (100 cubic feet = 748 gallons) (2) In this next hypothetical example, the landscape project in Fresno, CA has the same ETo value of 51.1 inches and a total landscape area of 50,000 square feet. Within the 50,000 square foot project, there is now a 2,000 square foot area planted with edible plants. This 2,000 square foot area is considered to be a Special Landscape Area. MAWA = (ETo) (0.62) [(0.7 x LA) + (0.3 x SLA)] MAWA = (51.1 inches) (0.62) [(0.7 x 50,000 square feet) + (0.3 x 2,000 square feet)] = x [35, ] gallons per year = x 35,600 gallons per year =1,127,808 gallons per year or 1,508 hundred-cubic-feet per year (d) Estimated Total Water Use. The Estimated Total Water Use shall be calculated using the equation below. The sum of the Estimated Total Water Use calculated for all hydrozones shall not exceed MAWA. PF x HA ETWU = ( ETo)(0.62) + SLA IE Where: ETWU = Estimated Total Water Use per year (gallons) ETo = Reference Evapotranspiration (inches) PF = Plant Factor from WUCOLS (see Section 491) HA = Hydrozone Area [high, medium, and low water use areas] (square feet) SLA = Special Landscape Area (square feet) 0.62 = Conversion Factor IE = Irrigation Efficiency (minimum 0.71) 8
184 Appendix E (1) Example ETWU calculation: landscape area is 50,000 square feet; plant water use type, plant factor, and hydrozone area are shown in the table below. The ETo value is 51.1 inches per year. There are no Special Landscape Areas (recreational area, area permanently and solely dedicated to edible plants, and area irrigated with recycled water) in this example. Hydrozone Plant Factor (PF)* Hydrozone Area (HA) (square feet) Plant Water Use Type(s) PF x HA (square feet) 1 High 0.8 7,000 5,600 2 High ,000 7,000 3 Medium ,000 8,000 4 Low 0.3 7,000 2,100 5 Low ,000 2,000 Sum 24,700 *Plant Factor from WUCOLS 24, 700 ETWU = (51.1)(0.62) = 1,102,116 gallons per year Compare ETWU with MAWA: For this example MAWA = (51.1) (0.62) [(0.7 x 50,000) + (0.3 x 0)] = 1,108,870 gallons per year. The ETWU (1,102,116 gallons per year) is less than MAWA (1,108,870 gallons per year). In this example, the water budget complies with the MAWA. (2) Example ETWU calculation: total landscape area is 50,000 square feet, 2,000 square feet of which is planted with edible plants. The edible plant area is considered a Special Landscape Area (SLA). The reference evapotranspiration value is 51.1 inches per year. The plant type, plant factor, and hydrozone area are shown in the table below. Hydrozone *Plant Factor from WUCOLS 23,500 ETWU = (51.1)(0.62) + 2, = (31.68) (33, ,000) = 1,111,936 gallons per year Plant Factor (PF)* Hydrozone Area (HA) (square feet) Plant Water Use Type(s) 1 High 0.8 7,000 5,600 2 High 0.7 9,000 6,300 3 Medium ,000 7,500 4 Low 0.3 7,000 2,100 5 Low ,000 2,000 PF x HA (square feet) Sum 23,500 6 SLA 1.0 2,000 2,000 9
185 Appendix E Compare ETWU with MAWA. For this example: MAWA = (51.1) (0.62) [(0.7 x 50,000) + (0.3 x 2,000)] = x [35, ] = x 35,600 =1,127,808 gallons per year The ETWU (1,111,936 gallons per year) is less than MAWA (1,127,808 gallons per year). For this example, the water budget complies with the MAWA. Note: Authority Cited: Section 65595, Government Code. Reference: Section 65596, Government Code Soil Management Report. (a) In order to reduce runoff and encourage healthy plant growth, a soil management report shall be completed by the project applicant, or his/her designee, as follows: (1) Submit soil samples to a laboratory for analysis and recommendations. (A) Soil sampling shall be conducted in accordance with laboratory protocol, including protocols regarding adequate sampling depth for the intended plants. (B) The soil analysis may include: 1. soil texture; 2. infiltration rate determined by laboratory test or soil texture infiltration rate table; 3. ph; 4. total soluble salts; 5. sodium; 6. percent organic matter; and 7. recommendations. (2) The project applicant, or his/her designee, shall comply with one of the following: (A) If significant mass grading is not planned, the soil analysis report shall be submitted to the local agency as part of the Landscape Documentation Package; or (B) If significant mass grading is planned, the soil analysis report shall be submitted to the local agency as part of the Certificate of Completion. (3) The soil analysis report shall be made available, in a timely manner, to the professionals preparing the landscape design plans and irrigation design plans to make any necessary adjustments to the design plans. (4) The project applicant, or his/her designee, shall submit documentation verifying implementation of soil analysis report recommendations to the local agency with Certificate of Completion. Note: Authority Cited: Section 65595, Government Code. Reference: Section 65596, Government Code Landscape Design Plan. (a) For the efficient use of water, a landscape shall be carefully designed and planned for the intended function of the project. A landscape design plan meeting the following design criteria shall be submitted as part of the Landscape Documentation Package. (1) Plant Material (A) Any plant may be selected for the landscape, providing the Estimated Total Water Use in the landscape area does not exceed the Maximum Applied Water Allowance. To encourage the efficient use of water, the following is highly recommended: 1. protection and preservation of native species and natural vegetation; 2. selection of water-conserving plant and turf species; 10
186 Appendix E 3. selection of plants based on disease and pest resistance; 4. selection of trees based on applicable local tree ordinances or tree shading guidelines; and 5. selection of plants from local and regional landscape program plant lists. (B) Each hydrozone shall have plant materials with similar water use, with the exception of hydrozones with plants of mixed water use, as specified in Section 492.7(a)(2)(D). (C) Plants shall be selected and planted appropriately based upon their adaptability to the climatic, geologic, and topographical conditions of the project site. To encourage the efficient use of water, the following is highly recommended: 1. use the Sunset Western Climate Zone System which takes into account temperature, humidity, elevation, terrain, latitude, and varying degrees of continental and marine influence on local climate; 2. recognize the horticultural attributes of plants (i.e., mature plant size, invasive surface roots) to minimize damage to property or infrastructure [e.g., buildings, sidewalks, power lines]; and 3. consider the solar orientation for plant placement to maximize summer shade and winter solar gain. (D) Turf is not allowed on slopes greater than 25% where the toe of the slope is adjacent to an impermeable hardscape and where 25% means 1 foot of vertical elevation change for every 4 feet of horizontal length (rise divided by run x 100 = slope percent). (E) A landscape design plan for projects in fire-prone areas shall address fire safety and prevention. A defensible space or zone around a building or structure is required per Public Resources Code Section 4291(a) and (b). Avoid fire-prone plant materials and highly flammable mulches. (F) The use of invasive and/or noxious plant species is strongly discouraged. (G) The architectural guidelines of a common interest development, which include community apartment projects, condominiums, planned developments, and stock cooperatives, shall not prohibit or include conditions that have the effect of prohibiting the use of low-water use plants as a group. (2) Water Features (A) Recirculating water systems shall be used for water features. (B) Where available, recycled water shall be used as a source for decorative water features. (C) Surface area of a water feature shall be included in the high water use hydrozone area of the water budget calculation. (D) Pool and spa covers are highly recommended. (3) Mulch and Amendments (A) A minimum two inch (2 ) layer of mulch shall be applied on all exposed soil surfaces of planting areas except in turf areas, creeping or rooting groundcovers, or direct seeding applications where mulch is contraindicated. (B) Stabilizing mulching products shall be used on slopes. (C) The mulching portion of the seed/mulch slurry in hydro-seeded applications shall meet the mulching requirement. (D) Soil amendments shall be incorporated according to recommendations of the soil report and what is appropriate for the plants selected (see Section 492.5). (b) The landscape design plan, at a minimum, shall: (1) delineate and label each hydrozone by number, letter, or other method; (2) identify each hydrozone as low, moderate, high water, or mixed water use. Temporarily irrigated areas of the landscape shall be included in the low water use hydrozone for the water budget calculation; (3) identify recreational areas; (4) identify areas permanently and solely dedicated to edible plants; (5) identify areas irrigated with recycled water; (6) identify type of mulch and application depth; (7) identify soil amendments, type, and quantity; (8) identify type and surface area of water features; (9) identify hardscapes (pervious and non-pervious); 11
187 Appendix E (10) identify location and installation details of any applicable stormwater best management practices that encourage on-site retention and infiltration of stormwater. Stormwater best management practices are encouraged in the landscape design plan and examples include, but are not limited to: (A) infiltration beds, swales, and basins that allow water to collect and soak into the ground; (B) constructed wetlands and retention ponds that retain water, handle excess flow, and filter pollutants; and (C) pervious or porous surfaces (e.g., permeable pavers or blocks, pervious or porous concrete, etc.) that minimize runoff. (11) identify any applicable rain harvesting or catchment technologies (e.g., rain gardens, cisterns, etc.); (12) contain the following statement: I have complied with the criteria of the ordinance and applied them for the efficient use of water in the landscape design plan ; and (13) bear the signature of a licensed landscape architect, licensed landscape contractor, or any other person authorized to design a landscape. (See Sections , 5615, 5641, , , , , , , 6701, of the Business and Professions Code, Section of Title16 of the California Code of Regulations, and Section 6721 of the Food and Agriculture Code.) Note: Authority Cited: Section 65595, Government Code. Reference: Section 65596, Government Code and Section 1351, Civil Code Irrigation Design Plan. (a) For the efficient use of water, an irrigation system shall meet all the requirements listed in this section and the manufacturers recommendations. The irrigation system and its related components shall be planned and designed to allow for proper installation, management, and maintenance. An irrigation design plan meeting the following design criteria shall be submitted as part of the Landscape Documentation Package. (1) System (A) Dedicated landscape water meters are highly recommended on landscape areas smaller than 5,000 square feet to facilitate water management. (B) Automatic irrigation controllers utilizing either evapotranspiration or soil moisture sensor data shall be required for irrigation scheduling in all irrigation systems. (C) The irrigation system shall be designed to ensure that the dynamic pressure at each emission device is within the manufacturer s recommended pressure range for optimal performance. 1. If the static pressure is above or below the required dynamic pressure of the irrigation system, pressure-regulating devices such as inline pressure regulators, booster pumps, or other devices shall be installed to meet the required dynamic pressure of the irrigation system. 2. Static water pressure, dynamic or operating pressure. and flow reading of the water supply shall be measured at the point of connection. These pressure and flow measurements shall be conducted at the design stage. If the measurements are not available at the design stage, the measurements shall be conducted at installation. (D) Sensors (rain, freeze, wind, etc.), either integral or auxiliary, that suspend or alter irrigation operation during unfavorable weather conditions shall be required on all irrigation systems, as appropriate for local climatic conditions. Irrigation should be avoided during windy or freezing weather or during rain. (E) Manual shut-off valves (such as a gate valve, ball valve, or butterfly valve) shall be required, as close as possible to the point of connection of the water supply, to minimize water loss in case of an emergency (such as a main line break) or routine repair. 12
188 Appendix E (F) Backflow prevention devices shall be required to protect the water supply from contamination by the irrigation system. A project applicant shall refer to the applicable local agency code (i.e., public health) for additional backflow prevention requirements. (G) High flow sensors that detect and report high flow conditions created by system damage or malfunction are recommended. (H) The irrigation system shall be designed to prevent runoff, low head drainage, overspray, or other similar conditions where irrigation water flows onto non-targeted areas, such as adjacent property, nonirrigated areas, hardscapes, roadways, or structures. (I) Relevant information from the soil management plan, such as soil type and infiltration rate, shall be utilized when designing irrigation systems. (J) The design of the irrigation system shall conform to the hydrozones of the landscape design plan. (K) The irrigation system must be designed and installed to meet, at a minimum, the irrigation efficiency criteria as described in Section regarding the Maximum Applied Water Allowance. (L) It is highly recommended that the project applicant or local agency inquire with the local water purveyor about peak water operating demands (on the water supply system) or water restrictions that may impact the effectiveness of the irrigation system. (M) In mulched planting areas, the use of low volume irrigation is required to maximize water infiltration into the root zone. (N) Sprinkler heads and other emission devices shall have matched precipitation rates, unless otherwise directed by the manufacturer s recommendations. (O) Head to head coverage is recommended. However, sprinkler spacing shall be designed to achieve the highest possible distribution uniformity using the manufacturer s recommendations. (P) Swing joints or other riser-protection components are required on all risers subject to damage that are adjacent to high traffic areas. (Q) Check valves or anti-drain valves are required for all irrigation systems. (R) Narrow or irregularly shaped areas, including turf, less than eight (8) feet in width in any direction shall be irrigated with subsurface irrigation or low volume irrigation system. (S) Overhead irrigation shall not be permitted within 24 inches of any non-permeable surface. Allowable irrigation within the setback from non-permeable surfaces may include drip, drip line, or other low flow non-spray technology. The setback area may be planted or unplanted. The surfacing of the setback may be mulch, gravel, or other porous material. These restrictions may be modified if: 1. the landscape area is adjacent to permeable surfacing and no runoff occurs; or 2. the adjacent non-permeable surfaces are designed and constructed to drain entirely to landscaping; or 3. the irrigation designer specifies an alternative design or technology, as part of the Landscape Documentation Package and clearly demonstrates strict adherence to irrigation system design criteria in Section (a)(1)(h). Prevention of overspray and runoff must be confirmed during the irrigation audit. (T) Slopes greater than 25% shall not be irrigated with an irrigation system with a precipitation rate exceeding 0.75 inches per hour. This restriction may be modified if the landscape designer specifies an alternative design or technology, as part of the Landscape Documentation Package, and clearly demonstrates no runoff or erosion will occur. Prevention of runoff and erosion must be confirmed during the irrigation audit. (2) Hydrozone (A) Each valve shall irrigate a hydrozone with similar site, slope, sun exposure, soil conditions, and plant materials with similar water use. (B) Sprinkler heads and other emission devices shall be selected based on what is appropriate for the plant type within that hydrozone. (C) Where feasible, trees shall be placed on separate valves from shrubs, groundcovers, and turf. (D) Individual hydrozones that mix plants of moderate and low water use, or moderate and high water use, may be allowed if: 13
189 Appendix E 1. plant factor calculation is based on the proportions of the respective plant water uses and their plant factor; or 2. the plant factor of the higher water using plant is used for calculations. (E) Individual hydrozones that mix high and low water use plants shall not be permitted. (F) On the landscape design plan and irrigation design plan, hydrozone areas shall be designated by number, letter, or other designation. On the irrigation design plan, designate the areas irrigated by each valve, and assign a number to each valve. Use this valve number in the Hydrozone Information Table (see Appendix B Section A). This table can also assist with the irrigation audit and programming the controller. (b) The irrigation design plan, at a minimum, shall contain: (1) location and size of separate water meters for landscape; (2) location, type and size of all components of the irrigation system, including controllers, main and lateral lines, valves, sprinkler heads, moisture sensing devices, rain switches, quick couplers, pressure regulators, and backflow prevention devices; (3) static water pressure at the point of connection to the public water supply; (4) flow rate (gallons per minute), application rate (inches per hour), and design operating pressure (pressure per square inch) for each station; (5) recycled water irrigation systems as specified in Section ; (6) the following statement: I have complied with the criteria of the ordinance and applied them accordingly for the efficient use of water in the irrigation design plan ; and (7) the signature of a licensed landscape architect, certified irrigation designer, licensed landscape contractor, or any other person authorized to design an irrigation system. (See Sections , 5615, 5641, , , , , , , 6701, of the Business and Professions Code, Section of Title 16 of the California Code of Regulations, and Section 6721 of the Food and Agricultural Code.) Note: Authority Cited: Section 65595, Government Code. Reference: Section 65596, Government Code Grading Design Plan. (a) For the efficient use of water, grading of a project site shall be designed to minimize soil erosion, runoff, and water waste. A grading plan shall be submitted as part of the Landscape Documentation Package. A comprehensive grading plan prepared by a civil engineer for other local agency permits satisfies this requirement. (1) The project applicant shall submit a landscape grading plan that indicates finished configurations and elevations of the landscape area including: (A) height of graded slopes; (B) drainage patterns; (C) pad elevations; (D) finish grade; and (E) stormwater retention improvements, if applicable. (2) To prevent excessive erosion and runoff, it is highly recommended that project applicants: (A) grade so that all irrigation and normal rainfall remains within property lines and does not drain on to non-permeable hardscapes; (B) avoid disruption of natural drainage patterns and undisturbed soil; and (C) avoid soil compaction in landscape areas. (3) The grading design plan shall contain the following statement: I have complied with the criteria of the ordinance and applied them accordingly for the efficient use of water in the grading design plan and shall bear the signature of a licensed professional as authorized by law. Note: Authority Cited: Section 65595, Government Code. Reference: Section 65596, Government Code. 14
190 Appendix E Certificate of Completion. (a) The Certificate of Completion (see Appendix C for a sample certificate) shall include the following six (6) elements: (1) project information sheet that contains: (A) date; (B) project name; (C) project applicant name, telephone, and mailing address; (D) project address and location; and (E) property owner name, telephone, and mailing address; (2) certification by either the signer of the landscape design plan, the signer of the irrigation design plan, or the licensed landscape contractor that the landscape project has been installed per the approved Landscape Documentation Package; (A) where there have been significant changes made in the field during construction, these as-built or record drawings shall be included with the certification; (3) irrigation scheduling parameters used to set the controller (see Section ); (4) landscape and irrigation maintenance schedule (see Section ); (5) irrigation audit report (see Section ); and (6) soil analysis report, if not submitted with Landscape Documentation Package, and documentation verifying implementation of soil report recommendations (see Section 492.5). (b) The project applicant shall: (1) submit the signed Certificate of Completion to the local agency for review; (2) ensure that copies of the approved Certificate of Completion are submitted to the local water purveyor and property owner or his or her designee. (c) The local agency shall: (1) receive the signed Certificate of Completion from the project applicant; (2) approve or deny the Certificate of Completion. If the Certificate of Completion is denied, the local agency shall provide information to the project applicant regarding reapplication, appeal, or other assistance. Note: Authority Cited: Section 65595, Government Code. Reference: Section 65596, Government Code Irrigation Scheduling. (a) For the efficient use of water, all irrigation schedules shall be developed, managed, and evaluated to utilize the minimum amount of water required to maintain plant health. Irrigation schedules shall meet the following criteria: (1) Irrigation scheduling shall be regulated by automatic irrigation controllers. (2) Overhead irrigation shall be scheduled between 8:00 p.m. and 10:00 a.m. unless weather conditions prevent it. If allowable hours of irrigation differ from the local water purveyor, the stricter of the two shall apply. Operation of the irrigation system outside the normal watering window is allowed for auditing and system maintenance. (3) For implementation of the irrigation schedule, particular attention must be paid to irrigation run times, emission device, flow rate, and current reference evapotranspiration, so that applied water meets the Estimated Total Water Use. Total annual applied water shall be less than or equal to Maximum Applied Water Allowance (MAWA). Actual irrigation schedules shall be regulated by automatic irrigation controllers using current reference evapotranspiration data (e.g., CIMIS) or soil moisture sensor data. (4) Parameters used to set the automatic controller shall be developed and submitted for each of the following: (A) the plant establishment period; 15
191 Appendix E (B) the established landscape; and (C) temporarily irrigated areas. (5) Each irrigation schedule shall consider for each station all of the following that apply: (A) irrigation interval (days between irrigation); (B) irrigation run times (hours or minutes per irrigation event to avoid runoff); (C) number of cycle starts required for each irrigation event to avoid runoff; (D) amount of applied water scheduled to be applied on a monthly basis; (E) application rate setting; (F) root depth setting; (G) plant type setting; (H) soil type; (I) slope factor setting; (J) shade factor setting; and (K) irrigation uniformity or efficiency setting. Note: Authority Cited: Section 65595, Government Code. Reference: Section 65596, Government Code Landscape and Irrigation Maintenance Schedule. (a) Landscapes shall be maintained to ensure water use efficiency. A regular maintenance schedule shall be submitted with the Certificate of Completion. (b) A regular maintenance schedule shall include, but not be limited to, routine inspection; adjustment and repair of the irrigation system and its components; aerating and dethatching turf areas; replenishing mulch; fertilizing; pruning; weeding in all landscape areas, and removing and obstruction to emission devices. Operation of the irrigation system outside the normal watering window is allowed for auditing and system maintenance. (c) Repair of all irrigation equipment shall be done with the originally installed components or their equivalents. (d) A project applicant is encouraged to implement sustainable or environmentally-friendly practices for overall landscape maintenance. Note: Authority Cited: Section 65595, Government Code. Reference: Section 65596, Government Code Irrigation Audit, Irrigation Survey, and Irrigation Water Use Analysis. (a) All landscape irrigation audits shall be conducted by a certified landscape irrigation auditor. (b) For new construction and rehabilitated landscape projects installed after January 1, 2010, as described in Section 490.1: (1) the project applicant shall submit an irrigation audit report with the Certificate of Completion to the local agency that may include, but is not limited to: inspection, system tune-up, system test with distribution uniformity, reporting overspray or run off that causes overland flow, and preparation of an irrigation schedule; (2) the local agency shall administer programs that may include, but not be limited to, irrigation water use analysis, irrigation audits, and irrigation surveys for compliance with the Maximum Applied Water Allowance. Note: Authority Cited: Section 65595, Government Code. Reference: Section 65596, Government Code. 16
192 Appendix E Irrigation Efficiency. (a) For the purpose of determining Maximum Applied Water Allowance, average irrigation efficiency is assumed to be Irrigation systems shall be designed, maintained, and managed to meet or exceed an average landscape irrigation efficiency of Note: Authority Cited: Section 65595, Government Code. Reference: Section 65596, Government Code Recycled Water. (a) The installation of recycled water irrigation systems shall allow for the current and future use of recycled water, unless a written exemption has been granted as described in Section (b). (b) Irrigation systems and decorative water features shall use recycled water unless a written exemption has been granted by the local water purveyor stating that recycled water meeting all public health codes and standards is not available and will not be available for the foreseeable future. (c) All recycled water irrigation systems shall be designed and operated in accordance with all applicable local and State laws. (d) Landscapes using recycled water are considered Special Landscape Areas. The ET Adjustment Factor for Special Landscape Areas shall not exceed 1.0. Note: Authority Cited: Section 65595, Government Code. Reference: Section 65596, Government Code Stormwater Management. (a) Stormwater management practices minimize runoff and increase infiltration which recharges groundwater and improves water quality. Implementing stormwater best management practices into the landscape and grading design plans to minimize runoff and to increase on-site retention and infiltration are encouraged. (b) Project applicants shall refer to the local agency or Regional Water Quality Control Board for information on any applicable stormwater ordinances and stormwater management plans. (c) Rain gardens, cisterns, and other landscapes features and practices that increase rainwater capture and create opportunities for infiltration and/or onsite storage are recommended. Note: Authority Cited: Section 65595, Government Code. Reference: Section 65596, Government Code Public Education. (a) Publications. Education is a critical component to promote the efficient use of water in landscapes. The use of appropriate principles of design, installation, management and maintenance that save water is encouraged in the community. (1) A local agency shall provide information to owners of new, single-family residential homes regarding the design, installation, management, and maintenance of water efficient landscapes. (b) Model Homes. All model homes that are landscaped shall use signs and written information to demonstrate the principles of water efficient landscapes described in this ordinance. (1) Signs shall be used to identify the model as an example of a water efficient landscape featuring elements such as hydrozones, irrigation equipment, and others that contribute to the overall water efficient theme. (2) Information shall be provided about designing, installing, managing, and maintaining water efficient landscapes. Note: Authority Cited: Section 65595, Government Code. Reference: Section 65596, Government Code. 17
193 Appendix E Environmental Review. (a) The local agency must comply with the California Environmental Quality Act (CEQA), as appropriate. Note: Authority cited: Section 21082, Public Resources Code. Reference: Sections 21080, 21082, Public Resources Code Provisions for Existing Landscapes. (a) A local agency may designate another agency, such as a water purveyor, to implement some or all of the requirements contained in this ordinance. Local agencies may collaborate with water purveyors to define each entity s specific responsibilities relating to this ordinance. Note: Authority Cited: Section 65595, Government Code. Reference: Section 65596, Government Code Irrigation Audit, Irrigation Survey, and Irrigation Water Use Analysis. (a) This section, 493.1, shall apply to all existing landscapes that were installed before January 1, 2010 and are over one acre in size. (1) For all landscapes in 493.1(a) that have a water meter, the local agency shall administer programs that may include, but not be limited to, irrigation water use analyses, irrigation surveys, and irrigation audits to evaluate water use and provide recommendations as necessary to reduce landscape water use to a level that does not exceed the Maximum Applied Water Allowance for existing landscapes. The Maximum Applied Water Allowance for existing landscapes shall be calculated as: MAWA = (0.8) (ETo)(LA)(0.62). (2) For all landscapes in 493.1(a), that do not have a meter, the local agency shall administer programs that may include, but not be limited to, irrigation surveys and irrigation audits to evaluate water use and provide recommendations as necessary in order to prevent water waste. (b) All landscape irrigation audits shall be conducted by a certified landscape irrigation auditor. Note: Authority Cited: Section 65595, Government Code. Reference: Section 65596, Government Code Water Waste Prevention. (a) Local agencies shall prevent water waste resulting from inefficient landscape irrigation by prohibiting runoff from leaving the target landscape due to low head drainage, overspray, or other similar conditions where water flows onto adjacent property, non-irrigated areas, walks, roadways, parking lots, or structures. Penalties for violation of these prohibitions shall be established locally. (b) Restrictions regarding overspray and runoff may be modified if: (1) the landscape area is adjacent to permeable surfacing and no runoff occurs; or (2) the adjacent non-permeable surfaces are designed and constructed to drain entirely to landscaping. Note: Authority cited: Section 65594, Government Code. Reference: Section 65596, Government Code Effective Precipitation. (a) A local agency may consider Effective Precipitation (25% of annual precipitation) in tracking water use and may use the following equation to calculate Maximum Applied Water Allowance: MAWA= (ETo - Eppt) (0.62) [(0.7 x LA) + (0.3 x SLA)]. Note: Authority Cited: Section 65595, Government Code. Reference: Section 65596, Government Code. 18
194 Appendix E Appendices. Appendix A. Reference Evapotranspiration (ETo) Table. 19
195 Appendix E Appendix A - Reference Evapotranspiration (ETo) Table* County and City Jan Feb Mar Apr May Jun Jul Aug Sep Oct Nov Dec Annual ETo ALAMEDA Fremont Livermore Oakland Oakland Foothills Pleasanton Union City ALPINE Markleeville AMADOR Jackson Shanandoah Valley BUTTE Chico Durham Gridley Oroville CALAVERAS San Andreas COLUSA Colusa Williams CONTRA COSTA Benicia Brentwood Concord Courtland Martinez Moraga Pittsburg Walnut Creek DEL NORTE Crescent City EL DORADO Camino FRESNO Clovis Coalinga Firebaugh FivePoints Fresno Fresno State Friant Kerman Kingsburg Mendota Orange Cove Panoche Parlier Reedley Westlands
196 Appendix E Appendix A - Reference Evapotranspiration (ETo) Table* County and City Jan Feb Mar Apr May Jun Jul Aug Sep Oct Nov Dec Annual ETo GLENN Orland Willows HUMBOLDT Eureka Ferndale Garberville Hoopa IMPERIAL Brawley Calipatria/Mulberry El Centro Holtville Meloland Palo Verde II Seeley Westmoreland Yuma INYO Bishop Death Valley Jct Independence Lower Haiwee Res Oasis KERN Arvin Bakersfield Bakersfield/Bonanza Bakersfield/Greenlee Belridge Blackwells Corner Buttonwillow China Lake Delano Famoso Grapevine Inyokern Isabella Dam Lamont Lost Hills McFarland/Kern Shafter Taft Tehachapi KINGS Caruthers Corcoran Hanford Kettleman Lemoore Stratford
197 Appendix E Appendix A - Reference Evapotranspiration (ETo) Table* County and City Jan Feb Mar Apr May Jun Jul Aug Sep Oct Nov Dec Annual ETo LAKE Lakeport Lower Lake LASSEN Buntingville Ravendale Susanville LOS ANGELES Burbank Claremont El Dorado Glendale Glendora Gorman Hollywood Hills Lancaster Long Beach Los Angeles Monrovia Palmdale Pasadena Pearblossom Pomona Redondo Beach San Fernando Santa Clarita Santa Monica MADERA Chowchilla Madera Raymond MARIN Black Point Novato Point San Pedro San Rafael MARIPOSA Coulterville Mariposa Yosemite Village MENDOCINO Fort Bragg Hopland Point Arena Sanel Valley Ukiah MERCED Kesterson Los Banos Merced
198 Appendix E Appendix A - Reference Evapotranspiration (ETo) Table* County and City Jan Feb Mar Apr May Jun Jul Aug Sep Oct Nov Dec Annual ETo MODOC Modoc/Alturas MONO Bridgeport MONTEREY Arroyo Seco Castroville Gonzales Greenfield King City King City-Oasis Rd Long Valley Monterey Pajaro Salinas Salinas North San Ardo San Juan Soledad NAPA Angwin Carneros Oakville St Helena Yountville NEVADA Grass Valley Nevada City ORANGE Irvine Laguna Beach Santa Ana PLACER Auburn Blue Canyon Colfax Roseville Soda Springs Tahoe City Truckee PLUMAS Portola Quincy RIVERSIDE Beaumont Blythe Cathedral City Coachella Desert Center Elsinore Indio
199 Appendix E Appendix A - Reference Evapotranspiration (ETo) Table* County and City Jan Feb Mar Apr May Jun Jul Aug Sep Oct Nov Dec Annual ETo RIVERSIDE La Quinta Mecca Oasis Palm Deser Palm Springs Rancho California Rancho Mirage Ripley Salton Sea North Temecula East II Thermal Riverside UC Winchester SACRAMENTO Fair Oaks Sacramento Twitchell Island SAN BENITO Hollister San Benito San Juan Valley SAN BERNARDINO Baker Barstow NE Big Bear Lake Chino Crestline Lake Arrowhead Lucerne Valley Needles Newberry Springs San Bernardino Twentynine Palms Victorville SAN DIEGO Chula Vista Escondido SPV Miramar Oceanside Otay Lake Pine Valley Ramona San Diego Santee Torrey Pines Warner Springs SAN FRANCISCO San Francisco SAN JOAQUIN Farmington
200 Appendix E Appendix A - Reference Evapotranspiration (ETo) Table* County and City Jan Feb Mar Apr May Jun Jul Aug Sep Oct Nov Dec Annual ETo SAN JOAQUIN Lodi West Manteca Stockton Tracy SAN LUIS OBISPO Arroyo Grande Atascadero Morro Bay Nipomo Paso Robles San Luis Obispo San Miguel San Simeon SAN MATEO Hal Moon Bay Redwood City Woodside SANTA BARBARA Betteravia Carpenteria Cuyama Goleta Goleta Foothills Guadalupe Lompoc Los Alamos Santa Barbara Santa Maria Santa Ynez Sisquoc Solvang SANTA CLARA Gilroy Los Gatos Morgan Hill Palo Alto San Jose SANTA CRUZ De Laveaga Green Valley Rd Santa Cruz Watsonville Webb SHASTA Burney Fall River Mills Glenburn McArthur Redding
201 Appendix E Appendix A - Reference Evapotranspiration (ETo) Table* County and City Jan Feb Mar Apr May Jun Jul Aug Sep Oct Nov Dec Annual ETo SIERRA Downieville Sierraville SISKIYOU Happy Camp MacDoel Mt Shasta Tule lake FS Weed Yreka SOLANO Dixon Fairfield Hastings Tract Putah Creek Rio Vista Suisun Valley Winters SONOMA Bennett Valley Cloverdale Fort Ross Healdsburg Lincoln Petaluma Santa Rosa Valley of the Moon Windsor STANISLAUS Denair La Grange Modesto Newman Oakdale Patterson Turlock SUTTER Nicolaus Yuba City TEHAMA Corning Gerber Gerber Dryland Red Bluff TRINITY Hay Fork Weaverville TULARE Alpaugh Badger Delano
202 Appendix E Appendix A - Reference Evapotranspiration (ETo) Table* County and City Jan Feb Mar Apr May Jun Jul Aug Sep Oct Nov Dec Annual ETo TULARE Dinuba Lindcove Porterville Visalia TUOLUMNE Groveland Sonora VENTURA Camarillo Oxnard Piru Port Hueneme Thousand Oaks Ventura YOLO Bryte Davis Esparto Winters Woodland Zamora YUBA Browns Valley Brownsville * The values in this table were derived from: 1) California Irrigation Management Information System (CIMIS); 2) Reference EvapoTranspiration Zones Map, UC Dept. of Land, Air & Water Resources and California Dept of Water Resources 1999; and 3) Reference Evapotranspiration for California, University of California, Department of Agriculture and Natural Resources (1987) Bulletin 1922, 4) Determining Daily Reference Evapotranspiration, Cooperative Extension UC Division of Agriculture and Natural Resources (1987), Publication Leaflet
203 Appendix E Appendix B Sample Water Efficient Landscape Worksheet. WATER EFFICIENT LANDSCAPE WORKSHEET This worksheet is filled out by the project applicant and it is a required element of the Landscape Documentation Package. Please complete all sections (A and B) of the worksheet. SECTION A. HYDROZONE INFORMATION TABLE Please complete the hydrozone table(s) for each hydrozone. Use as many tables as necessary to provide the square footage of landscape area per hydrozone. Hydrozone* Zone or Valve Irrigation Method** Area (Sq. Ft.) % of Landscape Area Total 100% * Hydrozone HW = High Water Use Plants MW = Moderate Water Use Plants LW = Low Water Use Plants **Irrigation Method MS = Micro-spray S = Spray R = Rotor B= Bubbler D= Drip O = Other 28
204 Appendix E SECTION B. WATER BUDGET CALCULATIONS Section B1. Maximum Applied Water Allowance (MAWA) The project's Maximum Applied Water Allowance shall be calculated using this equation: MAWA = (ETo) (0.62) [(0.7 x LA) + (0.3 x SLA)] where: MAWA = Maximum Applied Water Allowance (gallons per year) ETo = Reference Evapotranspiration from Appendix A (inches per year) 0.7 = ET Adjustment Factor (ETAF) LA = Landscaped Area includes Special Landscape Area (square feet) 0.62 = Conversion factor (to gallons per square foot) SLA = Portion of the landscape area identified as Special Landscape Area (square feet) 0.3 = the additional ET Adjustment Factor for Special Landscape Area ( = 0.3) Maximum Applied Water Allowance = gallons per year Show calculations. Effective Precipitation (Eppt) If considering Effective Precipitation, use 25% of annual precipitation. Use the following equation to calculate Maximum Applied Water Allowance: MAWA= (ETo Eppt) (0.62) [(0.7 x LA) + (0.3 x SLA)] Maximum Applied Water Allowance = gallons per year Show calculations. 29
205 Appendix E Section B2. Estimated Total Water Use (ETWU) The project s Estimated Total Water Use is calculated using the following formula: PF x HA ETWU = ( ETo)(0.62) + SLA IE where: ETWU = Estimated total water use per year (gallons per year) ETo = Reference Evapotranspiration (inches per year) PF = Plant Factor from WUCOLS (see Definitions) HA = Hydrozone Area [high, medium, and low water use areas] (square feet) SLA = Special Landscape Area (square feet) 0.62 = Conversion Factor (to gallons per square foot) IE = Irrigation Efficiency (minimum 0.71) Hydrozone Table for Calculating ETWU Please complete the hydrozone table(s). Use as many tables as necessary. Hydrozone Plant Water Use Type(s) Plant Factor (PF) Area (HA) (square feet) PF x HA (square feet) Sum SLA Estimated Total Water Use = gallons Show calculations. 30
206 Appendix E Appendix C Sample Certificate of Completion. CERTIFICATE OF COMPLETION This certificate is filled out by the project applicant upon completion of the landscape project. Date PART 1. PROJECT INFORMATION SHEET Project Name Name of Project Applicant Telephone No. Fax No. Title Company Address Street Address City State Zip Code Project Address and Location: Street Address City Parcel, tract or lot number, if available. Latitude/Longitude (optional) State Zip Code Property Owner or his/her designee: Name Telephone No. Fax No. Title Company Address Street Address City State Zip Code Property Owner I/we certify that I/we have received copies of all the documents within the Landscape Documentation Package and the Certificate of Completion and that it is our responsibility to see that the project is maintained in accordance with the Landscape and Irrigation Maintenance Schedule. Property Owner Signature Date Please answer the questions below: 1. Date the Landscape Documentation Package was submitted to the local agency 2. Date the Landscape Documentation Package was approved by the local agency 3. Date that a copy of the Water Efficient Landscape Worksheet (including the Water Budget Calculation) was submitted to the local water purveyor 31
207 Appendix E PART 2. CERTIFICATION OF INSTALLATION ACCORDING TO THE LANDSCAPE DOCUMENTATION PACKAGE I/we certify that based upon periodic site observations, the work has been substantially completed in accordance with the ordinance and that the landscape planting and irrigation installation conform with the criteria and specifications of the approved Landscape Documentation Package. Signature* Date Name (print) Telephone No. Fax No. Title Address License No. or Certification No. Company Street Address City State Zip Code *Signer of the landscape design plan, signer of the irrigation plan, or a licensed landscape contractor. PART 3. IRRIGATION SCHEDULING Attach parameters for setting the irrigation schedule on controller per ordinance Section PART 4. SCHEDULE OF LANDSCAPE AND IRRIGATION MAINTENANCE Attach schedule of Landscape and Irrigation Maintenance per ordinance Section PART 5. LANDSCAPE IRRIGATION AUDIT REPORT Attach Landscape Irrigation Audit Report per ordinance Section PART 6. SOIL MANAGEMENT REPORT Attach soil analysis report, if not previously submitted with the Landscape Documentation Package per ordinance Section Attach documentation verifying implementation of recommendations from soil analysis report per ordinance Section
208 Appendix E Assembly Bill No CHAPTER 559 An act to add Section to the Civil Code, to repeal and add Article 10.8 (commencing with Section 65591) of Chapter 3 of Division 1 of Title 7 of the Government Code, to add Section to the Public Resources Code, and to add Article 4.5 (commencing with Section 535) to Chapter 8 of Division 1 of the Water Code, relating to water conservation. [Approved by Governor September 28, Filed with Secretary of State September 28, 2006.] legislative counsel s digest AB 1881, Laird. Water conservation. (1) Existing law, the Davis-Sterling Common Interest Development Act, defines and regulates common interest developments, which include community apartment projects, condominium projects, planned developments, and stock cooperatives. This bill would provide that the architectural guidelines of a common interest development shall not prohibit or include conditions that have the effect of prohibiting the use of low water-using plants as a group. (2) The Water Conservation in Landscaping Act requires the Department of Water Resources to appoint an advisory task force to work with the department to draft a model local water efficient landscape ordinance that local agencies may adopt, requires the task force to submit the ordinance to the department on or before May 1, 1991, and requires the task force to cease to exist on the date the department adopts the model ordinance or January 1, 1992, whichever occurs first. The act requires the department, not later than January 1, 1992, to adopt a model local water efficient landscape ordinance which each local agency may adopt. The act makes the model local water efficient landscape ordinance adopted by the department applicable within the jurisdiction of a local agency if that local agency, by January 1, 1993, has not adopted a water efficient landscape ordinance or has not adopted certain findings that the adoption of the ordinance is unnecessary. This bill would specify that the provision making the model ordinance applicable to a local agency on and after January 1, 1993, does not apply to chartered cities. The bill would require the department, to the extent funds are appropriated, not later than January 1, 2009, by regulation, to update the model ordinance in accordance with specified requirements. The bill would require the department to prepare and submit to the Legislature a prescribed report before the adoption of the updated model ordinance. The bill would require a local agency, not later than January 1, 2010, to adopt the updated model ordinance or other water efficient 92
209 Appendix E Ch landscape ordinance that is at least as effective in conserving water as the updated model ordinance. The bill would make the updated model ordinance applicable within the jurisdiction of a local agency, including a chartered city, if, by January 1, 2010, the local agency has not adopted its own water efficient landscape ordinance or the updated model ordinance. The bill would require each local agency, not later than January 31, 2010, to notify the department as to whether the local agency is subject to the department s updated model ordinance and, if not, to submit to the department a copy of the water efficient landscape ordinance adopted by the local agency, among other documents. The bill would require the department, to the extent funds are appropriated, not later than January 31, 2011, to prepare and submit a report to the Legislature relating to the status of water efficient landscape ordinances adopted by local agencies. By imposing requirements on local agencies in connection with the adoption of water efficient landscape ordinances, the bill would impose a state-mandated local program. (3) Existing law requires the State Energy Resources Conservation and Development Commission (Energy Commission), after one or more public hearings, to take specified action to reduce the wasteful, uneconomic, inefficient, or unnecessary consumption of energy. Existing law requires the Energy Commission, by January 1, 2004, to amend specified regulations to require that residential clothes washers manufactured on or after January 1, 2007, be at least as water efficient as commercial clothes washers, and to take certain other related action. This bill would require the Energy Commission, in consultation with the department, to adopt, to the extent funds are available, by regulation performance standards and labeling requirements for landscape irrigation equipment, including irrigation controllers, moisture sensors, emission devices, and valves to reduce the wasteful, uneconomic, inefficient, or unnecessary consumption of energy or water. The bill would require the Energy Commission to adopt those requirements for landscape irrigation controllers and moisture sensors by January 1, 2010, and, on and after January 1, 2012, would prohibit the sale or installation of an irrigation controller or moisture sensor for landscape use unless the controller or sensor meets those adopted requirements. The bill would require the Energy Commission, on or before January 1, 2010, to prepare and submit to the Legislature a report that sets forth a proposed schedule for adopting performance standards and labeling requirements for emission devices and valves. (4) Existing law generally requires an urban water supplier to install water meters on all municipal and industrial service connections located within its service area on or before January 1, This bill would require a water purveyor as defined, to require as a condition of new retail water service on and after January 1, 2008, the installation of separate water meters to measure the volume of water used exclusively for landscape purposes. The bill would make this requirement applicable to specified service connections. 92
210 Appendix E 3 Ch. 559 (5) The California Constitution requires the state to reimburse local agencies and school districts for certain costs mandated by the state. Statutory provisions establish procedures for making that reimbursement. This bill would provide that, if the Commission on State Mandates determines that the bill contains costs mandated by the state, reimbursement for those costs shall be made pursuant to these statutory provisions. The people of the State of California do enact as follows: SECTION 1. Section is added to the Civil Code, to read: The architectural guidelines of a common interest development shall not prohibit or include conditions that have the effect of prohibiting the use of low water-using plants as a group. SEC. 2. Article 10.8 (commencing with Section 65591) of Chapter 3 of Division 1 of Title 7 of the Government Code is repealed. SEC. 3. Article 10.8 (commencing with Section 65591) is added to Chapter 3 of Division 1 of Title 7 of the Government Code, to read: Article Water Conservation in Landscaping This article shall be known and may be cited as the Water Conservation in Landscaping Act Unless the context requires otherwise, the following definitions govern the construction of this article: (a) Department means the Department of Water Resources. (b) Local agency means any city, county, or city and county, including a charter city or charter county. (c) Water efficient landscape ordinance means an ordinance or resolution adopted by a local agency, or prepared by the department, to address the efficient use of water in landscaping The Legislature finds and declares all of the following: (a) The waters of the state are of limited supply and are subject to ever increasing demands. (b) The continuation of California s economic prosperity is dependent on adequate supplies of water being available for future uses. (c) It is the policy of the state to promote the conservation and efficient use of water and to prevent the waste of this valuable resource. (d) Landscapes are essential to the quality of life in California by providing areas for active and passive recreation and as an enhancement to the environment by cleaning air and water, preventing erosion, offering fire protection, and replacing ecosystems lost to development. (e) Landscape design, installation, maintenance, and management can and should be water efficient. (f) Section 2 of Article X of the California Constitution specifies that the right to use water is limited to the amount reasonably required for the 92
211 Appendix E Ch beneficial use to be served and the right does not and shall not extend to waste or unreasonable use or unreasonable method of use. (g) (1) The Legislature, pursuant to Chapter 682 of the Statutes of 2004, requested the California Urban Water Conservation Council to convene a stakeholders work group to develop recommendations for improving the efficiency of water use in urban irrigated landscapes. (2) The work group report includes a recommendation to update the model water efficient landscape ordinance adopted by the department pursuant to Chapter 1145 of the Statutes of (3) It is the intent of the Legislature that the department promote the use of this updated model ordinance. (h) Notwithstanding Article 13 (commencing with Section 65700), this article addresses a matter that is of statewide concern and is not a municipal affair as that term is used in Section 5 of Article XI of the California Constitution. Accordingly, it is the intent of the Legislature that this article, except as provided in Section 65594, apply to all cities and counties, including charter cities and charter counties (a) Except as provided in Section 65595, if by January 1, 1993, a local agency did not adopt a water efficient landscape ordinance and did not adopt findings based on climatic, geological, or topographical conditions, or water availability that state that a water efficient landscape ordinance is unnecessary, the model water efficient landscape ordinance adopted by the department pursuant to Chapter 1145 of the Statutes of 1990 shall apply within the jurisdiction of the local agency as of that date, shall be enforced by the local agency, and shall have the same force and effect as if adopted by the local agency. (b) Notwithstanding subdivision (b) of Section 65592, subdivision (a) does not apply to chartered cities. (c) This section shall apply only until the department updates the model ordinance (a) (1) To the extent funds are appropriated, not later than January 1, 2009, by regulation, the department shall update the model water efficient landscape ordinance adopted pursuant to Chapter 1145 of the Statutes of 1990, after holding one or more public hearings. The updated model ordinance shall be based on the recommendations set forth in the report prepared pursuant to Chapter 682 of the Statutes of 2004 and shall meet the requirements of Section (2) Before the adoption of the updated model ordinance pursuant to paragraph (1), the department shall prepare and submit to the Legislature a report relating to both of the following: (A) The extent to which local agencies have complied with the model water efficient landscape ordinance adopted pursuant to Chapter 1145 of the Statutes of (B) The department s recommendations regarding the landscape water budget component of the updated model ordinance described in subdivision (b) of Section
212 Appendix E 5 Ch. 559 (b) Not later than January 31, 2009, the department shall distribute the updated model ordinance adopted pursuant to subdivision (a) to all local agencies and other interested parties. (c) On or before January 1, 2010, a local agency shall adopt one of the following: (1) A water efficient landscape ordinance that is, based on evidence in the record, at least as effective in conserving water as the updated model ordinance adopted by the department pursuant to subdivision (a). (2) The updated model ordinance described in paragraph (1). (d) If the local agency has not adopted, on or before January 1, 2010, a water efficient landscape ordinance pursuant to subdivision (c), the updated model ordinance adopted by the department pursuant to subdivision (a) shall apply within the jurisdiction of the local agency as of that date, shall be enforced by the local agency, and shall have the same force and effect as if adopted by the local agency. (e) Nothing in this article shall be construed to require the local agency s water efficient landscape ordinance to duplicate, or to conflict with, a water efficiency program or measure implemented by a public water system, as defined in Section of the Health and Safety Code, within the jurisdictional boundaries of the local agency The updated model ordinance adopted pursuant to Section shall do all the following in order to reduce water use: (a) Include provisions for water conservation and the appropriate use and groupings of plants that are well-adapted to particular sites and to particular climatic, soil, or topographic conditions. The model ordinance shall not prohibit or require specific plant species, but it may include conditions for the use of plant species or encourage water conserving plants. However, the model ordinance shall not include conditions that have the effect of prohibiting or requiring specific plant species. (b) Include a landscape water budget component that establishes the maximum amount of water to be applied through the irrigation system, based on climate, landscape size, irrigation efficiency, and plant needs. (c) Promote the benefits of consistent local ordinances in neighboring areas. (d) Encourage the capture and retention of stormwater onsite to improve water use efficiency or water quality. (e) Include provisions for the use of automatic irrigation systems and irrigation schedules based on climatic conditions, specific terrains and soil types, and other environmental conditions. The model ordinance shall include references to local, state, and federal laws and regulations regarding standards for water-conserving irrigation equipment. The model ordinance may include climate information for irrigation scheduling based on the California Irrigation Management Information System. (f) Include provisions for onsite soil assessment and soil management plans that include grading and drainage to promote healthy plant growth and to prevent excessive erosion and runoff, and the use of mulches in shrub areas, garden beds, and landscaped areas where appropriate. 92
213 Appendix E Ch (g) Promote the use of recycled water consistent with Article 4 (commencing with Section 13520) of Chapter 7 of Division 7 of the Water Code. (h) Seek to educate water users on the efficient use of water and the benefits of doing so. (i) Address regional differences, including fire prevention needs. (j) Exempt landscaping that is part of a registered historical site. (k) Encourage the use of economic incentives to promote the efficient use of water. (l) Include provisions for landscape maintenance practices that foster long-term landscape water conservation. Landscape maintenance practices may include, but are not limited to, performing routine irrigation system repair and adjustments, conducting water audits, and prescribing the amount of water applied per landscaped acre. (m) Include provisions to minimize landscape irrigation overspray and runoff Not later than January 31, 2010, each local agency shall notify the department as to whether the local agency is subject to the department s updated model ordinance adopted pursuant to Section 65595, and if not, shall submit to the department a copy of the water efficient landscape ordinance adopted by the local agency, and a copy of the local agency s findings and evidence in the record that its water efficient landscape ordinance is at least as effective in conserving water as the department s updated model ordinance. Not later than January 31, 2011, the department shall, to the extent funds are appropriated, prepare and submit a report to the Legislature summarizing the status of water efficient landscape ordinances adopted by local agencies Any model ordinance adopted pursuant to this article shall exempt cemeteries from all provisions of the ordinance except those set forth in subdivisions (h), (k), and (l) of Section In adopting language specific to cemeteries, the department shall recognize the special landscape management needs of cemeteries Any actions or proceedings to attach, review, set aside, void, or annul the act, decision, or findings of a local agency on the ground of noncompliance with this article shall be brought pursuant to Section 1085 of the Code of Civil Procedure. SEC. 4. Section is added to the Public Resources Code, to read: (a) To the extent that funds are available, the commission, in consultation with the Department of Water Resources, shall adopt by regulation, after holding one or more public hearings, performance standards and labeling requirements for landscape irrigation equipment, including, but not limited to, irrigation controllers, moisture sensors, emission devices, and valves, for the purpose of reducing the wasteful, uneconomic, inefficient, or unnecessary consumption of energy or water. (b) For the purposes of complying with subdivision (a), the commission shall do all of the following: 92
214 Appendix E 7 Ch. 559 (1) Adopt performance standards and labeling requirements for landscape irrigation controllers and moisture sensors on or before January 1, (2) Consider the Irrigation Association s Smart Water Application Technology Program testing protocols when adopting performance standards for landscape irrigation equipment, including, but not limited to, irrigation controllers, moisture sensors, emission devices, and valves. (3) Prepare and submit a report to the Legislature, on or before January 1, 2010, that sets forth on a proposed schedule for adopting performance standards and labeling requirements for emission devices and valves. (c) On and after January 1, 2012, an irrigation controller or moisture sensor for landscape irrigation uses may not be sold or installed in the state unless the controller or sensor meets the performance standards and labeling requirements established pursuant to this section. SEC. 5. Article 4.5 (commencing with Section 535) is added to Chapter 8 of Division 1 of the Water Code, to read: Article 4.5. Irrigated Landscape 535. (a) A water purveyor shall require as a condition of new retail water service on and after January 1, 2008, the installation of separate water meters to measure the volume of water used exclusively for landscape purposes. (b) Subdivision (a) does not apply to either of the following: (1) Single-family residential connections. (2) Connections used to supply water for the commercial production of agricultural crops or livestock. (c) Subdivision (a) applies only to a service connection for which both of the following apply: (1) The connection serves property with more than 5,000 square feet of irrigated landscape. (2) The connection is supplied by a water purveyor that serves 15 or more service connections. (d) For the purposes of this section, new retail water service means the installation of a new water meter where water service has not been previously provided, and does not include applications for new water service submitted before January 1, SEC. 6. If the Commission on State Mandates determines that this act contains costs mandated by the state, reimbursement to local agencies and school districts for those costs shall be made pursuant to Part 7 (commencing with Section 17500) of Division 4 of Title 2 of the Government Code. O 92
215 City of Dinuba 2015 Urban Water Management Plan Appendix F Plan Submittal Public Access Submittal to DWR Submittal to County and City Submittal to State Library
216 This page is intentionally left blank.
217
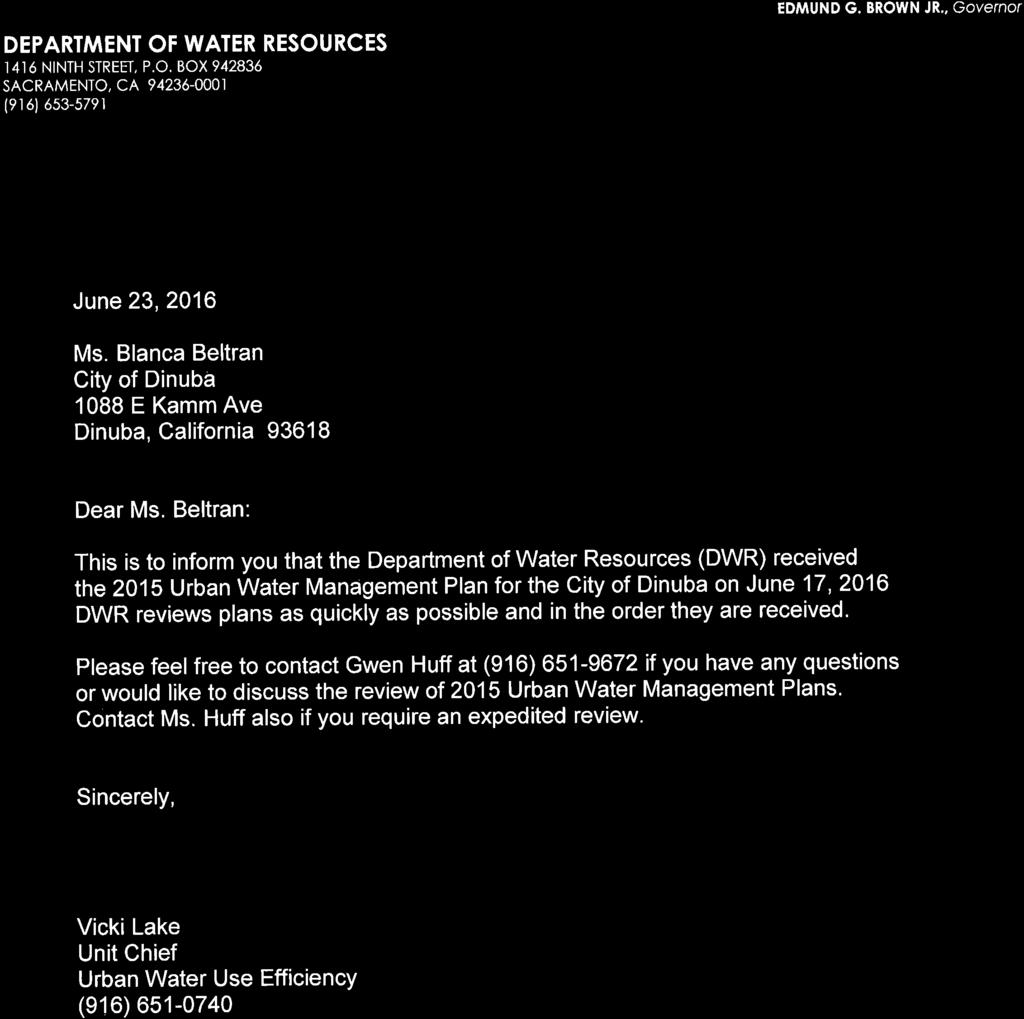
218
219 Keasha Blew From: Sent: To: Cc: Subject: Keasha Blew Thursday, July 14, :18 PM 'Blanca Beltran'; Owen Kubit; Michael Osborn Final City of Dinuba Urban Water Management Plan electronic copy Good afternoon, Provost and Pritchard is pleased to present the Final Urban Water Management Plan for the City of Dinuba. Please follow the link below to access and download the document. There is also an electronic copy available on the City of Dinuba Website If you should have any additional questions or comments please contact Owen Kubit at (559) Thank you, Keasha Blew Provost & Pritchard Consulting Group 2505 Alluvial Avenue Clovis, CA Phone: (559) Cell: (209) Fax: (559) website: 1

220 2505 Alluvial Avenue Clovis, CA Tel: (559) Fax: (559) To: Address: California State Library Attn: Coordinator, Urban Water Management Plans Government Publications Section PO Box Sacramento, CA Letter of Transmittal Date: 7/21/2016 Job. No.: Subject: City of Dinuba 2015 Urban Water Management Plan We are sending you the attached: Prints/Maps Plans Specifications Report(s) Copy of Letter Other: Delivered via: U.S. Mail Courier Service OnTrac UPS/FedEx Other: Item Date Quantity Description CD 7/21/ City of Dinuba 2015 Urban Water Management Plan CD- Rom These are transmitted as checked below: For approval For your use As requested For review and comment Other: For State Library Publication Materials returned after loan to us Remarks: Included is one CD-Rom set of the City of Dinuba 2015 Urban Water Management Plan Update for the California State Library, Government Publications Section. This submittal is in accordance with the CWC 10644(a)(1). Copy To: Blanca Beltran, Public Works Director, City of Dinuba Signed: Keasha Blew If enclosures are not as noted, kindly notify us at once. Document3 Engineering Surveying Planning Environmental GIS Construction Services Hydrogeology Consulting Fresno Bakersfield Visalia Clovis Modesto Los Banos Chico
California Water Service Urban Water Management Plan. Antelope Valley District June Quality. Service. Value. Quality. Service. Value.
 2015 Urban Water Management Plan June 2016 Quality. Service. Value. Quality. Service. Value Table of Contents List of Tables... 5 List of Figures... 7 List of Acronyms... 8 Chapter 1 Introduction and
2015 Urban Water Management Plan for Mojave Water Agency
 Courtesy: Google Earth FINAL 2015 Urban Water Management Plan for Mojave Water Agency Prepared by Kennedy/Jenks Consultants June 2016 300 North Lake Avenue, Suite 1020 Pasadena, California 91101 626-568-4300
2015 URBAN WATER MANAGEMENT PLAN Final Report
 PREPARED FOR Coachella Valley Water District 2015 URBAN WATER MANAGEMENT PLAN Final Report July 1, 2016 This page left intentionally blank TABLE OF CONTENTS Section 1 Introduction and Overview... 1-1 1.1
California Water Service Urban Water Management Plan. Bakersfield District June Quality. Service. Value
 2015 Urban Water Management Plan June 2016 Quality. Service. Value Table of Contents List of Tables... 7 List of Figures... 9 List of Acronyms... 10 Chapter 1 Introduction and Overview... 11 1.1 Background
Section 3 - Land Use, Population, and Water Demands. Section 3
 Section 3 - Land Use, Population, and Water Demands Section 3 SECTION 3 DEMANDS LAND USE, POPULATION, AND WATER This section describes the existing water demands, the population projections, and the projected
Cost Sharing Agreement For The Los Vaqueros Reservoir Expansion Project Planning. ACWD Board Meeting December 8, 2016
 Cost Sharing Agreement For The Los Vaqueros Reservoir Expansion Project Planning ACWD Board Meeting December 8, 2016 Los Vaqueros Reservoir (LV) Owned and operated by CCWD Off-stream reservoir, adjacent
SECTION 7: DEMAND MANAGEMENT MEASURES
 SECTION 7: DEMAND MANAGEMENT MEASURES 7.1 DOCUMENT REQUIREMENTS 7.1.1 UWMP Requirements This section will include the following: Describe how each water demand management measures are being implemented
MONTE VISTA WATER DISTRICT 2015 URBAN WATER MANAGEMENT PLAN
 MONTE VISTA WATER DISTRICT 2015 URBAN WATER MANAGEMENT PLAN PUBLIC REVIEW DRAFT MAY 2016 Prepared by Monte Vista Water District Staff: General Manager Public Affairs Director/ Water Use Efficiency Practitioner
5.11 UTILITIES WATER SUPPLY
 5.11 UTILITIES WATER SUPPLY 5.11.1 INTRODUCTION The purpose of the Water Supply section is to assess the proposed project s potential impact on available water supply and infrastructure. The analysis in
4.2 Step 2 Profile of Water Demands and Historical Demand Management
 4.2 Step 2 Profile of Water Demands and Historical Demand Management Step 2 involves an overview of the historical water demand trends as well as the influence of historical water demand management on
ARIZONA CONSERVATION REQUIREMENTS. Management Plans MUNICIPAL CONSERVATION REQUIREMENTS
 ARIZONA CONSERVATION REQUIREMENTS Management Plans The Arizona Groundwater Management Code establishes the legal framework for conserving water in Arizona's most populous areas. To help achieve its goals,
The following words and terms shall have the following meanings unless the context indicates otherwise:
 SUBCHAPTER 6. WATER SUPPLY MANAGEMENT ACT RULES 7:19-6.1 Scope and Authority (a) The Statewide Water Supply Master Plan represents the planning mechanism by which the State approaches its water needs.
2005 Urban Water Management Plan
 2005 Urban Water Management Plan Long Beach Board of Water Commissioners Frank Clarke, President William B. Townsend, Vice-President Stephen T. Conley, Member Helen Z. Hansen, Member Kevin L. Wattier,
National Water Demand Management Policy
 National Water Demand Management Policy Introduction In 1997, the Ministry of Water and Irrigation developed Jordan s Water Strategy and the following four policies, which include: Water Utility Policy;
Marin Municipal Water District 2015 Urban Water Management Plan Water Demand Analysis and Water Conservation Measures Update FINAL
 2015 Urban Water Management Plan Water Demand Analysis and Water Conservation Measures Update FINAL July 1, 2015 TABLE OF CONTENTS LIST OF FIGURES...4 LIST OF TABLES...4 LIST OF ACRONYMS...5 EXECUTIVE
Subsequent to these early efforts, the complexities associated with potable water provision have increased significantly.
 10.1 INTRODUCTION The reliable supply, treatment and distribution of potable water is vital to the health, safety and welfare of urban areas. The citizens and officials of the have long been involved with
POTABLE WATER ELEMENT
 Goal 4.0. Provide current and future residents of the County's utility service areas, and large users of the regional raw water system a cost-effective and equitable potable or raw water supply system
City of San Diego Pure Water Project October 2014
 City of San Diego Pure Water Project October 2014 SDCTA Position: SUPPORT Rationale for Position: Substantial study has demonstrated a potable reuse project within the City of San Diego would be safe,
SPECIAL BOARD OF DIRECTORS MEETING. 1:00 p.m.
 4677 Overland Avenue San Diego, California 92123 SPECIAL BOARD OF DIRECTORS MEETING Board Room February 13, 2014 1:00 p.m. 1. Call to order. 2. Roll call Determination of a quorum. A. Report on proxies
Issue paper: Aquifer Water Balance
 Issue paper: Aquifer Water Balance 1. Introduction And Background 1.1. Purpose and Scope The population in Kitsap County has grown rapidly in recent years and is expected to increase substantially in the
Argyle Water Supply Corporation WATER CONSERVATION AND DROUGHT CONTINGENCY PLAN May 2007
 Argyle Water Supply Corporation WATER CONSERVATION AND DROUGHT CONTINGENCY PLAN May 2007 1. INTRODUCTION AND OBJECTIVES Water supply has always been a key issue in the development of Texas. In recent years,
Final Report. Water Use Accountability
 MWDOC Water Loss Management Program Assessment Final Report Water Use Accountability March 2007 Project 4109-008 Acknowledgements The Project Team appreciates the opportunity afforded it through funding
SQUAW VALLEY PUBLIC SERVICE DISTRICT
 EXHIBIT # F-3 15 pages SQUAW VALLEY PUBLIC SERVICE DISTRICT DATE: June 28, 2016 Sustainable Groundwater Management Act TO: FROM: SUBJECT: District Board Members Dave Hunt, District Engineer Sustainable
ENVIRONMENTAL IMPACT ANALYSIS WATER RESOURCES: WATER SUPPLY 1. ENVIRONMENTAL CONDITIONS. a. Physical Setting. (1) Water Supply
 Water Supply") IV. E.2. ENVIRONMENTAL IMPACT ANALYSIS WATER RESOURCES: WATER SUPPLY 1. ENVIRONMENTAL CONDITIONS a. Physical Setting (1) Water Supply The Los Angeles Department of Water and Power (LADWP) owns, operates,
IV. E.2. ENVIRONMENTAL IMPACT ANALYSIS WATER RESOURCES: WATER SUPPLY 1. ENVIRONMENTAL CONDITIONS a. Physical Setting (1) Water Supply The Los Angeles Department of Water and Power (LADWP) owns, operates,
Date: Wednesday, October 4, Location: Western Municipal Water District Board Room Meridian Parkway, Riverside, 92518
 Date: Wednesday, October 4, 2017 Time: 6 p.m. WESTERN MUNICIPAL WATER DISTRICT NEW DATE SCHEDULED FOR PUBLIC HEARING Proposed Increases in Water Rates and Service Charges Location: Western Municipal Water
Wastewater ENVIRONMENTAL SETTING. Wastewater Collection
 4.15.3.1 ENVIRONMENTAL SETTING Wastewater Collection The City owns, operates, and maintains the local sewer lines that collect wastewater generated within the City. The existing sewer lines include a gravity
Committee on Water. Desalination as a Water Source
 Committee on Water Committee on Water Desalination as a Water Source Water Supply Reliability for San Diego County NARUC Summer Policy Summit July 17, 2017 Bob Yamada Director of Water Resources San Diego
West Placer Groundwater Sustainability Agency Community Meeting February 16, 6 to 8 p.m. McBean Pavilion in Lincoln
 West Placer Groundwater Sustainability Agency Community Meeting February 16, 6 to 8 p.m. McBean Pavilion in Lincoln Community meeting overview The West Placer Groundwater Sustainability Agency held its
ORDINANCE NO. Adopted by the [AGENCY] [DATE] ADOPTING A WATER CONSERVATION PROGRAM
![ORDINANCE NO. Adopted by the [AGENCY] [DATE] ADOPTING A WATER CONSERVATION PROGRAM](/thumbs/71/65960919.jpg "ORDINANCE NO. Adopted by the [AGENCY] [DATE] ADOPTING A WATER CONSERVATION PROGRAM") Page 1 of 5 ORDINANCE NO. Adopted by the [AGENCY] [DATE] ADOPTING A WATER CONSERVATION PROGRAM WHEREAS, article X, section 2 of the California Constitution declares that waters of the State are to be put
Page 1 of 5 ORDINANCE NO. Adopted by the [AGENCY] [DATE] ADOPTING A WATER CONSERVATION PROGRAM WHEREAS, article X, section 2 of the California Constitution declares that waters of the State are to be put
2.1 Summary of Existing and Future Population Estimates
 SECTION 2 Demographics This technical memorandum identifies the uncertainties and describes potential future demographics that might affect wastewater facilities in the City of McCall, Idaho (the City).
Managed Groundwater Recharge to Support Sustainable Water Management. A Sacramento Valley Perspective November 8, 2017
 To advance the economic, social and environmental sustainability of Northern California by enhancing and preserving the water rights, supplies and water quality. Managed Groundwater Recharge to Support
City of Anacortes Utility Rates & Information January 2016
 The City of Anacortes provides water, storm drain, sewer, and solid waste services. City of Anacortes Utility rates are established by ordinance. The City of Anacortes bills monthly minimum charges (base
County of Sonoma Agenda Item Summary Report
 County of Sonoma Agenda Item Summary Report Agenda Item Number: 44 (This Section for use by Clerk of the Board Only.) Clerk of the Board 575 Administration Drive Santa Rosa, CA 95403 To: Board of Directors,
SOUTHERN NEVADA WATER BRIEFING Prepared for the Legislative Commission's Subcommittee to Study Water
 SOUTHERN NEVADA WATER BRIEFING Prepared for the Legislative Commission's Subcommittee to Study Water John J. Entsminger, General Manager Southern Nevada Water Authority EXHIBIT C - WATER Document consists
Castle Pines North Metropolitan District
 Castle Pines North Metropolitan District Water Conservation Plan August 2006. Prepared by: A 1331 17th Street, Suite 1200 Denver, CO 80202 Contents Executive Summary Section 1 Introduction 1.1 Purpose...
Questions and Answers about the Water Supply and Water Quality bond act for the November, 2018 ballot. Updated November 17, 2017
 Questions and Answers about the Water Supply and Water Quality bond act for the November, 2018 ballot. Updated November 17, 2017 What is the need for more State investment in water resources? What is the
County of Sonoma Agenda Item Summary Report
 County of Sonoma Agenda Item Summary Report Agenda Item Number: 20 (This Section for use by Clerk of the Board Only.) Clerk of the Board 575 Administration Drive Santa Rosa, CA 95403 To: Boards of Directors,
VENTURA RIVER WATER DISTRICT (VRWD) Drought Update and Water Rate Changes
 Drought Update and Water Rate Changes") VENTURA RIVER WATER DISTRICT (VRWD) Drought Update and Water Rate Changes July 20, 2016 7:00 P.M. Oak View Community Center The District Must Be Revenue Neutral Background Drought Future Conservation Efforts
VENTURA RIVER WATER DISTRICT (VRWD) Drought Update and Water Rate Changes July 20, 2016 7:00 P.M. Oak View Community Center The District Must Be Revenue Neutral Background Drought Future Conservation Efforts
Water Supply Corporation here by adopts the following regulations and restrictions on the delivery and consumption of water.
 DROUGHT CONTINGENCY PLAN MUSTANG WATER SUPPLY CORPORATION APRIL 17,2000 Section I: Declaration of Policy, Purpose, and Intent In order to conserve the available water supply and protect the integrity of
COMMISSION ACTION FORM SUBJECT: PROPOSED BARILLA URBAN RENEWAL AREA AND TAX INCREMENT FINANCING DISTRICT
 ITEM # 7 DATE 06-21-17 COMMISSION ACTION FORM SUBJECT: PROPOSED BARILLA URBAN RENEWAL AREA AND TAX INCREMENT FINANCING DISTRICT BACKGROUND: At the City Council meeting on February 28, 2017, the City Manager
Colorado River Challenges Impacts to Southern Arizona
 Colorado River Challenges Impacts to Southern Arizona 2 3 4 5 Colorado River Basics 7 States, 2 Nations Annual Flow 15.0 MAF 40 Million People All of the Major Cities in Southwest 5.5m Irrigated Acres
CHAPTER 5 WASTEWATER FLOWS
 CHAPTER 5 WASTEWATER FLOWS 5.1 REGIONAL FACILITIES Regional Water Recycling Plants Figure 5-1 illustrates the service area boundaries for IEUA s four water recycling plants. The four Regional facilities
Section 7 Hydraulic Model Development and Evaluation Criteria
 Section 7 Hydraulic Model Development and Evaluation Criteria The hydraulic evaluation conducted to develop this master plan was performed using a computer model of the reclaimed water distribution system.
U.S. Water Budget. Figure Source:Data from The Nation s Water Resources , Vol. 1, U.S. Water Resources Council.
 U.S. Water Budget Figure 10.18 10-9 Source:Data from The Nation s Water Resources 1975-2000, Vol. 1, U.S. Water Resources Council. Average U.S. Precipitation Figure 10.19 10-10 Source: U.S. Water Resources
Legislative Statistics
 State Legislative Update Texas Water 2011 April 6, 2011 Carol Batterton, Water Environment Association of Texas 82 nd Session Texas Legislature Key Dates November 8, 2010: Pre filing of bills began January
Water Supply Water Quality Water Reuse and Conservation Watershed Management Interagency Coordination
 WATER ELEMENT INTRODUCTION Water is one of the most critical resources for the Merced County economy and for the quality of life of its residents. Both surface water and groundwater supplies are an important
Utility Customer Profile Guide for Water Conservation Planning
 Utility Customer Profile Guide for Water Conservation Planning twri.tamu.edu EM-120 for Water Conservation Planning Texas Water Resources Institute Texas A&M AgriLife Extension Service December 2015 Aubry
Drought Contingency Plan
 for San Jacinto River Authority Highlands Division Prepared by San Jacinto River Authority Adopted: March 27, 2014 This page intentionally left blank. Table of Contents Table of Contents Section Page Section
UrbanSAT- Urban System Analysis Tool : For delivering urban water balancing and reporting
 19th International Congress on Modelling and Simulation, Perth, Australia, 12 16 December 2011 http://mssanz.org.au/modsim2011 UrbanSAT- Urban System Analysis Tool : For delivering urban water balancing
Table 5-1: Availability of Public Sanitary Sewer. Are plans underway to provide Public Sewer?
 CHAPTER 5: PUBLIC SANITARY SEWER AND PRIVATE WASTEWATER DISPOSAL; PUBLIC WATER SERVICE AND PRIVATE WELLS Public Sanitary Sewer The presence or absence of public sanitary sewer service is a major factor
Paso Robles Groundwater Basin Management Plan A Focus on Voluntary Actions to Improve the Sustainability of Our Water Supply
 Paso Robles Groundwater Basin Management Plan A Focus on Voluntary Actions to Improve the Sustainability of Our Water Supply Why Implement a Groundwater Management Plan? Pumping at or near basin annual
RESOLUTION NO RESOLUTION OF THE CITY COUNCIL OF BOULDER CITY, REPEALING AND REPLACING RESOLUTION NO TO INCREASE THE WATER SERVICE CHARGE
 RESOLUTION NO. 6490 RESOLUTION OF THE CITY COUNCIL OF BOULDER CITY, REPEALING AND REPLACING RESOLUTION NO. 6213 TO INCREASE THE WATER SERVICE CHARGE WHEREAS, Chapter 9-8 of the City Codes established regulations
Potable Water Supply, Wastewater & Reuse Element
 Potable Water Supply, Wastewater & Reuse Element GOAL ONE: HIGH QUALITY AND AFFORDABLE POTABLE WATER WILL BE AVAILABLE TO MEET THE EXISTING AND PROJECTED DEMANDS OF PINELLAS COUNTY UTILITY CUSTOMERS. 1.1.
Start-up of a Secondary Water Supply Company. and First Phase Design of a Regional System
 Start-up of a Secondary Water Supply Company and First Phase Design of a Regional System by Stephen W. Smith and Amy L. Johnson Abstract. Highland Ditch Company formed the Highland Secondary Water Company
Staff Report. Agenda Item Title: 14-02: Northwest Santa Rosa Reorganization No Sequoia Park Associates, LP
 SONOMA LOCAL AGENCY FORMATION COMMISSION 575 ADMINISTRATION DRIVE, ROOM 104A, SANTA ROSA, CA 95403 (707) 565-2577 FAX (707) 565-3778 www.sonomalafco.org Item 4.1 Staff Report Meeting Date: April 2, 2014
TABLE OF CONTENTS 4.17 UTILITIES AND SERVICE SYSTEMS...
 TABLE OF CONTENTS 4.17 UTILITIES AND SERVICE SYSTEMS... 4.17-1 4.17.0 Introduction... 4.17-1 4.17.1 Methodology... 4.17-2 4.17.2 Existing Conditions... 4.17-2 4.17.3 Impacts... 4.17-4 4.17.4 Applicant-Proposed
Ordinance amending the San Francisco Public Works Code by adding Article 4.2,
 FILE NO. ORDINANCE NO. 1 [Stormwater Management.] Ordinance amending the San Francisco Public Works Code by adding Article., sections., requiring the development and maintenance of stormwater management
TAUSSIG. & Associates, Inc. DAVID. Public Finance Facilities Planning Urban Economics CAPACITY FEE STUDY FOR SAN GORGONIO PASS WATER AGENCY
 DAVID TAUSSIG & Associates, Inc. CAPACITY FEE STUDY FOR SAN GORGONIO PASS WATER AGENCY JULY 21, 2015 Public Finance Facilities Planning Urban Economics Newport Beach Riverside San Francisco Chicago CAPACITY
KINGS RIVER CONSERVATION DISTRICT Water and Electrical Energy
 Contact Information Manager: Address: KINGS RIVER CONSERVATION DISTRICT Water and Electrical Energy David Orth 4886 East Jensen Avenue Fresno, CA 93725 Phone: 559-237-5567 Email/Website Management Information
Raw water sources, facilities, and infrastructure
 WATER AND WASTEWATER SERVICES IN STEAMBOAT SPRINGS Prepared by Jay Gallagher, General Manager Mt. Werner Water and Sanitation District (February, 2015) Raw water sources, facilities, and infrastructure
MUSES Utility Survey Utility Contact Information Utility Contact Information
 MUSES Utility Survey Utility Contact Information Utility Contact Information 1.) Please fill in the fields below with contact information for your utility office. For the first name and last name fields,
COMMISSIONERS OF PUBLIC WORKS of the CITY OF CHARLESTON, SOUTH CAROLINA DEVELOPMENT POLICIES
 COMMISSIONERS OF PUBLIC WORKS of the CITY OF CHARLESTON, SOUTH CAROLINA DEVELOPMENT POLICIES TABLE OF CONTENTS DEFINITIONS WATER POLICIES Water System Extensions.... W88001 Water System Activation / Service
Regional Water Study of the Foothill and Mountain Areas of Eastern Fresno County
 Regional Water Study of the Foothill and Mountain Areas of Eastern Fresno County Prepared for: Fresno County Department of Public Works and Planning 2220 Tulare Street, Courtyard Level Fresno, California
TAHOE TRUCKEE SANITATION AGENCY WASTEWATER TREATMENT INQUIRY
 TAHOE TRUCKEE SANITATION AGENCY WASTEWATER TREATMENT INQUIRY REASON FOR INVESTIGATION The 2003-2004 Grand Jury investigated the status of wastewater treatment in unincorporated Nevada County. This year,
GENERAL ASSEMBLY OF NORTH CAROLINA SESSION 2011 SESSION LAW HOUSE BILL 609
 GENERAL ASSEMBLY OF NORTH CAROLINA SESSION 2011 SESSION LAW 2011-374 HOUSE BILL 609 AN ACT TO PROMOTE THE DEVELOPMENT OF WATER SUPPLY RESERVOIRS AND OTHER WATER SUPPLY RESOURCES, TO PROVIDE THAT FUNDS
2016 WATER, SEWER AND RECYCLED WATER COST OF SERVICE RATE STUDY REPORT. El Toro Water District
 2016 WATER, SEWER AND RECYCLED WATER COST OF SERVICE RATE STUDY REPORT El Toro Water District FINAL MAY 2, 2016 445 S. Figueroa Street Suite #2270 Los Angeles, CA 90071 Phone 213.262.9300 Fax 213.262.9303
Fillmore One to seven million acre-feet in storage depending on calculation assumption; surface area is 20,100 acres.
 Where does the City of Santa Paula obtain its water? Currently, the City of Santa Paula obtains its water supply from the court-adjudicated Santa Paula Groundwater Basin (Basin) and in lieu surface water
Use the Excel Spreadsheets to Calculate Your Monthly Water Diversion and Use.
 CENTRAL AND SOUTH DELTA WATER AGENCY S GUIDELINES FOR FILLING OUT SUPPLEMENTAL STATEMENTS OF WATER DIVERSION AND USE (MAY 2013) If you filed an initial Statement of Water Diversion and Use for each of
ARTICLE 10 WATER SHORTAGE CONTINGENCY PLAN 90
 ARTICLE 10 WATER SHORTAGE CONTINGENCY PLAN 90 5.1001 DECLARATION OF PURPOSE AND PRINCIPLES In accordance with Water Code 10632 requirements, Eastern Municipal Water District (EMWD) is responsible for conserving
City: Stormwaterville Zip Code: County: Addison. City: Stormwaterville Zip Code: County: Addison
 NOTICE OF INTENT TO USE GENERIC PERMIT FOR DISCHARGE OF STORMWATER FROM PHASE II MUNICIPAL SEPARATE STORM SEWER SYSTEMS (RULE 62-621.300(7)(b), F.A.C.) For FDEP Internal Use Only Permit : FLR INSTRUCTIONS:
San Benito County Water District. Annual Groundwater Report 2017
 San Benito County Water District Annual Groundwater Report 2017 ANNUAL GROUNDWATER REPORT WATER YEAR 2017 DECEMBER 2017 (This page has been left blank intentionally.) WATER YEAR 2017 TABLE OF CONTENTS
State of the Valley Report
 State of the Valley Report An overview of the characteristics and trends of natural resources in the San Joaquin Valley s rural spaces, with an eye on resource sustainability for the future Aerial view
Guidelines for Preparation of Reuse Feasibility Studies for Applicants Having Responsibility for Wastewater Management. Use it Again, Florida!
 Guidelines for Preparation of Reuse Feasibility Studies for Applicants Having Responsibility for Wastewater Management Use it Again, Florida! November 1991 GUIDELINES FOR PREPARATION OF REUSE FEASIBILITY
Special Publication SJ2004-SP27. Affordability Analysis of Alternative Water Supply
 Special Publication SJ2004-SP27 of Alternative Water Supply of Alternative Water Supply Technical Memorandum February 9, 2004 TABLE OF CONTENTS Section Page EXECUTIVE SUMMARY i A. Background and Scope
DRAFT ENVIRONMENTAL IMPACT STATEMENT SUMMARY
 DRAFT ENVIRONMENTAL IMPACT STATEMENT SUMMARY Proposed Leasing of Lands at Fort Bliss, Texas for the Proposed Siting, Construction, and Operation by the City of El Paso of a Brackish Water Desalination
Indirect Reuse with Multiple Benefits The El Monte Valley Mining, Reclamation, and Groundwater Recharge Project
 ABSTRACT & POWERPOINT PRESENTATION Indirect Reuse with Multiple Benefits The El Monte Valley Mining, Reclamation, and Groundwater Recharge Project Tim Smith Principal Engineer Helix Water District La Mesa,
Economic Impact of Recycling in Alabama and Opportunities for Growth. Alabama Department of Environmental Management. Land Division Solid Waste Branch
 Economic Impact of Recycling in Alabama and Opportunities for Growth Alabama Department of Environmental Management Land Division Solid Waste Branch June 2012 Alabama Department of Environmental Management
Launch Internet Explorer Browser.lnk
 Launch Internet Explorer Browser.lnk Table of Contents Overview of the Ground Water Reporting Program... 1 History of the Ground Water Reporting Program... 1 2006 Ground Water Summary Report... 1 Reporting
STORMWATER MANAGEMENT PROGRAM. Table of Contents
 STORMWATER MANAGEMENT PROGRAM Yakima Valley College March 1st, 0 1 0 1 Table of Contents INTRODUCTION... PROGRAM COMPONENTS... S.D.1: PUBLIC EDUCATION AND OUTREACH... Label Storm Drain Inlets:... Public
Santa Clarita Valley Family of Water Suppliers WATER USE EFFICIENCY STRATEGIC PLAN. June 24, 2015 WESTERN POLICY RESEARCH
 Santa Clarita Valley Family of Water Suppliers WATER USE EFFICIENCY STRATEGIC PLAN June 24, 2015 WESTERN POLICY RESEARCH TABLE OF CONTENTS W A T E R U S E E F F I C I E N C Y S T R A T E G I C P L A N
a. Structures subject to section Architectural & Site Design Standards must comply with the following additional fencing standards:
 5.03.02 Fences and Walls A. All districts. 1. Whenever a property owner elects to construct a chain link fence, pursuant to the provisions herein, adjacent to an arterial or collector road in the urban
4.0 ENVIRONMENTAL IMPACT ANALYSIS K. UTILITIES AND SERVICE SYSTEMS 1. WATER SUPPLY
 4.0 ENVIRONMENTAL IMPACT ANALYSIS K. UTILITIES AND SERVICE SYSTEMS 1. WATER SUPPLY 1. INTRODUCTION This section estimates the Project s water demand and assesses the adequacy of water supply and infrastructure
Water Management Representatives
 Bay Area Water Supply and Conservation Agency A multicounty agency authorized to plan for and acquire supplemental water supplies, encourage water conservation and use of recycled water on a regional basis.
The Sustainable Groundwater Management Act in Glenn County Governance Workgroup Meeting 1
 The Sustainable Groundwater Management Act in Glenn County Governance Workgroup Meeting 1 Meeting Outline I. SGMA Background II. Proposed SGMA Approach III. GSA Formation and Governance IV. GSA / Stakeholder
IV.M.1 WATER SUPPLY 1. INTRODUCTION. 2. EXISTING CONDITIONS a. Water Supply i. Los Angeles Department of Water and Power (LADWP)
") IV.M.1 WATER SUPPLY 1. INTRODUCTION This section describes regional water supplies and existing water infrastructure serving the Project site, estimates the water demand associated with the Project, and
IV.M.1 WATER SUPPLY 1. INTRODUCTION This section describes regional water supplies and existing water infrastructure serving the Project site, estimates the water demand associated with the Project, and
Water Efficiency Master Plan 2015
 Water Efficiency Master Plan 2015 Utilities Department Water Resources Division Water Conservation Division FINAL July 21, 2015 REVISED FEBRUARY 2016 Acronyms and Abbreviations AF acre-feet AF/yr acre-feet
STATE OF FLORIDA DEPARTMENT OF ENVIRONMENTAL PROTECTION GENERIC PERMIT FOR DISCHARGE OF STORMWATER FROM PHASE II
 STATE OF FLORIDA DEPARTMENT OF ENVIRONMENTAL PROTECTION GENERIC PERMIT FOR DISCHARGE OF STORMWATER FROM PHASE II MUNICIPAL SEPARATE STORM SEWER SYSTEMS May 1, 2003 1 Generic Permit for Discharge of Stormwater
Raw Water Supply Master Plan Development
 Raw Water Supply Master Plan Development Stakeholder Outreach Meeting - II 31 August 2016 Welcome Introductions Master Plan Goals and Objectives Refine our standard approach to long-term plan for securing
General Rate Case Application Information
 General Rate Case Application Information I. About San Jose Water Company II. III. IV. General Information About Rates Summary of San Jose Water Company s 2015 General Rate Case Application Frequently
What is a stormwater utility fee?
 What is a stormwater utility fee? A stormwater utility fee is similar to a water or sewer utility fee. In essence, customers pay a fee to convey stormwater from their properties. The City of Goodlettsville
City of Redlands Wastewater Treatment Plant. Redlands, CA LOCATION: Carollo Engineers; CH2M HILL MBR MANUFACTURER: COMMENTS:
 FACILITY: City of Redlands Wastewater Treatment Plant LOCATION: Redlands, CA GEO. AREA: Southern California STATUS 07/14: Operational CONSTRUCTION: ENGINEERING: Carollo Engineers; CH2M HILL MBR MANUFACTURER:
CITY AND BOROUGH OF WRANGELL WATER SHORTAGE MANAGEMENT PLAN
 CITY AND BOROUGH OF WRANGELL WATER SHORTAGE MANAGEMENT PLAN SECTIONS: Findings Purpose and Intent Waste of Water Prohibited Authorization Action for Hydrological Shortage Action for Emergency Shortage
Purpose of the Comprehensive Water System Plan
 2006 TACOMA WATER COMPREHENSIVE WATER SYSTEM PLAN UPDATE EXECUTIVE SUMMARY Purpose of the Comprehensive Water System Plan Tacoma Water s planning activities center on the need to meet increasing demands
OVERVIEW ORDINANCE: ORD # APPLICATION: 2014C-002
 PROPOSED SMALL-SCALE FUTURE LAND USE MAP (FLUM) AMENDMENT OVERVIEW ORDINANCE: ORD # 2014-191 APPLICATION: 2014C-002 APPLICANT: PAUL M. HARDEN PROPERTY LOCATION: 8101 Southside Boulevard Acreage: 1.76 Acres
Groundwater Management Plan for City of East Palo Alto. Appendices June 2015
 Dra Groundwater Management Plan for City of East Palo Alto Appendices June 2015 This page is intentionally blank. Appendix A Resolutions Resolution No. 4542: Resolution in Support of Sustainable Groundwater
FORWARD. Questions regarding this water conservation plan should be addressed to the following:
 Water Conservation Plan FORWARD This Water Conservation Plan was prepared by Freese and Nichols for the North Texas Municipal Water District (NTMWD), pursuant to Texas Commission on Environmental Quality
The Quest for Long-Term Water Resource Planning
 The Quest for Long-Term Water Resource Planning Maricopa County Cooperative Extension April 29, 2009 Sharon B. Megdal, Ph.D. smegdal@cals.arizona.edu WRRC Mission The University of Arizona's Water Resources
12:00 noon 7. Tour of the Silicon Valley Water Advanced Water Purification Center
 Joint Recycled Water Policy Advisory Committee Pat Burt, Council Member, City of Palo Alto Tom DuBois, Council Member, City of Palo Tony Estremera, Board Member, Santa Clara Valley Water District Gary
Notice of Preparation of an Environmental Impact Report and Scoping Meeting
 Notice of Preparation of an Environmental Impact Report and Scoping Meeting Date: August 15, 2017 To: Project Sponsor and Lead Agency: Staff Contact: Project Title: Location: General Plan Designation: