Investigation into the Process and Economic Feasibility of LNG Production From Bolivian Natural Gas. Muhannad Rabeh Travis Spain Keith Orendorff
|
|
|
- Cory Todd
- 6 years ago
- Views:
Transcription

1 Investigation into the Process and Economic Feasibility of LNG Production From Bolivian Natural Gas Muhannad Rabeh Travis Spain Keith Orendorff
2 TABLE OF CONTENTS EXECUTIVE SUMMARY...5 INTRODUCTION...6 MARKET ANALYSIS...7 CALIFORNIA AND MEXICO...8 CONCERNS OF SATURATING NATURAL GAS TO CALIFORNIA...10 PIPELINE DESIGN...12 OPTIMIZATION PROCEDURE...13 Pipeline Costs...13 PRETREATMENT...14 LIQUEFACTION...16 CONCEPT AND GENERAL THEORY OF LIQUEFYING NATURAL GAS...17 AMBIENT CONDITIONS...20 CAPACITY CONSTRAINT...20 ECONOMIES OF SCALE...21 EQUIPMENT AND OPERATING COST:...22 OVERVIEW OF LIQUEFACTION PROCESS...23 APCI...23 DMR...25 Linde...26 Conoco Phillips...27 LIQUEFACTION PROCESS SELECTION:...38 SHIPPING...41 RECEIVING PLANT...42 RECEIVING PLANT DESIGN...42 Docking Port...43 Storage Tanks...43 Vapor Handling System...44 Send-Out...45 Vaporizer...45 Pipeline Injection...50 ECONOMICS...50 CAPITAL INVESTMENTS...50 Liquefaction...50 Shipping...51 Pipeline...51 PRODUCT COSTS...52 Raw Materials...52 Other Costs...52 DESIGN PLANNING...53 Regret Analysis...53 Risk Analysis...54 CONCLUSION...56 REFERENCES...57 APPENDIX PIPELINE...59 Optimum Diameter Calculation...61 SHIPPING...62
3 REGASIFICATION...63 Unloading rate...63 Table of Figures Figure 1: Composition of Bolivian Natural Gas... 6 Figure 2:Overall Economic Comparison... 6 Figure 3:World s Reserves to Production ratio [18]... 7 Figure 4:Net US Imports of Natural Gas, [20]... 8 Figure 5:Mexico consumption vs. production of natural gas Figure 6: LNG Trade: Expected increase in capacity [20]... 9 Figure 7:Gas demand by sector from 1998 to Figure 8:Current Energy prices of Oil and Natural Gas Figure 9: Values taken from cost analysis after saturation on California gas markets Figure 10: Pipeline PFD, 36 in ID Figure 11: Pipeline PFD, 48 in. ID Figure 12: Pipeline cost vs pipe diameter Figure 13:Pretreatment schematic Figure 14: Natural gas liquefaction phases Figure 15: LNG cooling curve Figure 16:Phillips cascade LNG cooling curve Figure 17:Work done by the process Figure 18: APCI process schematic Figure 19: Duel mixed refrigerant flow diagram Figure 20: Linde process flow diagram Figure 21: Conoco Phillips simple cascade schematic Figure 22: Simple Phillips design Figure 23: Simple connected Phillips cascade diagram Figure 24:Pro/II Simulation of the "2 in 1" optimized Phillips cascade Figure 25:Propane P/H loop Figure 26:Propane loop Figure 27:Ethylene P-H diagram Figure 28:Ethylene loop Figure 29: P-H methane loop Figure 30: Methane loop Figure 31: Phillips Cascade LNG Cooling Curve Figure 32: Capacity of world LNG (mtpa) vs. year Figure 33: Medium Speed Diesel Engine Figure 34: Receiving Terminal Figure 35: Tank Designs Figure 36: Tank Dimensions Figure 37: Submerged Combustion Figure 38: Open Rack Figure 39: Ambient Air Figure 40: Energy Recovery Process Figure 41: Methane Process Figure 42: Butane Process Figure 43: Risk associated with design
4 Abbreviations - mtpa (million tons per annum) - SCFD (Standard Cubic Feet per Day) - SCMD (Standard Cubic Meter per Day) - TCF (Trillion Cubic Feet) - TCI (Total Capital Investment) - FCI (Fixed Capital Investment) - CF (Cash Flow) - LNG (Liquefied Natural Gas) - M$ (Million of Dollars) - B$ (Billion of Dollars)
5 Executive Summary The purpose of this project is to examine the economic feasibility of liquefying Bolivian natural gas and selling it to California; one of the largest natural gas markets in the neighboring countries to Bolivia. Bolivia ceases the second largest natural gas reserve in South America (53 tcf) but it has a weak production rate of one bcfd. 40% of that production is consumed and the other 600mcfd is exported, which is equivalent to 4.5 mtpa. After examining the political situation between Chile and Bolivia and after figuring the high cost of transporting LNG via pipelines to the closest beach (Peru) it was decided that the liquefying plant is going to be constructed in Lima (Peru) and from there the LNG will be shipped to California. This is done because Bolivia is a land lock and access to the Pacific Ocean should be found. Piping from Bolivia to Lima was investigated. A direct route from Santa Cruz to Lima over the Andes Mountains was avoided due to the costs associated with compression over the 4000 m average mountain range. The pipeline instead is directed through Cuzco where the average height of the Andes is only 1000 m. An optimization of the pipeline was undertaken to determine the diameter that minimizes the costs for the purchase of equipment. This cost was found to be $714 million for equipment, which equates to a TCI of $1.25 billion. The liquefying plant chosen for this process is the Conoco Phillips Optimized 2 in 1 cascade with a capacity of 4.5 mtpa. Each of the existing 3 MRP (Mixed Refrigerant Processes) is examined (APCI, Linde, DMR) with comparison to the Phillips Cascade. The Phillips Cascade reliability and lower capital cost is why it is chosen for this project. The over all compressor power needed for this process to liquefy the natural gas approximately equals to 282,000 hp. An economic evaluation of the project was conducted to determine the feasibility of the project. The TCI for the liquefaction process was determined to be $1.54 billion, with a first year operating cost of $1.8 billion. Additionally, risk analysis was conducted and the venture was found to have 90% chance of returning a negative NPW. This leads to believe that the project is not presently feasible due to high TCI and operating costs associated with the implementation of a transcontinental pipeline through the Andes.

 able to meet the North American and Mexican market standard which averages approximately around 1000 BTU/ft 3.")
6 Introduction The purpose of the project is to examine the economical potential and business prospect of the liquefaction of Bolivian natural gas reserves and importing Liquefied Natural Gas LNG to the USA and Mexico. The composition of Bolivian natural gas shows that it is rich in methane and has a negligible percentage of CO 2 which sets the Bolivian natural gas at a high quality with heat content (1,100 BTU/ft 3 ) able to meet the North American and Mexican market standard which averages approximately around 1000 BTU/ft 3. Figure 1: Composition of Bolivian Natural Gas In this report, first the LNG market is discussed in connection with the project objective, next the pipeline specifications needed to fit the process is discussed and finally the selection of the liquefaction process and its properties are explained. Based on the results of the liquefaction process, the shipping method and the number of ships needed were selected, along with choosing the location and the process of the re-gasification plant. Figure 2 a breakdown of the ranges of capital cost each sector of the process is expected to fall in according to industrial references, Figure 2:Overall Economic Comparison
 of natural gas, yet a consumption rate of only about 20% 25 of that value.")
7 Market Analysis Bolivia is the second largest producer of natural gas in South America with estimated reserves of 53 trillion cubic feet. Bolivia has a production rate of 1000 million standard cubic feet a day (MScfd) of natural gas, yet a consumption rate of only about 20% 25 of that value. Consequently, with large reserves to production (R/P), as illustrate in Figure 3, Bolivian natural gas reserves have significant upside and economic potential for both Bolivia and the LNG market. In this section of the report reasons for producing LNG, as well as a market analysis of the sales of Bolivian natural gas to both Asian-Pacific and Western United States, will be discussed. In addition, the impact of the decision to sale the LNG to California and Mexico and the related concerns about saturating the market with too much gas will be addressed. Figure 3:World s Reserves to Production ratio [18] The use of natural gas has significantly increased recently because of the concern about the deleterious affects that emissions, from the burning of hydrocarbons, have on the environment. Natural gas produces 50% fewer emissions than that of oil and 85% less compared coal because it is rich with methane which is a light hydrocarbon with less emission when burned with comparison to heavy hydrocarbons [19]. With an increasing concern for environmental issues and global warming, countries and companies are turning to natural gas as an energy source. Current demand for natural gas is strongest in the Asian-Pacific. Korea, Japan, and Taiwan are large importers of natural gas today. With a projection for significant increase in demand for natural gas by China and India, combined with Korea, Japan, and Taiwan, Asia will be the largest market for natural gas by 2020 [20]. Transportation costs, however, substantially impact the return on investment. Consequently, in an effort to maximize the ROI, other closer markets were selected, namely California and Mexico. Even if a plant were built with the capacity to deliver large amounts of LNG to Asia, the risk and cost associated with the longer transport would be greater compared to that of a closer market. This is particularly true when you consider that LNG ships boil off some of their cargo every day. Consequently, the Mexican and western United States markets are deemed the best target for the Bolivian LNG.

8 California and Mexico LNG is attractive to the United States and the Mexican region for many reasons. North American natural gas reserves are depleting at a faster rate than the discovery rate. Recent studies have shown that at the current consumption rate, natural gas reserves in the United States will be depleted within 14 years [20]. It is also obvious and well known that the US energy consumption rate is well beyond its production rate. So the US market need for energy sources is a fact and natural gas being the second biggest energy resource after crude oil makes LNG a good product. As seen in Figure 4, natural gas imports from Canada and Mexico are expected to decrease. In the other hand, the US is importing natural gas in the form of LNG to satisfy the shortage from its neighboring country especially when LNG is able to make the US reach further markets such as south America. Figure 4:Net US Imports of Natural Gas, [20] Mexico is another great market for LNG. As seen in Figure 5, Mexico over the past 3 years has significantly increased its consumption rate and consequently has widen the gap between consumption and production. Figure 4 also shows that Mexico s natural gas export to the United States is in the negatives after the year 1998 which means that the US is actually importing natural gas to Mexico. Part of this increase in demand also is due to Mexico s expansion of their current electric generation capacity by 1.75 [20]. Considering that the United States exports gas to Mexico and given that the current production of natural gas in the United States will be depleted within US for 14 years, Mexico must avert to other means of receiving natural gas.


9 Figure 5:Mexico consumption vs. production of natural gas 12 An expected increase in world capacity is shown in Figure 6 below. While Japan, Korea, and India, as stated earlier, presently are larger consumers, and will still be greater in total capacity in 2012, their rate of increase is substantially less than that of the United States and Mexico. Figure 6: LNG Trade: Expected increase in capacity [20] The United States is not only interested in natural gas because of its economical advantages but also energy diversification. The U.S. is particularly interested in LNG as a means to decrease the dependence on oil. With recent concerns over terrorism and continued tensions in the Middle East, alternative sources to oil are readily being explored. The government recently granted tax breaks and exemptions to many companies that explore means for reducing U.S. dependency on oil by producing alternative fuels. Furthermore, because of the potential for another energy crisis that could force brownouts and even blackouts, as well as gasoline shortages, California has

10 opened the market for different sources of energy. The United States has suggested that LNG is the key to diversifying their energy demand. Figure 7 shows GRI s projections for the expected increase in gas demand by sector. Figure 7:Gas demand by sector from 1998 to Concerns of Saturating Natural Gas to California With natural gas becoming a more popular energy source for the generation of electricity, and a potential means for easing our dependency on crude oil, demand for LNG has increased. As a result, the prices of natural gas have also increased substantially over the past 3 years. Figure 8 compares the prices of crude oil, and natural gas in California from 1986 to present. Current prices are at record highs and have yet to show any signs of weakening.

11 Figure 8: Current Energy prices of Oil and Natural Gas 11 Because the LNG industry is relatively new and has larger initial capital investments compared to the oil industry, the time required for return on investment is substantially longer than oil projects. As a result, natural gas projects need to secure long term contracts, on the order of 15 years, to have comparable returns on investment to those of crude oil projects. Another concern in the natural gas industry is that the LNG market could easily become oversaturated. That is, the supply could surpass the demand for, or current capacity to use natural gas. A saturated market would cause a dramatic drop in natural gas prices. The more drop in the prices of natural gas, the more time is needed to recover the capital investment of the project, and potentially leading to a negative return on investment. Table 1 shows how much natural gas the California market imports from different parts of North America Table 1: California Natural Gas imports by region U.S. South West 49% 46% Canada 26% 24% Rockies 11% 17% Production 14% 13% An example of a saturated market is given in the Figure 9 below. The horizontal line is the equivalency line between the California border and Henry Hub pricing which is the bench mark for wholesale natural gas prices across the United States. Any values above this line mean that the California price is greater than the Henry Hub, and vice versa.
12 Figure 9: Values taken from cost analysis after saturation on California gas markets The Jul 94 entry illustrates the affect of an expansion to the California market. The PGT expansion added around 470 MScfd to the market. Though there was a temporary stability in gas prices, the prices gradually decreased in response to over-supply until Nov 95 when the market price thumbed. By Mar 96 the California gas price was $1.50 below the Henry Hub. Even though prices did equilibrate near the $0.00 line by the end of 1996, for almost two years the prices remained below the equivalency line. Therefore, not exceeding the market demand is crucial in maintaining higher gas values. This again is especially important in the gas industry where prices are so critical on the outcome of the return on investment. However, due to Federal and State regulations, California is being forced to find alternative sources of energy for their coal and oil power plants. Consequently, because natural gas offers a substantially cleaner source of energy, the concern for saturation of the energy market is somewhat mediated. That is, because California must cleanup their environment by reducing emissions, they are willing to purchase LNG at the expense of the other energy sources. Therefore, because the United States is one of the fastest growing markets for LNG in the world, and a LNG is environmentally friendlier than coal and oil, California is an ideal market for LNG. Consequently natural gas will be pumped to power plants in Southern California. Pipeline Design A fair majority of the costs associated with this design include the implementation of a transcontinental pipeline from Santa Cruz to Lima through the Andes Mountains. Upon
13 investigation of the Andes Mountain chain, they were found to have an average height near 4000 m. In order to prevent the additional expenditure associated with compression due to the change in elevation, a pathway was selected that entered the mountain at the lowest elevation possible. The lowest point in the Andes was found to be in Cuzco, where the average elevation through the mountains is only 1000 m. The total length of pipe to be lain is described in the following table. Table 2: Pipeline distance Leg Distance (miles) Santa Cruz-Cusco 768 Cuzco-Lima 228 Total 996 To make the pipeline as economical as possible, an optimization was performed to minimize the costs. Pro/II software was used in the optimization to calculate compressor work needed at the specified diameters. Optimization Procedure For each simulation a diameter was selected and compressors were placed at the entrance to the pipeline. The simulation was then run to determine where additional compressors were needed in order to overcome the pressure drop in the pipe. Compressors were added and the simulation was repeated until the solution was reached. Once the simulation converged on a reasonable solution, additional compressors, or outlet pressure to those already there, was increased to produce the desired outlet pressure of psia required in the liquefaction facility. The following PFDs show the simulation design for two of the pipe diameters investigated. Figure 10: Pipeline PFD, 36 in ID Figure 11: Pipeline PFD, 48 in. ID Pipeline Costs In designing the optimal pipeline, costs must be taken into consideration. Prices for pipeline and compressors must then be estimated to determine the overall cost of the system. Compressors were estimated to be $2500 per hp. This is a fairly universal estimate for large scale compressor costs that was suggested by Professor Hubbard of the Petroleum Engineering Department. Costs for the pipeline were extrapolated from Peters and Timmerhaus. The following equation shows the costs associated with the pipeline on a foot basis.
14 C = 2.115(D) (1) Where D is the inner diameter and C is the cost per foot of pipe. The costs are illustrated in the following table. Table 3: System costs for varied pipe diameters The information in the table can then be graphed to determine a minimum in the cost curve. The following graph shows this information and displays the optimum diameter as well as the cost associated with purchasing the necessary equipment. Figure 12: Pipeline cost vs pipe diameter This chart shows that a minimum in the cost curve occurs at a diameter of 45.7 in. ID. The purchase cost of the system, including compressors and pipe segments, is $719 million. This cost does not include the installation of the pipeline. This additional charge will be discussed later in the economics section of this document. Pretreatment Before natural gas can be liquefied, it must be treated. Treatment involves the removal of CO 2, condensate, organic sulfur compounds, and Hg. This is done to avoid blockage in the liquefaction process, prevent damage done to the equipments, and to meet the heat content standard of the natural gas which differs from country to the other. Heat content of the natural
15 gas increases with the increase of C 3 to C 4 in the composition of the gas. Natural gas heat content standard in the United States averages around 1,036Btu/ft 3 with a variation of ± 60. The Bolivian natural gas heat content is believed to average around 1,100 BTU/ft 3 so it falls in the US limits so no section in the pretreatment plant needs to be added to serve the purpose of meeting the heat content standard f the NG for the US market. The pretreatment equipment specification is dependent upon the inlet contaminant concentrations. Therefore, because of minimal contaminants in the Bolivian natural gas, minimum treatment is necessary for preparation of the gas. The pretreatment process consists of four main stages. First, CO 2 and H 2 S removal stage which is constructed to assure that CO 2 would not exceed 50 ppm in the natural gas feed. If the composition of CO 2 exceeded that limit it would freeze in the liquefaction process pipelines. This stage is directed more to CO 2 removal since the Bolivian natural gas contains no sulfur in it. There are two available methods to remove CO 2 from the natural gas. The first method is using sulfinol, which used to be one of the famous methods for gas CO 2 removal in most industrial applications but it started to vanish and few pretreatment plants use sulfinol any more. The reason is that sulfinol does not work well with rich natural gas (rich with heavy hydrocarbons) because it tends to attract or attach to heavy hydrocarbons and then it drags the heavies to the sulfinol pump or circulation which leads to allowing the heavy hydrocarbons to vent into the air. That usually leads to a decrease in the quality and heat content of the natural gas in the feed and according to the new EPA (Environmental Protection Agency) rules heavy hydrocarbons can not be vented to the atmosphere because it would lead to an increase in the air pollution level in the surroundings significantly. So EPA regulations will be followed in Bolivia to serve ethics purposes. Another method to remove CO 2 is using DEA (Diethyl Amine) but since DEA alone can not remove CO 2 to a ppm (particle per million) level, it is activated by injecting a chemical called Piperzine which activates the DEA to MDEA (Methyl Diethyl Amine). MDEA is also used for this pretreatment stage versus sulfinol because MDEA is cheaper to install and it has less utility since it requires less rate of solvent circulation compared to sulfinol. Therefore, this pretreatment stage is named the amine wash section. The second stage is dehydration. Water is removed from the natural gas also to avoid freezing in the pipeline of the liquefaction process. The natural gas feed should be completely dry, even from the smallest traces of water molecules (<0.01Microgram/m 3 ), before entering the heavy duty cooling section of the liquefaction process. TEG (Triethylene Glycol) is the primary solvent used in gas processing industry to dehydrate gases. Dry TEG contacts the moist natural gas and absorbs the water from it in a contactor tower. The tower contains a structured packing bed to maximize the mixing between the gas and TEG and to increase the contact time between the two substances. The TEG and water mixture is then sent to a TEG recycling system where TEG is separated from water by filtering then heating. The recycled TEG is then sent back to the contactor tower. Although TEG removes H 2 O significantly from the natural gas, small amount of water traces still escape this process; so to insure that these traces do not accompany the natural gas feed, molecular sieves are used to serve this purpose. In average, two sieves are needed for every train. Despite all of this, in some processes H 2 O in a molecular level still escapes with the natural gas in the feed. A third safety step is taken in the liquefaction process where molecules of water, which accompany the natural gas in the feed, are condensed and flashed in the stage of natural gas pre-cooling. This step will be explained in detail in the liquefaction section of this report.
16 The third stage is the Hg removal. Although the Bolivian natural gas has no Hg in it, this step is still taken as a precaution since the natural gas feed might contain molecular amount of Hg which is enough to cause corrosion in the expensive Aluminum LNG heat exchangers used in the liquefaction process. 10 ng/m 3 (nano gram per m 3 ) is enough to cause such a catastrophe. The process of Hg removal is also inexpensive since the activated bed filter that is used in the Hg filtration is inexpensive and it is replaced on an average of once every four years. So having this stage in the pretreatment of the Bolivian natural gas eliminates the risk of having Hg traces in the natural gas feed that might ruin the expensive heat exchangers. The fourth and last step is the installation of a Duster in the Pretreatment process outlet to insure that the natural gas feed is free from small solid particles which might cause a clog in the pipes of the liquefaction process or damage the heat exchangers. The figure below shows the overall process flow. Figure 13:Pretreatment schematic Liquefaction This section will explain the choice of Conoco Phillips Cascade as the design of choice for this project. A brief description of the other three existing processes (APCI, Linde, DMR) will be also included in this section. Major factors impacting the choice of a liquefaction process will be discussed: 1-Ambient conditions 2- Capacity requirement 3- Economies of scale 4- Equipment and operating cost
17 5- Overview (Description) of processes In addition, the advantages and disadvantages of the various designs for the plant will be discussed. Finally, a selection section that would justify the use of ConocoPhillips as the liquefaction process will be presented. But first the concept and general theory of natural gas liquefaction stages that every liquefaction process follows is discussed. Concept and General Theory of Liquefying Natural Gas Natural Gas liquefaction is the major cost of most LNG processes. It costs an average between 0.7B$ to 1.4 B$ as mentioned earlier in the introduction. After the natural gas has been pretreated and contaminants are removed, it is sent to a liquefaction process where the natural gas is pre-cooled and water traces and heavy hydrocarbons (C 3 & C 4 ) are knocked off the NG; then, the NG is transformed from a gas phase to a liquid phase and sub-cooled to level where the LNG could be stored at atmospheric pressure. Figure 14 shows the steps of natural gas transformation from one phase to the other, E D C B F A G Figure 14: Natural gas liquefaction phases The natural gas usually enters the liquefaction process from pretreatment at about 100 F (point A) and it is cooled down to about 60 F by either air or water coolers (point B). Propane is usually used to cool the NG to about 40 F and this is where most of the water traces is condensed and knocked out of the NG by flashing (point C). Then the NG is cooled down to about -40 F (point D) and that is done mainly in the scrub column for mixed refrigerant processes or in the propane pre-cooling cycle for the Phillips Cascade. At this point is where most of the heavy hydrocarbons
18 and NGLs (Natural Gas Liquids) are flashed and separated from the NG. Then the NG is cooled down to become completely liquid at -110 F (point E) and then it is sub cooled all the way to about -260 F (point F) to ensure that not more than 5% fuel gas would be generated when the LNG stream is flashed in order to reduce the pressure down to atmospheric pressure in order to store it. The fuel gas is mainly used as an energy source for the liquefaction process and rarely sold for profit. This phase changing process could also be explained on a LNG cooling curve generated for a liquefaction plant with a capacity of 4.5 mtpa. On the graph the amount of heat extracted (heat flow) from the NG to could be shown. Figure 15: LNG cooling curve On Figure 15 the marked points on the graph specify the same phase transformation stages mentioned in Figure 14 (Natural Gas Liquefaction Phases). The blue line in the graph above shows how NG behaves in an ideal liquefaction process.
 and the refrigeration heating curve (green line above) represents the amount of heat lost during the liquefaction process.")
19 Figure 16:Phillips cascade LNG cooling curve The closer the refrigeration heating curve to the LNG cooling curve, the more efficient the process is. The area between the LNG cooling curve (orange line above) and the refrigeration heating curve (green line above) represents the amount of heat lost during the liquefaction process. The area above the refrigeration line represents the amount of work done by the system and the closer the lines are to each other the less work the system has to do. As seen from the two figures above, the area between the LNG curve and the process curve is smaller for the MR processes than for the pure refrigerant (Phillips cascade) and this indicates that the MR processes are more efficient when it comes to the work performed (less work) but other factors will actually show that the Phillips is much more efficient and suitable to Liquefy NG for Bolivia as it will be explained in the coming sections. The graph and equations (related to the graph) below proves that the area above the lng cooling curve represents work. Figure 17:Work done by the process
20 T W = dq (1 T T W = dq( W = High T da T High High low High T low ) ) So the bigger the area between the starting temperature (T high ) and the curve, the more work the system has to perform. Ambient Conditions The ambient air conditions in Lima, Peru seen in Table 3, range in annual temperatures from 60 to 80 F, with no divergence above 80. Air is used as a coolant in the processing of natural gas in the majority of current liquefaction plants to avoid environmental impact issues and so it is used in this ConocoPhillips liquefaction process. Table 4: Normal air temperature in Lima, Peru 4 Monthly Normal High Temperature ( F / C ) Low Temperature ( F / C ) Jan Feb Mar Apr May Jun July Aug Sep Oct Nov Dec 79 / / / / / / / / / / / / / / / / / / / / / / / / 18 The few plants that use water as a coolant have done so because of high (T > 95 F) ambient temperatures, i.e. Egyptian LNG. Though water cooling is more efficient, the use of water can greatly impact the surrounding environment. A tremendous volume of half a million pounds/hr of water is required for pre-cooling. In addition, prior to returning the water to its source, the water must be treated to remove potential contaminants and lower the water temperature to the ambient temperature. Both the volume of water and the water treatment add to larger production costs in comparison to using air. The downside of using air is that cooling temperatures are roughly F higher than for that of water. Peru, however, has moderate and stable ambient temperatures that range of 60 to 80 F. Consequently, the use of air is acceptable. Capacity Constraint The second criterion for selection of liquefaction process is the capacity requirements. Capacity is the maximum amount of LNG that can be produced in a year.

21 Table 5: Capacities of current and future LNG trains 1 As seen in the above Table 4, production of LNG currently range from 0.4 to 3.3 MMmtpa. Since the strong push for LNG in the 1970s, many companies have acquired patents and licenses for different liquefaction processes. These companies, Linde, Shell, and APCI to name a few have optimized their processes to produce more LNG per train. These new technologies claim the ability to produce volumes in the upper end of 8 to 9 MMmtpa [5]. The advantage about the Conoco Phillips Cascade is it could be scaled up by adding more trains to whatever production limit is needed and it also could be scaled down to as low as 3 mtpa. While most the mixed refrigerant processes could be scaled up to a certain limit (8 to 9 MMmtpa) and could not go lower than 5 MMmtpa. Economies of Scale Designing a large plant and then running it far below the capacity rates is a waste of investment and potentially could result in greater maintenance issues. Economies of scale means maximizing profit based on fixed capital investment. While newer technologies have greater efficiencies in processing of natural gas, in order to fully take advantage of their economies of scale production must be maintained near capacity [6]. Since production level is based on what the market will support, if demand goes down, so would production. Likewise, if production of LNG is greater than the demand, the sale price will weaken and production rates must be decreased which leads to further waste of the capital investments. Therefore, the selection of the technical method is concerned with capacity and stability but it is more concerned with maximizing profit based on market demand. Some people might say that running the plant, with the newer technology, substantially below the capacity rating is not an issue. However, two issues must be considered: wasted capital outlay and maintenance issues. Wasted capital should be avoided at all cost regardless of the project, unless money is no object. It is like the old saying, Why bring a tank to a turkey shoot? That fire-power would be wasted and probably inefficient. The maintenance issue, as well, is a concern. Remember that the newer technologies have yet to be proven. Thus the larger
22 trains are expected to have greater maintenance issues. More maintenance means loss of money and lowered production. Also, the newer technologies will have larger compressors. For the near future, only a few companies will be able to, repair and maintain the equipment, which means their service will come at a premium price. Equipment and operating cost: Operating and equipment cost for the liquefying processes are in close proximity. The equipment cost range between 0.7 to 1.4 B$ and the operating cost lies between 0.35 to 0.7 B$/yr. Mixed refrigerant processes are put together in one category because they are almost similar in the overall process and cost but each one has a different modification that suits the conditions that it was built to suit (Built for different regions) as this will be discussed in the overview section. Table 6: Relative operating costs Equipment Cost (B$) Operating Cost (B$/yr) Conoco Phillips Cascade (2 in 1 train) Mixed Refrigerant Processes (MRP) The mixed refrigerant processes rank the highest in equipment cost but the lowest in operating cost and vice versa for the Conoco Phillips Cascade. The reason for that is the Conoco Phillips Cascade consists of several average sized equipments (heat exchangers and compressors) which make the equipments cost less but the maintenance and operating and maintenance cost higher. While the mixed refrigerant processes consist of one big heat exchanger tower, massive compressors and propane chillers which raise the equipment cost and reduces the operating cost. The operating cost is lower in the MRP due to two reasons, the first is having a large heat exchanger tower which leads to the reduction in ambient heat loss since all the heat exchanging process takes place in the tower rather in separate heat exchangers (as in the Conoco Phillips). The second reason is the MRP requires less work due to having one large compressor with a heat exchanging tower which is more efficient than having many compressors running for each loop. Having many compressors in each loop results in more frictional and head loss which requires more work by the compressors. Total Compressor Work (hp) Conoco Phillips Cascade ~340,000 MRP ~200,000 An exact figure for the equipment cost can not be found because of the difficulty of getting prices of the advanced heat exchangers and compressors used by each process. So the estimation of costs released by the companies using such processes is used to justify the selection of the liquefying process.
23 Overview of liquefaction process Liquefaction of natural gas involves the transfer of energy from the hot stream of natural gas to the cold stream of the refrigerant via LNG heat exchangers in order to change the phase of natural gas from vapor to liquid. The liquefaction process liquefies the gas into a liquid by cooling the natural gas to 162 C and subsequently reduces the gas volume to 1/600 th of the initial volume. The liquefied natural gas is then pumped into a vessel and shipped to its destination. The liquefaction process starts after the inlet gas has been pretreated. The inlet gas enters at high pressures (around 800 psia) from the upstream production site, in this case Bolivia. For most LNG plants, the entire liquefaction process consumes about 10% of the feed gas as energy while liquefying the gas [6]. APCI As seen in Table 4, APCI (Air Products and Chemicals Inc.) and also called Propane Pre-cooled Mixed Refrigerant Process (PPMR). currently holds 88% of the liquefaction plants on the market today. They currently produced mtpa of LNG with 53 trains in operation. Their technology uses a three stage refrigerant cooling powered by two 85 MW Frame 7 compressors. The first stage is a pre- propane cooling stage that cools the mixed refrigerant and inlet treated gas to around 35 F. The next two cooling stages, held in a heat exchanger tower, use mixed refrigerants (MR) of about 27% methane, 50% ethane, 20% propane, 2% Butane,and 1%nitrogen to cool and condense the natural gas. Below is a process flow diagram of the overall process.
24 Mixed Refrigerant (comp.)(t=-35 o C) ~ 1% N2 ~ 27-30% Methane ~ 50% Ethane ~ 18-20% Propane ~ 1-2% Butane Pretreated Natural Gas Feed Figure 18: APCI process schematic 7 Propane chillers chills the gas during pre-treatment and after through use of these propane chillers. As seen in figure 12 a flash tank is used to separate the mixed refrigerant to a heavy coolant (bottom/red stream) and a lighter coolant (top/green stream). The heavy coolant (propane, butane, and some ethane) takes care of the cooling in the warm bundle (bottom part) of the heat exchanger tower which cools down the natural gas stream (blue stream) to about -50 o C and then the light coolant is sprayed back on the streams of the warm bundle via valves to insure that the refrigerant cooled the natural gas stream to the maximum point possible for this mix. The light coolant (methane, ethane and nitrogen) cools down the natural gas stream to -160 o C in the cold bundle and this temperature is the point where natural gas is converted to LNG. Similarly to the warm bundle, the light coolant is then sprayed on the streams in the cold bundle of the heat exchanger tower and then mixed with the sprayed heavy coolant in the warm bundle and then compressed; that is the end of the cooling cycle. The liquid coming out of the top of the heat exchanger tower is then separated via flash tank to LNG (bottom stream) and light fuel (top stream) which is later sent for fractionation in another sector. The overall process requires around 200,000 hp out of the three Frame 7 compressors and the heat exchangers in the tower are Spiral Wound Heat Exchangers (SWHE). SWH heat exchanger is more flexible and easier to control and it could handle heavy and efficient heat exchanging process, like the liquefaction process, via one big heat exchanger. The MCHE consists of two or three tube bundles arranged in a vertical shell with the process gas and refrigerants entering the tubes at the bottom which then flow upward under pressure. The overall maximum is 5.0 MMmtpa but it can not go less than 4 MMmtpa. APCI has invented their X technology. APCI-X uses nitrogen for the third refrigerant loop instead of MR to cool down the natural gas. The addition of nitrogen to the loop takes some of the compression work off of the propane precooling compressor allowing for increased production. However, while APCI plans on implementing the new technology, production of LNG by APCI-X is not expected for a few years. While APCI controls the majority of liquefaction plants in operation today, their older designs have limitations and potential areas for concern. As stated earlier, APCI uses Frame 7 compressors with a rating of about 85 MW. Being so large, Frame 7 compressors only have one

25 vendor that makes them, GE and ultimately one company who knows anything about them. Therefore, GE sets the price at which they sell the Frame 7 compressors and that sets the equipment cost to be so high due to its monopoly. Additionally, the use of large compressors raises reliability concerns. If one compressor goes down, production halts until the problem is fixed. Another disadvantage of having a large compressor is that it is only sufficient for large flow and it can not handle low flow rates (less than 1000 BCFD). Same goes to the heat exchanger tower, SWHE are manufactured by Linde only and it ceases its monopoly. If any clog or freezing occurs in one of the heat exchanging streams then the whole process is stopped until the problem is fixed. That generates a high risk for the LNG production rate for the liquefaction process. DMR DMR (Dual Mixed Refrigerant) is very similar to the APCI liquefaction process. The process capacity is about 4.5 MMmtpa and there is only one DMR train in operation. The location of this train is in Sakhalin Island in Russia. Figure 19: Duel mixed refrigerant flow diagram As seen in Figure 19, the natural gas stream (red stream) is cooled via two stages. The first stage, which is the left column, cools the natural gas to -50 o C while the second column cools the natural gas to LNG at -160 o C. The composition of the pre-coolant cycle is 50/50 of Ehtane/Propane on molar basis and the coolant composition of the cooling cycle is similar to the composition of APCI (stated in the APCI section) and that is why it is called the Dual Mixed Refrigerant process (due to having two different refrigerants). It is seen also from figure 19 that the process is similar to the APCI but in this process the heat exchanger tower is divided into two

26 sections rather than one tower and this concept allows the designer to choose the load on each refrigeration cycle through controlling the two compressors work before each column. The two compressors are frame 7 compressors. The heat exchangers used in this process are also SWHE as used in the APCI. Shell also developed double casing equipment rather than a single casing to optimize the production to 5 mtpa. The advantages and disadvantages of this process is similar to the APCI But since it has two separate compressors and heat exchangers it becomes more reliable than the APCI. Reliable in the since that if one compressor or heat exchanger turns offline then the rest would do the liquefaction but with less production rate. Linde This process is also called the Mixed Fluid Cascade process (MFC). It was developed by Linde/Statoil LNG Technology Alliance and it serves capacities of 4 mtpa. Only one Linde train has been constructed with a maximum capacity of 4 mtpa for the Snohvit LNG project in Ekofish (Norway). Pre-cooling Section (PFHE) Liquefaction Section (SWHE) Sub cooling Section (SWHE) Figure 20: Linde process flow diagram As seen in figure 20, the natural gas (red stream) comes in from the top and goes through three mixed refrigerant cycles. The pre-cooling cycle (green cycle) cools natural gas through two Plate-Fin Heat Exchangers (PFHE) while the liquefaction (purple cycle) and sub-cooling (blue cycle) cycle cool via SWHEs. SWHE is made and patented by Linde and may also be used for the pre-cooling stage. The only possible reason PFHE is used is because it is less expensive than
27 SWHE. The refrigerants are made mainly of methane, ethane, propane, and nitrogen but the composition ratio of the refrigerants would differ among the three stages. Table 7:Composition of Linde MRs Propane (%) Ethane (%) Methane (%) Nitrogen (%) Pre-cooling ~60 ~28 ~10 ~2 (Green Cycle) Liquefaction ~3 ~12 ~80 ~5 (Purple Cycle) Sub-cooling (Blue Cycle) ~7 ~10 ~80 ~3 No specific kind of compressors is used for this process. A Frame 7 and 6 compressors have been proposed for this process to optimize it. The MFC has the same advantages and disadvantages of the other MR processes but it has an extra advantage which is the size and complexity of the separate SWHE applied in the MFC are less when compared to the single unit heat exchangers like in the APCI or DMR. That allows larger single compressors to handle refrigerant over a larger temperature range. Conoco Phillips Conoco Phillips currently has at least two trains in operation, Atlantic LNG, and Egyptian LNG. More trains are being constructed since this process is expanding to compete with the APCI. It ceases about 5% of the world s LNG production and it has been in operation for more than 30 years.
, ethylene (green), and methane (red). The pretreated natural gas (black stream) enters the first cycle or cooling stage which uses propane as a refrigerant.")
28 Natural Gas Methane Ethylene Propane Fuel Gas LNG Flash Tank Figure 21: Conoco Phillips simple cascade schematic As shown in figure 21, the process uses a three stage pure component refrigerant cascade of propane (purple), ethylene (green), and methane (red). The pretreated natural gas (black stream) enters the first cycle or cooling stage which uses propane as a refrigerant. This stage cools the natural gas to about -35 o C and it also cools the other two refrigerants to the same temperature. Propane is chosen as the first stage refrigerant because it is available in large quantities worldwide (especially Bolivia) and it is one of the cheapest refrigerants. The natural gas then enters the second cooling stage which uses ethylene as the refrigerant and this stage cools the natural gas to about -95 o C. At this stage the natural gas is converted to a liquid phase (LNG) but the natural gas needs to be further sub cooled so fuel gas would not exceed 5% when the LNG stream is flashed. Ethylene is used as the second stage refrigerant because it condenses methane at a pressure above atmospheric and it could be also condensed by propane. After methane has been condensed by ethylene, it is sent to the third stage where it sub cools the natural gas to about -155 o C then it is expanded through a valve which drops down the LNG temperature to about -160 o C. Methane is sent back to the first cooling stage and the LNG stream is flashed into about 95% LNG (which is sent to storage tanks) and 5% fuel gas used as the liquefaction process fuel. Methane is used as the sub cooling stage refrigerant because it could sub cools up to -155 o C and it is available in the natural gas stream so it is available at all times and at lower costs. To obtain how much heat duty every refrigeration cycle needs before designing it the following simple and theoretical simulation is done,
29 Theoretical Heat Exchanger Fuel Gas Natural Gas T=21 o C T * =-35 o C T * =-95 o C T * =-155 o C Figure 22: Simple Phillips design T=-162 o C LNG The figure above shows a simulation designed with theoretical heat exchanger that cools down the refrigerants to couple of degrees lower than it is boiling point in order to condense it. Then the heat exchangers between the natural gas stream and the refrigeration cycles are designed to cool the natural gas to a temperature (T * ) 10 o C lower than the refrigerant boiling point. The refrigerants boiling points are another reason for picking these three refrigerants since no other pure refrigerant would meet these design temperatures. Table 8: Refrigerants boiling points Refrigerant Boiling Point ( o C) Propane ~42 Ethylene ~103 Methane ~161 Table 9: Refrigerants boiling points Cycles Heat Duties (HX) (MMBTU/hr) Propane Ethylene Methane After the amounts of heat duties needed for each cycle is determined, the theoretical heat exchangers are connected to each other between the three cycles in order to assure that the design is feasible. The only way to cool down the refrigerants to such low temperatures is to compress the refrigerant then connect the cycles to each other so one would cool the other after cooling the natural gas. The connected cycles design that is derived from the figure above is shown in the figure below.
30 Propane Ethylene Methane Natural Gas Water Coolers LNG Heat Exchangers Figure 23: Simple connected Phillips cascade diagram LNG All the explanation of the Phillips cascade above is theoretical which serves the purpose of understanding and simulating the process. The actual design contains flash tanks which are located before every LNG heat exchangers to separate the liquid refrigerant from the vapor refrigerant and then the vapor phase refrigerant goes to the compressor and the liquid is sent to the next LNG heat exchanger for further cooling of the natural gas stream. This would insure that only liquid phase refrigerant would cool the natural gas stream which will optimizes the cooling process and makes it more efficient; this is also why this kind of cooling process is called the Optimized Conoco Phillips Cascade process. But since one single Optimized Conoco Phillips Cascade train produces about 3.5 mtpa, a scaled up design named two in one train,which contains twice the number of compressors available in the single train, is used for this project. This is an advantage of the Phillips cascade since one train could be optimized to produce a maximum of 4.5 mtpa which is the same amount produced by an APCI train. The following figures show the two in one Optimized Phillips Cascade overall simulation and loop by loop simulations.
31 Propane loop Natural Gas Inlet Ethylene loop Methane loop Figure 24:Pro/II Simulation of the "2 in 1" optimized Phillips cascade LNG Below is a P-H (Pressure-Enthalpy) diagram of propane that shows the cooling process (compression, flashing and expansion) in the propane loop,

32 Figure 25:Propane P/H loop As is seen in Figure 25, the circle signifies the inlet temperature of the propane at 100 F. The red line then vertically decreases from the 100 F entrance, flashing across a valve to the new temperature and pressure. The newly generated saturated liquid is then separated in a flash tank. The temperature is that value corresponding to the exiting pressure of the valve. The vapor leaving the top of the flash is then mixed with the vapor exiting the first heat exchanger in an accumulator; is compressed, and re-entered into the process. As seen in Figure 16, for design purposes in PRO/II, three compressors are used to achieve the same affect as one centrifugal compressor. The heat exchanger immediately after the three compressors is air cooled with an exit Hot Product Temperature of 100 F.
33 Compressors Stream to transfer cooling to other loops Flash Tanks Natural Gas LNG HX Figure 26:Propane loop The process then continues with two lower pressure heat exchangers and compressors. The exiting temperature of the first heat exchanger is 60 F, the second 0 F, and the third near the normal boiling point of propane at 44 F. With an approach temperature difference set at 10 F, the natural gas temperature cools down to about 35 F at the exit of the propane loop. Table 10 reports the duties of each heat exchanger in the propane pre-cooling loop. Table 10: Duties of individual HXs in Propane Loop LNG HX (Figure 26 ) Right Middle Left Duty (MMBtu/hr) Propane pre-cools both refrigerants as well as natural gas, so the large values of heat duties are expected as seen in the table above. Obviously lowering the mass flow rate of the propane refrigerant would lower the duty of the heat exchanger, as well as the compressor work. For the ethylene loop, the same scenario is followed for the P-H diagram.

34 Figure 27:Ethylene P-H diagram But the ProII simulation is different since it only has two LNG heat exchangers instead of three because less heat flow is required for this loop. While the heavy pre-cooling done by the propane loop requires a lot of heat flow. Ethylene Connecting Stream Figure 28:Ethylene loop
.")
35 The temperature of the natural gas stream coming in the loop is about -33 o C, coming out of the first heat exchanger the temperature is about -60 o C and coming out of the loop the temperature is about -115 o C. The connecting stream allows the heat transfer between the three loops (ethylene cooling methane and ethylene being condensed by propane). The heat duties of the two LNG heat exchangers are as follows, Table 11: Duties of HXs in propane loop LNG HX (Figure 28) Right Left Duty (MMBtu/hr) The P-H diagram for the methane loop is similar to the other stages but as could be seen when compared to the two refrigerants, the peak of the mixed region in the P-H diagram is shifting more to the left from methane s peak is further to the left than ethylene and ethylene s peak is further to the left than propane. The further to the left the mixed region in the P-H diagram is the lower temperature the refrigerant could reach. Figure 29: P-H methane loop
36 Methane Figure 30: Methane loop The natural gas enters the methane refrigeration cycle at -115 o C, leaves the first LNG heat exchanger at -117, leaves the second at -127 o C and the last at -156 o C. Then the LNG stream is expanded through a valve to about -160 o C and then flashed to about 95% LNG and 5% fuel gas. Table 12:Duties of individual HXs in Propane Loop LNG HX (Figure 30) Right Middle Left Duty (MMBtu/hr) The overall liquefaction process could be also described graphically using the LNG cooling curve.
37 Figure 31: Phillips Cascade LNG Cooling Curve The blue line in figure X represent how NG in a 100% efficient (ideal) cooling process should behave; the block drawing under the blue line represents the refrigerant in the cascade process and the area between them represents the heat lost by the system. The total horse power spent by each loop s compressors in the PRO/II simulation is presented in the table below and it also agrees with the graph above showing that the least work is done in the middle loop and the most work is done by the propane loop since it is the stage which the heavy pre-cooling is done. Table 13: Total work done in refrigeration loops Loop Work (hp) Efficiency of compressors Propane % Ethylene % Methane % Conoco Phillips uses Frame 5 Gas turbines rated at 30 MW. These compressors can be single or double shaft gas turbines. Frame 5 compressors are almost as efficient as Frame 7 & 9 compressors (used in mixed refrigerant processes) but cost the fraction of the price. LNG heat exchangers used by Conoco Phillips has a brazed aluminum plate fin style [10]. This specifically allows for low pressure drops inside the heat exchanger and a high thermal efficiency. The LNG heat exchangers are then fitted with headers to force transfer of liquid through all inlet holes. The LNG heat exchanger is then installed into a cold box. The purpose of the cold box is to provide high levels of thermal efficiency and safety measurements. The cold box is made of perlite with circulating nitrogen gas moving through the open space. Any trace of natural gas or refrigerant that has leaked out of the LNG heat exchanger is carefully caught alerting the operator.
38 Liquefaction process selection: From all the description above of the different liquefaction processes, the Conoco Phillips Optimized Cascade is chosen to be the liquefaction process used for this project. The reasons for this selection are as follows, 1- The Phillips cascade could handle less natural gas in flow even if it is set to produce 4.5 mtpa which is equivalent to 600 MCFD of natural gas; for example if only 400 MCFD of natural gas was to be delivered from Bolivia, the Phillips Cascade could produce LNG for the specified amount of natural gas which is equivalent to 3 mtpa of LNG. This quality is to be considered the most since Bolivia is well known for its weak natural gas production despite the massive reserves they have and also the political problems that happens continuously in Bolivia which might also lead to lower natural gas production from Santa Cruz. The Mixed Refrigerant processes consist of Frame 7 gas turbine compressors which are set at a certain gas inflow rate which averages at about 5,300 MFCD. If less than this limit was to be provided to the process, it would lead to the destruction of the expensive large compressors used by this process because it can not handle less flow in which it is set at. 2- The Conoco Phillips Cascade is more reliable since if one of the equipment such as a compressor goes out of order then the plant will keep producing LNG but the rate of production will drop to about 75% and so on. MRP has more complicated designed equipments, and if something goes wrong with a compressor or a heat exchanger then the production will drop down to 0% and that is a big risk to take. Plus maintaining the Conoco Cascade in Bolivia is easier since it is constructed of some of the simplest compressors and LNG heat exchangers around the world. The two tables below compare the reliability of the Phillips Cascade and MRP, Table 14: Plant reliability of MRP Overall Plant Production Efficiency = 90% Operating Range Production Full plant 100% One Turbine offline 0% Three Turbine offline 0% Plant Idle 0% Table 15: Plant Reliability of Cascade 2 in 1 train Overall Plant Production Efficiency = 95% Operating Range Production Full plant 100% One Turbine offline 60% to 80% Three Turbine offline 30% to 60% Plant Idle 0%
39 3- As known, the Conoco Phillips cascade runs on pure refrigerants. Pure refrigerants are cheaper, easier to provide (especially in Bolivia) and its constant molecular weight simplifies the refrigerant compression process. Only two refrigerants (propane and ethylene) for this process is bought. The methane refrigerant is generated from the vapor recovery of the LNG storage tanks where methane is recovered after it is vaporized; then, it is sent back to the methane refrigeration cycle. This methane recovery process design is simple since all is needed is a vapor blower to send the methane back to the cycle since the natural gas has been already pretreated. In the other hand; for the MRP a mixed refrigerant has to be blended in special refrigerant blending plants which might not be available in Bolivia. It is also much more expensive than the pure refrigerant like ethylene and propane. 4- In the Conoco Phillips Cacade it is also easier to be scaled up. It could be scaled up to the required amount of LNG by adding an extra train to the process which would increase the production process anywhere from 1.5 to 3 mtpa or higher if desired. While for the MRP, the process design is already scaled up and pushed to the maximum, so if the LNG plant needed to produce more LNG, adding an extra APCI train would be limited to an increase in the production by an extra 4 mtpa, not more or less, which might not be desired. 5- The Conoco Phillips Cascade has quicker start up and shut down rate than any other MRP. 6- It also contains 30% to 40% less overall instrumentation and control loops. 7- Having the Conoco Phillips Optimized Cascade in operation since 1969 also reduces costly testing, uncertainty, and risks. 8- There are a many Conoco Phillips Optimized Cascade trains constructed around the world and they will be ready for production soon. It is also expected that the Conoco Phillips Cascade Process will come close to the total APCI LNG production rate (in 2010: 35% for Phillips Cascade and 55% for APCI) according to the graph below,

40 Figure 32: Capacity of world LNG (mtpa) vs. year As a conclusion, studies of the different liquefaction processes suggest there is not one of them, on its own, that is substantially more efficient than the others. Rather, each technology can be competitive within a certain range of train sizes. The ultimate choice of which process to select will remain dependent on project-specific variables and the potential development state of novel processes.
41 Shipping There are two ships available; each of the ships has capacity of 138,000 m 3 with a speed average of 37 km/h. The distance from Lima (Peru) to Ensenda (Mexico) is 2734 miles, so that leads every ship to take about 5 days to travel between the liquefying plant and the receiving plant plus 1 day to load and unload. The liquefaction plant produces 27,520 ft 3 /day of LNG and 137,600 ft 3 /5 days, so 2 ships are only needed for this process. Taken a ship path to the Gulf of Mexico was considered but since the ship size exceeds the standards of the size of the Panama canal, going through it will cost more money and time. The following two table show the dimensions of the ship and the capacity of the Panama Canal, Table 16: Ship dimensions Capacity, m 3 138,000 Deadweight, tonnes 285 Length Overall, m 43 Beam, m 43 Depth, m 26 Maximum Draft, m 11.4 Ballast Draft, m 9.8 Table 17: Panama Canal Capacity Width, m 33.5 Length, m Beam, m 32.3 Depth, m 30 The ships are powered with a medium speed 4-stroke diesel engine, which is capable of providing fuel efficiency and operates on burning low pressure gas. It consumes 0.15% of the cargo through what vaporizes of the LNG and that adds up to consuming 2% of the LNG produces over the life of the project. Through research, it is also believed that this engine is better than other engines with a re-liquefaction unit, such as the 2 stroke diesel engine, because it deals with low pressure system which requires less power to operate than the engine with re-

42 liquefaction unit which ends up consuming more fuel than the regular engine. This engine is also environment friendly because it is equipped with a rapid oxidizer to dispose any excess boil off. Figure 33: Medium Speed Diesel Engine Receiving Plant Once the natural gas has been pumped from the ground, liquefied, and placed in a ship it is now time to deliver the natural gas to its destination and regasify it. This is done in what is called a receiving plant or regasification plant. Receiving plants are normally located near the ocean, either onshore or offshore. Both types have there advantages and disadvantages and careful consideration should be taken into account with regards to economics and the environment when a location and type of plant is proposed. Once it is decided where the regasification plant is to be erected, it is now time to design an economically feasible and energy efficient plant. There are many choices out there on how to get the liquefied natural gas back into its natural state, a vapor. Of these a process which is growing in popularity because of its cheap operating cost is the ambient air vaporizer, which is perfect for the proposed plant, due to location. The temperature of the air needs to be roughly 30 C higher than the outlet LNG, so during the winter months a supplemental heating system will need to be used to heat the LNG to a pipeline temperature of 40 F however this system will be minimally used. After the natural gas is vapor once again, it is pumped into the pipeline at a specified temperature and pressure, where it is sent to its consumers. Receiving Plant Design After the liquefied natural gas has made its long voyage from Lima, Peru to Baja, California, it is now time to turn it back into a gas. This is accomplished by means of a receiving plant. The


43 receiving plant has several different divisions, each with its on special purpose. These various divisions are as follows: docking port, storage, vapor handling system, send-out, vaporizing scheme, and pipeline injection. Docking Port The LNG ship will anchor down next to a jetty and connect itself to the unloading line by way of 4 unloading arms. Then submerged pumps from inside the ships LNG tanks will begin pumping the LNG at a specified unloading rate of 11,500 m 3 / hr into the unloading line on its way to the storage tank. Figure 34: Receiving Terminal Storage Tanks There are many tank designs to consider when choosing storage tanks to hold LNG, of these safety ranks among the top. When considering safety, there are 5 designs to choose from; single containment, double containment, full containment, in-ground storage, and underground storage. Figure 35: Tank Designs Of these, each has their advantages and disadvantages and bearing the location of the prospective plant an in-ground tank would be an excellent choice. The two main reasons to propose in-

44 ground tanks are because they are safer in earthquakes and less space is required because no dikes are needed. Also, in-ground tanks costs roughly the same as above-ground tanks and the construction time is nearly the same as well. 22 In-ground tanks are built in the following design. Figure 36: Tank Dimensions This design will minimize the space taken up by the tank in the regasification plant. Two tanks with a capacity of 125,000 m 3 will be used and they will cost $100 million dollars each. Vapor Handling System The vapor handling system is a very important part of an LNG receiving terminal for numerous reasons. Inside the storage tank vapor is formed when the LNG is pumped in. This vapor needs to be removed from the tank to make room for the liquid and to keep pressure from building up inside the tank. This is accomplished by pumping the vapor out the top of the tank by way of a blower. This blower will pump lbmol / hr of vapor out of the storage tank (Appendix 1). The estimated cost of this centrifugal blower will be $45, (Appendix 1). Of this lbmol / hr of vapor, 1219 lbmol / hr of this vapor is sent back to the ship s tanks to replace the vapor space pressure being lost due to liquid volume being pumped away. The other lbmol / hr of vapor is sent to a compressor and sent to the pipeline at a temperature of 40 F and a pressure of 200 psia. The work required by this centrifugal nickel alloy compressor is kw and its total cost is $2,000,000 (Appendix 1).

45 Send-Out The send-out system pumps the LNG from the storage tank into the vaporizer. This system is comprised of two sets of pumps, low pressure and high pressure. The low pressure pumps are located in the storage tank and pump the liquefied natural gas from the bottom to the top of the tank. Two pumps will be used per tank and they will cost $425,000. These pumps will increase the pressure of the LNG to 30 psia. The high pressure pumps increase the pressure of the LNG to the pipeline pressure of 200 psia and send it to the vaporizer. There will be 6 high pressure pumped and they will cost $1,100,000 each. Vaporizer The vaporizer network is what turns the liquefied natural gas back into a gas. Various processes are available to accomplish this task and there are pros and cons to each method. The following table summarizes the major vaporization processes used in industry today. 24 Table 18 : Vaporization Choice Comparisons 24 Vaporization Choice

46 These processes will be described in more detail below along with a scheme that will utilize the optimum choice in a way to recover the cold energy. The submerged combustion vaporization process is the cheapest with regards to capital cost but the annual operating cost is ridiculous and is surpassed by the others in total cost within a year or two. The following schematic illustrates how submerged combustion vaporization works. Figure 37: Submerged Combustion 24 Submerged combustion vaporizers use a combustion burner to ignite a mixture of fuel gas and air, which then heats a water bath with submerged tube bundles. The water then provides the heat to the LNG to vaporize it. As shown in the table above, submerged combustion vaporization produces a lot of environmental emissions. The open rack vaporization process is the most expensive in capital cost but its operating cost is far less than the submerged combustion vaporization process. Here is a schematic of open rack vaporization. Figure 38: Open Rack 24 Open rack vaporization uses sea water to vaporize the LNG by using counter current flow through finned aluminum tubes. Since seawater is corrosive, a zinc alloy coating is used on the outside of these tubes. As shown in the table above, open rack vaporization produces very little environmental emissions as composed to submerged combustion vaporization.

47 The heat integrated ambient air vaporization processes are the cheapest in both capital and operating cost and they both have the fewest emissions, making them the optimum choice. They work in the following way. Figure 39: Ambient Air 24 The difference between the two is if the air is forced through the heat exchanger or not. Since in natural draft there has to always be a strong wind, the project s vaporization system will be forced draft heat integrated ambient air vaporization. For this process the ambient air is blown through a large heat exchanger and is used to heat the LNG. The temperature of the air should be about a 30 F difference from the desired pipeline temperature of 40 F. The ambient air in Baja Mexico is above 70 F most of the year, but for the days that it isn t, supplemental heating will be required. Since the duty of this heat exchanger will be minimal compared to the others, an electrical heater will be used to heat the air to its final temperature of at least 70 F. The following figure illustrates a process to recover some of the cold energy by using ambient air vaporization and an intermediate fluid.
48 Figure 40: Energy Recovery Process In this process, ambient air heats a heat transfer fluid, which in turn vaporizes the LNG by way of a reverse refrigeration cycle. In this cycle, the fluid is expanded through an expander, which is connected to a generator that produces energy. A liquid was needed so a pump could be used instead of a compressor. Several fluids were considered but the four that worked the best were propylene glycol, propanol, isopropanol, and methanol. These fluids were chosen because of the following reasons. A liquid was needed that had a boiling point greater than 75 F and also a freezing point that was as low as possible. These liquids also allowed a lower pressure to be used, maximum of 100 psia. The following table compares the four best fluids. Table 19: Intermediate Liquids Comparison Intermediate Liquids Used Methanol Propanol Isopropanol Propylene Glycol Boiling Point (14.7 psia) (F) Melting Point (14.7 psia) (F) Hottest Temperature Used (F) Coldest Temperature Used (F) Flow Rate of Air (lbmol / hr) Flow Rate of Liquid (lbmol / hr) Pump Work Used (hp) Expander Work Produced (hp) Net Work (hp) Approximate Amount of Energy used to Liquefy Natural Gas (hp) Amount of Energy Recovered (hp) Amount Recovered vs. Amount used to Liquefy (%) Of these liquids methanol is the optimum choice because it has the lowest freezing point of -144 F, and it also produces the most net energy at hp. This energy recovered only equates to about 2.5 % of the energy that was used to liquefy the natural gas but any energy recovered is better than energy lost. The extra capital cost of this process on top of the ambient air vaporization cost would be $4,600,000, which is a fairly small fraction of the overall cost. Several other choices for a heat transfer fluid were tried. Methane was used as in the following Pro-II simulation.
49 Figure 41: Methane Process The problem with methane is that it will not be a liquid at 75 F no matter how much you increase the pressure. Because of this, a compressor will have to be used instead of a pump, which will mean a larger amount or work being used. Butane was also used as in the following simulation. Figure 42: Butane Process The problem with butane is that a higher maximum pressure will have to be used and the freezing point is much higher at 32 F. This high freezing point causes a much greater amount of butane to be used, as compared to methanol. Other ways to utilize the cold energy would be to integrate the receiving plant with a cryogenic plant or chemicals plant. Both of these plants would use the cold energy to freeze something,
50 which would work very well. The drawbacks to these though are there needs to be a market close by and another plant would greatly increase the cost. Pipeline Injection The specifications for the pipeline are a temperature of F and a pressure of psia. The proposed plant will inject natural gas into the pipeline at 40 F and 200 psia. 4 Economics This project is limited by the economics and the Total Capital Investment involved in the construction of a transcontinental pipeline as well as the liquefaction facility. Capital investments were determined using a percentage of the purchased equipment cost method as described in Peters and Timmerhaus 26. Product costs were also determined using the compressor work for both the pipeline and liquefaction equipment. The work was then equated to an amount of natural gas needed to furnish the energy requirements. This total was added to the amount of natural gas needed to produce the desired mass of LNG from the liquefaction facility. Capital and operating costs will be further discussed in their respective sections below. Capital Investments Capital investments for this project are quite large, on the order of $3.11 billion. Further analysis and breakdown of individual cost components can be seen in the following sections. It is worthy to note that the installation of the transcontinental pipeline accounts for nearly half of the Total Capital Investment for this venture. Also, as will be discussed later, the pipeline accounts for about half of the total power consumption for the process, which requires the purchase of additional natural gas. Liquefaction From the ConoccoPhillips Optimized Cascade described earlier, a list of major equipment components was sized and priced. The major components include compressors, flash tanks, and LNG heat exchangers. Prices for compressors were estimated as $2500/hp (Hubbard). Additionally, flash tanks were priced from the Peters and Timmerhaus website. The cost of each flash was determined to be approximately $120,000 each based on the cost of pressure vessels with the given capacity. LNG heat exchangers were priced based on estimate. The estimate took into the size of the exchangers as well as their special purpose; the price was therefore determined to be $1.5 million each. The following table illustrates the major components of the liquefaction facility as well as the costs for each. Table 20: Liquefaction equipment costs

51 Once the equipment costs for the process were known further charges could be assessed to determine the Total Capital Investment, TCI, of the project. The following table shows the TCI for the liquefaction facility. Table 21: TCI for liquefaction facility The table, adapted from Peters and Timmerhaus estimates the TCI for installing the liquefaction facility to be on the order of $1.5 billion. Reports published by ConnocoPhillips have determined the price to be near this figure; therefore this approximation is seen to be valid. Shipping Also to be considered in the capital investments for this project was the transportation of the LNG to the regasification terminal located in Ensenada, Mexico. For this purpose two LNG ships with 138,000 m 3 of storage capacity were considered for purchase. The ships were estimated by the Department of Energy, DOE, to be on the order of $155 million each. Pipeline The pipeline running from Santa Cruz, Bolivia to Lima, Peru is one of the most costly additions to this venture. The optimum pipeline discussed earlier was found to have a purchase cost for materials of $714 million. This expense does not, however, include the cost of installing the pipeline through Bolivia, over the Andes Mountains and across Peru. A conservative estimate for this charge equal to 75% of the purchased equipment price was added to the cost to compensate. With the additional charge placed on the pipeline, the TCI was found to be $1.25 billion. As can be seen, this is nearly half of the TCI for the entire project. Further economic analysis will show that this charge contributes significantly to the overall costs of the venture and will inevitably cause the project to become infeasible under most conditions.
52 Product Costs There are many charges associated with developing and installing any commercial processing plant. Those that contribute most dramatically to the costs are raw materials, labor, and maintenance. Additionally, the pipeline erected for this project consumes on the order of 2% of the total energy of the natural gas used in the process for compression purposes. Costs will be broken down in the following sections to show the relative charge of each area. Raw Materials Raw material makes up the majority of the product cost associated with this process. 4.5 mtpa LNG corresponds to a volume of natural gas equal to x10 6 MMBtu worth of thermal energy. At present natural gas costs on the order of five dollars per MMBtu. This equates to a cost of roughly one billion dollars, or approximately 63% of the Total product cost. In addition to the cost for natural gas to be liquefied, there is also an additional amount of natural gas needed to fuel the compressors on the pipeline and in the liquefaction facility. The amount of natural gas needed to power the pipeline was calculated to be 2.01x10 6 MMBtu/yr, or approximately 1% of the amount needed to produce LNG. In the liquefaction facility, the compressors will also use natural gas for power. The amount needed, according to the simulation, to power the compressors, was calculated to be 6.12x10 6 MMBtu/yr, or about 3% of the energy in the produced LNG. The total raw material cost associated with the purchase of natural gas is therefore found to be roughly 65% of the TPC. Other Costs The remaining 35% of the costs for this process are composed mostly of maintenance and overhead costs. Maintenance comprises 12% of the costs and the overhead makes up 7% of the total. The following table shows the first year costs of the project with a five dollar base charge for the price of natural gas. Table 22: Summary of costs
53 The total product cost, as can be seen above, is $1.85 billion for the first year. The following years have higher costs due to the inflation in natural gas prices.there are also additional charges and costs in future years if additional trains are implemented. This will be discussed further in the Design Planning section of this report where alternate installation schemes were explored in order to find a plan for the implementation of the process that would return higher yields. Design Planning For this portion of the project several plans were compared based on the return on investment for each. To compare each of the plans, several scenarios had to also be used. The following table shows the plans and the scenarios used in the comparison. Table 23: Design planning, scenarios and plans The scenarios described above by high, low and medium, refer to the percentage of inflation in the buying and selling prices respectively. The inflation rates used for the high, low and medium scenarios are 13%, 5% and 9% respectively. Each of the plans showed positive net present worth for the High/Low scenario with an ROI ranging from 30-60%. These values of the ROI are very respectable, but in the event that this scenario does not occur, nearly all of the plans fail to return a positive NPW. A regret analysis need be conducted to determine the best plan of action to implement the LNG production facility. Regret Analysis To determine the best plan to implement regret analysis is performed. Regret analysis allows for the determination of the best design by comparing the ROI of each of the designs. The highest ROI for each of the scenarios is chosen and the other designs ROIs are subtracted from it. This number is essentially the additional amount of money that could have been had the greatest ROI design been chosen. From this, the maximum regret is selected for each design and is compared to that of the other designs. The minimum of the maximum regrets should be selected to reduce the probability of losing money on a design. The following table shows the ROI for each of the plans for each of the scenarios described above. The highlighting represents the maximum for each of the scenarios, this is the value used to compare the other designs as described above.


54 Table 24: ROI for design plans Once these values are found, the maximum regret for each of the scenarios can be determined and used to develop the following table of regret values. The table is then analyzed to determine the maximum regret for each of the designs. The minimum of the maximum regrets, labeled MiniMax in the table, is the design plan chosen due to its minimizing effect on the loss of money. Table 25: Regret analysis Although design 1 has more chances for receiving zero regret, design 4 is chosen because the maximum regret is only 6% ROI whereas design 1 has the potential of producing regret as high as 54% ROI. As clarification, the ROI is used to determine the regret due to the large differences in the TCI of each plan. This is used to scale the NPW such that each plan can be evaluated on similar terms. It is frequently said that you must spend money to make money. This is ultimately true, therefore one would assume that the more money spent, the more will be made. By showing the regret as a function of the ROI instead of the NPW, this anomaly is avoided and each of the designs can be evaluated on the percentage of monies received as a function of those spent. Once the design that minimizes regret is selected risk analysis can be performed to determine the probability that the chosen design will actually produce a positive NPW. Risk Analysis The risk analysis for this project is conducted coupled with Microsoft Excel. The software allows the user to input variables into the model based on normal distributions. The output for this simulation is the NPW. 10,000 iterations were used to determine the distribution in the NPW with changes in the prices. The simulation uses the median prices mentioned earlier as the basis with 30% variability for each price, both buying and selling. The costs and profits are then determined and the NPW calculated for each iteration. The software outputs a histogram
55 for the NPW as well as a cumulative probability distribution. The cumulative distribution, as shown below, is invaluable to determine the total risk of a project Distribution for NPW/D27 Mean= E Values in Billions 5% 90% 5% Figure 43: Risk associated with design 4 The figure above shows that despite a positive NPW and ROI for the High/Low scenario discussed in the Regret Analysis section shows that the venture is still quite risky. The figure shows that there is approximately 90% chance that the design plan will still lose money during the life of the project.
56 Conclusion A two in-one Conoco Phillips Cascade with a capacity of 4.5 mtpa located in Lima (Peru) is found to be the best economical choice for this process. Two 138,000 m 3 ships are all what is needed for this project with two 125,000 m 3 capacity LNG storage at the liquefaction plant. The regasification plant is found to be a Forced Draft Ambien Air located in Ensenada (Mexico). A pipeline is constructed from the regasification plant to San Diego, which is the main buyer, and another pipe line is constructed to Guaymas (Mexico) in case the market demand in California is low. The process has been found, however, to be infeasible under most conditions with a 90% probability of returning a negative NPW. This is due, in part to the high TCI and operating costs associated with the implementation of a pipeline from Bolivia to Peru through the Andes Mountains.
57 References 1. Alaska Natural Gas Development Agency 2. Gas Pre-treatment and their Impact on Liquefaction Processes, Klinkenbijl et. al 3. Adsorption Processes for Natural Gas Treatment, A Technology Update 4. ts=both 5. Natural gas liquefaction process designers look for larger, more efficient liquefaction plants, Avidan, Amos et. al 6. DTI, Energy Industries and Technology Units 7. Processes and Pump Services in the LNG Industry, Coyle, David and Patel, Vinod 8. SPE Distinguished Lecture Series 9. Statoil Cold Box 10. Nov./Dec issue of the LNG Journal %20natural%20gas%20pipeline%20in%20mexico tura~6858.html LNG Tanker Market Report, June A Crest of Wave, The British Trader 20. LNG in the Americas, Summary Report and Analysis 21. LNG Economics and Technology, LNG Receiving Terminal Design is Different. D. B. Crawford and C. A. Durr.
58 LNG vaporization a fresh approach as ambient air vaporization technology is integrated with waste heat recovery, Martin J Rosetta, Brian C Price, and Lyn Himmelberger. LNG Journal September 2005 page LNG Industry Costs Declining Department of Energy. Energy Information Administration Report.


59 Appendix 1 Pipeline, Shipping and Regasification Calculations Pipeline These calculations were done in order to get a base estimate for the costs and diameters needed for the pipeline. Simulations were run with Pro/II to determine more accurately the costs and power requirements for this part of the project Flow Rate Thickness

60 Power needed to pump the gas,

61 Optimum Diameter Calculation
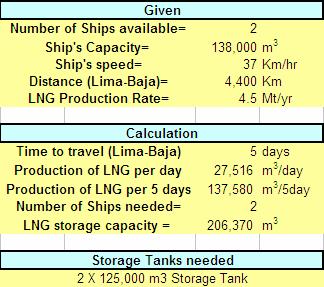
62 Shipping

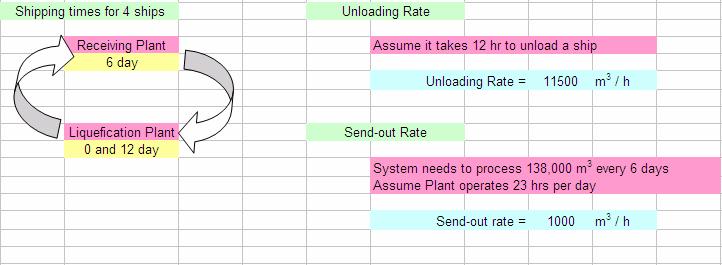
63 Regasification Unloading rate
REFRIGERATION CYCLES
 REFRIGERATION CYCLES Carnot Cycle We start discussing the well-known Carnot cycle in its refrigeration mode. Figure 2-1: Carnot Cycle In this cycle we define the coefficient of performance as follows:
Chemistry of Petrochemical Processes
 Chemistry of Petrochemical Processes ChE 464 Instructor: Dr. Ahmed Arafat, PhD Office: building 45 room 106 E-mail: akhamis@kau.edu.sa www.kau.edu.sa.akhamis files Book Chemistry of Petrochemical Processes
Simple Dew Point Control HYSYS v8.6
 Simple Dew Point Control HYSYS v8.6 Steps to set up a simulation in HYSYS v8.6 to model a simple dew point control system consisting of: Gas chiller Flash separator Liquid stabilizer with gas recycle &
Improving Natural Gas Liquefaction Plant Performance with Process Analyzers
 Process Analytics Improving Natural Gas Liquefaction Plant Performance with Process Analyzers LNG is natural gas in its liquid state with high energy density, which makes it useful for storage and transportation
MOLECULAR GATE TECHNOLOGY FOR (SMALLER SCALE) LNG PRETREATMENT
 LNG PRETREATMENT") MOLECULAR GATE TECHNOLOGY FOR (SMALLER SCALE) LNG PRETREATMENT Presented at the 2010 Gas Processors 89 th Annual Convention Austin, TX March, 2010 Michael Mitariten, P.E. Guild Associates, Inc. Dublin,
MOLECULAR GATE TECHNOLOGY FOR (SMALLER SCALE) LNG PRETREATMENT Presented at the 2010 Gas Processors 89 th Annual Convention Austin, TX March, 2010 Michael Mitariten, P.E. Guild Associates, Inc. Dublin,
Modular Oil & Gas Equipment Onshore & Offshore
 Modular Oil & Gas Equipment Onshore & Offshore Separators & Desalters AI Energy Solutions onshore and offshore oil process solutions offer innovative technologies packaged with global project management
SIMULATION AND SENSITIVITY ANALYSIS OF A MIXED FLUID CASCADE LNG PLANT IN A TROPICAL CLIMATE USING A COMMERCIAL SIMULATOR
 SIMULATION AND SENSITIVITY ANALYSIS OF A MIXED FLUID CASCADE LNG PLANT IN A TROPICAL CLIMATE USING A COMMERCIAL SIMULATOR Gianfranco Rodríguez 1, Fabiana Arias 1, Maria G. Quintas 1, Alessandro Trigilio
NOVEL SCHEME FOR SMALL SCALE LNG PRODUCTION in POLAND. W.H. Isalski
 NOVEL SCHEME FOR SMALL SCALE LNG PRODUCTION in POLAND W.H. Isalski Presentation Overview The history of gas de-nitrogenation in Poland Changes in feed gas Changes in market conditions Expanding market
Qualitative Phase Behavior and Vapor Liquid Equilibrium Core
 2/22/2017 Qualitative Phase Behavior and Qualitative Phase Behavior Introduction There are three different phases: solid, liquid, and gas (vapor) Energy must be added to melt a solid to form liquid If
LNG UNIT (ENGINEERING DESIGN GUIDELINE)
") Page : 1 of 60 Guidelines for Processing Plant www.klmtechgroup.com Rev 01 KLM Technology #03-12 Block Aronia, Jalan Sri Perkasa 2 Taman Tampoi Utama 81200 Johor Bahru Malaysia (ENGINEERING DESIGN GUIDELINE)
Page : 1 of 60 Guidelines for Processing Plant www.klmtechgroup.com Rev 01 KLM Technology #03-12 Block Aronia, Jalan Sri Perkasa 2 Taman Tampoi Utama 81200 Johor Bahru Malaysia (ENGINEERING DESIGN GUIDELINE)
INCREASING THE CAPACITY OF NGL RECOVERY TRAINS. Stéphane MESPOULHES XVI CONVENCIÓN INTERNACIONAL DE GAS Caracas de Mayo de 2004
 INCREASING THE CAPACITY OF NGL RECOVERY TRAINS Stéphane MESPOULHES XVI CONVENCIÓN INTERNACIONAL DE GAS Caracas WHO IS TECHNIP? 2 World Class Engineering & Construction Group in Oil & Gas Public Company
LNG Facts A Primer. Presentation before US Department of Energy, Office of Fossil Energy, LNG Forums. March 10, Kristi A. R.
 LNG Facts A Primer Presentation before US Department of Energy, Office of Fossil Energy, LNG Forums March 10, 2006 Kristi A. R. Darby Center for Louisiana State University Overview What is Natural Gas?
Natural Gas. and the Liquefaction Process
 Natural Gas and the Liquefaction Process Table of Contents Cameron LNG.................... 2 Liquefied Natural Gas................ 4 LNG Safety...................... 5 Environmental Safety................
HYSYS WORKBOOK By: Eng. Ahmed Deyab Fares.
 HYSYS WORKBOOK 2013 By: Eng. Ahmed Deyab Fares eng.a.deab@gmail.com adeyab@adeyab.com Mobile: 002-01227549943 - Email: adeyab@adeyab.com 1 Flash Separation We have a stream containing 15% ethane, 20% propane,
PROCESSING NATURAL GAS Leontev A.A. Vladimirskiy State University named after the Stoletov brothers Vladimir, Russia
 PROCESSING NATURAL GAS Leontev A.A. Vladimirskiy State University named after the Stoletov brothers Vladimir, Russia ПЕРЕРАБОТКА ПРИРОДНОГО ГАЗА Леонтьев А.А. Владимирский государственный университет имени
UNIQUE DESIGN CHALLENGES IN THE AUX SABLE NGL RECOVERY PLANT
 UNIQUE DESIGN CHALLENGES IN THE AUX SABLE NGL RECOVERY PLANT Presented at the 81 st Annual Convention of the Gas Processors Association March 11, 2002 Dallas, Texas Joe T. Lynch, P.E. Ortloff Engineers,
ADVANCED PROCESS CONTROL QATAR GAS ONE YEAR EXPERIENCE
 ADVANCED PROCESS CONTROL QATAR GAS ONE YEAR EXPERIENCE Bouchebri El-Hadi Senior Process Engineer Benmouley Abdelkader Head of Process Qatar Liquefied Gas Company Limited. Ras Laffan Industrial Area, Doha,
Estimation of Boil-off-Gas BOG from Refrigerated Vessels in Liquefied Natural Gas Plant
 International Journal of Engineering and Technology Volume 3 No. 1, January, 2013 Estimation of Boil-off-Gas BOG from Refrigerated Vessels in Liquefied Natural Gas Plant Wordu, A. A, Peterside, B Department
Optimising. the LNG process. The rapidly expanding global LNG industry continues. Projects
 Optimising the LNG process John Baguley, Liquefied Natural Gas Ltd, Australia, outlines the benefits of an innovative liquefaction process technology for mid scale LNG projects. The rapidly expanding global
Yemen LNG Operational feedbacks
 Yemen LNG Operational feedbacks APCI Owners Seminar XI September 2013 1 Yemen LNG - Agenda 1. Yemen LNG general presentation 2. Feedback on Plant restarts optimization 3. Other operational feedbacks 2
Teknologi Pemrosesan Gas (TKK 564) Instructor: Dr. Istadi (http://tekim.undip.ac.id/staf/istadi )
 Instructor: Dr. Istadi (http://tekim.undip.ac.id/staf/istadi )") Teknologi Pemrosesan Gas (TKK 564) Instructor: Dr. Istadi (http://tekim.undip.ac.id/staf/istadi ) Email: istadi@undip.ac.id id Instructor s t Background BEng. (1995): Universitas Diponegoro Meng. (2000):
Teknologi Pemrosesan Gas (TKK 564) Instructor: Dr. Istadi (http://tekim.undip.ac.id/staf/istadi ) Email: istadi@undip.ac.id id Instructor s t Background BEng. (1995): Universitas Diponegoro Meng. (2000):
Gastech Singapore October Capital Cost and Efficiency Data for the ZR-LNG Dual Methane Expander Liquefaction Technology
 Gastech Singapore October 2015 Capital Cost and Efficiency Data for the ZR-LNG Dual Methane Expander Liquefaction Technology Authors: GW Howe, GF Skinner, AD Maunder Presenter: GW Howe Introduction LNG
SPE DISTINGUISHED LECTURER SERIES is funded principally through a grant of the SPE FOUNDATION
 SPE DISTINGUISHED LECTURER SERIES is funded principally through a grant of the SPE FOUNDATION The Society gratefully acknowledges those companies that support the program by allowing their professionals
OUR CONVERSATION TODAY
 OUR CONVERSATION TODAY Our goal is to raise the level of awareness around the natural gas supply chain among key stakeholders in order to facilitate positive working relationships and more informed decision
LNG LIQUEFIED NATURAL GAS TECHNOLOGIES
 LNG LIQUEFIED NATURAL GAS TECHNOLOGIES Air Liquide Group Air Liquide Engineering & Construction The world leader in gases, technologies and services for Industry and Health Air Liquide is present in 80
Hydrate Formation in Chevron Mabee Unit for NGL Recovery and CO 2 Purification for EOR. Abstract
 Hydrate Formation in Chevron Mabee Unit for NGL Recovery and CO 2 Purification for EOR Abstract In the early 199 s, Chevron installed a new process to recover natural gas liquids (NGLs) from recycled CO
DESIGN ANALYSIS OF A REFRIGERATED WAREHOUSE USING LNG COLD ENERGY
 , Volume 4, Number 1, p.14-23, 2003 DESIGN ANALYSIS OF A REFRIGERATED WAREHOUSE USING LNG COLD ENERGY K.H. Yang and S.C. Wu Mechanical Engineering Department, National Sun Yat-Sen University, Kaohsiung,
Evolution of an LNG Terminal: Senboku Terminal of Osaka Gas
 23 rd World Gas Conference, Amsterdam 2006 Evolution of an LNG Terminal: Senboku Terminal of Osaka Gas Main author Toshiro Otsuka Japan TABLE OF CONTENTS 1. Abstract 2. Body of Paper 3. List Tables 4.
MLNG DUA DEBOTTLENECKING PROJECT
 MLNG DUA DEBOTTLENECKING PROJECT Yahya Ibrahim Senior General Manager Malaysia LNG Malaysia yahyai@petronas.com.my Tariq Shukri LNG Consultant Foster Wheeler Energy Limited Reading, U.K. Tariq_shukri@fwuk.fwc.com
OPTIMISATION OF ANGLO PLATINUM S ACP ACID PLANT CATALYTIC CONVERTER. M. K. SICHONE Anglo Platinum, ACP, Kroondal, South Africa
 OPTIMISATION OF ANGLO PLATINUM S ACP ACID PLANT CATALYTIC CONVERTER Anglo Platinum, ACP, Kroondal, South Africa ABSTRACT Anglo Platinum s Waterval smelting complex based in South Africa operates the Anglo
Fluid Mechanics, Heat Transfer, Thermodynamics Design Project. Production of Ethylbenzene
 Fluid Mechanics, Heat Transfer, Thermodynamics Design Project Production of Ethylbenzene We continue to investigate the feasibility of constructing a new, grass-roots, 80,000 tonne/y, ethylbenzene facility.
GT-LPG Max SM. Maximizing LPG Recovery from Fuel Gas Using a Dividing Wall Column. Engineered to Innovate
 GTC Technology White Paper GT-LPG Max SM Maximizing LPG Recovery from Fuel Using a Dividing Wall Column Engineered to Innovate GT-LPG Max SM Maximizing LPG Recovery from Fuel Using a Dividing Wall Column
LNG Plant Overview. Seminar with Supplier Association Murmanshelf Murmansk, 15 May 2012 Jostein Pettersen
 LNG Plant Overview Seminar with Supplier Association Murmanshelf Murmansk, 15 May 2012 Jostein Pettersen Table of Content Part 1 : LNG plant overview (Jostein) Part 2 : Main equipment units (Jostein) Part
Increasing Sales Gas Output from Glycol Dehydration Plants Trina Dreher, SPE, Courtney Hocking, Michael Cavill and Adam Geard, Process Group Pty. Ltd.
 SPE-171415-MS Increasing Sales Gas Output from Glycol Dehydration Plants Trina Dreher, SPE, Courtney Hocking, Michael Cavill and Adam Geard, Process Group Pty. Ltd. Copyright 2014, Society of Petroleum
GROWTH OF LNG GAS MARKET AS ALTERNATIVE FUEL IN TRANSPORT
 RESEARCH JOURNAL OF THE UNIVERSITY OF GDAŃSK Transport Economics and Logistics Vol. 71 (2017) DOI 10.5604/01.3001.0010.5727 Adam Bogusz Department of Finance and Management in Bydgoszcz, WSB University
Inland Technologies Inc
 Inc Evaluation of the Mono-ethylene Glycol [MEG] Concentrator to Recycle MEG used in Hydrate Prevention March 2007 Document Nr 0035_INL-OPT-REP-001 Client : Inland Technologies Inc Project : Evaluation
AKAKUS OIL OPERATIONS- LIBYA Gas Utilization& Flare Emission Reduction Project
 Tripoli, Libya 2010 AKAKUS OIL OPERATIONS- LIBYA Gas Utilization& Flare Emission Reduction Project Presented by: Mohamed Amari Project Location Tripoli, Libya 2010 N Tunisia Tripoli Mediterranean Sea Benghazi
Regasification N. Atlantic
 North Atlantic Basin LNG Week in Review 1 The report is for the week ending December 13. Table 1 to the right tracks 2013 LNG consumption in the Atlantic Basin through December 13 versus the same time
Problems at the Cumene Production Facility, Unit 800
 Problems at the Cumene Production Facility, Unit 800 Background Cumene (isopropyl benzene) is produced by reacting propylene with benzene. During World War II, cumene was used as an octane enhancer for
REPORT TO: PREPARED BY:
 REPORT TO: THE CONGRESSIONAL TASK FORCE ON ECONOMIC GROWTH IN PUERTO RICO PREPARED BY: SEAONE CARIBBEAN, LLC AUGUST 9, 2016 Jan-19 Aug-19 Mar-20 Oct-20 May-21 Dec-21 Jul-22 Feb-23 Sep-23 Apr-24 Nov-24
Heat Recovery Systems and Heat Exchangers in LNG Applications. Landon Tessmer LNG Technical Workshop 2014 Vancouver
 Heat Recovery Systems and Heat Exchangers in LNG Applications Landon Tessmer LNG Technical Workshop 2014 Vancouver Presentation Overview LNG plant arrangement with heat recovery (OSMR Process by LNG Limited)
A Comparative Study of Propane Recovery Processes
 A Comparative Study of Propane Recovery Processes Kent A. Pennybaker, Scott E. Wolverton, Steven W. Chafin, Thomas R. Ruddy River City Engineering, Inc. Lawrence, Kansas ABSTRACT There are many processes
The U.S Market for Liquid Natural Gas: Better Out than In Natasha Allen HSA10-5 The Economics of Oil and Energy April 4, 2013
 The U.S Market for Liquid Natural Gas: Better Out than In Natasha Allen HSA10-5 The Economics of Oil and Energy April 4, 2013 I. Introduction Over the past couple of decades, the natural gas economy in
Evaluation of Hydrogen Production at Refineries in China. The new UOP SeparALL TM Process. Bart Beuckels, UOP NV
 Evaluation of Hydrogen Production at Refineries in China The new UOP SeparALL TM Process Bart Beuckels, UOP NV IChemE Gasification Conference March 12, 2014 Rotterdam, the Netherlands 1914-2014 A Century
Solvent Recovery Systems
 Solvent Recovery Systems Use Steam Recycling A new technique that recycles the heat normally lost during solvent recovery can cut fuel bills and reduce plant exhaust emissions. by Stanley J. Macek Compliance
DESIGN AND OPERATING EXPERIENCE FOR ANADARKO S LANCASTER FACILITY
 DESIGN AND OPERATING EXPERIENCE FOR ANADARKO S LANCASTER FACILITY Presented at the 95 th Annual Convention of the Processors Association April 11, 2016 New Orleans, Louisiana Joe T. Lynch, P.E. Ortloff
Large LNG plant capabilities for capacity >2 MTPA Benefit from economies of scale and proven technology
 Large LNG plant capabilities for capacity > MTPA Benefit from economies of scale and proven technology Benefits to our customers: Economical Production Air Products natural gas liquefaction processes and
GAS CONDITIONING FOR GAS STORAGE INSTALLATIONS
 GAS CONDITIONING FOR GAS STORAGE INSTALLATIONS Grant Johnson, Adrian Finn and Terry Tomlinson, Costain Oil, Gas & Process Ltd., UK, discuss process technology to meet water and hydrocarbon dew point specifications
GTI Small-Scale Liquefier Technology. March 2013
 GTI Small-Scale Liquefier Technology March 2013 GTI Liquefier System > Proven technology in use at 13,000-30,000 gpd > Optimized for energy efficiency > System well suited to rapid start-up and frequent
A Study on Re-liquefaction Process of Boil-off Gas of LCO 2 Transfer Ship
 A Study on Re-liquefaction Process of Boil-off Gas of LCO 2 Transfer Ship Yeongbeom Lee, Sanggyu Lee, Youngsoon Sohn, Kyusang Cha Korea Gas Corporation R&D Division 364, SongDo-Dong, Yeonsu-Gu, Incheon-City,
Magnetically Coupled Submerged Cryogenic Pumps and Expanders for Ammonia Applications
 Paper 4d Magnetically Coupled Submerged Cryogenic Pumps and Expanders for Ammonia Applications Liquefied Ammonia, or Liquid NH3, is (like LNG or liquefied natural gas) a cryogenic fluid and production
Fluid Mechanics, Heat Transfer, Fluid Mechanics Design Project. Production of Ethanol
 Fluid Mechanics, Heat Transfer, Fluid Mechanics Design Project Production of Ethanol Your assignment is to continue evaluating the details of a process to produce 30,000 tonne/y of ethanol from ethylene.
LIQUEFACTION STORAGE DISTRIBUTION BUNKERING SMALL-SCALE LNG SOLUTIONS
 LIQUEFACTION STORAGE DISTRIBUTION BUNKERING SMALL-SCALE LNG SOLUTIONS During the last decade, liquefied natural gas (LNG) has become the new black in the gas industry and recognising its huge market potential,
Life cycle analysis of thermosyphon solar water heaters
 Life cycle analysis of thermosyphon solar water heaters Soteris A. KALOGIROU Department of Mechanical Engineering and Materials Sciences and Engineering Cyprus University of Technology, P. O. Box 50329,
Development status of the EAGLE Gasification Pilot Plant
 Development status of the EAGLE Gasification Pilot Plant Gasification Technologies 2002 San Francisco, California, USA October 27-30, 2002 Masaki Tajima Energy and Environment Technology Development Dept.
Gas Processing. Speed. Simplicity. Efficiency Modular Gas Processing Plants
 Gas Processing Speed. Simplicity. Efficiency Modular Gas Processing Plants The Golden Age of Gas Over the next decade, global gas use will rise by more than 20% and will account for almost one quarter
Gas Processing. Speed. Simplicity. Efficiency Modular Gas Processing Plants
 Gas Processing Speed. Simplicity. Efficiency Modular Gas Processing Plants The Golden Age of Gas Over the next decade, global gas use will rise by more than 20% and will account for almost one quarter
Fluid Mechanics, Heat Transfer, Thermodynamics. Design Project. Production of Ammonia
 Fluid Mechanics, Heat Transfer, Thermodynamics Design Project Production of Ammonia Your assignment is to continue evaluating the details of a process to produce 50,000 tonne/y of ammonia from a syngas
Fluid Mechanics, Heat Transfer, Thermodynamics Design Project. Production of Styrene
 Fluid Mechanics, Heat Transfer, Thermodynamics Design Project Production of Styrene The feasibility of constructing a new, grass-roots, 100,000 tonne/y, styrene plant is being investigated. As part of
a comparative study of secondary glycol and direct expansion refrigeration systems
 a comparative study of secondary glycol and direct expansion refrigeration systems Second Nature Medium-Temperature secondary systems have been widely applied in commercial refrigeration since their introduction
HOW TO SELECT BEST MEG RECOVERY UNIT s CONFIGURATION?
 HOW TO SELECT BEST MEG RECOVERY UNIT s CONFIGURATION? PAPER PRESENTED AT GPA EUROPE Madrid, 17 th - 19 th September, 2014 Jérémie ESQUIER PROSERNAT Paris, France PROSERNAT Mr Jérémie ESQUIER - Business
COMPLETING THE LNG VALUE CHAIN
 COMPLETING THE LNG VALUE CHAIN Reidar Strande, Director, LNG, Wärtsilä Oil & Gas Systems Tord Johnsson, Area Business Development Manager, Oil and Gas Business, Wärtsilä Power Plants [ ENERGY & MARINE
Kalex Kalina Cycle Power Systems For Use as a Bottoming Cycle for Combined Cycle Applications
 Superior Efficiency Reduced Costs Viable Alternative Energy Kalex Kalina Cycle Power Systems For Use as a Bottoming Cycle for Combined Cycle Applications Copyright 2009, 2010, Kalex LLC. Kalex LLC's Kalina
GUIDANCE DOCUMENT April 6, Guidance on Estimating Condensate and Crude Oil Loading Losses from Tank Trucks
 OKLAHOMA DEPARTMENT OF ENVIRONMENTAL QUALITY AIR QUALITY DIVISION GUIDANCE DOCUMENT April 6, 207 SUBJECT: Guidance on Estimating Condensate and Crude Oil Loading Losses from Tank Trucks SECTION I. INTRODUCTION
Material Balances Design Project Manufacture of Diethyl Ether
 Material Balances Design Project Manufacture of Diethyl Ether Diethyl ether (DEE) is a colorless, highly volatile, flammable liquid with a characteristic odor. It is an important solvent in the production
Pivotal LNG Natural Gas Fuel for Heavy Duty Trucks. David Jaskolski Senior Account Manager
 Pivotal LNG Natural Gas Fuel for Heavy Duty Trucks David Jaskolski Senior Account Manager Forward Looking Statements Forward-Looking Statements Certain expectations and projections regarding our future
FT-GTL UNLOCKS VALUE FROM NATURAL GAS
 FT-GTL UNLOCKS VALUE FROM NATURAL GAS Doug Miller Michael Goff Black & Veatch Corporation Ken Agee Emerging Fuels Technology April 2017 Introduction An estimated 147 billion cubic meters of gas was flared
Application of a cooling tower model for optimizing energy use
 Advances in Fluid Mechanics X 305 Application of a cooling tower model for optimizing energy use G. C. O Mary & D. F. Dyer Department of Mechanical Engineering, Auburn University, USA Abstract The overall
ADECOS II. Advanced Development of the Coal-Fired Oxyfuel Process with CO 2 Separation
 Fakultät Maschinenwesen Institut für Energietechnik, Professur für Verbrennung, Wärme- & Stoffübertragung ADECOS II Advanced Development of the Coal-Fired Oxyfuel Process with CO 2 S. Grahl, A. Hiller,
11/18/2011. Moderate demand increase High depletion rate. Alfa Laval 1. Sammy Hulpiau Segment Manager Energy & Environment. mb/d.
 Oil & Gas Sammy Hulpiau Segment Manager Energy & Environment Oil production investments are rapidly growing mb/d 120 100 80 60 NGLs Unconventional oil Crude oil fields yet to be developed or found Crude
ABSTRACT. Christopher Somers, Masters of Science, Dr. Reinhard Radermacher, Mechanical Engineering
 ABSTRACT Title of Document: SIMULATION OF ABSORPTION CYCLES FOR INTEGRATION INTO REFINING PROCESSES Christopher Somers, Masters of Science, 2009 Directed By: Dr. Reinhard Radermacher, Mechanical Engineering
Safer, More Efficient Combustion Control for Fired Heaters
 Safer, More Efficient Combustion Control for Fired Heaters By Julie Valentine, Emerson Electric, Inc. Introduction Fired Heaters are devices used for high-temperature heating. A fired heater is used in
HIGH PUITY CARBON MONOXIDE FROM A FEED GAS ARNOLD KELLER AND RONALD SCHENDEL KINETICS TECHNOLOGY INTERNATIONAL CORPORATION MONROVIA, CALIFORNIA
 THE USE OF COSORB R II TO RECOVER HIGH PUITY CARBON MONOXIDE FROM A FEED GAS BY ARNOLD KELLER AND RONALD SCHENDEL KINETICS TECHNOLOGY INTERNATIONAL CORPORATION MONROVIA, CALIFORNIA PRESENTED AT AICHE SUMMER
November 28, Dear Mr. Bechtold:
 4000 Hollywood Boulevard Seventh Floor, North Tower Hollywood, Florida 33021 (954) 987-0066 Fax: (954) 987-2949 November 28, 2012 Wastewater Compliance and Enforcement Section FLORIDA DEPARTMENT OF ENVIRONMENTAL
LSU Natural Gas Conference
 LSU Natural Gas Conference Presented by: Bob Purgason VP Gulfcoast Region Williams Companies Introduction Structural shift in natural gas pricing The crude to gas ratio: A critical relationship for NGL
Transportation of Natural Gas-LPG Mixtures
 50c Transportation of Natural Gas-LPG Mixtures Shuncheng Ji and Richard G. Mallinson Institute for Gas Utilization Technologies And School of Chemical Engineering and Materials Science The University of
LNG. Liquefied Natural Gas A Strategy for B.C. s Newest Industry
 LNG Liquefied Natural Gas A Strategy for B.C. s Newest Industry LIQUEFIED NATURAL GAS Message from the Premier The BC Jobs Plan released in September is all about leveraging our competitive advantages
Quiz Questions. For Process Integration. Fill in the blanks type Questions
 Quiz Questions For Process Integration Fill in the blanks type Questions 1. is the key parameter used in the Pinch Technology. ( T min ) 2. In onion diagram pinch technology in applied at. (the boundary
Thomas G. Braga Manager, Research and Development. SulfaTreat, a Business Unit of M I L.L.C. A Smith/Schlumberger Company
 Thomas G. Braga Manager, Research and Development SulfaTreat, a Business Unit of M I L.L.C. A Smith/Schlumberger Company Who is SulfaTreat? A World Leader in H 2 S Removal for More than a Decade Today
COMBINED CYCLE OPPORTUNITIES FOR SMALL GAS TURBINES
 19 TH SYMPOSIUM OF THE INDUSTRIAL APPLICATION OF GAS TURBINES COMMITTEE BANFF, ALBERTA, CANADA OCTOBER 17-19, 2011 11-IAGT-204 COMBINED CYCLE OPPORTUNITIES FOR SMALL GAS TURBINES Michael Lucente Found
CANSOLV SO2 Scrubbing System - 10 Years of Reliable Operation Integration with SRU Tail Gas Incineration
 CANSOLV SO2 Scrubbing System - 1 Years of Reliable Operation Integration with SRU Tail Gas Incineration NICOLAS EDKINS, NANCY MORETON Cansolv Technologies Inc. (an affiliate of Shell Global Solutions BV)
PINCH ANALYSIS: For the Efficient Use of Energy, Water & Hydrogen. PULP AND PAPER INDUSTRY Energy Recovery and Effluent Cooling at a TMP Plant
 PINCH ANALYSIS: For the Efficient Use of Energy, Water & Hydrogen PULP AND PAPER INDUSTRY Energy Recovery and Effluent Cooling at a TMP Plant PINCH ANALYSIS: For the Efficient Use of Energy, Water & Hydrogen
GreatPoint Energy International Advanced Coal Technologies Conference June 2010
 GreatPoint Energy International Advanced Coal Technologies Conference June 2010 GreatPoint Energy is commercializing its proprietary bluegas TM process to convert coal and petroleum residues into low cost
Background, Issues, and Trends in Underground Hydrocarbon Storage
 Background, Issues, and Trends in Underground Hydrocarbon Storage David E. Dismukes Center for Energy Studies Louisiana State University Environmental Permitting Class January 29, 2009 Description of the
Heat Exchanger Network Optimization using integrated specialized software from ASPENTECH and GAMS Technology.
 EngOpt 2012 3 rd International Conference on Engineering Optimization Rio de Janeiro, Brazil, 01-05 July 2012. Heat Exchanger Network Optimization using integrated specialized software from ASPENTECH and
Item Hydrogen Gas Plant
 Item 6530. Hydrogen Gas Plant Hydro-Chem Hydrogen Generating Plant 90,000 scfh @ 200 psig. Purity 99.99% Hydrogen generating plant engineered by Hydro-Chem built in 1980. Design capacity is 90,000 scfh
20/06/2011 Seminar on Geothermal Exploitation Santiago de Chile
 Contents Power Plants Steam Power plants Binary Power plants Geothermal Power Plants Single flash systems Binary systems 1 Equipment Well head Gathering piping system Steam separators and moisture separators
TABLE OF CONTENT
 Page : 1 of 12 Project Engineering Standard www.klmtechgroup.com KLM Technology #03-12 Block Aronia, Jalan Sri Perkasa 2 Taman Tampoi Utama 81200 Johor Bahru Malaysia RECOVERY AND SPLITTER TABLE OF CONTENT
Brazed aluminium heat exchangers (BAHXs), also referred to
, also referred to") Brazed aluminium heat exchangers (BAHXs), also referred to as plate fin heat exchangers, are at the heart of many of the processes used for the liquefaction of natural gas. They are deployed across the
Brazed aluminium heat exchangers (BAHXs), also referred to as plate fin heat exchangers, are at the heart of many of the processes used for the liquefaction of natural gas. They are deployed across the
Energy Cooperation in Northeast Asia
 March 2004 Energy Cooperation in Northeast Asia A Study on the Oil Pipeline Construction in Northeast Asia Chang-Won Park, Dal-Sok Lee Korea Energy Economics Institute Summary
USING PROCESS SIMULATORS WILL MAKE YOUR PLANT MORE PRODUCTIVE AND EFFICIENT ABSTRACT
 USING PROCESS SIMULATORS WILL MAKE YOUR PLANT MORE PRODUCTIVE AND EFFICIENT W.G. Trey Brown Bryan Research and Engineering, Inc. Bryan, Texas, U.S.A. Leonard Ochs Williams Tulsa, Oklahoma, U.S.A. J.W.
ProMax. Use It. Love It. Bryan Research & Engineering, Inc. BR&E. with TSWEET & PROSIM Process Simulation Software
 ProMax with TSWEET & PROSIM Process Simulation Software Use It. Love It. ProMax is a powerful Microsoft Windows based process simulation package for use in gas processing, oil refining and chemical facilities.
ENERGY EFFICIENT SYSTEMS Recover & recycle your waste heat
 ENERGY EFFICIENT SYSTEMS Recover & recycle your waste heat Absorption Machines - Heat Pumps & Chillers Thermal Energy Storage Solutions Special Heat Exchangers Italy 65 MW Turnkey Waste-to-energy Plant
Transmission Pipeline Opportunities. Advancing Project Development in India through Public Private Partnerships
 Transmission Pipeline Opportunities Advancing Project Development in India through Public Private Partnerships 22 23 February, 2007 Pipeline Maintenance and Repair: Agenda Methane Losses from Pipeline
THE U.S. AUTOGAS MARKET
 THE U.S. AUTOGAS MARKET Table of Contents About Autogas For America... U.S. vs. Worldwide Autogas Vehicles... Propane Autogas Supply & Demand Analysis... Benefits of Autogas... Appendix I... Appendix II...
Oil and natural gas: market outlook and drivers
 Oil and natural gas: market outlook and drivers for American Foundry Society May 18, 216 Washington, DC by Howard Gruenspecht, Deputy Administrator U.S. Energy Information Administration Independent Statistics
US Oil and Gas Import Dependence: Department of Energy Projections in 2011
 1800 K Street, NW Suite 400 Washington, DC 20006 Phone: 1.202.775.3270 Fax: 1.202.775.3199 Email: acordesman@gmail.com Web: www.csis.org/burke/reports US Oil and Gas Import Dependence: Department of Energy
Short Term Energy Outlook March 2011 March 8, 2011 Release
 Short Term Energy Outlook March 2011 March 8, 2011 Release Highlights West Texas Intermediate (WTI) and other crude oil spot prices have risen about $15 per barrel since mid February partly in response
Downsizing a Claus Sulfur Recovery Unit
 INFRASTRUCTURE MINING & METALS NUCLEAR, SECURITY & ENVIRONMENTAL Downsizing a Claus Sulfur Recovery Unit OIL, GAS & CHEMICALS By Charles L. Kimtantas and Martin A. Taylor ckimtant@bechtel.com & mataylo1@bechtel.com
Influence of Process Operations on VOC and BTEX Emissions from Glycol Dehydration Units
 Page 1 of 12 Influence of Process Operations on VOC and BTEX Emissions from Glycol Dehydration Units MICHAEL W. HLAVINKA, VICENTE N. HERNANDEZ-VALENCIA, JERRY A. BULLIN, Bryan Research & Engineering, Inc.,