Puget Sound Energy 2016 Annual Renewable Portfolio Standard Report pursuant to RCW and WAC
|
|
|
- Barbra Mills
- 6 years ago
- Views:
Transcription
1
2
3 Puget Sound Energy 2016 Annual Renewable Portfolio Standard Report pursuant to RCW and WAC June 1, 2016
4 Required Contents: Checklist and Table of Contents RCW WAC (2) Section/Page The utility's annual load for the prior two years The utility's annual load for the prior two years Section 1 Annual Load For Previous Two Years Page 1 The amount of megawatthours needed to meet the annual renewable energy target The total number of megawatt-hours from eligible renewable resources and/or renewable resource credits the utility needed to meet its annual renewable energy target by January 1 of the target year Section 2 Renewable Energy Target Page 1 The amount of megawatthours of each type of eligible renewable resource acquired, the type and amount of renewable energy credits acquired The amount (in megawatthours) of each type of eligible renewable resource used and the amount of renewable energy credits acquired Section 3 Renewable Energy Acquired To Have Met Renewable Energy Target Page 1 The percent of its total annual retail revenue requirement invested in the incremental cost of eligible renewable resources and the cost of renewable energy credits Total incremental cost as a dollar amount and in dollars per megawatt-hour of renewable energy generated by all eligible renewable resources and multiply the dollars per megawatt-hour cost by the number of megawatt-hours needed for target year compliance. State whether the utility is relying upon one of the alternative compliance mechanisms provided in WAC instead of fully meeting its renewable resource target. Section 4 Incremental Cost Calculation and Revenue Requirement Ratio Page 2 Section 5 Alternative Compliance Page Annual Renewal Portfolio Standard Report for Puget Sound Energy Page i
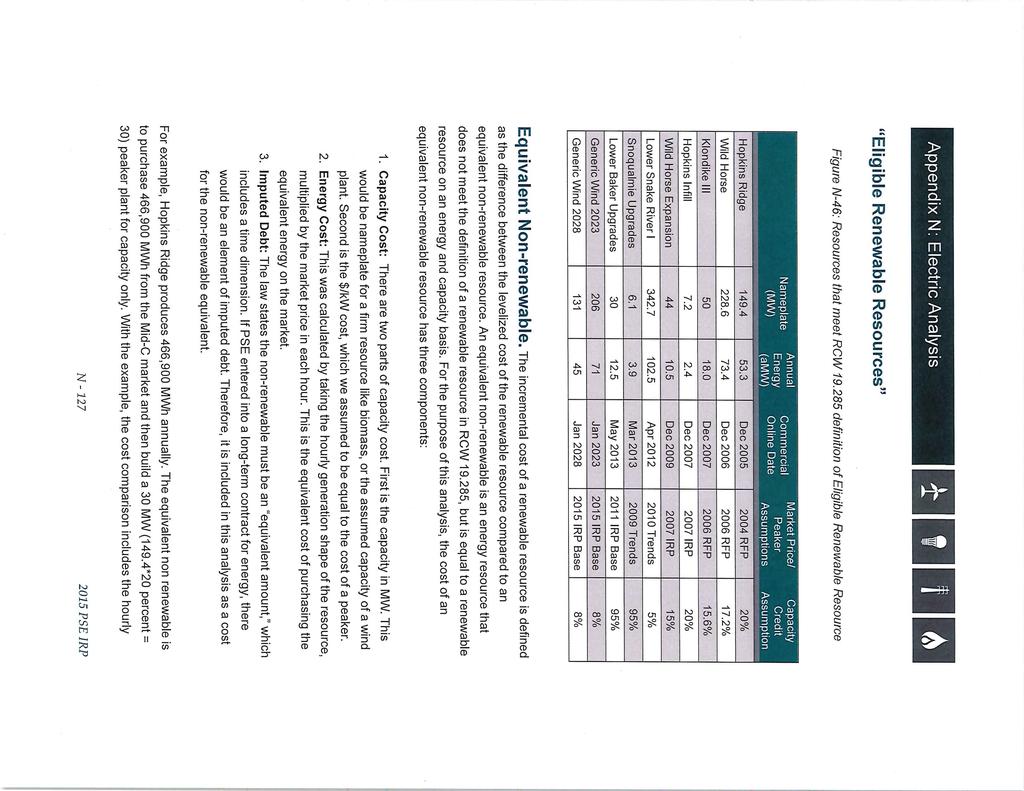
5 RCW WAC (2) Section/Page Describe the resources that the utility intends to use to meet the renewable resource requirements for the target year. Section Compliance Plan Page 3 A list of each eligible renewable resource that serves Washington customers, for which a utility owns the certificates, with an installed capacity greater than twentyfive kilowatts. The number of certificates sold, their WREGIS certificate numbers, their source, and the revenues obtained from the sales. Section 7 Eligible Resources Page 4 Section 8 Sales Page 4 Attachment 1: Memo dated December 18, 2015 Regarding Eligible Renewable Resources Attachment 2: Appendix N from PSE s Integrated Resource Plan filed with the Commission on November 25, 2015 Attachment 3: Reporting Tool Attachment 4: REC Sales 2016 Annual Renewable Portfolio Standard Report for Puget Sound Energy Page ii
6 Section 1. Annual Load for the Prior Two Years Delivered Load to Retail Customers (MWh) 20,568,949 20,509,764 The source of this data is the Puget Sound Energy, Inc. ( PSE ) 2015 FERC Form 1, p. 301, line 10, columns d and e. Section Renewable Energy Target This section provides the number of megawatt-hours from eligible renewable resources and/or renewable resource credits the utility needed to meet its annual renewable energy target by January 1st of the target year. After Commission approval, PSE s Renewable Energy Target for 2016 will be 1,848,542 MWh. Calculation: Delivered Load to Retail Customers (MWh) 20,568,949 20,509,764 Average Load 20,539,357 9% of Average Load 1,848,542 Section 3 Renewable Energy Acquired To Meet 2016 Renewable Energy Target This section provides the amount (in megawatt-hours) of each type of eligible renewable resource used, and the amount of renewable energy credits acquired to meet the 2016 target. As demonstrated in Attachment 1, PSE has sufficient eligible renewable resources to meet its 2016 target. PSE plans to meet its 2016 target with a combination of incremental hydro along with other renewable energy certificates from qualifying resources as demonstrated in the following table: Incremental Hydro Resources 121,712 Eligible Wind Resources 2,049, Annual Renewal Portfolio Standard Report for Puget Sound Energy Page 1

7 Section 4. Incremental Cost Calculation and Revenue Requirement Ratio This section calculates the total incremental cost as a dollar amount and in dollars per megawatt-hour of renewable energy generated by all eligible renewable resources and multiplies the dollars per megawatt-hour cost by the number of megawatt-hours needed for target year compliance and provides the annual revenue requirement ratio. Consistent with the requirements outlined in WAC (2)(a)(i) (A) through (G), the calculation of incremental costs for each eligible resource is performed at the time of acquisition. PSE has not acquired any new resources since 2013 and therefore continues to utilize incremental cost calculations as documented in Attachment 2. The incremental costs along with the annual megawatt hour (MWH) for each eligible resource are as follows: As demonstrated in the table above, the incremental cost of eligible renewable resources is $27.81M resulting in an average cost/mwh of $ For the 2016 target year compliance, the incremental cost is $21.2M ($11.48 * 1,848,542 MWh). The total annual retail revenue requirement for 2016 is $ million. The 2016 revenue requirement is based on the revenue requirement determined in PSE's last general rate case (UE ) and adjusted for the 2013 and 2014 PCORC (Dockets UE , and UE respectively) and UE (Expedited Rate Filing). The resulting ratio of this investment relative to the utility s total annual retail revenue requirement is 1% (27.81M / M = 1%) Annual Renewable Portfolio Standard Report for Puget Sound Energy Page 2

8 Section 5. Alternative Compliance This section states whether the utility is relying upon one of the alternative compliance mechanisms provided in WAC instead of fully meeting its renewable resource target. A utility using an alternative compliance mechanism must use the incremental cost methodology described in this section and include sufficient data, documentation and other information in its report to demonstrate that it qualifies to use that alternative mechanism. PSE is not utilizing an alternative compliance mechanism provided for in RCW (2)(d) or RCW (1) and WAC instead of meeting its 2016 Renewable Energy Target. Section Compliance Plan This section describes the resources that PSE intends to use to meet the renewable resource requirements for the target year. PSE is positioned to meet its 2016 Renewable Energy Target with a combination of qualified hydroelectric upgrades and other renewable energy certificates from qualifying resources. The following table provides a summary of PSE s expected 2016 compliance. Further details about this information can be found in Attachment 3. Data for 2016 provided above is an estimate and is subject to change Annual Renewable Portfolio Standard Report for Puget Sound Energy Page 3
9 Section 7. Eligible Resources This section provides a list of each eligible renewable resource that serves Washington customers, for which PSE owns the certificates, with an installed capacity greater than twentyfive kilowatts and each resource's WREGIS registration status and use of certificates, whether it be for annual target compliance, a voluntary renewable energy program as provided for in RCW 19.29A.090, or owned by the customer; and eligible resources being included in the report for the first time and documentation of their eligibility. PSE has acquired sufficient eligible renewable resources in its portfolio to supply at least nine percent of its estimated load for the year 2016, in advance of January 1, Eligible renewable resources that PSE may elect to use in whole or in part to meet its 2016 target include (but not limited to): Hopkins Ridge Wind Project; Wild Horse Wind Project; Wild Horse Expansion Wind Project (including extra apprenticeship credits); Lower Snake River Wind Project (including extra apprenticeship credits); Klondike III Wind Project (e.g. the output PSE purchases from Iberdrola); Snoqualmie Falls Hydroelectric Efficiency Upgrades; Lower Baker River Hydroelectric Efficiency Upgrades; Allocation of Hydroelectric Efficiency Upgrades that may be (now or in the future) a part of PSE s Mid-C Contracts; Customer-Generator owned facilities taking service from PSE under PSE electric rate Schedule 91; and Any other eligible renewable resources that may become available in 2016 or Please also see Attachment 1. Section 8. Sales This section reports on the number of certificates sold, their WREGIS certificate numbers, their source, and the revenues obtained from the sales. The following table summarizes PSE s REC sales by source and vintage year for 2012 through 2015 vintages. To date, the company has not transferred title to any Vintage 2016 RECs. Any Vintage 2016 REC sales will be reported in the 2017 report Annual Renewable Portfolio Standard Report for Puget Sound Energy Page 4

10 Reflects REC Transfers through 4/30/16 Confidential Attachment 4 provides transaction details including the revenue proceeds associated with those sales Annual Renewable Portfolio Standard Report for Puget Sound Energy Page 5
11 Attachment 1
12 MEMORANDUM TO: Kathie Barnard, Roger Garratt, Michael Mullally FROM: Anna Mikelsen Mills, Chris Schaefer SUBJECT: Requirements of Chapter WAC DATE: December 18, 2015 Background Chapter WAC Renewable portfolio standard states: "(1) Renewable resource target. Each utility must meet the following annual targets. (b) By January 1st of each year beginning in 2016 and continuing through 2019, each utility must use sufficient eligible renewable resources, acquire equivalent renewable energy credits, or a combination of both, to supply at least nine percent of its two year average load for the remainder of each target year.... (2) Credit eligibility. Renewable energy credits produced during the target year, the preceding year or the subsequent year may be used to comply with this annual renewable resource requirement provided that they were acquired by January 1st of the target year. (3) WREGIS registration. All eligible hydropower generation and all renewable energy credits used for utility compliance with the renewable resource target must be registered in WREGIS, regardless of facility ownership. Any megawatt hour of eligible hydropower or renewable energy credit that a utility uses for compliance must have a corresponding certificate retired in the utility's WREGIS account. (5) Target calculation. In meeting the annual targets of this section, a utility must calculate its annual target based on the average of the utility's load for the previous two years. (6) Integration services. A renewable resource within the Pacific Northwest may receive integration, shaping, storage or other services from sources outside of the Page 1 of 5
13 Pacific Northwest and remain eligible to count towards a utility's renewable resource target. (Emphasis added.) Summary Pursuant to the requirements of Chapter WAC, we have prepared this Memorandum to document that Puget Sound Energy, Inc. ( PSE ) has acquired sufficient eligible renewable resources in its portfolio by January 1, 2016 to supply at least nine percent of its estimated load for the year This is consistent with the information provided to the WUTC on November 25, 2015 in PSE s compliance filing in Docket No. UE , PSE s 2015 Integrated Resource Plan ( IRP ). In the Executive Summary of the IRP, PSE stated that: PSE has acquired enough eligible renewable resources and RECs to meet the requirements of the law through Following provides a summary of the Company s eligible renewable resources, load and renewable energy target. Eligible Renewable Resources PSE has acquired sufficient eligible renewable resources in its portfolio to supply at least nine percent of its estimated load for the year 2016, in advance of January 1, Eligible renewable resources that PSE may elect to use in whole or in part to meet its 2016 target include (but are not limited to): Hopkins Ridge Wind Project; Wild Horse Wind Project; Wild Horse Expansion Wind Project (including extra apprenticeship credits); Lower Snake River Wind Project (including extra apprenticeship credits); Klondike III Wind Project (e.g. the output PSE purchases from Iberdrola); Page 2 of 5
14 Snoqualmie Falls Hydroelectric Efficiency Upgrades 1 ; Lower Baker River Hydroelectric Efficiency Upgrades 2 ; Allocation of Hydroelectric Efficiency Upgrades that may be (now or in the future) a part of PSE s Mid C Contracts; Customer Generator owned facilities taking service from PSE under PSE electric rate Schedule 91; and Any other eligible renewable resources that may become available in 2016 or Total 2014 generation from Hopkins Ridge, Wild Horse, Wild Horse Expansion and Lower Snake River was about 1,973,000 megawatt hours (not inclusive of the extra apprenticeship credits); similar generation may be achieved for 2015 and These eligible renewable resources may be impacted by events beyond PSE s reasonable control that could not have been reasonably anticipated or ameliorated that prevented PSE from meeting the renewable energy target. Such events may include weather related damage, mechanical failure, strikes, lockouts, or actions of a governmental authority that adversely affect the generation, transmission, or distribution of an eligible renewable resource owned by or under contract to a qualifying utility. PSE does not currently intend to utilize one of the alternative compliance mechanisms provided for in RCW (2)(d) or RCW (1) and WAC instead of meeting its 2016 renewable resource target. However, there may be events beyond PSE s control during the remainder of the calendar year 2016 which could prompt PSE to utilize the alternative compliance mechanisms in RCW (2)(i) and WAC Such determination will be made when PSE reports on its final 2016 compliance in the 2017 or 2018 report. 1 PSE is anticipating its Snoqualmie Falls Hydroelectric Project will be WREGIS registered in However, the Company will have more than enough renewable energy credits to meet the 2016 target without the WREGIS registration. 2 PSE is anticipating its Lower Baker River Hydroelectric Project will be WREGIS registered in However, the Company will have more than enough renewable energy credits to meet the 2016 target without the WREGIS registration. Page 3 of 5
15 Load Load is defined in the rules as: "Load" means the amount of kilowatt hours of electricity delivered in the most recently completed year by a qualifying utility to its Washington retail customers. Load does not include off system sales or electricity delivered to transmission only customers. PSE s actual 2014 delivered load is 20,575,878,000 kilowatt hours (i.e. 20,575,878 megawatthours) and the 2015 forecast load is about 20,659,370,027 kilowatt hours (i.e. 20,659,370 megawatt hours). Consistent with WAC (2), based on the average of PSE s load in 2014 and 2015 and as reflected above, the Company s estimated load for purposes of meeting its 2016 target will likely be in the neighborhood of 20,617,624 megawatt hours Renewable Resource Target Chapter (1)(b) WAC states: By January 1st of each year beginning in 2016 and continuing through 2019, each utility must use sufficient eligible renewable resources, acquire equivalent renewable energy credits, or a combination of both, to supply at least nine percent of its two year average load for the remainder of each target year. (Emphasis added.) Based on the load estimations above and the nine percent requirement in Chapter WAC, the Company s estimated renewable energy target for 2016 may end up being approximately 1,855,586 megawatt hours. PSE expects to generate more eligible renewable energy than its 2016 requirement (not including any renewable energy credits generated in 2015 that the Company may elect to use for its 2016 requirement). PSE will report on the specific renewable energy credits produced and to be retired for final compliance with the 2016 target in either its annual 2017 or 2018 report, and reserves the right to submit renewable energy credits from the resources reported here or to substitute with renewable energy credits produced from 2015 to 2017 by other eligible renewable resources or with 2016 generation from eligible renewable resources that have not been converted to renewable energy credits. Page 4 of 5
16 Conclusion PSE s eligible renewable resources in 2016 may be expected to generate approximately 2,529,739 megawatt hours and/or renewable energy credits and/or extra apprenticeship credits (not inclusive of: i) any renewable energy credits that may be committed/sold to third parties and/or customers or ii) any renewable energy credits generated in 2015 that the Company may elect to use for its 2016 renewable resource target). Events beyond PSE s reasonable control may yet occur during the remainder of calendar year 2016 which could prompt PSE to utilize the alternative compliance mechanism in RCW (2)(i) and WAC Such events may include weather related damage, mechanical failure, strikes, lockouts, or actions of a governmental authority that adversely affect the generation, transmission, or distribution of an eligible renewable resource owned by or under contract to a qualifying utility. Such determination will be made when PSE reports on its final 2016 compliance in the annual 2017 or 2018 renewable resource target report. As provided to the WUTC on November 25, 2015 in PSE s compliance filing in Docket No. UE , (PSE s 2015 IRP), PSE is on track to meet the renewable resource target requirements for the year 2016 and all the way to the year PSE has acquired enough eligible renewable resources or renewable energy credits to meet the estimated renewable energy target for Page 5 of 5
17
18
19
20
21
22
23
24
25
26 Attachment 3
27 General Instructions: Grey shading indicates cells where information is not required Yellow shading indicate cells where inputs are entered Green shading indicate cells with dropdown lists White shading indicate formulated cells Blue shading indicates summary calculations "Compliance Summary" Worksheet Enter "X" When Checklist Complete Item Cell/Row Description Units Cell/Row Comments X 1 Reporting Entity Text B2 Enter the name of the reporting entity X 2 Reporting Date Year B4 Enter the date the report is submitted 3 Delivered Load to Retail Customers MWh B7:E7 Enter the MWh delivered to customers "Facility Detail" Worksheet Enter "X" When Checklist Cell/Row Description Units Cell/Row Comments Complete Item Instructions in the section are for the cells B2:F31. Each row represents a different facility. FIRST UPDATE cell B1053 For Start Year Enter the name of the qualifying facility or X 1 Facility Name Text B2:B31 contract X 2 WREGIS ID Text C2:C31 Enter the WREGIS ID for the qualifying facility X 3 Facility Type Toggle D2:D31 Select the generation type for the qualifying facility X 4 Extra Apprenticeship Credit Eligibility Toggle E2:E31 For facilities that qualify for extra apprenticeship credits select "Eligible". Select "Not Eligible for non qualifying facilities. X 5 Distributed Generation Eligibility Toggle F2:F31 For facilities that qualify for distributed generation select "Eligible". Select "Not Eligible for non qualifying facilities. Enter "X" When Complete Checklist Item Cell/Row Description Units Cell/Row Comments Instructions in this section identify the input locations for the 1st facility found in the "Facility Detail" worksheet. Inputs for facilities 2 through 30, also found in the "Facility Detail" worksheet, are identical to facility 1. 6 Total MWh Produced from Facility Number D39:F39 7 Percent of MWh Qualifying % D40:F Percent of Qualifying MWh Allocated to WA State Compliance Quantity of RECs from MWh Sold % D41:F41 Number D50:F50 10 Bonus Incentives Transferred Number D51:F51 11 Bonus Incentives Not Realized Number D52:F Surplus Applied to 2012 Number D Surplus Applied to 2011 Number E Surplus Applied to 2013 Number E Surplus Applied to 2012 Number F59 Enter the annual MWh output from the qualifying facility Enter the percent of MWh produced that are eligible for meeting RCW Enter the percent of qualifying MWh used for compliance with RCW Used for facilities that are utilized for RPS compliance in two or more states. Enter the annual amount of RECs sold. For Multi Jurisdictional Utilities, enter in annual WA allocated amount of RECs sold. Enter the annual amount of transferred RECs procured from bonus incentives Enter the annual number of bonus incentives that were not realized Enter the amount of RECs procured in 2011 used for compliance in 2012 Enter the amount of RECs procured in 2012 used for compliance in 2011 Enter the amount of RECs procured in 2012 used for compliance in 2013 Enter the amount of RECs procured in 2013 used for compliance in 2012
28 Reporting Entity: Reporting Date: June 1, 2016 RCW Compliance Need Delivered Load to Retail Customers (MWh) 21,208,608 20,568,949 20,509,764 Not Applicable WA State RCW Requirement 3% 3% 3% 9% Quantity Required for Compliance 635, ,663 1,848,542 Eligible Quantity Acquired * 2015* 2016 Qualifying MWh Allocated to WA 2,019,929 2,156,021 1,931, ,203 Quantity from Non REC Eligible Generation 184, , ,886 7,319 Total Quantity Available for RCW Compliance 2,204,496 2,352,991 2,097, ,522 Sales and Transfers Quantity of RECs Sold (879,430) (1,616,355) (77,945) Bonus Incentives Transferred Bonus Incentives Not Realized (78,269) (99,710) (4,546) Total Sold / Transferred / Unrealized (957,699) (1,716,065) (82,491) Adjustments Surplus Applied to 2014 (1,246,796) 1,246, Surplus Applied to Surplus Applied to 2015 (588,088) 588, Surplus Applied to Surplus Applied to 2016 (1,917,964) 1,917, Surplus Applied to 2015 Net Surplus Adjustments (293,096) 658,708 (1,329,876) 1,917,964 Adjustment for Events Beyond Control * 2015* 2016 RCW Compliance Surplus / (Deficit) 318, ,432 58, ,944 * Any surplus shown in 2014 or 2015 may be sold or used for compliance in subsequent years. In both the "Compliance Summary" and "Facility Detail" worksheets, utilities may need to protect commercially sensitive information by use of the CONFIDENTIAL designation.
29 Facility Name: Facility WREGIS ID: Facility Type Extra Apprenticeship Credit Eligibility: Distributed Generation Bonus Eligibility: Wild Horse W183 Wind Not Eligible Hopkins Ridge W184 Wind Not Eligible Klondike III W237 Wind Not Eligible Wild Horse Phase II W1364 Wind Eligible Hopkins Ridge Phase II W1382 Wind Not Eligible Lower Snake River Dodge Junction W2669 Wind Eligible Lower Snake River Phalen Gulch W2670 Wind Eligible Wanapum Fish Bypass Not Available Water (Incremental Hydro) Not Eligible Baker River Project Not Available Water (Incremental Hydro) Not Eligible Snoqualmie Falls Project Not Available Water (Incremental Hydro) Not Eligible Facility 11 Facility 12 Facility 13 Facility 14 Facility 15 Facility 16 Facility 17 Facility 18 Facility 19 Facility 20 Facility 21 Facility 22 Facility 23 Facility 24 Facility 25 Facility 26 Facility 27 Facility 28 Facility 29 Facility 30 Online Date: In both the "Compliance Summary" and "Facility Detail" worksheets, utilities may need to protect commercially sensitive information by use of the CONFIDENTIAL designation. Facility Name: Wild Horse MWh Allocated to WA Compliance Total MWh Produced / Purchased from Wild Horse 546, ,757 34,212 Percent of MWh Qualifying Under RCW % 100% 100% Percent of Qualifying MWh Allocated to WA 100% 100% 100% Eligible MWh Available for RCW Compliance 546, ,757 34,212 Non REC Eligible Generation Extra Apprenticeship Credit Distributed Generation Bonus Total Quantity from Non REC Eligible Generation REC Sales / Transfers Quantity of RECs Sold 541,930 Bonus Incentives Transferred Bonus Incentives Not Realized Total Sold / Transferred / Unrealized 541,930 Adjustments Surplus Applied to , Surplus Applied to Surplus Applied to ,527 4, Surplus Applied to Surplus Applied to , , Surplus Applied to 2015 Net Surplus Adjustments 303,918 (508,230) 512,757 Adjustment for Events Beyond Control Contribution to RCW Compliance 308,445 4, ,969
30 Facility Name: Hopkins Ridge MWh Allocated to WA Compliance Total MWh Produced / Purchased from Hopkins Ridge 423, ,166 27,526 Percent of MWh Qualifying Under RCW % 100% 100% Percent of Qualifying MWh Allocated to WA 100% 100% 100% Eligible MWh Available for RCW Compliance 423, ,166 27,526 Non REC Eligible Generation Extra Apprenticeship Credit Distributed Generation Bonus Total Quantity from Non REC Eligible Generation REC Sales / Transfers Quantity of RECs Sold 423,662 35,533 Bonus Incentives Transferred Bonus Incentives Not Realized Total Sold / Transferred / Unrealized 423,662 35,533 Adjustments Surplus Applied to , Surplus Applied to Surplus Applied to Surplus Applied to Surplus Applied to , , Surplus Applied to 2015 Net Surplus Adjustments 223,346 (312,633) 312,633 Adjustment for Events Beyond Control Contribution to RCW Compliance 223, ,159 Facility Name: Klondike III May be used for Target Year 2016 Compliance MWh Allocated to WA Compliance Total MWh Produced / Purchased from Klondike III 133, ,605 4,064 Percent of MWh Qualifying Under RCW % 100% 100% Percent of Qualifying MWh Allocated to WA 100% 100% 100% Eligible MWh Available for RCW Compliance 133, ,605 4,064 Non REC Eligible Generation Extra Apprenticeship Credit Distributed Generation Bonus Total Quantity from Non REC Eligible Generation REC Sales / Transfers Quantity of RECs Sold 133,571 17,945 Bonus Incentives Transferred Bonus Incentives Not Realized Total Sold / Transferred / Unrealized 133,571 17,945 Adjustments Surplus Applied to , Surplus Applied to Surplus Applied to Surplus Applied to Surplus Applied to , , Surplus Applied to 2015 Net Surplus Adjustments 67,395 (103,660) 103,660 Adjustment for Events Beyond Control Contribution to RCW Compliance 67, ,724
31 Facility Name: Wild Horse Phase II MWh Allocated to WA Compliance Total MWh Produced / Purchased from Wild Horse Phase II 105,180 98,693 6,585 Percent of MWh Qualifying Under RCW % 100% 100% Percent of Qualifying MWh Allocated to WA 100% 100% 100% Eligible MWh Available for RCW Compliance 105,180 98,693 6,585 Non REC Eligible Generation Extra Apprenticeship Credit 21,036 19,739 1,317 Distributed Generation Bonus Total Quantity from Non REC Eligible Generation 21,036 19,739 1,317 REC Sales / Transfers Quantity of RECs Sold 98,496 10,000 Bonus Incentives Transferred Bonus Incentives Not Realized 19,699 2,000 Total Sold / Transferred / Unrealized 118,195 12,000 Adjustments Surplus Applied to , Surplus Applied to Surplus Applied to ,021 8, Surplus Applied to Surplus Applied to , , Surplus Applied to 2015 Net Surplus Adjustments 63,222 (98,411) 106,432 Adjustment for Events Beyond Control Contribution to RCW Compliance 71,243 8, ,334 Actual 2014 Retirement 65,090 Facility Name: Hopkins Ridge Phase II MWh Allocated to WA Compliance Total MWh Produced / Purchased from Hopkins Ridge Phase II 18,641 16,614 1,327 Percent of MWh Qualifying Under RCW % 100% 100% Percent of Qualifying MWh Allocated to WA 100% 100% 100% Eligible MWh Available for RCW Compliance 18,641 16,614 1,327 Non REC Eligible Generation Extra Apprenticeship Credit Distributed Generation Bonus Total Quantity from Non REC Eligible Generation REC Sales / Transfers Quantity of RECs Sold 18,641 1,735 Bonus Incentives Transferred Bonus Incentives Not Realized Total Sold / Transferred / Unrealized 18,641 1,735 Adjustments Surplus Applied to , Surplus Applied to Surplus Applied to Surplus Applied to Surplus Applied to ,879 14, Surplus Applied to 2015 Net Surplus Adjustments 9,827 (14,879) 14,879 Adjustment for Events Beyond Control Contribution to RCW Compliance 9,827 16,206
32 Facility Name: Lower Snake River Dodge Junction MWh Allocated to WA Compliance Total MWh Produced / Purchased from Lower Snake River Dodge Junction 500, ,560 30,008 Percent of MWh Qualifying Under RCW % 100% 100% Percent of Qualifying MWh Allocated to WA 100% 100% 100% Eligible MWh Available for RCW Compliance 500, ,560 30,008 Non REC Eligible Generation Extra Apprenticeship Credit 100,070 84,312 6,002 Distributed Generation Bonus Total Quantity from Non REC Eligible Generation 100,070 84,312 6,002 REC Sales / Transfers Quantity of RECs Sold 230,247 Bonus Incentives Transferred Bonus Incentives Not Realized 46,049 Total Sold / Transferred / Unrealized 276,296 Adjustments Surplus Applied to , Surplus Applied to Surplus Applied to , , Surplus Applied to Surplus Applied to , , Surplus Applied to 2015 Net Surplus Adjustments (1,166) (181,750) 505,872 Adjustment for Events Beyond Control Contribution to RCW Compliance 322, , ,882 Actual 2014 Retirement 280,655 Lower Snake River Phalen Gulch MWh Allocated to WA Compliance Total MWh Produced / Purchased from Lower Snake River Phalen Gulch 379, ,175 20,769 Percent of MWh Qualifying Under RCW % 100% 100% Percent of Qualifying MWh Allocated to WA 100% 100% 100% Eligible MWh Available for RCW Compliance 379, ,175 20,769 Non REC Eligible Generation Extra Apprenticeship Credit 75,865 62,835 Distributed Generation Bonus Total Quantity from Non REC Eligible Generation 75,865 62,835 REC Sales / Transfers Quantity of RECs Sold 169,808 12,732 Bonus Incentives Transferred Bonus Incentives Not Realized 33,962 2,546 Total Sold / Transferred / Unrealized 203,770 15,278 Adjustments Surplus Applied to , Surplus Applied to Surplus Applied to , , Surplus Applied to Surplus Applied to , , Surplus Applied to 2015 Net Surplus Adjustments (7,834) (110,314) 361,732 Adjustment for Events Beyond Control Contribution to RCW Compliance 243, , ,501 Actual 2014 Retirement 240,619
33 Facility Name: Wanapum Fish Bypass May be used for 2016 RPS Compliance MWh Allocated to WA Compliance Total MWh Produced / Purchased from Wanapum Fish Bypass Not Eligible Not Eligible Percent of MWh Qualifying Under RCW % 100% 100% Percent of Qualifying MWh Allocated to WA 100% 100% 100% Eligible MWh Available for RCW Compliance Non REC Eligible Generation Extra Apprenticeship Credit Distributed Generation Bonus Total Quantity from Non REC Eligible Generation REC Sales / Transfers Quantity of RECs Sold Bonus Incentives Transferred Bonus Incentives Not Realized Total Sold / Transferred / Unrealized Adjustments Surplus Applied to Surplus Applied to Surplus Applied to Surplus Applied to Surplus Applied to Surplus Applied to 2015 Net Surplus Adjustments Adjustment for Events Beyond Control Contribution to RCW Compliance Use of Wanapum Fish Bypass for 2016 RPS Compliance will be dependent upon Grant County filing WREGIS registration. To date Grant County has not filed Wanapum in WREGIS Facility Name: Baker River Project MWh Allocated to WA Compliance Total MWh Produced / Purchased from Baker River Project 121, , ,590 Percent of MWh Qualifying Under RCW % 28.3% 28.3% Percent of Qualifying MWh Allocated to WA 100% 100% 100% Eligible MWh Available for RCW Compliance 34,379 87, ,198 Non REC Eligible Generation Extra Apprenticeship Credit Distributed Generation Bonus Total Quantity from Non REC Eligible Generation REC Sales / Transfers Quantity of RECs Sold Bonus Incentives Transferred Bonus Incentives Not Realized Total Sold / Transferred / Unrealized Adjustments Surplus Applied to Surplus Applied to Surplus Applied to Surplus Applied to Surplus Applied to Surplus Applied to 2015 Net Surplus Adjustments Adjustment for Events Beyond Control Contribution to RCW Compliance 34,379 87, ,198 Actual 2014 Retirement 34,379 Baker estimated RPS Eligible generation based on Incremental Hydro Calculation Method 2. Baker Project still pending completion of WREGIS Registration
34 Facility Name: Snoqualmie Falls Project MWh Allocated to WA Compliance Total MWh Produced / Purchased from Snoqualmie Falls Project 170, , ,346 Percent of MWh Qualifying Under RCW % 8.5% 8.5% Percent of Qualifying MWh Allocated to WA 100% 100% 100% Eligible MWh Available for RCW Compliance 14,459 10,104 20,514 Non REC Eligible Generation Extra Apprenticeship Credit Distributed Generation Bonus Total Quantity from Non REC Eligible Generation REC Sales / Transfers Quantity of RECs Sold Bonus Incentives Transferred Bonus Incentives Not Realized Total Sold / Transferred / Unrealized Adjustments Surplus Applied to Surplus Applied to Surplus Applied to Surplus Applied to Surplus Applied to Surplus Applied to 2015 Net Surplus Adjustments Adjustment for Events Beyond Control Contribution to RCW Compliance 14,459 10,104 20,514 Actual 2014 Retirement 14,459 Snoqualmie Falls Project estimated RPS Eligible generation based on Incremental Hydro Calculation Method 2. Snoqualmie Falls Project still pending completion of WREGIS Registration
35 Compliance Contribution by Generation Type Wind 0 1,246, ,088 2,049,774 Solar Water (Incremental Hydro) 48,838 97, ,712 Biomass Geothermal Landfill Gas Sewage Treatment Gas Wave, Ocean, Tidal Biodiesel Fuel
36 CONFIDENTIAL PER WAC REDACTED VERSION Attachment 4
37 Attachment 4 CONFIDENTIAL PER WAC REC Revenues by Year by Resource Vintage Total Source WREGIS # REC Revenues Wild Horse W183 Wild Horse Phase II W1364 Hopkins Ridge W184 REDACTED Hopkins Ridge Phase II W1382 Klondike III W237 Lower Snake River-Dodge Junction W2669 Lower Snake River-Phalen Gulch W2670 $ - $ - $ - $ - $ - $ -
38 PUGET SOUND ENERGY Attachment 4 Deferred REC Revenue Proceeds CONFIDENTIAL PER WAC A/C Vintages 2012 through 2015 Transaction REC Total REC Facility Vintage Mo/Yr WREGIS # Qty Revenues Total Qty Revenues Wild Horse Phase II WH2 May-12 W ,460 54, Vintage Wild Horse Phase II WH2 Nov-13 W1364 5,173 47, Vintage Wild Horse Phase II WH2 Nov-13 W1364 7,555 98, Vintage Wild Horse Phase II WH2 Nov-13 W1364 5,730 10, Vintage Wild Horse Phase II WH2 Nov-13 W1364 8,749 Wild Horse Phase II WH2 Nov-13 W1364 6,660 Wild Horse Phase II WH2 Nov-13 W1364 8,879 Wild Horse Phase II WH2 Oct-14 W1364 8,048 Wild Horse Phase II WH2 Oct-14 W1364 4,733 REDACTED REDACTED Wild Horse Phase II WH2 Oct-14 W1364 7,637 Wild Horse Phase II WH2 Oct-14 W1364 4,582 Wild Horse Phase II WH2 Oct-14 W1364 7,682 Wild Horse Phase II WH2 Oct-14 W1364 9,931 Wild Horse Phase II WH2 Jan-15 W1364 1,600 Wild Horse Phase II WH2 Jan-15 W1364 3,173 Wild Horse Phase II WH2 Apr-15 W1364 5,002 Wild Horse Phase II WH2 Apr-15 W1364 7,583 Wild Horse Phase II WH2 Apr-15 W ,579 Wild Horse Phase II WH2 Apr-15 W ,732 Wild Horse Phase II WH2 Apr-15 W1364 9,343 Wild Horse Phase II WH2 Apr-15 W1364 8,109 Wild Horse Phase II WH2 Apr-15 W1364 5,008 Wild Horse Phase II WH2 Apr-15 W1364 6,626 Wild Horse Phase II WH2 Aug-15 W1364 3,314 Wild Horse Phase II WH2 Dec-15 W1364 1,440 Wild Horse Phase II WH2 Dec-15 W Wild Horse Phase II WH2 Dec-15 W1364 7,678 Wild Horse Phase II WH2 Jan-16 W1364 7,625 Wild Horse Phase II WH2 Jan-16 W ,591 Wild Horse Phase II WH2 Mar-16 W Wild Horse Phase II WH2 Mar-16 W Wild Horse Phase II WH2 Mar-16 W ,000 Hopkins Ridge Phase II HR2 Oct-14 W1382 1,222 7, Vintage Hopkins Ridge Phase II HR2 Oct-14 W , Vintage
39 Hopkins Ridge Phase II HR2 Oct-14 W1382 1,486 1, Vintage Hopkins Ridge Phase II HR2 Oct-14 W Hopkins Ridge Phase II HR2 Oct-14 W1382 1,330 Hopkins Ridge Phase II HR2 Oct-14 W1382 1,520 Hopkins Ridge Phase II HR2 Oct-14 W1382 1,233 Hopkins Ridge Phase II HR2 Oct-14 W1382 1,376 Hopkins Ridge Phase II HR2 Oct-14 W1382 2,173 Hopkins Ridge Phase II HR2 Oct-14 W1382 2,147 Hopkins Ridge Phase II HR2 Oct-14 W1382 1,884 Hopkins Ridge Phase II HR2 Oct-14 W1382 1,883 Hopkins Ridge Phase II HR2 Jan-15 W1382 1,262 Hopkins Ridge Phase II HR2 Jan-15 W1382 1,165 Hopkins Ridge Phase II HR2 Jan-15 W Hopkins Ridge Phase II HR2 Apr-15 W Hopkins Ridge Phase II HR2 Apr-15 W1382 1,483 Hopkins Ridge Phase II HR2 Apr-15 W1382 1,813 Hopkins Ridge Phase II HR2 Apr-15 W1382 1,092 Hopkins Ridge Phase II HR2 Apr-15 W Hopkins Ridge Phase II HR2 Apr-15 W1382 1,161 Wild Horse WH May-12 W183 38, , Vintage Wild Horse WH Dec-13 W183 26, , Vintage Wild Horse WH Dec-13 W183 39, , Vintage Wild Horse WH Dec-13 W183 29,767 Wild Horse WH Dec-13 W183 45,454 Wild Horse WH Dec-13 W183 34,606 Wild Horse WH Dec-13 W183 24,045 Wild Horse WH Jul-14 W183 15,535 Wild Horse WH Oct-14 W183 26,280 Wild Horse WH Oct-14 W183 24,591 Wild Horse WH Oct-14 W183 39,676 Wild Horse WH Oct-14 W183 32,117 Wild Horse WH Oct-14 W183 27,336 Wild Horse WH Jan-15 W183 12,577 Wild Horse WH Jan-15 W183 25,465 Wild Horse WH Feb-15 W183 3,000 Wild Horse WH Apr-15 W183 39,615 Wild Horse WH Oct-14 W183 25,000 Wild Horse WH Nov-14 W Wild Horse WH Nov-14 W183 39,394 Wild Horse WH Nov-14 W183 60,000 REDACTED REDACTED REDACTED REDACTED
40 Wild Horse WH Nov-14 W183 66,150 Wild Horse WH Nov-14 W183 48,537 Wild Horse WH Nov-14 W183 39,928 Wild Horse WH Apr-15 W Wild Horse WH Apr-15 W183 19,422 Wild Horse WH Apr-15 W183 26,017 Wild Horse WH Apr-15 W183 36,234 Wild Horse WH Apr-15 W183 41,907 Wild Horse WH Apr-15 W183 38,734 Wild Horse WH May-15 W183 20,000 Wild Horse WH Jun-15 W183 30,000 Wild Horse WH Dec-15 W Wild Horse WH Dec-15 W183 22,000 Wild Horse WH Jan-16 W183 24,038 Wild Horse WH Feb-16 W183 1,653 Wild Horse WH Mar-16 W Hopkins Ridge HR Nov-13 W184 22, , Vintage Hopkins Ridge HR Nov-13 W184 23, , Vintage Hopkins Ridge HR Nov-13 W184 17, , Vintage Hopkins Ridge HR Nov-13 W184 32,566 35, Vintage Hopkins Ridge HR Nov-13 W Hopkins Ridge HR Nov-13 W184 25,218 Hopkins Ridge HR Nov-13 W184 48,949 Hopkins Ridge HR Aug-14 W184 27,772 Hopkins Ridge HR Aug-14 W184 7,228 Hopkins Ridge HR Oct-14 W184 13,962 Hopkins Ridge HR Oct-14 W184 33,769 Hopkins Ridge HR Oct-14 W184 18,608 REDACTED REDACTED Hopkins Ridge HR Oct-14 W184 30,236 Hopkins Ridge HR Oct-14 W184 34,542 Hopkins Ridge HR Oct-14 W184 28,019 Hopkins Ridge HR Oct-14 W184 31,279 Hopkins Ridge HR Oct-14 W184 49,384 Hopkins Ridge HR Oct-14 W184 48,790 Hopkins Ridge HR Oct-14 W184 42,826 Hopkins Ridge HR Oct-14 W184 42,793 Hopkins Ridge HR Oct-14 W184 17,305 Hopkins Ridge HR Oct-14 W184 5,970 Hopkins Ridge HR Jan-15 W184 11,371 Hopkins Ridge HR Jan-15 W184 20,509
41 Hopkins Ridge HR Apr-15 W184 25,682 Hopkins Ridge HR Apr-15 W184 33,693 Hopkins Ridge HR Apr-15 W184 41,204 Hopkins Ridge HR Apr-15 W184 24,837 Hopkins Ridge HR Apr-15 W184 13,037 Hopkins Ridge HR Apr-15 W184 22,496 Klondike III K3 Oct-13 W237 16,041 58, Vintage Klondike III K3 Oct-13 W237 14,164 68, Vintage Klondike III K3 Oct-13 W237 9, , Vintage Klondike III K3 Oct-13 W237 6,499 17, Vintage Klondike III K3 Oct-13 W237 4,082 Klondike III K3 Nov-13 W Klondike III K3 Nov-13 W237 3,641 Klondike III K3 Nov-13 W237 4,522 Klondike III K3 Mar-14 W237 4,000 Klondike III K3 Jul-14 W237 18,439 Klondike III K3 Jul-14 W237 12,249 Klondike III K3 Jul-14 W237 10,448 Klondike III K3 Jul-14 W237 5,856 Klondike III K3 Jul-14 W237 7,926 Klondike III K3 Jul-14 W237 9,547 Klondike III K3 Aug-14 W237 6,730 Klondike III K3 Aug-14 W237 8,102 Klondike III K3 Aug-14 W237 9,982 Klondike III K3 Aug-14 W237 10,186 Klondike III K3 Oct-14 W237 2,256 Klondike III K3 Oct-14 W237 2,957 REDACTED REDACTED Klondike III K3 Oct-14 W237 14,575 Klondike III K3 Oct-14 W237 13,120 Klondike III K3 Jan-15 W237 11,854 Klondike III K3 Jan-15 W237 13,146 Klondike III K3 Apr-15 W237 6,455 Klondike III K3 Apr-15 W237 10,070 Klondike III K3 Apr-15 W237 6,107 Klondike III K3 Apr-15 W237 10,298 Klondike III K3 Apr-15 W237 7,733 Klondike III K3 Jun-15 W237 3,410 Klondike III K3 Jun-15 W237 6,590 Klondike III K3 Aug-15 W237 1,516 Klondike III K3 Aug-15 W237 6,429
42 Lower Snake River-Dodge Junction DJ Oct-14 W , , Vintage Lower Snake River-Dodge Junction DJ Oct-14 W , , Vintage Lower Snake River-Dodge Junction DJ Oct-14 W ,424 Lower Snake River-Dodge Junction DJ Oct-14 W ,926 Lower Snake River-Dodge Junction DJ Oct-14 W ,127 Lower Snake River-Dodge Junction DJ Oct-14 W ,464 REDACTED REDACTED Lower Snake River-Dodge Junction DJ Oct-14 W ,161 Lower Snake River-Dodge Junction DJ Oct-14 W ,132 Lower Snake River-Dodge Junction DJ Apr-15 W ,897 Lower Snake River-Dodge Junction DJ Apr-15 W ,553 Lower Snake River-Dodge Junction DJ Apr-15 W ,548 Lower Snake River-Dodge Junction DJ Apr-15 W ,956 Lower Snake River-Phalen Gulch PG Oct-14 W , , Vintage Lower Snake River-Phalen Gulch PG Oct-14 W , , Vintage Lower Snake River-Phalen Gulch PG Oct-14 W ,056 12, Vintage Lower Snake River-Phalen Gulch PG Oct-14 W ,776 Lower Snake River-Phalen Gulch PG Oct-14 W ,782 Lower Snake River-Phalen Gulch PG Oct-14 W ,555 REDACTED REDACTED Lower Snake River-Phalen Gulch PG Oct-14 W ,855 Lower Snake River-Phalen Gulch PG Oct-14 W ,789 Lower Snake River-Phalen Gulch PG Oct-14 W ,948 Lower Snake River-Phalen Gulch PG Apr-15 W ,547 Lower Snake River-Phalen Gulch PG Apr-15 W ,269 Lower Snake River-Phalen Gulch PG Apr-15 W ,582 Lower Snake River-Phalen Gulch PG Apr-15 W ,673 Lower Snake River-Phalen Gulch PG Apr-15 W ,732 GRAND TOTAL 3,095,702 3,095,702
Enter information in green-shaded fields. Do not modify blue-shaded fields. Energy Independence Act (EIA) Renewable Energy Report 2017
 Renewable Energy Report 2017") Enter information in green-shaded fields. Do not modify blue-shaded fields. Energy Independence Act (EIA) Energy Report Loads and Resources 2015 Annual Load (MWh) 6,474,983 Report Date May 31, 2016 Annual
Enter information in green-shaded fields. Do not modify blue-shaded fields. Energy Independence Act (EIA) Energy Report Loads and Resources 2015 Annual Load (MWh) 6,474,983 Report Date May 31, 2016 Annual
Portland General Electric Renewable Portfolio Standard Oregon Compliance Report 2013
 Portland General Electric Renewable Portfolio Standard Oregon Compliance Report 2013 As an introduction and summary of the Compliance Report, answer the following questions: Why is PGE submitting a Compliance
SB 838: Oregon Renewable Energy Act Establishing an Oregon Renewable Energy Standard
 SB 838: Oregon Renewable Energy Act Establishing an Oregon Renewable Energy Standard Section-by-Section Summary SB 838 with -2 Amendments as introduced in Senate Environment Committee, March 15 th, 2007
SB 838: Oregon Renewable Energy Act Establishing an Oregon Renewable Energy Standard
 SB 838: Oregon Renewable Energy Act Establishing an Oregon Renewable Energy Standard Section-by-Section Summary SB 838, C-engrossed version As passed by Oregon House of Representatives, May 23 rd, 2007.
Pacific Power Renewable Portfolio Standard Oregon Implementation Plan January 1, 2014
 Pacific Power 2015-2019 January 1, 2014 (Updated February 28, 2014) Pursuant to S 469A.075 and OAR 860-083-0400, PacifiCorp, d.b.a. Pacific Power (the Company or PacifiCorp), respectfully submits the Oregon
Developing an Incremental Cost Methodology: Washington s Experience
 Developing an Incremental Cost Methodology: Washington s Experience Jeremy Twitchell, Regulatory Analyst National Summit on RPS September 23, 2014 Background: Washington s RPS Created in 2006 by voter
2017 IRP Advisory Group. June 22, 2017 IRPAG
 2017 IRP Advisory Group Today s Agenda 2 Purpose of IRP WAC 480-100-238 Integrated resource planning. 1) Purpose. Each electric utility regulated by the commission has the responsibility to meet its system
For Bandon Utilities Commission
 For Bandon Utilities Commission July 12, 2017 Profile BPA, a component of the U.S. Department of Energy, is a non-profit and self-funded power marketing administration in the Pacific Northwest. Congress
Renewable Portfolio Standards
 Renewable Portfolio Standards Lisa Schwartz Presentation to Oregon State University Energy Economics Class Feb. 22, 2010 The Regulatory Assistance Project China EU India United States About the Regulatory
Issue In accordance with the Oregon Renewable Portfolio Standard (RPS), EWEB s 2016 RPS Compliance report is attached for Board review.
, EWEB s 2016 RPS Compliance report is attached for Board review.") M E M O R A N D U M EUGENE WATER & ELECTRIC BOARD TO: Commissioners Helgeson, Brown, Mital, Simpson and Carlson FROM: Greg Brownell, Portfolio Management and Pricing Supervisor, and Catherine Gray, Senior
M E M O R A N D U M EUGENE WATER & ELECTRIC BOARD TO: Commissioners Helgeson, Brown, Mital, Simpson and Carlson FROM: Greg Brownell, Portfolio Management and Pricing Supervisor, and Catherine Gray, Senior
Executive Summary PSE Integrated Resource Plan. Contents. Chapter 1: Executive Summary
 1 2017 PSE Integrated Resource Plan Executive Summary The IRP is best understood as a forecast of resource additions that appear to be cost effective given what we know today about the future. We know
UPDATE: RENEWABLE PORTFOLIO STANDARDS IN THE NORTHWEST - A renewable power struggle?
 UPDATE: RENEWABLE PORTFOLIO STANDARDS IN THE NORTHWEST - A renewable power struggle? Marlys Palumbo Van Ness Feldman, PC Seattle Small Hydropower Workshop September 22-23, 2011 RPS Policies www.dsireusa.org
Portland General Electric 2016 Integrated Resource Plan. OPUC Public Meeting December 20, 2016
 Portland General Electric 2016 Integrated Resource Plan OPUC Public Meeting December 20, 2016 Agenda Process and Compliance Approach and Summary Analysis Action Plan Next steps 2 2013 IRP Order Resource
Comparison of Renewable Portfolio Standards (RPS) Programs in PJM States
 Programs in PJM States") Regulation or Legislation Geographic Eligibility Reporting Period Banking Credit Multipliers Technology - Specific (set asides) NJ MD DC PA DE HB 1308 / SB 869 (2004) Bill 15-747 (4/12/2005) SB 1030/Act
Regulation or Legislation Geographic Eligibility Reporting Period Banking Credit Multipliers Technology - Specific (set asides) NJ MD DC PA DE HB 1308 / SB 869 (2004) Bill 15-747 (4/12/2005) SB 1030/Act
IRP Advisory Group 2017 IRP Kick Off
 IRP Advisory Group 2017 IRP Kick Off 2017 IRP Kick Off 12:30 12:50 Introductions and Check In 12:50 1:10 IRP Process Overview 12:50 1:20 Stakeholder Process Updates 1:20 1:45 Ground Rules 1:45 3:15 Review
SMUD. Renewable Energy. Resources Eligibility Guidebook. First Edition October 2008 SACRAMENTO MUNICIPAL UTILITY DISTRICT
 SMUD Renewable Energy Resources Eligibility Guidebook First Edition October 2008 SACRAMENTO MUNICIPAL UTILITY DISTRICT Prepared By Elaine Sison-Lebrilla ADVANCED, RENEWABLE AND DISTRIBUTED GENERATION TECHNOLOGIES
Business Practice Manual for The Transmission Planning Process
 Business Practice Manual for The Transmission Planning Process Posted: June 2, 2015 Intentionally left blank TABLE OF CONTENTS 1. Introduction... 9 1.1. Purpose of California ISO Business Practice Manuals...
PUBLIC UTILITY DISTRICT NO.1 OF FRANKLIN COUNTY INTEGRATED RESOURCE PLAN PREPARED IN COLLABORATION WITH
 PUBLIC UTILITY DISTRICT NO.1 OF FRANKLIN COUNTY INTEGRATED RESOURCE PLAN 2014 PREPARED IN COLLABORATION WITH Contributors Name Company Title Linda Esparza Franklin PUD Director of Power Management Richard
Oregon Renewable Energy Resources
 Background Brief on September 2012 Inside this Brief Overview of Renewable Energy Renewable Portfolio Standard Energy Facility Siting Renewable Energy Legislation Staff and Agency Contacts State Capitol
Alternative Energy Pros and Cons and How to Teach
 Alternative Energy Pros and Cons and How to Teach Masoud Fathizadeh, PhD, PE Purdue University Northwest, fthizad@pnw.edu Abstract Wind and solar energies are becoming viable alternatives for electrical
Bad News and Good News
 Regional Regulatory Policy The View From Washington Buying & Selling Electric Power in the West January 14 & 15, 2008 Mark Sidran, Chairman Washington Utilities & Transportation Commission 1 Bad News and
Time-Varying Value of Energy Efficiency
 Time-Varying Value of Energy Efficiency ACEEE Energy Efficiency as a Resource David Nemtzow (DOE/BTO) Natalie Mims (LBNL) November 1, 2017 This work was supported by the DOE Office of Energy Efficiency
CCA Terms Glossary. Valley Clean Energy Alliance. i CCA Terms Glossary
 CCA Terms Glossary Valley Clean Energy Alliance i CCA Terms Glossary Table of Contents Energy Basics... 1 Wholesale Energy Services... 1 Finance... 2 Rate Setting... 3 Call Center and Data Management...
Bad News and Good News
 Mark H. Sidran of Washington Utilities and Transportation Commission Speaker 4: 1 Regional Regulatory Policy The View From Washington Buying & Selling Electric Power in the West January 14 & 15, 2008 Mark
Eugene Water & Electric Board. The Future of Utilities in the Pacific Northwest
 Eugene Water & Electric Board The Future of Utilities in the Pacific Northwest 1 Eugene Water & Electric Board The Future of Utilities in the Pacific Northwest Erin Erben Manager, Power & Strategic Planning
Electricity Supply. Monthly Energy Grid Output by Fuel Type (MWh)
") For the first quarter of 2015, Ontario experienced overall demand that was typical for the province in winter, and strong generator output. Demand for Ontario electricity increased as a result of cold
For the first quarter of 2015, Ontario experienced overall demand that was typical for the province in winter, and strong generator output. Demand for Ontario electricity increased as a result of cold
PJM EIS Generation Attribute Tracking System (GATS)
") PJM EIS Generation Attribute Tracking System (GATS) Presented to NASEO 2015 Mid-Atlantic Regional Meeting June 22, 2015 Who is PJM EIS? PJM Environmental Information Services, Inc. Formed in February 2005
PJM EIS Generation Attribute Tracking System (GATS) Presented to NASEO 2015 Mid-Atlantic Regional Meeting June 22, 2015 Who is PJM EIS? PJM Environmental Information Services, Inc. Formed in February 2005
Exploring the Impacts of California s Renewable Portfolio Standard
 Exploring the Impacts of California s Renewable Portfolio Standard System Planning Committee April 2010 Table of Contents Purpose... 1 Vocabulary... 1 System Planning Committee s Initial Assessment...
2017 IRP Advisory Group. July 21, 2017 IRPAG
 2017 IRP Advisory Group Today s Agenda 2 General Rate Case Caution Need to avoid the possibility of unintentionally violating ex-parte communication rules Please refrain from bringing up any rate case
Renewables Portfolio Standard (RPS) Sara Kamins April 2, 2008
 Sara Kamins April 2, 2008") Renewables Portfolio Standard (RPS) Sara Kamins April 2, 2008 RPS Presentation RPS Policy RPS Procurement Process RPS Compliance Rules Progress Towards Goals Project Development Hurdles Future of RPS 2
Renewables Portfolio Standard (RPS) Sara Kamins April 2, 2008 RPS Presentation RPS Policy RPS Procurement Process RPS Compliance Rules Progress Towards Goals Project Development Hurdles Future of RPS 2
Pacific Coast Oil Trust FEDERAL INCOME TAX INFORMATION
 Pacific Coast Oil Trust 2013 FEDERAL INCOME TAX INFORMATION -1- (Pacific Coast Oil Trust) 2013 FEDERAL INCOME TAX INFORMATION This booklet provides 2013 tax information which will allow Certificate Holders
Capacity Performance Training. June 24, 2015
 Capacity Performance Training June 24, 2015 Training Objectives Provide Capacity Market Sellers with information necessary to participate in the Reliability Pricing Model (RPM) under a Capacity Performance
Draft Renewable Portfolio Standard Rule
 Draft Renewable Portfolio Standard Rule Submitted to the President of the Senate and the Speaker of the House of Representatives to Fulfill the Requirements of Section 366.92(3), Florida Statutes Florida
Washington Conservation and Respect Report 2016
 Washington Conservation and Respect Report 2016 Protecting and enhancing the environment is a core principle for Pacific Power. While providing safe, reliable electric service to our customers, we strive
Renewable energy - the future is now
 University of Nevada, Las Vegas Digital Scholarship@UNLV UNLV Renewable Energy Symposium 2007 UNLV Energy Symposium Aug 15th, 9:00 AM - Jul 15th, 10:00 AM Renewable energy - the future is now Thomas Fair
Financing Renewable Energy Projects. Part I: Government Subsidies
 Financing Renewable Energy Projects Part I: Government Subsidies Part I: Government Subsidies Goals of Government Subsidies Renewable Portfolio Standards and Renewable Energy Certificates Illinois Renewable
IRP 101. Intro to Integrated Resource Planning. Scott Benson Manager, Resource & Transmission Planning. March 23, 2017
 IRP 101 Intro to Integrated Resource Planning Scott Benson Manager, Resource & Transmission Planning March 23, 2017 1 What is an IRP? Definition Integrated resource planning is a process by which a power
Capacity Performance Training. March 16, 2015
 Capacity Performance Training March 16, 2015 Training Objectives Provide Capacity Market Sellers with information necessary to participate in the Reliability Pricing Model (RPM) under a Capacity Performance
Section 3 Characteristics of Credits Types of units. Economic Noneconomic Generation.
 Section 3 Operating Reserve Operating Reserve Day-ahead and real-time operating reserve credits are paid to market participants under specified conditions in order to ensure that resources are not required
Emission Rate Credits (ERCs) in the Clean Power Plan
 in the Clean Power Plan") Harvard Environmental Policy Initiative Emission Rate Credits (ERCs) in the Clean Power Plan An FAQ for States and Stakeholders Ari Peskoe October 20, 2015 An updated version of this document may be available
Harvard Environmental Policy Initiative Emission Rate Credits (ERCs) in the Clean Power Plan An FAQ for States and Stakeholders Ari Peskoe October 20, 2015 An updated version of this document may be available
Page 1. Pty Ltd. provides. Key points. The SRES. 30 June 2012; The price of just over $ which is. The STP. year the.
 RESEARCH NOTE 2 Understanding the Small-scale Renewable Energy Scheme This Research Note has been prepared for r the REC Agents Association by Green Energy Markets Pty Ltd. This research note analyses
Community-Based Renewable Energy
 Community-Based Renewable Energy This Act directs the state public utilities commission to set up a pilot program to encourage developing community-based renewable energy facilities. The Act permits the
Regulatory Assistance Project. Emissions Performance Standards in Selected States
 ResearchBrief Regulatory Assistance Project November 2009 Emissions Performance Standards in Selected States The Regulatory Assistance Project Research Staff prepared this summary of Emissions Performance
Puget Sound Energy, Inc., Docket No. ER Filing of Revisions to OATT Schedules 4 and 9
 A LIMITED LIABILITY PARTNERSHIP 1050 Thomas Jefferson Street, NW Seventh Floor Washington, DC 20007 (202) 298-1800 Phone (202) 338-2416 Fax GARY D. BACHMAN (202) 298-1880 gdb@vnf.com VIA E-TARIFF FILING
Village of Morrisville Water & Light Department Integrated Resource Plan
 Village of Morrisville Water & Light Department Integrated Resource Plan 2015 2034 Part 1 Utility Overview Presented to the Vermont Public Service Board July 17, 2015 Submitted by: Vermont Public Power
Colorado PUC E-Filings System
 Page of BEFORE THE PUBLIC UTILITIES COMMISSION OF THE STATE OF COLORADO * * * * IN THE MATTER OF THE APPLICATION OF PUBLIC SERVICE COMPANY OF COLORADO FOR APPROVAL OF ITS 0 ELECTRIC RESOURCE PLAN ) ) )
Rhode Island Renewable Energy Standard. Annual RES Compliance Report for Compliance Year 2015
 STATE OF RHODE ISLAND AND PROVIDENCE PLANTATIONS Rhode Island Renewable Energy Standard Annual RES Compliance Report for Compliance Year 2015 June 2017 Rhode Island Public Utilities Commission 89 Jefferson
Demand Response. Overview. Recommendations
 Section 6 Demand Response Demand Response Markets require both a supply side and a demand side to function effectively. The demand side of wholesale electricity markets is underdeveloped. Wholesale power
Load Serving Entity Definition Refinement Draft Final Proposal
 Updated: September 21, 2016 Table of Contents 1. Executive Summary... 4 2. Scope of Initiative... 6 3. Changes to this proposal... 6 4. Stakeholder Engagement... 7 5. Background... 8 Allocation of Congestion
Transmission Planning at the Midwest ISO. Mr. Eric Laverty Senior Manager of Transmission Access Planning Midwest ISO June 26 th, 2008
 Transmission Planning at the Midwest ISO Mr. Eric Laverty Senior Manager of Transmission Access Planning Midwest ISO June 26 th, 2008 Midwest ISO: What We Do Monitor flow of power over the high voltage
Published 2Q Meg Hendricks Industry Analyst. Clint Wheelock Managing Director. Renewable Energy Credit
 Renewable Energy Credit EXECUTIVE SUMMARY: Renewable Energy Certificates Supply and Demand Dynamics, Policy Factors, Industry Issues and Challenges, and Key Players: Market Analysis and Forecasts Published
California s Renewable Portfolio Standard Program
 California s Renewable Portfolio Standard Program By Annette Faraglia PG&E Law Dept. 2009 Annual NHA Conference Washington, D.C. May 12, 2009 California s Renewable Portfolio Standard ( RPS ) is one of
APPENDIX B: WHOLESALE AND RETAIL PRICE FORECAST
 APPENDIX B: WHOLESALE AND RETAIL PRICE FORECAST Contents Introduction... 3 Key Findings... 3 Background... 5 Methodology... 7 Inputs and Assumptions... 8 Load... 8 Fuel Prices... 9 Resources... 9 Pacific
Understanding Renewable Energy Credits
 Renewable energy generation facilities, like a community-owned solar array, create two distinct products: electricity and renewable energy credits (RECs). This brief report provides an overview of RECs
Energy Efficient, Green Building Incentives and Rebates
 2009 Energy Efficient, Green Building Incentives and Rebates Offering an outline to potential savings through rebates and incentives for new, energy efficient homes built 2009 in Western Washington AIKI
Final 2014 Flexible Capacity Needs Assessment
 Final 2014 Flexible Capacity Needs Assessment May 1, 2014 Table of Contents 1. Introduction... 2 2. Summary... 2 3. Defining the ISO System-Wide Flexible Capacity Need... 3 4. Forecasting Minute-by-Minute
NATIONAL RENEWABLE PORTFOLIO STANDARD: MYTHS AND FACTS. Rich Glick Director, Government Affairs PPM Energy, Inc. July 11, 2007
 NATIONAL RENEWABLE PORTFOLIO STANDARD: MYTHS AND FACTS Rich Glick Director, Government Affairs PPM Energy, Inc. July 11, 2007 PPM ENERGY Develops and operates wind energy projects 1,665 MW of operating
ENERGY AND WATER STATISTICS 2016
 ENERGY AND WATER STATISTICS 216 Introduction This issue of Economic and Social Indicators presents Statistics on Energy and Water for the years 215 and 216. The statistics have been compiled in close collaboration
Integrated Resource Plan
 2011 Integrated Resource Plan Addendum Let s turn the answers on. June 27, 2011 For more information, contact: PacifiCorp IRP Resource Planning 825 N.E. Multnomah, Suite 600 Portland, Oregon 97232 (503)
Powering Michigan Agriculture with Renewable Energy
 Powering Michigan Agriculture with Renewable Energy ENERGY AUDIT & RENEWABLE ENERGY ASSESSMENT ENERGY PYRAMID MICHIGAN STATE UNIVERSITY MI Agricultural Energy Use Significant MI Dairy Farms Energy Use
MPUC RPS Report Review of RPS Requirements and Compliance in Maine
 MPUC RPS Report 2011 - Review of RPS Requirements and Compliance in Maine Prepared by London Economics International LLC for the Maine Public Utilities Commission January 30, 2012 Pursuant to An Act To
Utah Conservation and Respect Report 2014
 Utah Conservation and Respect Report 2014 Providing safe, reliable electric service has been our job for more than a century. A big part of that job is respecting the environment. We strive to be good
Manitoba Hydro - Power Plants and SWOT Analysis, 2011 Update
 Manitoba Hydro - Power Plants and SWOT Analysis, 2011 Update #43357 $1000 53 pages In Stock Report Description The report contains the profile of the company that is involved in the field of power generation
August 22, 2014 FIRE ISLAND WIND
 August 22, 2014 FIRE ISLAND WIND Phase 1 Summary: Performance Project Performance: Benefits realized: 93,500 MWh LTD >875,000 MCF of NG burn avoided ~$6.5 MM in NG purchases avoided 55,000 tons of CO2
MEMORANDUM. January 6, Power Committee. Maury Galbraith. Draft Sixth Plan Electricity Price Forecasts
 W. Bill Booth Chair Idaho James A. Yost Idaho Tom Karier Washington Dick Wallace Washington Bruce A. Measure Vice-Chair Montana Rhonda Whiting Montana Melinda S. Eden Oregon Joan M. Dukes Oregon January
California ISO. Q Report on Market Issues and Performance. July 10, Prepared by: Department of Market Monitoring
 California Independent System Operator Corporation California ISO Q1 2017 Report on Market Issues and Performance July 10, 2017 Prepared by: Department of Market Monitoring TABLE OF CONTENTS Executive
THE NEED FOR GREEN-E CERTIFICATION AND VERIFICATION IN AN ERA OF RENEWABLE ENERGY TRACKING SYSTEMS
 Issue Brief THE NEED FOR GREEN-E CERTIFICATION AND VERIFICATION IN AN ERA OF RENEWABLE ENERGY TRACKING SYSTEMS MARCH 2004 PREPARED BY: Dan Lieberman Green-e Program Manager Restructured Markets Center
ERCOT in 2018: Challenges & Opportunities
 ERCOT in 2018: Challenges & Opportunities Bill Magness President & CEO ERCOT Texas-Germany Bilateral Dialogue on Challenges and Opportunities in the Electricity Market February 27, 2108 What is ERCOT?
Load Shift Working Group. https://gridworks.org/initiatives/load-shift-working-group/
 Load Shift Working Group APRIL 18 10AM 2PM PST CPUC GOLDEN GATE ROOM https://gridworks.org/initiatives/load-shift-working-group/ Agenda 10:00 10:20am: Intro and Purpose (Gridworks) 10:20 12:00pm: Grid
ESCI-61 Introduction to Photovoltaic Technology
 April 7, 2010 1 ESCI-61 Introduction to Photovoltaic Technology Lecture #1 Ridha Hamidi, Ph.D. April 7, 2010 2 Today s Agenda 3:30-4:00 - Green sheet review and introductions 4:00-4:45 - Group Research
Pumped hydro Storage Plants
 Pumped hydro Storage Plants Olivier Teller, Product Director PSP 15 Nov 2012 PSP >130 GW (99% world electricity storage) Market: 6 GW/year Europe: ~1.5GW/year 100 years / illimited cycle numbers ~1000
Final Flexible Capacity Needs Assessment for 2018
 Final Flexible Capacity Needs Assessment for 2018 April 28, 2017 1 Table of Contents 1. Introduction... 3 2. Summary... 3 3. Defining the ISO System-Wide Flexible Capacity Need... 5 4. Forecasting Minute-by-Minute
ANNUAL REPORT ON MARKET ISSUES & PERFORMANCE
 ANNUAL REPORT ON MARKET ISSUES & PERFORMANCE Department of Market Monitoring ACKNOWLEDGEMENT The following members of the Department of Market Monitoring contributed to this report Eric Hildebrandt Keith
Senate Bill 326. Revises provisions relating to the renewable energy portfolio standard
 Senate Bill 326 Revises provisions relating to the renewable energy portfolio standard Purpose of Measure Senate Bill 326 requires the Public Utilities Commission of Nevada to authorize an electric service
Wind Workshop. Technical Characterization: Dependable Capacity & Firm Energy 10:00-10:30am
 Wind Workshop Technical Characterization: Dependable Capacity & Firm Energy 10:00-10:30am Objective of this session: Understand BC Hydro s definitions and calculation methodology of dependable capacity
Open Access Transmission Tariff ATTACHMENT K
 ATTACHMENT K PART I Introduction The Transmission Provider s (herein referred to as Tacoma Power) local transmission planning process will include open planning meetings that Tacoma Power will conduct
Impact of Renewable Energy Certificate (REC) Mechanism in India
 Mechanism in India") Impact of Renewable Energy Certificate (REC) Mechanism in India Authors: S. K. Soonee, K. V. S. Baba, U. K. Verma, Minaxi Garg, Shailendra Kr. Verma and K. C. Saini Power System Operation Corporation Ltd.
Impact of Renewable Energy Certificate (REC) Mechanism in India Authors: S. K. Soonee, K. V. S. Baba, U. K. Verma, Minaxi Garg, Shailendra Kr. Verma and K. C. Saini Power System Operation Corporation Ltd.
Renewables Portfolio Standards in the United States: A Status Update
 Renewables Portfolio Standards in the United States: A Status Update Galen Barbose Lawrence Berkeley National Laboratory Renewable Energy Markets 214 December 4, 214 This analysis was funded by the National
Regional Coordination in the West: Benefits of PacifiCorp and California ISO Integration
 Regional Coordination in the West: Benefits of PacifiCorp and California ISO Integration Technical Appendix October 2015 Regional Coordination in the West: Benefits of PacifiCorp and California ISO Integration
Development of a New Extended Motor Product Label for Inclusion in Energy Efficiency Programs (ID 401)
") Development of a New Extended Motor Product Label for Inclusion in Energy Efficiency Programs (ID 401) Ethan A. Rogers, Senior Program Manager, Industry 2014 ACEEE Summer Study on Energy Efficiency Buildings
Development of a New Extended Motor Product Label for Inclusion in Energy Efficiency Programs (ID 401) Ethan A. Rogers, Senior Program Manager, Industry 2014 ACEEE Summer Study on Energy Efficiency Buildings
Invenergy. The Power of Innovation
 The Power of Innovation Discussion Outline Introduction to Wind generation development 101 The impact of HB 1871 The Illinois state RPS Wind Overview Operational Projects Contracted Projects Offices Midwest
Does Water Resources Management in the Snake River Basin Matter for the Lower Columbia River? Or Is the Snake River Part of Another Watershed?
 Does Water Resources Management in the Snake River Basin Matter for the Lower Columbia River? Or Is the Snake River Part of Another Watershed? John C. Tracy, Director Idaho Water Resources Research Institute
Electricity Scenario Analysis. for the. Vermont Comprehensive Energy Plan 2011
 Electricity Scenario Analysis for the Vermont Comprehensive Energy Plan 2011 REVISED: September 19, 2011 Table of Contents 1. DEFINITION OF SCENARIOS... 1 2. ELECTRICITY SCENARIO MODELING... 3 A. DISPATCH
4 PLANNING DATA AND WATER DEMAND FORECASTING
 4 PLANNING DATA AND WATER DEMAND FORECASTING This chapter discusses the planning data and water demand forecast information used to assess the current and future capabilities of the District s water system.
Hedging Coal Price Risk in a Deregulated Power Market
 Hedging Coal Price Risk in a Deregulated Power Market Ginny Farrow Manager Rail Car Fleet NCCI Spring Conference Greensboro, NC April 12, 2007 Safe Harbor Statement This Presentation contains forward-looking
Climate Action Planning at Rice University. Richard R. Johnson Admin. Center for Sustainability and Energy Management 27 April 2016
 Climate Action Planning at Rice University Richard R. Johnson Admin. Center for Sustainability and Energy Management 27 April 2016 Mid 2000s: Climate Change Reaches Mainstream Rice University Commits to
Residual imbalance energy settlement and ramp rate changes for self-scheduled variable energy resources
 Market Issues Bulletin Residual imbalance energy settlement and ramp rate changes for self-scheduled variable energy resources March 10, 2015 www.caiso.com 250 Outcropping Way, Folsom, CA 95630 916.351.4400
INTRODUCTION TO GREEN-E ENERGY
 INTRODUCTION TO GREEN-E ENERGY 2011 Webinar Series August 25, 2011 Anne-Franziska Sinner Green-e Energy Analyst Jeff Swenerton Communications Director Outline 1. Welcome/About Us 2. Renewable Energy Basics
Solar Incentives and Development: Potential Impact of Federal Legislation
 Photo by Harold Ipolyi Kelley Dagley and his wife Lori build the largest net-metered residential solar system in Idaho. At 25kW, it supplies all the power for the couple s 100% electric house on top of
Appendix C. Regulatory Compliance Matrix DRAFT 2018 OR IRP
 Matrix DRAFT 2018 OR IRP Matrix Page 2 Order No. 07-047 Guideline (1)(a) Guideline (1)(b) All resources must be evaluated on a consistent and comparable basis All known resources for meeting the utility
Schedule 2 TECHNICAL INFORMATION
 Schedule 2 TECHNICAL INFORMATION This document is intended to provide context to the Haida Gwaii Request for Expressions of Interest (RFEOI) for the potential electricity supply opportunity for clean electricity
May 9, This presentation will summarize some key takeaways from the most recent Pacificorp Integrated Resource Plan (IRP) filed in April 2017
 filed in April 2017") Henry Lorenzen Chair Oregon Bill Bradbury Oregon Guy Norman Washington Tom Karier Washington W. Bill Booth Vice Chair Idaho James Yost Idaho Jennifer Anders Montana Tim Baker Montana May 9, 2017 MEMORANDUM
Henry Lorenzen Chair Oregon Bill Bradbury Oregon Guy Norman Washington Tom Karier Washington W. Bill Booth Vice Chair Idaho James Yost Idaho Jennifer Anders Montana Tim Baker Montana May 9, 2017 MEMORANDUM
PGE s 2013 Integrated Resource Plan
 PGE s 2013 Integrated Resource Plan OPUC Public Meeting 2014 Portland General Electric. All rights reserved. Today s topics IRP public process Load-resource balance Assumptions and inputs E3 low-carbon
Opportunity for NC. January 25, Alex Hobbs, PhD, PE NC Solar Center. ncsu Advancing Renewable Energy for a Sustainable Economy
 Biomass & CHP Opportunity for NC Energy Policy Council January 25, 2010 Alex Hobbs, PhD, PE NC Solar Center www.ncsc.ncsu.edu ncsu NC REPS Definition of Biomass The NCUC decided not to expand the definition
RATE 665 RENEWABLE FEED-IN TARIFF
 NORTHERN INDIANA PUBLIC SERVICE COMPANY Third Revised Sheet No. 104 Superseding Second Revised Sheet No. 104 TO WHOM AVAILABLE No. 1 of 11 Sheets This is a rate that is a voluntary offer available to any
APRIL 23, Capacity Value of Wind Assumptions and Planning Reserve Margin
 APRIL 23, 2014 Capacity Value of Wind Assumptions and Planning Reserve Margin Executive Summary Effective Load Carrying Capacity (ELCC), or capacity value, of variable generation and required planning
S. ll. To promote the production of clean energy, and for other purposes. IN THE SENATE OF THE UNITED STATES A BILL
 END0F DISCUSSION DRAFT S.L.C. TH CONGRESS ST SESSION S. ll To promote the production of clean energy, and for other purposes. IN THE SENATE OF THE UNITED STATES llllllllll Mr. GRAHAM introduced the following
Fundamentals of Policy. Matt Clouse U.S. Environmental Protection Agency Renewable Energy Markets Conference September 16, 2009
 Fundamentals of Policy Matt Clouse U.S. Environmental Protection Agency Renewable Energy Markets Conference September 16, 2009 Discussion Goals This session should help you understand and participate in
Analysis of Solar Capacity Equivalent Values for the South Carolina Electric and Gas System
 Analysis of Solar Capacity Equivalent Values for the South Carolina Electric and Gas System John D. Wilson, Southern Alliance for Clean Energy March 21, 2017 The assessment of solar energy s contribution