Comparing the main indicators for population, GDP, energy, CO2 and electricity of dynamic economies: South Korea, Iran, Thailand, Turkey
|
|
|
- Ethel Watson
- 6 years ago
- Views:
Transcription
1 Renewables International - Comparing the main indicators for population, GDP, energy, CO2 and electricity of dynamic economies: South Korea, Iran, Thailand, Turkey Bernard CHABOT Sustainable Energy Expert and Trainer, Bernard_Chabot@yahoo.fr 1
2 Content Scope, main findings and conclusions: 3 References: 4 Back to basics: the Kaya identity and its ten indicators: 5-6 Population, primary energy and CO2 emissions 7-25 Comparisons of GDPppp, primary energy, CO2 emissions Focus on electricity Relative changes in energy, economy and carbon indicators
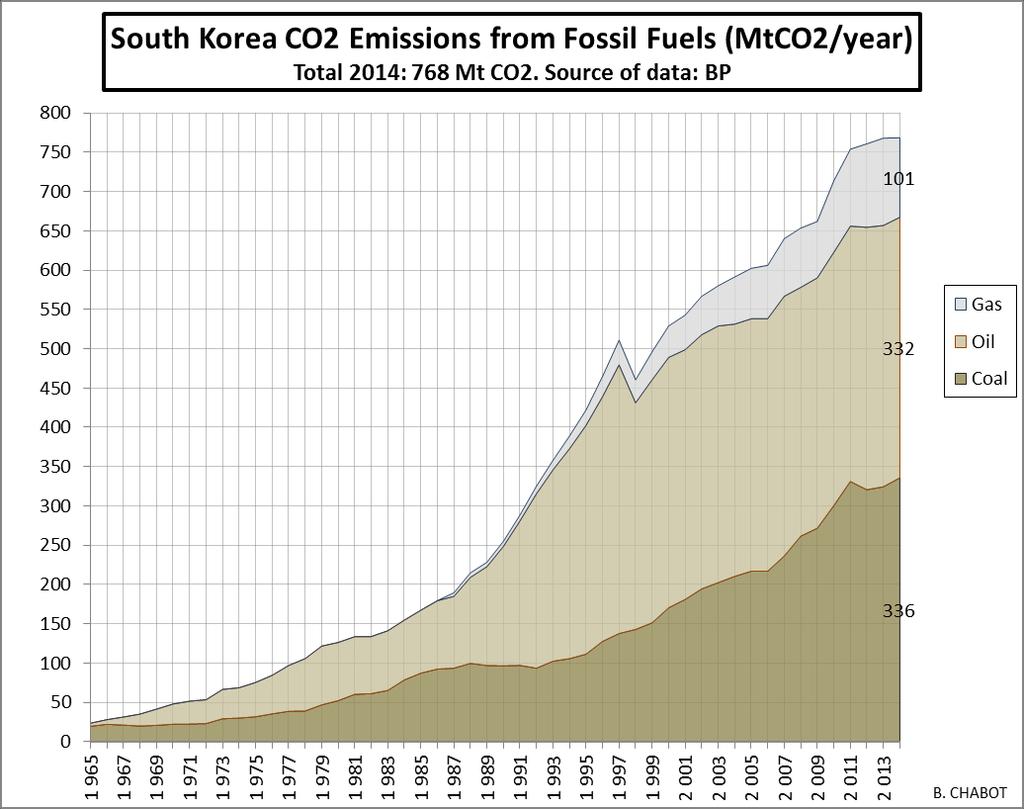
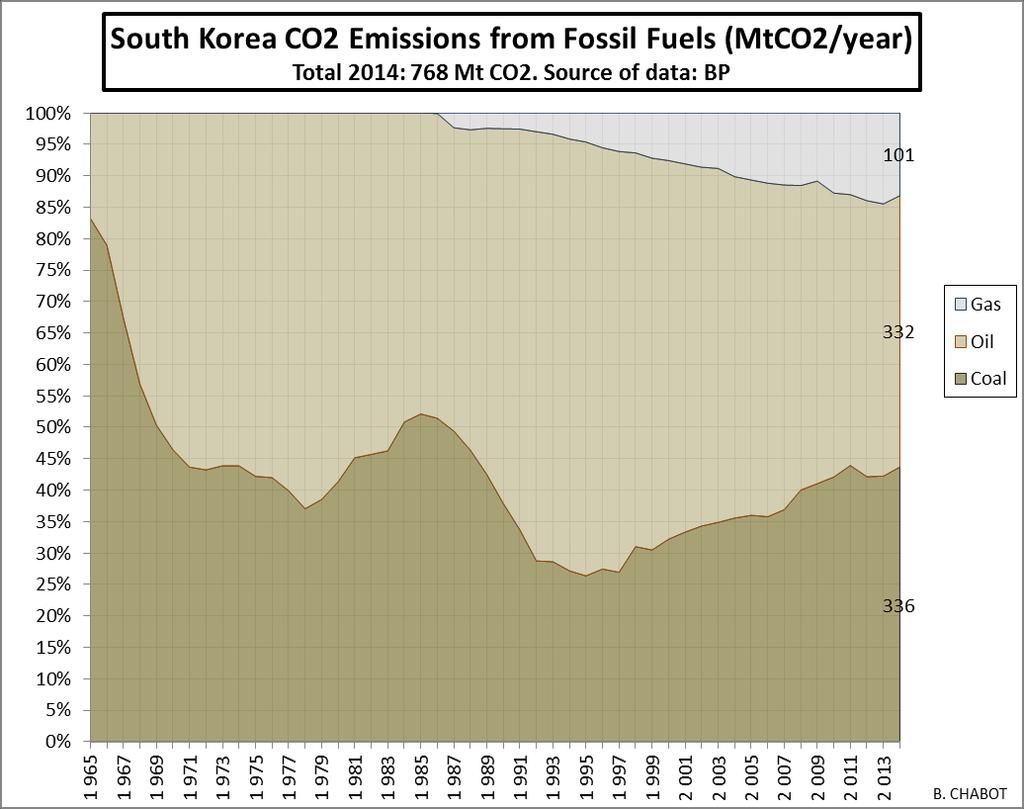
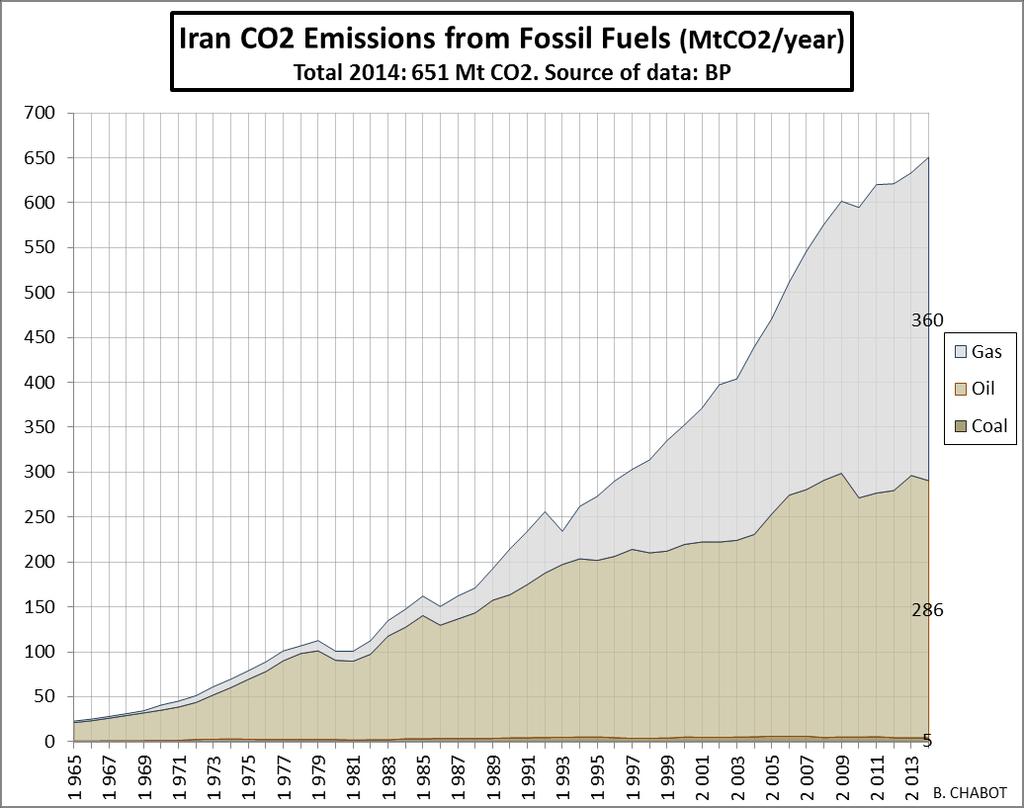
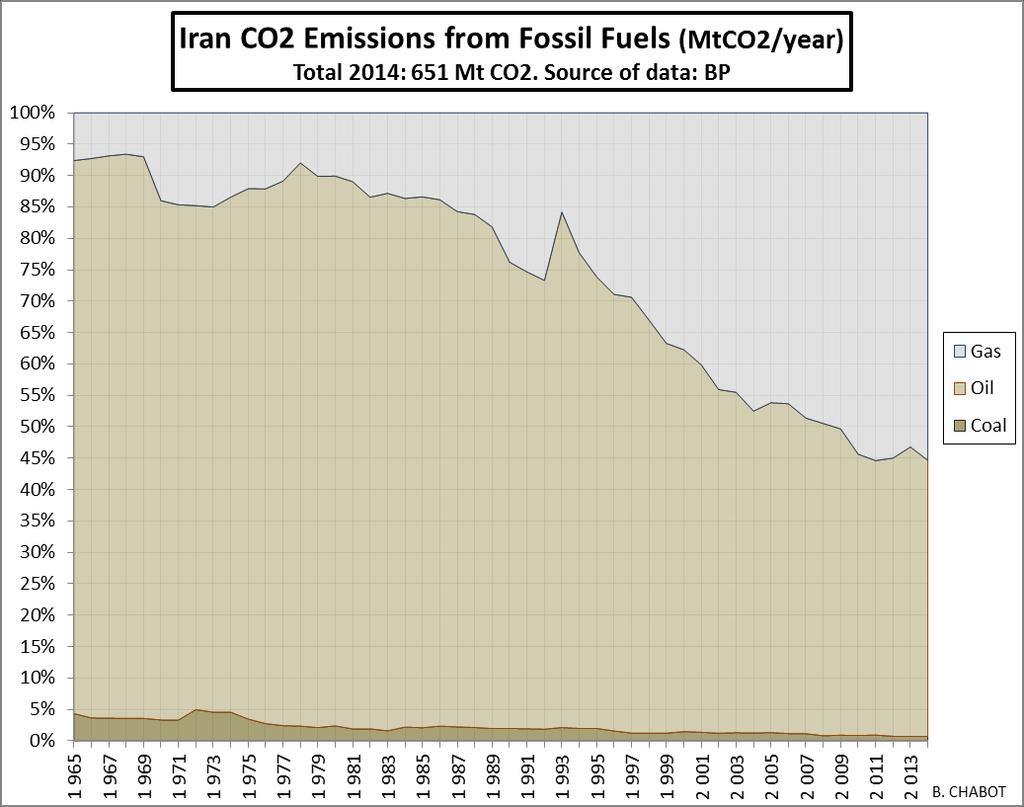
3 Scope, Main Findings and Conclusions This document presents a comparison of the parameters and indicators related to population, economy, energy and CO2 emissions of four selected countries that are within the 20 more CO2 emitting countries and are representative of historical and potential future tigers with growing economies: South Korea, Iran, Thailand, Turkey. Together they represent 268 million inhabitants (3.8 % of world population) and 2,114 MtCO2 or 6 % % of the 2014 CO2 emissions of 35.5 GtCO2 from fossil fuels combustion. Those CO2 emissions and their related ratios (CO2 per capita, carbon content of energy, carbon intensity of GDP) are either increasing too fast or are not sufficiently decreasing compared to the world average and many other developing and emerging countries. The 4 countries are very dependent from fossil fuels: 86 % in Korea, 98 % in Iran, 98 % in Thailand, and 90 % in Turkey. The only sensible historical renewables development was from large hydropower in Turkey with 7.3 % of primary energy supplies in Nuclear contribution is 13 % in South Korea and 0.4 % in Iran. South Korea is representative of the Asian tigers that developed strongly after WW2 like Japan, Taiwan, Hong-Kong and Singapore and that relied on fossil fuels and nuclear for their energy supplies. A challenge for future tigers is to avoid to base their development on fossil fuels by shifting directly to energy efficiency and modern renewables that are already less costly and of course more sustainable than post-fukushima nuclear energy. It will be important to analyse and to compare their 4 INDCs (Intended Nationally Determined Contributions, to be published before the COP21 in December) and to assess if they will sufficiently contribute or not by their policies and measures to the expected Paris agreement to limit the global warming to less than 2 C in the century compared to the pre-industrial level. 3
4 References 2014 CO2 emissions and energy balances: BP Statistical Review 2015 ( CO2 and other detailed data: IEA ( «CO2 Emissions From Fuel Combustion ». Refer to preceding analysis on CO2 downloadable as PDF from «Is it possible for developing countries to leapfrog to 100 % modern sustainable renewables? A serious proposal from Ethiopia», online August 19, 2015 Analysis of Total GHG Emissions of World, EU-28 and Selected Countries, With Reference to the Role of Sustainable Renewables, online August 12, 2015 Analysis of Primary Energy Consumption and of CO2 Emissions From Burning Coal, Oil and Gas in Main Emitting and Selected Areas and Countries, online July 27, 2015 «Analysis of the Global Electricity Production up to 2014 With a Focus on the Contribution From Renewables and on CO2 Emissions», online June 19, 2015 Comparing the main indicators for population, GDP, energy, CO2 and electricity of Australia, Canada, Russia, Saudi Arabia, on line March2015. Analysis of ten population, energy, economy and CO2 emissions parameters and indicators of the twenty larger CO2 emitting countries in 2012, on line February 17, «Comparing the main indicators for population, GDP, energy, CO2 and electricity of Japan, Germany, UK and France», on line January 7, «Comparing the main indicators for population, GDP, energy, CO2 and electricity of China, USA, European Union and India, on line December 17, 2014 Methodology and Case Study for Long Term Energy and CO2 Emissions Scenarios Based on the Kaya Identity, on line November 17, 2014, Analysis of Present CO2 Emissions, Primary Energy Consumption and GDPs of a Proposed Representative G30 Group of Countries, on line August 2, «Comparisons of CO2 emissions per capita on with a focus on years 1990, 2000 and 2010, on line July , Analysis of unsustainable inequalities of CO2 emissions from countries and per capita, on line July 16, The three Elephants in the Room : Coal, Oil and Gas in the Primary Energy Consumption (PEC) and their CO2 Emissions up to 2013, on line on July 9,
5 A precious tool for economic, energy and CO2 emissions analysis: the Kaya identity 5
6 CO2/capita The Kaya Identity: CO2 = (CO2/TPES) * (TPES/GDP) * (GDP/POP)*POP CO2 CO2 emissions ktco2/year POP Population Thousand TPES Total Prim. En. Supply Mtoe GDP Gross Dom. Product b$2005ppp Energy Intensity EI = TPES/GDP kgoe/$2005ppp Carbon Content CC = CO2/TPES tco2/toe Carbon Intensity CI = CO2/GDP kgco2/$2005ppp CO2 per capita CO2/POP tco2/capita GDP per capita GDP/POP $2005ppp/capita TPES per Capita TPES/POP toe/capita CO2 7 6 POP 1 2 TPES EI = Energy Intensity = TPES/GDP GDP Bernard CHABOT - BCCONSULT 6
7 . South Korea, Iran, Thailand, Turkey: population, primary energy consumption and CO2 emissions from fossil fuels 7
8 Ranking of 2014 CO2 emissions for the 20 more emitting countries Source of data: BP Statistical Review, 2015 CO2 Emissions from Fossil Fuels (MtCO2/year) Total World on ,0% Of w hich: OECD ,8% Non-OECD ,2% European Union ,4% 100,0% Rank Country MtCO2 % total Cum. % 1 China 9 761,1 27,5% 27,5% 2 US 5 994,6 16,9% 44,4% 3 India 2 088,0 5,9% 50,3% 4 Russia 1 657,2 4,7% 54,9% 5 Japan 1 343,1 3,8% 58,7% 6 Germany 798,6 2,2% 61,0% 7 South Korea 768,3 2,2% 63,1% 8 Saudi Arabia 665,0 1,9% 65,0% 9 Iran 650,4 1,8% 66,8% 10 Canada 620,5 1,7% 68,6% 11 Brazil 581,7 1,6% 70,2% 12 Indonesia 548,7 1,5% 71,8% 13 Mexico 499,9 1,4% 73,2% 14 United Kingdom 470,8 1,3% 74,5% 15 South Africa 452,2 1,3% 75,8% 16 Australia 374,9 1,1% 76,8% 17 Turkey 348,5 1,0% 77,8% 18 France 347,5 1,0% 78,8% 19 Italy 347,1 1,0% 79,8% 20 Thailand 346,9 1,0% 80,7% 8
9 With a total of 268 million people, the 4 countries represent 3.8 % of the 7.04 billion people in

10 South Korea: primary energy supply in 2014 Source of data: BP Statistical Review,
11 11
12 12
13 13

14 Iran: primary energy supplies in 2014 Source of data: BP Statistical Review,
15 15
16 16
17 17

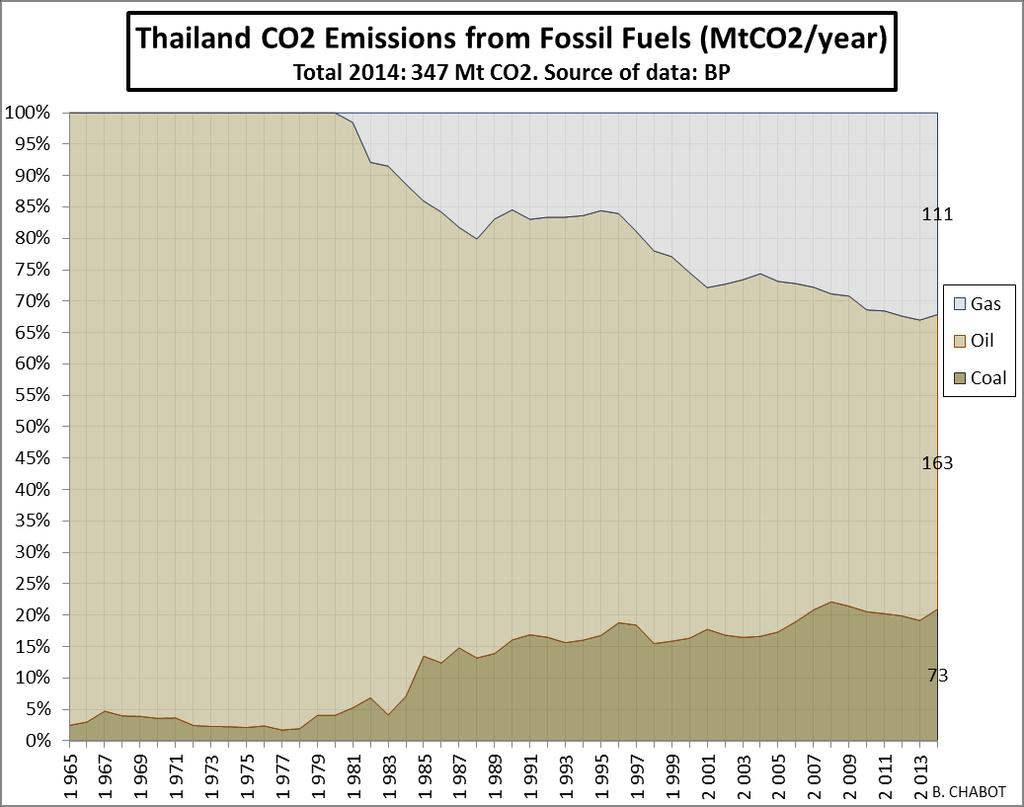
18 Thailand: primary energy supplies in 2014 Source of data: BP Statistical Review,
19 19
20 20
21 21

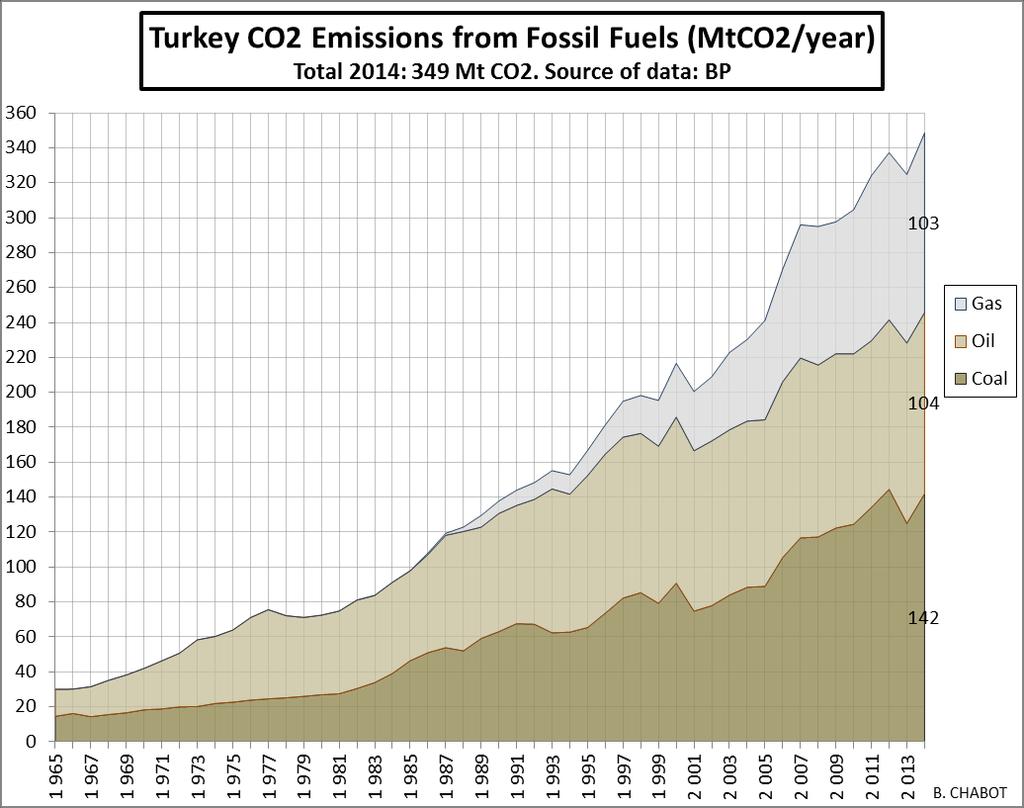
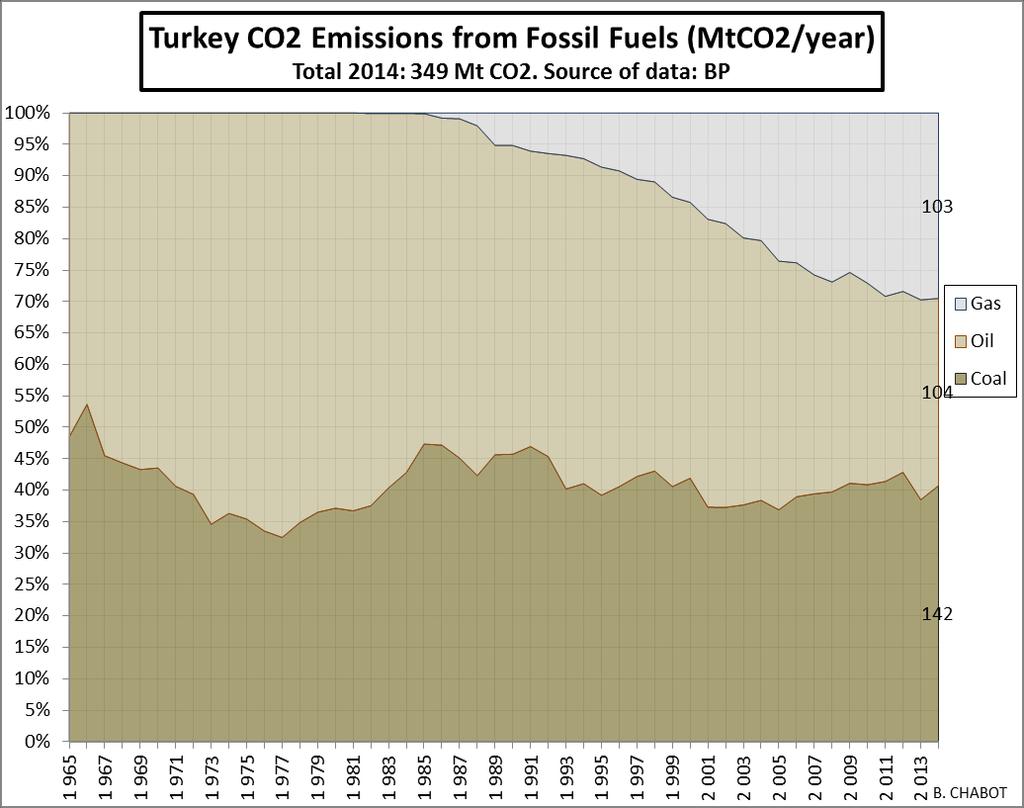
22 Turkey: primary energy supplies in 2014 Source of data: BP Statistical Review,
23 23
24 24
25 25
26 South Korea, Iran, Thailand, Turkey: comparisons of GDPppp, energy and CO2 emissions parameters and indicators 26
27 Economic growth is very strong in the four countries. 27
28 Growth of GDPppp per capita is also strong in the 4 countries since
29 Growth of the total primary energy supplies (TPES) is also strong in the 4 countries. 29
30 Primary energy consumption per capita is lower than the world average in Thailand and Turkey but is increasing more than the world average in the 4 countries. 30
31 Primary energy intensity is worse than the world average in South Korea and Iran and is not decreasing since 1970 in the 4 countries as fast as in the world. 31
32 The four countries are within the 20 larger CO2 emissions countries, with fast annual increases. 32
33 CO2 emissions per people are increasing in the 4 countries and faster than the world average. 33
34 There is no sufficient decrease in the carbon content of primary energy in the 4 countries. 34
35 . Creating a $ of GDPppp requires less primary energy in Thailand and Turkey than in the world and more in South Korea and Iran. Except in South Korea, there is not a sufficient decrease since 1970 compared to the world average decrease 35
36 South Korea, Iran, Thailand, Turkey: Focus on electricity 36
37 As other countries with dynamic economies, there is an increase of electricity demand with a large difference within South Korea and the 3 other countries. 37
38 Electricity production per capita in Thailand is still lower than the world average, with a large difference within South Korea and the 3 other countries. 38
39 Creating a $2005ppp of GDP requires more electricity in South Korea than the world average, compared to less in the 3 other countries, but the ratio is increasing except recently in Thailand. 39
40 CO2 emissions for electricity production are increasing in the 4 countries. 40
41 CO2 emissions per capita from electricity production is increasing in the 4 countries, with a large difference within South Korea and the 3 other countries. 41
42 The carbon content of electricity is too high, including in South Korea that has developed nuclear energy and there is no or not sufficient decrease since
43 Ex power carbon intensity of GDP is increasing in the 4 countries, with a large difference within South Korea and the 3 other countries. 43
44 Relative changes in energy and carbon parameters and indicators 44
45 . South Korea: changes of indicators Average yearly changes of strategic indicators (%/year) South Korea Population 1,02% 0,84% 0,48% 0,54% GDPppp per people 6,80% 4,32% 4,00% 2,98% Energy Intensity (EI) 1,28% 0,19% -2,15% -0,26% Carbon Content (CC) 0,08% -1,25% -0,83% 0,13% CO2 from Fossil Fuels 9,36% 4,06% 1,40% 3,40% CO2 per people 8,26% 3,20% 0,91% 2,84% TPES 9,27% 5,38% 2,25% 3,27% TPES per people 8,17% 4,51% 1,76% 2,71% GDP M$2005ppp 7,89% 5,19% 4,49% 3,55% Carbon Intensity 1,36% -1,07% -2,96% -0,14% kwh electricity per capita 10,32% 8,85% 5,59% 4,02% Electricity production 11,44% 9,76% 6,10% 4,59% CO2 Content of electricity 1,26% -0,90% -1,64% 1,47% CO2 from electricity prod. 12,85% 8,77% 4,36% 6,13% Electricity Intensity of GDP 3,29% 4,34% 1,54% 1,01% CO2elec Intensity of GDP 4,60% 3,40% -0,13% 2,49% 45
46 . Iran: changes of indicators Average yearly changes of strategic indicators (%/year) Iran Population 1,42% 1,74% 1,25% 1,23% GDPppp per people 1,95% 2,27% 4,28% 2,30% Energy Intensity (EI) 4,32% -0,06% 1,35% -0,06% Carbon Content (CC) -0,74% 0,62% -0,95% -0,11% CO2 from Fossil Fuels 7,06% 4,62% 6,00% 3,38% CO2 per people 5,57% 2,84% 4,68% 2,12% TPES 7,86% 3,98% 7,01% 3,49% TPES per people 6,35% 2,20% 5,69% 2,24% GDP M$2005ppp 3,40% 4,04% 5,59% 3,56% Carbon Intensity 3,55% 0,56% 0,38% -0,17% kwh electricity per capita 6,03% 5,55% 6,63% 3,94% Electricity production 7,53% 7,39% 7,97% 5,22% CO2 Content of electricity 0,09% -1,08% -1,16% 0,72% CO2 from electricity prod. 7,64% 6,23% 6,71% 5,98% Electricity Intensity of GDP 4,00% 3,21% 2,25% 1,61% CO2elec Intensity of GDP 4,10% 2,10% 1,06% 2,34% 46
47 . Thailand: changes of indicators Average yearly changes of strategic indicators (%/year) Thailand Population 0,83% 1,11% 1,01% 0,27% GDPppp per people 7,72% -0,66% 4,05% 3,20% Energy Intensity (EI) -0,48% 2,68% 1,32% 0,10% Carbon Content (CC) 3,38% -1,11% -0,11% -0,69% CO2 from Fossil Fuels 11,76% 1,99% 6,38% 2,85% CO2 per people 10,83% 0,87% 5,31% 2,58% TPES 8,10% 3,14% 6,49% 3,57% TPES per people 7,21% 2,01% 5,43% 3,30% GDP M$2005ppp 8,62% 0,45% 5,10% 3,47% Carbon Intensity 2,89% 1,54% 1,21% -0,60% kwh electricity per capita 11,70% 2,55% 5,55% 3,09% Electricity production 12,63% 3,69% 6,61% 3,36% CO2 Content of electricity -0,68% -1,31% -1,14% -0,97% CO2 from electricity prod. 11,87% 2,33% 5,40% 2,35% Electricity Intensity of GDP 3,69% 3,22% 1,44% -0,11% CO2elec Intensity of GDP 2,99% 1,88% 0,28% -1,08% 47
48 . Turkey: changes of indicators Average yearly changes of strategic indicators (%/year) Turkey Population 1,63% 1,46% 1,31% 1,27% GDPppp per people 1,56% 2,62% 3,20% 2,51% Energy Intensity (EI) -0,06% 0,16% -2,36% 0,94% Carbon Content (CC) 0,59% 1,27% -0,55% 0,10% CO2 from Fossil Fuels 3,76% 5,61% 1,53% 4,90% CO2 per people 2,10% 4,09% 0,22% 3,58% TPES 3,15% 4,29% 2,08% 4,80% TPES per people 1,50% 2,79% 0,77% 3,48% GDP M$2005ppp 3,21% 4,12% 4,55% 3,82% Carbon Intensity 0,54% 1,43% -2,89% 1,04% kwh electricity per capita 6,69% 6,14% 3,97% 4,42% Electricity production 8,43% 7,69% 5,33% 5,75% CO2 Content of electricity -2,05% 0,64% -3,69% 0,66% CO2 from electricity prod. 6,21% 8,38% 1,44% 6,45% Electricity Intensity of GDP 5,06% 3,43% 0,74% 1,86% CO2elec Intensity of GDP 2,90% 4,08% -2,97% 2,53% 48
Comparing the main indicators for population, GDP, energy, CO2 and electricity of Brazil, Indonesia, Mexico, South Africa
 Renewables International - www.renewablesinternatonal.net Comparing the main indicators for population, GDP, energy, CO2 and electricity of Brazil, Indonesia, Mexico, South Africa Bernard CHABOT Sustainable
Comparing the main indicators for population, GDP, energy, CO2 and electricity of China, USA, European Union and India
 Renewables International - wwwrenewablesinternatonalnet Comparing the main indicators for population, GDP, energy, CO2 and electricity of China, USA, European Union and India Bernard CHABOT Sustainable
World Economic Dynamics (WED) Model: Oil consumption modeling and forecasting
 Model: Oil consumption modeling and forecasting") World Economic Dynamics (WED) Model: Oil consumption modeling and forecasting Inforum World Conference Alexandria, USA Tatiana Fokina, Rosneft 02.09.2014 WED Content Economics modeling and forecasting
World Economic Dynamics (WED) Model: Oil consumption modeling and forecasting Inforum World Conference Alexandria, USA Tatiana Fokina, Rosneft 02.09.2014 WED Content Economics modeling and forecasting
Are There Limits to Green Growth?
 Are There Limits to Green Growth? Edward B. Barbier Key Points Introduction 1 1 http://www.greengrowthknowledge.org/ Green stimulus during the Great Recession 2 3 3 Table 1: Green stimulus during the Great
Emissions Intensity CHAPTER 5 EMISSIONS INTENSITY 25
 C H A P T E R 5 Emissions Intensity Emissions intensity is the level of GHG emissions per unit of economic activity, usually measured at the national level as GDP. 25 Intensities vary widely across countries,
Ian Parry. Fiscal Affairs Department, IMF The Energy Transition, INDCs and the Post-COP21 Agenda, Marrakech, September 8-9, 2016
 Ian Parry Fiscal Affairs Department, IMF The Energy Transition, INDCs and the Post-COP21 Agenda, Marrakech, September 8-9, 2016 Outline Carbon pricing Broader energy price reform 2 Carbon Pricing 3 Rationale
Deep Decarbonization Pathway Case: Indonesia Energy Sector
 3 rd Annual Meeting Low Carbon Asia Research Network (LoCARNet) Bogor 24-26 November 2014 Deep Decarbonization Pathway Case: Indonesia Energy Sector Ucok WR Siagian, Retno G Dewi and Iwan Hendrawan Center
WORLD ENERGY OUTLOOK Dr. Fatih Birol Chief Economist Head, Economic Analysis Division
 WORLD ENERGY OUTLOOK 2002 Dr. Fatih Birol Chief Economist Head, Economic Analysis Division World Energy Outlook Series World Energy Outlook 1998 World Energy Outlook - 1999 Insights: Looking at Energy
GHG emissions per capita. (tco 2. e/cap) Source: UNDP, data for 2015 Source: World Bank Indicators, data for 2012 Source: IEA, data for 2013
 Source: UNDP, data for 2015 Source: World Bank Indicators, data for 2012 Source: IEA, data for 2013") CLIMATE ACTION TRACKER BROWN TO GREEN: G2 TRANSITION TO A LOW CARBON ECONOMY Saudi Arabia This country profile assesses Saudi Arabia s past, present and indications of future performance towards a low-carbon
CLIMATE ACTION TRACKER BROWN TO GREEN: G2 TRANSITION TO A LOW CARBON ECONOMY Saudi Arabia This country profile assesses Saudi Arabia s past, present and indications of future performance towards a low-carbon
New energy realities
 New energy realities Navigating the triple transition World Energy Council 2016 wwwworldenergyorg @WECouncil Christoph Frei Secretary General World Energy Council November 2016 @chwfrei Billions of People
17 th February 2015 BP Energy Outlook bp.com/energyoutlook #BPstats BP p.l.c. 2015
 17 th February 215 BP bp.com/energyoutlook #BPstats Economic backdrop GDP Trillion, $211 PPP 24 Other Non-OECD Asia 18 OECD Contribution to GDP growth Trillion $211 PPP, 213-35 9 Population Income per
BP Energy Outlook 2017 edition
 BP Energy Outlook 217 edition Margaret Chen Head of China Economist bp.com/energyoutlook #BPstats Economic backdrop Contributions to GDP growth by factor Contributions to GDP growth by region % per annum
International Energy Outlook 2011
 International Energy Outlook 211 Center for Strategic and International Studies, Acting Administrator September 19, 211 Washington, DC U.S. Energy Information Administration Independent Statistics & Analysis
The Emissions Gap Report 2016
 The Emissions Gap Report 2016 What are the implications of the Paris Agreement? How can the 2030 emissions gap be bridged? Marrakech 14 November, 2016 UNEP Emissions Gap Reports 2 2016 Gap Report Main
 2 ENERGY TECHNOLOGY RD&D BUDGETS: OVERVIEW (2017 edition) Released in October 2017. The IEA energy RD&D data collection and the analysis presented in this paper were performed by Remi Gigoux under the
BP Energy Outlook 2017 edition
 BP Energy Outlook 2017 edition Bob Dudley Group chief executive bp.com/energyoutlook #BPstats BP Energy Outlook 2017 edition Spencer Dale Group chief economist bp.com/energyoutlook #BPstats Economic backdrop
World development towards 2052 What should be done to ensure a more attractive future?
 CENTRE FOR GREEN GROWTH World development towards 252 What should be done to ensure a more attractive future? Jorgen Randers Professor emeritus Climate strategy BI Norwegian Business School Innovation
Feasible Climate Targets. Richard Richels International Energy Workshop June 17, 2009 Venice, Italy
 Feasible Climate Targets Richard Richels International Energy Workshop June 17, 29 Venice, Italy Presentation based on two recent papers by Blanford, Richels and Rutherford 1. Revised Emissions Growth
INDCs and 2 C trajectories
 INDCs and 2 C trajectories Groupe Interdisciplinaire sur les Contributions Nationales Interdisciplinary Group on National Contributions Funded by: December 1st 2015 O. Boucher, P. Criqui, H. Benveniste
An Environmental Outlook to 2050: focussing on Climate Change
 An Environmental Outlook to 2050: focussing on Climate Change Rob Dellink OECD Environment Directorate Chapter co-authors: Virginie Marchal (ENV), Detlef van Vuuren (PBL), Christa Clapp (ENV), Jean Chateau
Medium Term Renewable Energy Market Report Michael Waldron Senior Energy Market Analyst Renewable Energy Division International Energy Agency
 Medium Term Renewable Energy Market Report 13 Michael Waldron Senior Energy Market Analyst Renewable Energy Division International Energy Agency OECD/IEA 13 Methodology and Scope OECD/IEA 13 Analysis of
BP Energy Outlook 2016 edition
 BP Energy Outlook 216 edition Mark Finley 14th February 216 Outlook to 235 bp.com/energyoutlook #BPstats Economic backdrop Trillion, $21 25 Other 2 India Africa 15 China 1 OECD 5 OECD 1965 2 235 GDP 2
Renewable Energy and other Sustainable Energy Sources. Paul Simons Deputy Executive Director International Energy Agency
 Renewable Energy and other Sustainable Energy Sources Paul Simons Deputy Executive Director International Energy Agency G20 ESWG meeting Munich, 14 December 2016 Renewables and efficiency lead the transition
Climate Change and Energy Sector Transformation: Implications for Asia-Pacific Including Japan
 Climate Change and Energy Sector Transformation: Implications for Asia-Pacific Including Japan Aligning Policies for the Transition to a Low-carbon Economy: OECD Recommendations and Implications for Asia-Pacific
Building Energy Performance Metrics
 Building Energy Performance Metrics BUILDING ENERGY EFFICIENC Y TA SKGROUP Secure Sustainable Together Building Energy Performance Metrics BUILDING ENERGY EFFICIENC Y TA SKGROUP Secure Sustainable Together
The Impact of Development and Growth on CO 2 Emissions
 The Impact of Development and Growth on CO 2 Emissions A Case Study for Bangladesh until 2050 Bernhard G. Gunter, Ph.D. Bangladesh Development Research Center (BDRC) and A. Atiq Rahman, Ph.D. Bangladesh
Energy Statistics: Making the Numbers Count
 Energy Statistics: Making the Numbers Count IFEG Autumn Seminar, 5 th November 29 Paul Appleby, BP Group Economics Team Working with Energy Statistics The key challenges. Finding relevant & reliable data
Scientific updates on current emissions and sinks of greenhouse gases and implications for future emissions pathways
 Scientific updates on current emissions and sinks of greenhouse gases and implications for future emissions pathways Dr Richard A. Houghton, Woods Hole Research Center with contributions from the Global
Real-world low-carbon policy packages for the energy sector
 Real-world low-carbon policy packages for the energy sector Christina Hood, Head, Environment and Climate Change Unit Workshop on Implementing real-world low-carbon policy packages in the energy sector:
Politique et sécurité énergétique dans le contexte des nouvelles énergies
 Politique et sécurité énergétique dans le contexte des nouvelles énergies Didier Houssin Director, Energy Markets and Security International Energy Agency Colloque L Energie : enjeux socio-économiques
Overview of energy efficiency in industry and utilities
 Overview of energy efficiency in industry and utilities The overview of energy efficiency in industry and utilities presents overall, regional and per-country energy and CO2 efficiency trends and their
BP Energy Outlook 2016 edition
 BP Energy Outlook 216 edition Spencer Dale, group chief economist Outlook to 235 bp.com/energyoutlook #BPstats Disclaimer This presentation contains forward-looking statements, particularly those regarding
Global Energy & CO2 Status Report 2017
 Global Energy & CO2 Status Report 2017 March 2018 Key findings Energy: Global energy demand increased by 2.1% in 2017, compared with 0.9% the previous year and 0.9% on average over the previous five years.
Sectoral Approaches in Electricity
 INTERNATIONAL ENERGY AGENCY Delivering a broader carbon market after Copenhagen Richard Baron Head of climate change unit, IEA Objective: delivering CO 2 mitigation in power generation globally Identifying
Supplementary Information
 Supplementary Information 1. Figures and Tables Showing Supplemental Information and Data 0.5 Energy Expenditures as Fraction of GDP (Actual) 0.4 0.3 0.2 0.1 0 1980 1990 2000 2010 Figure S1. The fraction
Reference Materials Overview of Coal Industry
 Reference Materials Overview of Coal Industry 1 Table of Contents Global Energy Resource Reserves ---------------------------------------- 3 Status of Global Energy Resources Supply ----------------------------------------
An overview of global cement sector trends
 An overview of global cement sector trends Insights from the Global Cement Report 1 th Edition XXX Technical Congress FICEM-APCAC 2 September, 213 Lima, Peru Thomas Armstrong International Cement Review
BROWN TO GREEN Hash tag for webinar: #B2Greport Follow
 BROWN TO GREEN Hash tag for webinar: #B2Greport Follow us: @ClimateT_G20 The G20 transition to a low carbon economy Monday 3 July 2017, 10 11 am CEST BROWN TO GREEN Hash tag for webinar: #B2Greport Follow
Overview of energy efficiency policies and trends at world level
 Overview of energy efficiency policies and trends at world level Dr Didier Bosseboeuf (ADEME, France) General secretary of the WEC energy efficiency policies Knowledge network Practical actions for accelerating
INTERNATIONAL ENERGY AGENCY. In support of the G8 Plan of Action TOWARD A CLEAN, CLEVER & COMPETITIVE ENERGY FUTURE
 INTERNATIONAL ENERGY AGENCY In support of the G8 Plan of Action TOWARD A CLEAN, CLEVER & COMPETITIVE ENERGY FUTURE 2007 REPORT TO THE G8 SUMMIT in Heiligendamm, Germany The International Energy Agency,
GE OIL & GAS ANNUAL MEETING 2016 Florence, Italy, 1-2 February
 Navigating energy transition Keisuke Sadamori Director for Energy Markets and Security IEA GE OIL & GAS ANNUAL MEETING 2016 Florence, Italy, 1-2 February 2016 General Electric Company - All rights reserved
Fresh Deciduous Fruit (Apples, Grapes, & Pears): World Markets and Trade
: World Markets and Trade") United States Department of Agriculture Foreign Agricultural Service June 2015 Fresh Deciduous Fruit (Apples, Grapes, & Pears): World Markets and Trade FRESH APPLES World apple production in is estimated
United States Department of Agriculture Foreign Agricultural Service June 2015 Fresh Deciduous Fruit (Apples, Grapes, & Pears): World Markets and Trade FRESH APPLES World apple production in is estimated
Abatement Costs through 2050
 Abatement Costs through 2050 5 In the central Copenhagen Convergence (CopCon) international policy scenario of this chapter, countries adhere to their Copenhagen targets by 2020. Thereafter they follow
Equal Energy Access: The Power of Coal September 14, Gregory H. Boyce Chairman and Chief Executive Officer Peabody Energy
 Equal Energy Access: The Power of Coal September 14, 2010 Gregory H. Boyce Chairman and Chief Executive Officer Peabody Energy 1 Equal Energy Access: The Power of Coal Are We Setting the Right Global Priorities?
Medium Term Renewable Energy Market Report 2016
 Medium Term Renewable Energy Market Report 2016 Clean Energy Investment and Trends IETA Pavilion COP22, Marrakech November 10, 2016 Liwayway Adkins Environment and Climate Change Unit International Energy
statistics CO 2 emissions from fuel combustion HIGHLIGHTS
 statistics CO 2 emissions from fuel combustion HIGHLIGHTS 217 CO 2 emissions from fuel combustion HIGHLIGHTS 217 The International Energy Agency (IEA), an autonomous agency, was established in November
Argus Ethylene Annual 2017
 Argus Ethylene Annual 2017 Market Reporting Petrochemicals illuminating the markets Consulting Events Argus Ethylene Annual 2017 Summary Progress to the next peak of the economic cycle, now expected by
Making steel more green: challenges and opportunities Workshop on green growth in shipbuilding Paris, 7-8 July 2011
 Making steel more green: challenges and opportunities Workshop on green growth in shipbuilding Paris, 7-8 July 2011 Agenda 1. The importance of steel in economic development 2. The past and current efforts
Internationalisation Home versus host compensation approach at Reckitt Benckiser
 Internationalisation Home versus host compensation approach at Reckitt Benckiser Internationalisation Home versus host compensation approach at Reckitt Benckiser With the economic downturn continuing worldwide,
World Energy Outlook 2007: China and India Insights
 World Energy Outlook 2007: China and India Insights William C. Ramsay Deputy Executive Director International Energy Agency Singapore, 9 November 2007 Approach Co-operation with China s NDRC & ERI, India
WIND POWER TARGETS FOR EUROPE: 75,000 MW by 2010
 About EWEA EWEA is the voice of the wind industry actively promoting the utilisation of wind power in Europe and worldwide. EWEA members from over 4 countries include 2 companies, organisations, and research
GHG emissions per capita. Share of global GHG emissions. e/cap) (tco
 (tco") CLIMATE ACTION TRACKER BROWN TO GREEN: G2 TRANSITION TO A LOW CARBON ECONOMY India This country profile assesses India s past, present and indications of future performance towards a low-carbon economy
CLIMATE ACTION TRACKER BROWN TO GREEN: G2 TRANSITION TO A LOW CARBON ECONOMY India This country profile assesses India s past, present and indications of future performance towards a low-carbon economy
Estimation of Taiwan s CO 2 Emissions Related to Fossil Fuel Combustion A Sectoral Approach
 Estimation of Taiwan s CO 2 Emissions Related to Fossil Fuel Combustion A Sectoral Approach 4 Shinemay Chen, Der-Cherng Lo and Huai Hsuan Yu Department of Public Finance, National Cheng-Chi University
The Economic and Environmental Impact of the US Withdrawal from the Kyoto Protocol. Hiroshi Hamasaki
 The Economic and Environmental Impact of the US Withdrawal from the Kyoto Protocol Hiroshi Hamasaki Senior Associate, Economic Research Centre, Fujitsu Research Institute, Tokyo, Japan ABSTRACT George
IEA fuel market reports
 Didier Houssin Director Sustainable Energy Policy and Technology 18 October 2013 Photo credit: thermalcities.com IEA fuel market reports : November Energy efficiency: a huge opportunity IEEJ 2013 All Right
LNG supply chain analysis and optimisation of Turkey's natural gas need with LNG import
 World Maritime University The Maritime Commons: Digital Repository of the World Maritime University World Maritime University Dissertations Dissertations 2011 LNG supply chain analysis and optimisation
Energy Intensity of GDP as an Index of Energy Conservation
 IEEJ: August 007 Energy Intensity of GDP as an Index of Energy Conservation Problems in international comparison of energy intensity of GDP and estimate using sector-based approach Shigeru Suehiro * Introduction
CHAPTER 4: A REVIEW OF THE ENERGY ECONOMY IN IRAN AND OTHER COUNTRIES
 CHAPTER 4: A REVIEW OF THE ENERGY ECONOMY IN IRAN AND OTHER COUNTRIES 60 Nowadays, energy is the lifeblood of modern civilization. The shortage of energy that can be one of the issues related to the economy
The dynamics of global food and agribusiness
 Welcome to the world of Rabobank! The dynamics of global food and agribusiness Adrie Zwanenberg NUFFIELD Global Head F&A Research 20 February 2006 2 The world of Rabobank Food & agribusiness: a global
Contents. Is Paris possible? 3. The Index 5. UK leading the low carbon revolution 8. China: Tackling coal consumption 9. Bracing for disruption 10
 Low Carbon Economy Index 2017 Contents Is Paris possible? 3 The Index 5 UK leading the low carbon revolution 8 China: Tackling coal consumption 9 Bracing for disruption 10 Responding to climate risks is
ASSESSMENT OF CLIMATE AND ENERGY POLICIES OF MAJOR EMITTING COUNTRIES
 ASSESSMENT OF CLIMATE AND ENERGY POLICIES OF MAJOR EMITTING COUNTRIES Background Study Assessment of climate and energy policies of major emitting countries Assessment of climate and energy policies of
LNG in the Asia Pacific
 2016/EWG52/WKSP1/004 LNG in the Asia Pacific Submitted by: APERC Asia Pacific Energy Research Centre Workshop Moscow, Russia 18 October 2016 APERC Workshop at EWG52 Moscow, Russia, 18 October, 2016 3-2.
Global CAM Software Detailed Analysis Report
 Report Information More information from: https://www.reportsandmarkets.com/reports/1530934 Global CAM Software Detailed Analysis Report 2018-2023 Report / Search Code: RnM1530934 Publish Date: 7 February,
A b u D h a b i 3rd 5th June 2015
 A b u D h a b i 3rd 5th June 2015 Effect of the energy and climate policies in the future Mexican electricity system Helena Cabal Cuesta Yolanda Lechón Pérez Antonio Rodríguez Martínez David Castrejón
Fresh Peaches and Cherries: World Markets and Trade
 United States Department of Agriculture Foreign Agricultural Service Fresh Peaches and Cherries: World Markets and Trade Fresh Peach/Nectarine: 2014/15 Highlights Global production in 2014/15 of peaches/nectarines
Energy Efficiency 2017
 Energy Efficiency 2017 Samuel Thomas, Senior Analyst, Energy Efficiency Club Español de la Energia, Madrid, 30 th October 2017 Free download: http://www.iea.org/efficiency 2016 confirmed the recent step
Major Economies Business Forum Transparency and Measurement, Reporting, and Verification
 Major Economies Business Forum Transparency and Measurement, Reporting, and Verification Key Messages Build trust. An effective, reliable framework to assess transparency of actions and support will be
GHG emissions per capita. (tco 2. e/cap) Source: UNDP, data for 2015 Source: World Bank Indicators, data for 2012 Source: IEA, data for 2013
 Source: UNDP, data for 2015 Source: World Bank Indicators, data for 2012 Source: IEA, data for 2013") CLIMATE ACTION TRACKER BROWN TO GREEN: G2 TRANSITION TO A LOW CARBON ECONOMY Turkey This country profile assesses Turkey s past, present and indications of future performance towards a low-carbon economy
CLIMATE ACTION TRACKER BROWN TO GREEN: G2 TRANSITION TO A LOW CARBON ECONOMY Turkey This country profile assesses Turkey s past, present and indications of future performance towards a low-carbon economy
Germany s energy system and the status of the energy transition
 Energiewende Germany s energy system and the status of the energy transition Dr Falk Bömeke, LL.M. (Sydney) Federal Ministry for Economic Affairs and Energy Drivers, challenges and opportunities of the
Mitigation and Adaptation
 Prof. Dr. Ottmar Edenhofer Mitigation and Adaptation Our Common Future Hannover, 4th November 2010 Volkswagen Stiftung Tipping Points in the Earth System T. M. Lenton & H. J. Schellnhuber (Nature Reports
Understanding Sequestration as a Means of Carbon Management. Howard Herzog MIT Energy Laboratory
 Understanding Sequestration as a Means of Carbon Management Howard Herzog MIT Energy Laboratory In understanding carbon management options, it is helpful to start with a simple mass balance on anthropogenic
The ENERGIEWENDE The Transformation of the German Energy System
 The ENERGIEWENDE The Transformation of the German Energy System RENAC, 30 October 2017 Renewables Academy Policy and guiding principles of the Energiewende Secure and reliable of energy supply Affordable
Global CAD/CAM Software Detailed Analysis Report
 Report Information More information from: https://www.reportsandmarkets.com/reports/1530933 Global CAD/CAM Software Detailed Analysis Report 2018-2023 Report / Search Code: RnM1530933 Publish Date: 7 February,
MAJOR ECONOMIES: BLACK ENERGY INTENSITY AND POLICY IMPLICATIONS
 International Academic Forum Sakae 1-16-26 201, Naka Ward Nagoya, Aichi, Japan 460-0008 Yang P. (2015), Major Economies: Black Energy Intensity and Policy Implications, IAFOR Journal of Sustainability,
Best Practices of the GHG Reduction Measures in Asia Region
 Best Practices of the GHG Reduction Measures in Asia Region Study Interim Report 22 June 2017, Asia Regional Meeting, Seoul, Korea Hajime Murata Japan Energy Association Objective of the Study Introduce
GHG emissions per capita. (tco 2. e/cap) Source: UNDP, data for 2015 Source: World Bank Indicators, data for 2012 Source: IEA, data for 2013
 Source: UNDP, data for 2015 Source: World Bank Indicators, data for 2012 Source: IEA, data for 2013") BROWN TO GREEN: G2 TRANSITION TO A LOW CARBON ECONOMY CLIMATE ACTION TRACKER France This country profile assesses France s past, present and indications of future performance towards a low-carbon economy
BROWN TO GREEN: G2 TRANSITION TO A LOW CARBON ECONOMY CLIMATE ACTION TRACKER France This country profile assesses France s past, present and indications of future performance towards a low-carbon economy
Figure : Trends in Production/Consumption of Coal in Asia. Figure : Trends in Production/Consumption of Oil in Asia
 Chapter 2 growing with Asia's development - Asia -Pacific framework toward sustainable growth Section 5 Common Agendas to be Solved by Asia to achieve sustainable growth 2. Issues on energy, environment,
TRENDS IN GLOBAL CO 2 EMISSIONS
 TRENDS IN GLOBAL CO 2 EMISSIONS 2012 report Background Studies Trends in global co 2 emissions 2012 Report Jos G.J. Olivier, Greet Janssens-Maenhout, Jeroen A.H.W. Peters Trends in global CO 2 emissions;
Energy Innovation Scoreboard A Pilot Framework with a Focus on Renewables
 Energy Innovation Scoreboard A Pilot Framework with a Focus on Renewables Claudia Kettner, Angela Köppl IEA Workshop on "Modelling and Analyses in R&D Priority-Setting and Innovation" IEA, 24 April 2014
Kyoto Protocol and Carbon Market Drivers
 Kyoto Protocol and Carbon Market Drivers Dr Venkata R Putti Senior Environmental Specialist Carbon Finance Assist World Bank February 2007 Climate Change The Earth s climate is warming and human activities
CANADIAN AGRIFOOD EXPORT PERFORMANCE AND THE GROWTH POTENTIAL OF THE BRICS AND NEXT- 11
 CANADIAN AGRIFOOD EXPORT PERFORMANCE AND THE GROWTH POTENTIAL OF THE BRICS AND NEXT- 11 CATPRN Trade Policy Brief 2012-05 December 2012 Alexander Cairns Karl D. Meilke Department of Food, Agricultural
Submission on Innovative Technology Development
 Submission on Innovative Technology Development The Government of Japan submitted the document below as submission regarding the paragraph 1 of the Bali Action Plan in May 2008; http://unfccc.int/files/meetings/ad_hoc_working_groups/lca/application/pdf/submissionjapan.pdf
Global Agricultural Supply and Demand: Factors contributing to recent increases in food commodity prices
 Global Agricultural Supply and Demand: Factors contributing to recent increases in food commodity prices Ron Trostle Economic Research Service U.S. Department of Agriculture Agricultural Markets and Food
Chinese Energy Sector s Role in Low Carbon Transition
 Side-event Chinese Energy Sector s Role in Low Carbon Transition Paul SIMONS Deputy Executive Director International Energy Agency Marrakech China Pavillon, 15 November 2016 The IEA works around the world
16 november 2015 Michel den Elzen
 Assessing Intended Nationally Determined Contributions to the Paris climate agreement what are the projected global and national emission levels for 2025 2030? 16 november 2015 Michel den Elzen Presentation
Lessons from Fukushima
 Lessons from Fukushima October 11, 2011 The Institute of Energy Economics, Japan Masakazu Toyoda, Chairman & CEO, Outline : Lessons from Fukushima 1. One NPP accident could stop other plants as well 2.
1 New Energy Outlook 2017
 1 New Energy Outlook 217 Leveraging the power of Bloomberg Since 1981 Over 15, employees in 192 locations Generating 5, news stories a day from 15 bureaus 32, global clients Since 24 2+ employees in 15
Greenhouse gas emission reduction proposals and national climate policies of major economies
 Greenhouse gas emission reduction proposals and national climate policies of major economies 27 November 2012 Michel den Elzen, Niklas Hohne, Mark and Michael Obersteiner 1 Policy brief: Greenhouse gas
10 ECB HOW HAVE GLOBAL VALUE CHAINS AFFECTED WORLD TRADE PATTERNS?
 Box 1 HOW HAVE GLOBAL VALUE CHAINS AFFECTED WORLD TRADE PATTERNS? In recent decades, global trade has undergone profound changes. Relative to global output, trade has risen sharply and cross-country linkages
The Outlook for Energy:
 The Outlook for Energy: A View to 2040 Ken Golden February 3, 2016 The Outlook for Energy includes Exxon Mobil Corporation s internal estimates and forecasts of energy demand, supply, and trends through
Global Energy Production & Use 101
 Global Energy Production & Use 101 Jean-Sébastien Rioux The School of Public Policy SPP-HEI Summer School on the Geopolitics of Energy & Natural Resources Calgary, AB May 15-20, 2017 Presentation highlights
 Knowledge for Africa s Development: Innovation, Education, and Information and Communications Technologies Johannesburg, South Africa, May 8-10, 2006 DEVELOPING AND IMPLEMENTING KNOWLEDGE STRATEGIES EXPERIENCES
21st Century Coal: Powering Progress and Global Development
 21st Century Coal: Powering Progress and Global Development Christopher J. Hagedorn President Asia and Trading, Peabody Energy McDonnell Academy Global Energy and Environment Partnership, 4th International
Contribution to Global Warming Prevention by IT Solutions
 Contribution to Global Warming Prevention by IT Solutions Contribution to Global Warming Prevention by IT 1 Situation Surrounding Global Warming Prevention Awareness of global warming issue IPCC* 1 stated
Climate Change Performance Index CCPI. Results Jan Burck, Franziska Marten, Christoph Bals, Niklas Höhne. Foto: Fotolia, Nightman 1965
 CCPI Climate Change Performance Index Results 2018 Foto: Fotolia, Nightman 1965 Jan Burck, Franziska Marten, Christoph Bals, Niklas Höhne Imprint Foreword Germanwatch Bonn Office Kaiserstraße 201 D-53113
Global Gasoline, Global Condensate and Global Petrochemical Markets to 2020 and How much naphtha will end up in gasoline blending?
 Study Prospectus Nexus - The Interaction Between: Global Gasoline, Global Condensate and Global Petrochemical Markets to 2020 and 2025 Can I export more naphtha? Should I build a splitter? Should I build
UPDATE OF CEM FURTHER EVENTS AND CHP/DHC WORKING GROUP
 UPDATE OF CEM FURTHER EVENTS AND CHP/DHC WORKING GROUP CLEAN ENERGY MINISTERIAL CHP/DHC WORKING GROUP INTERNATIONAL ENERGY AGENCY CHP/DHC COLLABORATIVE JOINT WORKSHOP 26 27 TH NOVEMBER, 2013 HELSINKI,
Asia s Fashion Jewellery & Accessories Fair March Exhibitors Survey Report
 Asia s Fashion Jewellery & Accessories Fair March Exhibitors Survey Report 1 Survey Summary Total number of exhibitors 383 Total number of collected onsite survey 254 Overall onsite survey response rate
Computation and Analysis on Taiwan Index of Energy Security Risk
 Institute of Nuclear Energy Research The 40 th Annual IAEE International Conference Computation and Analysis on Taiwan Index of Energy Security Risk Hui-Wen Huang 19 June, 2017 Outline Introduction Exposure
The human population Bob Birrell *
 The human population Bob Birrell * Population numbers are a core component of resource use and waste output whether at the global, national or local level. Resource consumption and waste discharge in any