Watershed and Water Quality Modeling to Support TMDL Determinations Lake Oologah
|
|
|
- Barnard Shepherd
- 6 years ago
- Views:
Transcription
 April 5-6, 2017 Stillwater,")
1 Watershed and Water Quality Modeling to Support TMDL Determinations Lake Oologah 26 th Annual Conference Oklahoma Clean Lakes and Watersheds Association (OCLWA) April 5-6, 2017 Stillwater, Oklahoma

2 Lake Oologah Watershed-Lake Model Verdigris River Basin Pollutant Sources Designated Uses Water quality impairments Watershed Model Lake Model Model Results Model Application

3 Lake Oologah Verdigris River Basin Area upstream of lake is 4,339 sq-miles (23% in OK) 31,040 acre USACE reservoir Public water supply for Tulsa, Public Service of OK; Collinsville, Chelsea, Claremore; RWDs Rogers, Nowata, Washington Co. Point source wastewater Nonpoint source runoff from urban/rural areas
4 Designated Uses 303(d) Impairments and WQ Targets Flood control, water supply, recreation, navigation, fish and wildlife propagation Impaired for Warm Water Fish and Wildlife Propagation Classified as eutrophic lake by Trophic State Index (TSI) Annual 90 th percentile Turbidity < 25 NTU Surface DO > 5 mg/l Lake volume DO: < 50% can be < 2 mg/l during stratified season
5 EFDC HSPF Management Scenarios Flow, Loads Watershed Hydrodynamics Sediment Transport Water Quality Sediment Bed & Flux Water Quality Targets
 and WQ (TSS, Wtemp, DO, BOD, N, P,")
6 HSPF Watershed Model Hydrologic Simulation Program-Fortran Sub-watersheds Rainfall/meteorology Topography Land uses/soil types Stream channels Overland flow Infiltration/groundwater Flow (Q) and WQ (TSS, Wtemp, DO, BOD, N, P, Algae)


7 HSPF Watershed Model Middle Verdigris 59 Sub-Watersheds 2 Yrs Calibration, Yrs Validation, drought year Flow (USGS) WQ (EPA, OWRB, USACE) State variables are Flow, TSS, Water Temperature, DO, BOD, Nitrogen, Phosphorus, Algae
 USACE VR-2 2006-2007 TP")
8 Flow and TP: Middle Verdigris R Flow (cfs) USGS Lenapah, OK TP (mg/l) USACE VR TP (mg/l)
9 Lake Oologah Conceptual Model Mass balance causeeffect watershed flow, loading & lake WQ response Riverine, transition, lacustrine zones affect transport and WQ in reservoir Summer stratified Winter well-mixed Hypolimnetic DO depletion controlled by stratification/sod Internal source of nutrients from sediment bed
")

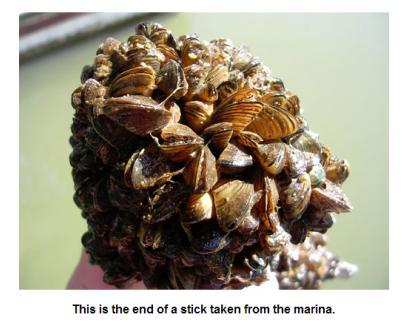
10 Boeckmann (2010) Nowata Star, Jun 18,2003
11 Chlorophyll a (ug/l) Dissolved Oxygen (mg/l) WQ Impact of Zebra Mussels? Legend OOL-1-Data Oologah Lake Hydrodynamic and Water Quality Model Calibration Results: Time Series Summary Bottom DO OOL_ Jan-06 Mar-06 May-06 Jul-06 Sep-06 Nov-06 Jan-07 Mar-07 May-07 Jul-07 Sep-07 Nov-07 Time (days) Legend OOL-1-Data Jan 2006-Dec 2007 Oologah Lake Hydrodynamic and Water Quality Model Calibration Results: Time Series Summary Sfc Chl-a OOL_ Dec-05 Feb-06 Apr-06 Jun-06 Aug-06 Oct-06 Dec-06 Feb-07 Apr-07 Jun-07 Aug-07 Oct-07 Dec-07 Time (days)
 OOL-1-Data Oologah Lake Hydrodynamic and Water Quality Model Calibration Results: Time Series Summary Bottom DO OOL_1 10 8 6 4 2 0 Jan-06 Mar-06")
12 Chlorophyll a (ug/l) Dissolved Oxygen (mg/l) WQ Impact of Zebra Mussels? Legend OOL-1-Data OOL-1-Model (Layer 1) OOL-1-Data Oologah Lake Hydrodynamic and Water Quality Model Calibration Results: Time Series Summary Bottom DO OOL_ Jan-06 Mar-06 May-06 Jul-06 Sep-06 Nov-06 Jan-07 Mar-07 May-07 Jul-07 Sep-07 Nov-07 Time (days) Model without Zebra Mussels 40 Legend OOL-1-Data OOL-1-Model (Layer 5) OOL-1-Data 30 Oologah Lake Hydrodynamic and Water Quality Model Calibration Results: Time Series Summary Sfc Chl-a OOL_ Dec-05 Feb-06 Apr-06 Jun-06 Aug-06 Oct-06 Dec-06 Feb-07 Apr-07 Jun-07 Aug-07 Oct-07 Dec-07 Time (days)
13 EFDC Surface Water Model Environmental Fluid Dynamics Code EFDC Model Hydrodynamics Water Quality Sediment Transport Toxics Sediment Diagenesis
14 Lake Model Data Data Set Lake bathymetry, water level, dam releases Watershed flow/loads Wastewater flow/loads Meteorology WQ (T,DO,TSS,N,P,Chl, Secchi, Turbidity) Sediment bed (TP, TKN, TOC, solids) Data Source USACE Tulsa District & City of Tulsa Oologah Lake Watershed Assessment Study (2012) HSPF watershed model NPDES DMR records Oklahoma Mesonet USACE WQ and Sediment Bed Chemistry, 5 sites
15 EFDC Lake Model Oolagah Lake Hydrodynamic and Water Quality Model Bottom Elev (m) Cells 5 Layers OOL_1 OOL_3 OOL_2 OOL_5 OOL_4 External Load: HSPF & WWTP (Flow, WQ), AtmDep (N,P) Hydro: Lake level, Temp Sediment: TSS, BedSolids WQ: Chl, DO, C, N,P Internal Load: SOD, N,P fluxes, Bed C,N,P Cal/Val: 4 sites, 2 yrs, 1/ /2007
16 Turbidity (NTU) Turbidity Storm: July 1-2, Oolagah Lake Hydrodynamic and Water Quality Model Turbidity: Sfc OOL_3 Legend Turbidity Model (NTU) OOL_3 (Sfc) Turbidity Obs (NTU) OOL_3 (Sfc) TSS vs Turbidity Jan-06 Mar-06 May-06 Jul-06 Sep-06 Nov-06 Jan-07 Mar-07 May-07 Jul-07 Sep-07 Nov-07 Time (days)
17 Flow (m 3 /s) TSS, Storm: July 1-2, 2007 Flow (cms) Verdigris R, Lenapah, OK Oologah Lake Hydrodynamic and Water Quality Model Boundary Condition Time Series Legend Flow, Series:Verdigris River Animation Bottom TSS 0 20-Jun Jun Jun Jul Jul Jul-2007 Time (days) Storm: July 1-2, 2007

18 Chlorophyll a (ug/l) Secchi Depth (m) Secchi Depth and Chlorophyll Legend i=43,j=33, OOL_3 Obs Data OOL-3 Oologah Lake Hydrodynamic and Water Quality Model Secchi Depth Secchi: OOL_ Jan-06 Mar-06 May-06 Jul-06 Sep-06 Nov-06 Jan-07 Mar-07 May-07 Jul-07 Sep-07 Nov-07 Time (days) Legend OOL-2-Model (Layer 5) OOL-2-Data Oologah Lake Hydrodynamic and Water Quality Model Calibration Results: Time Series Summary Chl-a: OOL_ Jan-06 Mar-06 May-06 Jul-06 Sep-06 Nov-06 Jan-07 Mar-07 May-07 Jul-07 Sep-07 Nov-07 Time (days)
19 Dissolved Temperature Oxygen ( C) (mg/l) Dissolved Oxygen Oologah Lake Hydrodynamic and Water Quality Model Calibration Results: Time Series Summary Legend Legend OOL-1-Model OOL-1-Model (Layer 5) (Layer 5) OOL-1-Data (Sfc) OOL-1-Data (Sfc) OOL-1-Model OOL-1-Model (Layer 1) (Layer 1) OOL-1-Data (Bottom) OOL-1-Data (Bottom) Sfc & Bot DO: OOL_ Jan-06 Mar-06 May-06 Jul-06 Sep-06 Nov-06 Jan-07 Mar-07 May-07 Jul-07 Sep-07 Nov-07 Time (days)
20 Storm: July 1-2, 2007 Anoxic Volume Jun-July-Aug 2007 Storm Event July 1-2, 2007

21 Anoxic Volume Jun-July-Aug 2007 Animation Jun 9-Jul 27 Storm Event July 1-2, 2007 Animation
22 Total Phosphate (mg/l) Total P (mg/l) Nutrients (TP and PO4) Legend OOL-2-Model (Layer 5) OOL-2-Data Oologah Lake Hydrodynamic and Water Quality Model Calibration Results: Time Series Summary TP: OOL_2 (Sfc) Jan-06 Mar-06 May-06 Jul-06 Sep-06 Nov-06 Jan-07 Mar-07 May-07 Jul-07 Sep-07 Nov-07 Time (days) Legend OOL-2-Model (Layer 5) OOL-2-Data Oologah Lake Hydrodynamic and Water Quality Model Calibration Results: Time Series Summary PO4: OOL_2 (Sfc) Jan-06 Mar-06 May-06 Jul-06 Sep-06 Nov-06 Jan-07 Mar-07 May-07 Jul-07 Sep-07 Nov-07 Time (days)
23 EFDC Sediment Flux Model POM Biological Production Detritus Deposition Internal Loading SOD Benthic Flux N Benthic Flux P Particulate Organic C,N,P Water Sediment Bed Decay Burial Dissolved Inorganic C,N,P
24 Sediment Bed Chemistry USACE Survey in Aug TP, TKN, TOC Bulk density; % Solids; % Sand, Silt, Clay Initial conditions for Sediment Flux Model based on USACE bed chemistry data, 5 sites

25 Phosphate Flux (g/m 2 /day) Sediment Flux PO4: Model & Observed 16 mg P m -2 day -1 Legend i=48,j=4 OOL_1 i=43,j=33 OOL_3 i=41,j=43 OOL_4 Oologah Lake Hydrodynamic and Water Quality Model Benthic Phosphate Flux OOL_ OOL_ OOL_ Jan-06 Mar-06 May-06 Jul-06 Sep-06 Nov-06 Jan-07 Mar-07 May-07 Jul-07 Sep-07 Nov-07 Time (days) Jan 2006-Dec 2007 (Dzialowski & Carter, OSU) N=17 Central Plains reservoirs
26 How Well Did Model Perform? Hydrodynamics: Simulated seasonal trends of water temperature and stratification Water Quality: Matched seasonal trends of DO, nutrients, chlorophyll, and secchi depth Sediment Flux: Internal benthic flux of phosphate comparable to observations from other mesotrophic and eutrophic Central Plains reservoirs
 Recommend monitoring of ZM to track density and WQ over the years 2016 Distribution https://nas.er.usgs.")
27 Zebra Mussels WQ in 2006 (ZM present) vs (ZM absent)? WQ change not detected in USACE station data WQ impact of ZM in Lake Oologah may be localized? ZM in Lake Hefner (2016) Recommend monitoring of ZM to track density and WQ over the years 2016 Distribution
28 Summary HSPF watershed and EFDC lake model provides DEQ with a defensible tool for WQ assessments Water quality targets are DO and turbidity Model will be used by DEQ to support TMDL determinations for Lake Oologah (TN, TP, TSS)
338-3642")
29 Lake Oologah Watershed-Lake Model Questions & Discussion Andy Stoddard Dynamic Solutions, LLC (540)
30
Appendix B EFDC Hydrodynamic and Water Quality Model. Draft Lake Thunderbird TMDL Report
 Appendix B EFDC Hydrodynamic and Water Quality Model Draft Lake Thunderbird TMDL Report Prepared for Oklahoma Department of Environmental Quality Water Quality Division November 2012 By Dynamic Solutions,
Water Quality Study In the Streams of Flint Creek and Flint River Watersheds For TMDL Development
 Water Quality Study In the Streams of Flint Creek and Flint River Watersheds For TMDL Development Idris Abdi Doctoral Dissertation Presentation Major Advisor: Dr. Teferi Tsegaye April 18, 2005 Alabama
Application of the 3D model ELCOM CAEDYM to estimate phosphorus load reduction needs for Lake Wister, OK
 Application of the 3D model ELCOM CAEDYM to estimate phosphorus load reduction needs for Lake Wister, OK J. Thad Scott, Erin Grantz, and Steve Patterson @ScottBiogeochem Thad_Scott@baylor.edu Lake Wister
The Myakka River. Presented to the Myakka River Management Coordinating Council January 9, 2009
 The Myakka River Presented to the Myakka River Management Coordinating Council January 9, 2009 Kathryn L. Meaux Environmental Specialist III Sarasota County Integrated Water Resources Historical Monitoring
Leesville Lake Water Quality Monitoring
 Leesville Lake Water Quality Monitoring Prepared for: Leesville Lake Association Prepared by: Dr. Thomas Shahady Lynchburg College Funds Supplied by: American Electric Power & Leesville Lake Association
Arkansas Water Resources Center
 Arkansas Water Resources Center WATER SAMPLING, ANALYSIS AND ANNUAL LOAD DETERMINATIONS FOR TSS, NITROGEN AND PHOSPHORUS AT THE L ANGUILLE RIVER NEAR PALESTINE Submitted to the Arkansas Soil and Water
What s Happening in Lake Whatcom?
 What s Happening in Lake Whatcom? Dr. Robin A. Matthews, Director Institute for Watershed Studies Huxley College of the Environment Western Washington University June 6, 2011 Site 2 Basin 2 Lake Whatcom
Lake Pepin. TMDL Basics
 NORTH DAKOTA SOUTH DAKOTA Lake Pepin Basins BASIN Cannon River Basin Minnesota River Basin Minnesota River Basin St. Croix River Basin Upper Mississippi River Basin HUC 07040001 Major Rivers Metro Area
The Impacts of Climate Change on Portland s Water Supply
 The Impacts of Climate Change on Portland s Water Supply Richard Palmer and Margaret Hahn University of Washington Department of Civil and Environmental Engineering Joe Dvorak, Dennis Kessler, Azad Mohammadi
Boy Lake CASS COUNTY
 Boy Lake 11-143- CASS COUNTY Summary Boy Lake is located near Remer, MN in Cass County. It covers 3,452 acres, which places it in the upper 1% of lakes in Minnesota in terms of size. Boy Lake has two main
Appendix 5. Fox River Study Group Interim Monitoring Evaluation
 Appendix 5. Fox River Study Group Interim Monitoring Evaluation Introduction Submitted to Fox River Study Group 6 March 3 The purpose of this report is to review data collected by the Fox River Study Group
Draft Wasteload Allocation Report Town of Haworth
 Draft Wasteload Allocation Report Town of Haworth Contents 1. Problem Definition... 1 2. Endpoint Identification... 1 3. Source Analysis... 2 3.1. Point Sources... 2 3.2. Non-Point Sources... 2 3.3. Background...
John H. Kerr Dam and Reservoir Virginia and North Carolina (Section 216)
") John H. Kerr Dam and Reservoir Virginia and North Carolina (Section 216) Wilmington District, Corps of Engineers Stakeholder Update Presentation January 24, 2014 Authorized under Section 216 of Public
John H. Kerr Dam and Reservoir Virginia and North Carolina (Section 216) Wilmington District, Corps of Engineers Stakeholder Update Presentation January 24, 2014 Authorized under Section 216 of Public
Gull Lake CASS & CROW WING COUNTIES
 Gull Lake 11-0305-00 CASS & CROW WING COUNTIES Summary Gull Lake is located just northwest of Brainerd, Minnesota, on the border of Cass and Crow Wing Counties. It covers 9,947 acres, which places it in
Portage Lake Hubbard County
 Prepared in cooperation with the Minnesota Department of Natural Resources Minnesota Lake ID: 9- Area: acres Watershed Area: 6,7 acres Ecoregion: Northern Lakes and Forests (NLF) Portage Lake Hubbard County
WILLAMETTE RIVER AND COLUMBIA RIVER WASTE LOAD ALLOCATION MODEL
 WILLAMETTE RIVER AND COLUMBIA RIVER WASTE LOAD ALLOCATION MODEL Christopher J. Berger, Research Associate, Department of Civil and Environmental Engineering, Portland State University, Portland, Oregon
Crystal Lake and Keller Lake Water Quality Evaluation and Ferric Chloride Treatment Project
 Crystal Lake and Keller Lake Water Quality Evaluation and Ferric Chloride Treatment Project Assessment for 8 Prepared for Black Dog Watershed Management Organization January 9 Crystal Lake and Keller Lake
Kansas Case Study Kanopolis Reservoir and Salina, KS
 Kansas Case Study Kanopolis Reservoir and Salina, KS Western State Water Council Water Quantity/Quality Workshop October 6, 2015 Mike Tate, P.E. Kansas Department of Health and Environment Kanopolis Reservoir
Lake Pepin Watershed TMDL: Looking Ahead. August 2008 Sector Meetings. Lake Pepin Photo by Guy Schmickle
 Lake Pepin Watershed TMDL: Looking Ahead August 2008 Sector Meetings Lake Pepin Photo by Guy Schmickle Three Questions What are the critical issues to face moving forward? How can we as a sector address
Overview of Models for Estimating Pollutant Loads & Reductions
 Overview of Models for Estimating Pollutant Loads & Reductions (Handbook Chapter 8.3 8.5) Texas Watershed Planning Short Course Wednesday, June 3, 2008 Larry Hauck hauck@tiaer.tarleton.edu Presentation
Relationships between Residence Time and Cyanobacterial Blooms in a Nutrient-Rich River System
 Relationships between Residence Time and Cyanobacterial Blooms in a Nutrient-Rich River System Michael F. Coveney, John C. Hendrickson, Erich R. Marzolf, Rolland S. Fulton, Jian J. Di, Clifford P. Neubauer,
An Introduction to The Ecology of Lakes, Ponds and Reservoirs. Developing a Management Plan
 An Introduction to The Ecology of Lakes, Ponds and Reservoirs Developing a Management Plan Stephen J. Souza, Ph.D. Princeton Hydro, LLC 1108 Old York Road Ringoes, NJ 08551 ssouza@princetonhydro.com Objective
Hydrology and Water Quality. Water. Water 9/13/2016. Molecular Water a great solvent. Molecular Water
 Hydrology and Water Quality Water Molecular Water Exists as an equilibrium But equilibrium altered by what is dissolved in it Water Molecular Water a great solvent In reality, water in the environment
Science Supporting Policy: The Case For Flow Quantity
 MassDEP Water Management Program Science Supporting Policy: The Case For Flow Quantity Integrating Water Resources Management UMASS Conference April 8, 2008 Overview Human impact on streamflow and aquatic
Modeling Eutrophication Processes in the Delaware Estuary to Link Watershed Efforts to Control Nutrient Impacts
 Modeling Eutrophication Processes in the Delaware Estuary to Link Watershed Efforts to Control Nutrient Impacts Delaware Watershed Research Conference Philadelphia, PA November 8, 2017 Principal Investigators:
Hydrology, Water Quality, and Phosphorus Loading of Little St. Germain Lake, Vilas County, Wisconsin
 Hydrology, Water Quality, and Phosphorus Loading of Little St. Germain Lake, Vilas County, Wisconsin Introduction Little St. Germain Lake, which is in Vilas County, Wisconsin, just northeast of St. Germain
Decision Rationale. Total Maximum Daily Load for Phosphorus for the Sassafras River, Cecil and Kent Counties, Maryland 4/1/2002
 Decision Rationale I. Introduction Total Maximum Daily Load for Phosphorus for the Sassafras River, Cecil and Kent Counties, Maryland 4/1/2002 The Clean Water Act (CWA) requires a Total Maximum Daily Load
Session 2 Biodiversity Conservation
 Session 2 Biodiversity Conservation Nutrient Concentration and Water Turbidity on Coral Reef Area and their Effects on the Living Coral Koichi KINJO Okinawa Prefectural Institute of Health and Environment
Status and Trends of Water Quality in Wisconsin s Lakes, Streams, and Rivers
 Status and Trends of Water Quality in Wisconsin s Lakes, Streams, and Rivers Tim Asplund, Matt Diebel, Katie Hein, and Mike Shupryt Water Resources Program, WDNR AWRA Wisconsin Section Annual Meeting March
WATER QUALITY ASSESSMENT REPORT 2013 SAGINAW CHIPPEWA INDIAN TRIBE. Clean Water Act Section 106 October 1, 2012 September 31, 2013 Grant #: I 00E57603
 WATER QUALITY ASSESSMENT REPORT 2013 SAGINAW CHIPPEWA INDIAN TRIBE Clean Water Act Section 106 October 1, 2012 September 31, 2013 Grant #: I 00E57603 Technical Contacts: Carey Pauquette Water Quality Specialist
(including Slides from Dick Schwer & Michelle Thompson)
") Updated: 17 April 2013 Print version Lecture #38 TMDLs (including Slides from Dick Schwer & Michelle Thompson) David Reckhow CEE 577 #38 1 David Reckhow CEE 577 #38 2 What is a TMDL? Total Maximum Daily
Updated: 17 April 2013 Print version Lecture #38 TMDLs (including Slides from Dick Schwer & Michelle Thompson) David Reckhow CEE 577 #38 1 David Reckhow CEE 577 #38 2 What is a TMDL? Total Maximum Daily
Minnesota River Basin Turbidity TMDL
 Minnesota River Basin Turbidity TMDL Hydrological Simulation Program/FORTRAN Modeling Results: Scenario 4 Chuck Regan Barr Engineering Scenario 4: Key Elements Perennial Vegetation Increase in the Chippewa
Does Water Resources Management in the Snake River Basin Matter for the Lower Columbia River? Or Is the Snake River Part of Another Watershed?
 Does Water Resources Management in the Snake River Basin Matter for the Lower Columbia River? Or Is the Snake River Part of Another Watershed? John C. Tracy, Director Idaho Water Resources Research Institute
Potter Lake. University of Kansas Lawrence Campus, Douglas County, Kansas. Water Quality Evaluation January 13, 2014
 Potter Lake University of Kansas Lawrence Campus, Douglas County, Kansas Water Quality Evaluation 2011-2013 January 13, 2014 Prepared by the Department of Environment, Health & Safety University of Kansas,
Factsheet: Town of Deep River Water Quality and Stormwater Summary
 79 Elm Street Hartford, CT 06106-5127 www.ct.gov/deep Affirmative Action/Equal Opportunity Employer Factsheet: Town of Deep River Water Quality and Stormwater Summary This document was created for each
Analysis of PL-566 Reservoir Production Responses Along a Nutrient Loading Gradient
 Analysis of PL-566 Reservoir Production Responses Along a Nutrient Loading Gradient Richard L. Kiesling, Anne M.S. McFarland, and Larry M. Hauck TR0108 August 2001 Texas Institute for Applied Environmental
Protecting Utah s Water Resources. Nutrient Issues
 Protecting Utah s Water Resources Nutrient Issues Nutrient Issues Questions What are they? Why are they important? Nationally Locally What are the impact on my community Costs Timing What are Nutrients?
ASSIMILATIVE CAPACITY MODELING USING INTEGRATED WATERSHED AND LAKE MODELS IN SUPPORT OF THE GEORGIA COMPREHENSIVE STATEWIDE WATER MANAGEMENT PLAN
 B.J. Watson, et al., Int. J. of Design & Nature and Ecodynamics. Vol. 7, No. 2 (2012) 155 165 ASSIMILATIVE CAPACITY MODELING USING INTEGRATED WATERSHED AND LAKE MODELS IN SUPPORT OF THE GEORGIA COMPREHENSIVE
Task 1: Framework for a Reexamination. Falls Nutrient Strategy
 Task 1: Framework for a Reexamination of Stage II of the Falls Nutrient Strategy Prepared for: Upper Neuse River Basin Association Prepared by: Cardno ENTRIX 5400 Glenwood Ave, Suite G03, Raleigh, NC,
FINAL 2012 BACTERIA AND TURBIDITY TOTAL MAXIMUM DAILY LOADS FOR THE RED RIVER, OKLAHOMA (OK311100, OK311200, OK311210, OK311510, OK311600, OK311800)
") FINAL 2012 BACTERIA AND TURBIDITY TOTAL MAXIMUM DAILY LOADS FOR THE RED RIVER, OKLAHOMA (OK311100, OK311200, OK311210, OK311510, OK311600, OK311800) Prepared for: OKLAHOMA DEPARTMENT OF ENVIRONMENTAL QUALITY
FINAL 2012 BACTERIA AND TURBIDITY TOTAL MAXIMUM DAILY LOADS FOR THE RED RIVER, OKLAHOMA (OK311100, OK311200, OK311210, OK311510, OK311600, OK311800) Prepared for: OKLAHOMA DEPARTMENT OF ENVIRONMENTAL QUALITY
Nutrients and Ecosystems
 Nutrients and Ecosystems Fertilizer Application Rates Lawns: Athletic Fields: Pastures (Dairy): Vegetables: Corn: Citrus: Forests: 80-240 kg N/ha/yr 200-280 kg N/ha/yr 240-360 kg N/ha/yr 180-200 kg N/ha/yr
ALMY POND TMDL MANAGEMENT PLAN
 ALMY POND TMDL MANAGEMENT PLAN PUBLIC WORKSHOP Presented by: City of Newport Department of Utilities And Pare Corporation May 7, 2014 Presentation Overview Introduction to Almy Pond Project Introduction
Case Study. BiOWiSH Aqua has Positive Long-Term Effects. Biological Help for the Human Race
 Case Study BiOWiSH Aqua has Positive Long-Term Effects After Two Years, Sustains Improved Effluent Quality in South Korean Slaughterhouse Executive Summary BiOWiSH Aqua was implemented in a South Korean
Electric Forward Market Report
 Mar-01 Mar-02 Jun-02 Sep-02 Dec-02 Mar-03 Jun-03 Sep-03 Dec-03 Mar-04 Jun-04 Sep-04 Dec-04 Mar-05 May-05 Aug-05 Nov-05 Feb-06 Jun-06 Sep-06 Dec-06 Mar-07 Jun-07 Sep-07 Dec-07 Apr-08 Jun-08 Sep-08 Dec-08
Effectiveness of Coanda Screens for Removal of Sediment, Nutrients, and Metals from Urban Runoff
 Effectiveness of Coanda Screens for Removal of Sediment, Nutrients, and Metals from Urban Runoff Presented to by Steve Esmond Robbin Webber June 26, 2012 Inventor of the Coanda Effect: "A moving stream
Nutrients & Algal Blooms Developing water quality standards for the James River.
 Nutrients & Algal Blooms Developing water quality standards for the James River. Dr. Paul A. Bukaveckas and Dr. Joseph Wood Department of Biology Center for Environmental Studies http://wp.vcu.edu/jamesriver/
Nutrient Removal Mechanisms in a Cold Climate Gravel Wetland Alison Watts, Robert Roseen, Kim Farah, Heather Gilbert, Jamie Houle
 Nutrient Removal Mechanisms in a Cold Climate Gravel Wetland Alison Watts, Robert Roseen, Kim Farah, Heather Gilbert, Jamie Houle The 2009 New Hampshire Joint Water and Watershed Conference Concord, NH
MARK CREEK DEMONSTRATION PROJECT
 MARK CREEK DEMONSTRATION PROJECT OCC Tasks 20 and 21 FY 1990 319(h) Task 210 EPA Grant # C9-006704-90-0 Submitted by: Oklahoma Conservation Commission Water Quality Division 413 NW 12 th Oklahoma City,
Qian Zhang (UMCES / CBPO) Joel Blomquist (USGS / ITAT)
 Joel Blomquist (USGS / ITAT)") CBP STAC Water Clarity Workshop Solomons, MD, 02/06/2017 Long-term Riverine Inputs from Major Tributaries to Chesapeake Bay Relevant to Water Clarity Qian Zhang (UMCES / CBPO) Joel Blomquist (USGS / ITAT)
CBP STAC Water Clarity Workshop Solomons, MD, 02/06/2017 Long-term Riverine Inputs from Major Tributaries to Chesapeake Bay Relevant to Water Clarity Qian Zhang (UMCES / CBPO) Joel Blomquist (USGS / ITAT)
PHOSPHORUS LOADING PROCEDURES AND RESULTS
 July 17, 214 Upstate Freshwater Institute 1 PHOSPHORUS LOADING PROCEDURES AND RESULTS 213 Cayuga Lake Study Public Meeting Cayuga Lake Modeling Project July 17, 214 Ithaca, NY July 17, 214 Upstate Freshwater
Setting the Course for Improved Water Quality: Modeling for TMDL Studies
 Setting the Course for Improved Water Quality: Modeling for TMDL Studies A TMDL training program for local government leaders and other water managers Session 11a wq-iw3-61a Presentation goals Define the
AP Environmental Science
 AP Environmental Science Types of aquatic life zones MARINE Estuaries coral reefs mangrove swamps neritic zone pelagic zone FRESHWATER lakes and ponds streams and rivers wetlands Distribution of aquatic
Climate Change & Urbanization Have Changed River Flows in Ontario
 Climate Change & Urbanization Have Changed River Flows in Ontario by Trevor Dickinson & Ramesh Rudra Water Resources Engineering University of Guelph Acknowledgements Agencies NSERC, OMAF & Environment
Particulate Soil Phosphorus and Eutrophication in Lakes and Streams
 Particulate Soil Phosphorus and Eutrophication in Lakes and Streams Paul R. Bloom Soil, Water, & Climate Department University of Minnesota With contributions by John Moncrief, Carl Rosen and David Mulla
SURFACE WATER WITHDRAWALS & LOW FLOW PROTECTION POLICY MICHAEL COLLEGE, P.E. SUSQUEHANNA RIVER BASIN COMMISSION
 SURFACE WATER WITHDRAWALS & LOW FLOW PROTECTION POLICY MICHAEL COLLEGE, P.E. SUSQUEHANNA RIVER BASIN COMMISSION SCENARIOS Direct withdrawal from surface water (SW): PA MOU w/padep NY MOU w/nysdec MD No
Aquaculture Effluents and the Environment. CS Tucker, Mississippi State University
 Aquaculture Effluents and the Environment CS Tucker, Mississippi State University Characteristics of catfish pond effluents Impacts of catfish pond effluents Ways to reduce impacts of effluents What is
MARYLAND DEPARTMENT OF THE ENVIRONMENT 1800 Washington Boulevard Baltimore MD
 MARYLAND DEPARTMENT OF THE ENVIRONMENT 1800 Washington Boulevard Baltimore MD 21230 410-537-3000 1-800-633-6101 Martin O Malley Governor Anthony G. Brown Lieutenant Governor November 6, 2009 Shari T. Wilson
Causes of Gulf of Mexico Hypoxia
 Causes of Gulf of Mexico Hypoxia Nancy N. Rabalais 1 R. Eugene Turner 2 1 Louisiana Universities Marine Consortium 2 Louisiana State University Center for Sponsored Coastal Ocean Research, Coastal Ocean
Runoff Risk: A Decision Support Tool for Nutrient Applications
 Runoff Risk: A Decision Support Tool for Nutrient Applications Current & Planned Ecosystem IDSS Utilizing NWS Modeling to Help Improve the Nation s Water Quality Dustin Goering National Weather Service
Using Weather Forecasting For Decision Tools For Animal Agriculture
 Using Weather Forecasting For Decision Tools For Animal Agriculture Steve Buan National Weather Service Minnkota Agri-Builders and Equipment Suppliers Association 11 March 2016 Cattle Heat Stress Forecast
Lake Magda Nutrient TMDL FINAL
 Lake Magda Nutrient TMDL FINAL Prepared for Shingle Creek Watershed Management Commission Minnesota Pollution Control Agency September 2010 Lake Magda Nutrient TMDL FINAL Wenck File #1240-22 Prepared for:
Water Chemistry. Water 101
 Water Chemistry Water 101 I. Introduction A. Water is not pure Many different kinds of chemicals dissolved in it Ions, organic chemicals, organic matter, particulate matter, and gases can all be in water
Chapter Seven: Factors Affecting the Impact of Nutrient Enrichment on the Lower Estuary
 Chapter Seven: Factors Affecting the Impact of Nutrient Enrichment on the Lower Estuary As presented in Chapter Six, the water quality data for the upper stations of the tidal freshwater Potomac Estuary
Welcome to Round 3 of the Zumbro River WRAPS Meetings Held in Theilman, Oronoco, and Rochester on November 15 and 16, 2016
 Welcome to Round 3 of the Zumbro River WRAPS Meetings Held in Theilman, Oronoco, and Rochester on November 15 and 16, 2016 Round 3 Lobe Meeting Overview Protection component of the WRAPS: Fully supporting
Water quality monitoring and assessment: general principles and fitness for purpose
 Water quality monitoring and assessment: general principles and fitness for purpose Deborah V Chapman GEMS/Water Capacity development Centre University College Cork Considerations Purpose of monitoring
Water quality modelling to support the operation of the Kakhovka Reservoir, Dnieper River, Ukraine
 Water quality modelling to support the operation of the Kakhovka Reservoir, Dnieper River, Ukraine J. Hoybye*, L. Iritz**, M. Zheleznyak***, V. Maderich***, R.Demchenko***, N. Dziuba***, G. Donchitz***,
The Confluence Model. Presentation to Modeling and Forecasting Working Group January 21, 2015
 The Confluence Model Presentation to Modeling and Forecasting Working Group January 21, 2015 Introductions Presenter: Gary Fiske Working Group Water Department staff Objective: Penetrate the Black Box
Mathematical models in predicting the fate of Lake Pyhäjärvi waters
 Mathematical models in predicting the fate of Lake Pyhäjärvi waters Pori 22.10.2014 Timo Huttula, Inese Huttunen, Olli Malve, Anita Pätynen and Janne Ropponen SYKE Recent projects and modelling (besides
 Good Morning! Bruce Gilman Department of Environmental Conservation and Horticulture Finger Lakes Community College 3325 Marvin Sands Drive Canandaigua, New York 14424 585-785- 1255 gilmanba@flcc.edu Northern
FINAL TURBIDITY TOTAL MAXIMUM DAILY LOAD FOR BLACK BEAR CREEK, OKLAHOMA ( _00)
") FINAL TURBIDITY TOTAL MAXIMUM DAILY LOAD FOR BLACK BEAR CREEK, OKLAHOMA (621200030010_00) Prepared for: OKLAHOMA DEPARTMENT OF ENVIRONMENTAL QUALITY Prepared by: AUGUST 2010 FIANL TURBIDITY TOTAL MAXIMUM
FINAL TURBIDITY TOTAL MAXIMUM DAILY LOAD FOR BLACK BEAR CREEK, OKLAHOMA (621200030010_00) Prepared for: OKLAHOMA DEPARTMENT OF ENVIRONMENTAL QUALITY Prepared by: AUGUST 2010 FIANL TURBIDITY TOTAL MAXIMUM
Modeling Chester River Water Quality...
 Modeling Chester River Water Quality... Jeremy Testa Damian Brady Kelly Cole Ming Li University of Maryland Center for Environmental Science University of Maine Outline (1) Quick update on ROMS (2) Comparison
ARKANSAS NUTRIENT CRITERIA DEVELOPMENT. EPA Region 6 Nutrient RTAG Dallas, Texas April 14, 2015
 ARKANSAS NUTRIENT CRITERIA DEVELOPMENT EPA Region 6 Nutrient RTAG Dallas, Texas April 14, 2015 CRITERIA DEVELOPMENT MILESTONES Assessment Methodology Beaver Lake Wadeable Streams Nutrient Trading-Act 335
Calculating growth rate of water hyacinth pollution wise (in relation to trophic state)
") International Journal of Engineering and Technical Research (IJETR) ISSN: 3-869 (O) 454-4698 (P) Volume-7, Issue-7, July 7 Calculating growth rate of water hyacinth pollution wise (in relation to trophic
International Journal of Engineering and Technical Research (IJETR) ISSN: 3-869 (O) 454-4698 (P) Volume-7, Issue-7, July 7 Calculating growth rate of water hyacinth pollution wise (in relation to trophic
Lecture 9A: Drainage Basins
 GEOG415 Lecture 9A: Drainage Basins 9-1 Drainage basin (watershed, catchment) -Drains surfacewater to a common outlet Drainage divide - how is it defined? Scale effects? - Represents a hydrologic cycle
EUTROPHICATION. Student Lab Workbook
 EUTROPHICATION Student Lab Workbook THE SCIENTIFIC METHOD 1. Research Background literature research about a topic of interest 2. Identification of a problem Determine a problem (with regards to the topic)
JEDDAH INDUSTRIAL CITY
 JEDDAH INDUSTRIAL CITY WASTEWATER TREATMENT PLANT A Presentation by : Engr. Mowafaq Al-Sugeir Managing Director ICDOC SAWEA 2007 WORKSHOP, AL-KHOBER 4 December 2007 Built & Being Operated by : on Build-Operate-Transfer
Aquatic Ecosystems of the Pittsburgh District
 Aquatic Ecosystems of the Pittsburgh District Carl Nim M.A. MEn. Biologist U.S. Army Corps of Engineers Pittsburgh District 4 May 2016 US Army Corps of Engineers Outline District Overview Water Quality
General Instream Flow Methods Overview. Agency Meeting on 2012 Draft Study Descriptions January 24, 2011
 General Instream Flow Methods Overview Agency Meeting on 2012 Draft Study Descriptions January 24, 2011 1 Susitna River 2 Main Channel and Side Channels 3 Sloughs and Side Channels 4 Turbidity Portage
DES MOINES RIVER RESERVOIRS WATER CONTROL PLAN UPDATES IOWA ASCE WATER RESOURCES DESIGN CONFERENCE
 DES MOINES RIVER RESERVOIRS WATER CONTROL PLAN UPDATES 237 237 237 217 217 217 200 200 200 0 0 0 163 163 163 131 132 122 80 119 27 252 174.59 110 135 120 112 92 56 IOWA ASCE WATER RESOURCES DESIGN CONFERENCE
Chesapeake Bay. report card
 Chesapeake Bay report card 2010 C- C Healthy water quality provides better habitat conditions for crabs, fish, and other aquatic species. issolved oxygen is essential to the survival of all these organisms;
Biscayne Bay. A Jewel in Jeopardy? Stephen Blair 1 and Sarah Bellmund 2
 Biscayne Bay A Jewel in Jeopardy? Stephen Blair 1 and Sarah Bellmund 2 1 Department of Regulatory and Economic Resources; Division of Environmental Resources Management (DERM), Miami, FL 2 National Park
Prepared by: Capitol Region Watershed District and Emmons & Olivier Resources, Inc. DRAFT Como Lake TMDL. February 22, water ecology community
 Prepared by: Capitol Region Watershed District and Emmons & Olivier Resources, Inc. DRAFT February 22, 2010 water ecology community Cover Image Como Lake Document Component Specs Text: Corporate Express
Wisconsin Wastewater Operators Association. Protecting Our Water Resources: The Future Bill Hafs - NEW Water 10/2014
 Wisconsin Wastewater Operators Association Protecting Our Water Resources: The Future Bill Hafs - NEW Water 10/2014 The Fox River Contributes 1/3 of All Nutrients to Lake Michigan APRIL 15, 2011 Photo
Dead-Zones and Coastal Eutrophication: Case- Study of Chesapeake Bay W. M. Kemp University of Maryland CES Horn Point Laboratory Cambridge, MD
 Dead-Zones and Coastal Eutrophication: Case- Study of Chesapeake Bay W. M. Kemp University of Maryland CES Horn Point Laboratory Cambridge, MD Presentation to COSEE Trends Orientation at UMCES HPL 4 August
BIG ROCHE A CRI LAKE CHARACTERISTICS
 BIG ROCHE A CRI LAKE CHARACTERISTICS Lake Description Big Roche Cri Lake is located in north central Adams County and has a surface area of 205 acres, a shoreline length of 6.1 mile, a volume of 6,993
D. Common Water Quality Models
 D. Common Water Quality Models In this appendix we introduce a few of the common models used in water quality analysis. This is by no means a complete list, but does provide a starting point from which
IOP Conference Series: Earth and Environmental Science. Related content PAPER OPEN ACCESS
 IOP Conference Series: Earth and Environmental Science PAPER OPEN ACCESS Analysis on the spatiotemporal characteristics of water quality and trophic states in Tiegang Reservoir: A public drinking water
Overview of the Surface Hydrology of Hawai i Watersheds. Ali Fares Associate Professor of Hydrology NREM-CTAHR
 Overview of the Surface Hydrology of Hawai i Watersheds Ali Fares Associate Professor of Hydrology NREM-CTAHR 5/23/2008 Watershed Hydrology Lab 1 What is Hydrology? Hydrology is the water science that
TURBINE VENTING FOR DISSOLVED OXYGEN IMPROVEMENTS AT BULL SHOALS, NORFORK, AND TABLE ROCK DAMS
 TURBINE VENTING FOR DISSOLVED OXYGEN IMPROVEMENTS AT BULL SHOALS, NORFORK, AND TABLE ROCK DAMS Introduction E. Dean 1, M. ASCE Bethel Herrold 2 George Robbins 3, M. ASCE James C. Carter 4 The Southwestern
Comparative Analysis of Minnesota Lakes Treated with Alum to Inform Spring Lake Treatment
 Comparative Analysis of Minnesota Lakes Treated with Alum to Inform Spring Lake Treatment Prepared for the Prior Lake Spring Lake Watershed District (PLSLWD) April 23, 2013 Comparative Analysis of Minnesota
Modeling Fate and Effects of Multiple Stressors on a Use- Impaired River
 Society for Environmental Toxicology & Chemistry Salt Lake City, Utah, November 18, 2002 Modeling Fate and Effects of Multiple Stressors on a Use- Impaired River Abstract Modeling the Effects of Multiple
Missouri River Basin Water Management
 Missouri River Basin Water Management Spring 2011 Public Meetings April 12 th 11:00 a.m. Nebraska City, NE April 12 th 7:00 p.m. Fort Peck, MT April 13 th 1:00 p.m. Bismarck, ND April 13 th 7:00 p.m. Pierre,
Missouri River Basin Water Management
 Missouri River Basin Water Management Spring 2015 Public Meetings April 7 th April 7 th April 8 th April 9 th April 9 th 11:00 a.m. 6:00 p.m. 11:00 a.m. 11:00 a.m. 6:00 p.m. Pierre, SD Bismarck, ND Fort
United Water Conservation District November 2016 Hydrologic Conditions Report 2017 Water Year. December 6, 2016
 United Water Conservation District November 216 Hydrologic Conditions Report 217 Water Year December 6, 216 Page Intentionally Left Blank PRECIPITATION (INCHES) PRECIPITATION (INCHES) PRECIPITATION (INCHES)
Information Request 11
 Information Request 11 Information Request 11 11-1 Responses to Information Request 11 Response to Information Request 11a Response to Information Request 11b 11-2 11-6 Federal Review Panel Information
Nutrient Sources, Fate, Transport, and Effects Study of Galveston Bay, Texas Rachel Windham,
 Nutrient Sources, Fate, Transport, and Effects Study of Galveston Bay, Texas Rachel Windham, Department of Marine Biology Texas A&M University at Galveston 2 Acknowledgements: Dr. Antonietta Quigg Members
Preserving Lake Kinneret (Sea of Galilee, Israel) as a strategic water resource in a changing climate
 as a strategic water resource in a changing climate") Preserving Lake Kinneret (Sea of Galilee, Israel) as a strategic water resource in a changing climate Dr. Doron Markel Water Authority of Israel doronm10@water.gov.il Acknowledgment: Prof. Sharon Megdal
Preserving Lake Kinneret (Sea of Galilee, Israel) as a strategic water resource in a changing climate Dr. Doron Markel Water Authority of Israel doronm10@water.gov.il Acknowledgment: Prof. Sharon Megdal
Using Paired Edge of Field Data to Assess Impacts of Management on Surface and Subsurface P Loss
 Using Paired Edge of Field Data to Assess Impacts of Management on Surface and Subsurface P Loss Kevin W. King, Mark R. Williams, and Norm R. Fausey USDA ARS Soil Drainage Research Unit Columbus, OH Edge-of-field
State Water Resources Monitoring Priorities and Role of Citizen Based Monitoring Tim Asplund, WDNR April 5, 2013
 State Water Resources Monitoring Priorities and Role of Citizen Based Monitoring Tim Asplund, WDNR April 5, 2013 From Ken Johnson, WDNR Water Division Administrator: Please extend my gratitude to all those