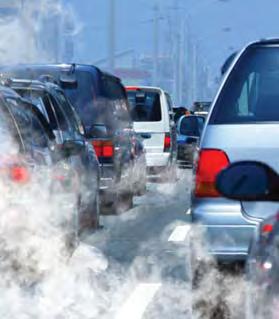
climate change in the ohioan mind CLIMATE
|
|
|
- Pauline Matthews
- 6 years ago
- Views:
Transcription


1 climate change in the ohioan mind CLIMATE
2 Climate Change in the Ohioan Mind 1 Table of Contents Introduction... 2 Executive Summary... 3 Key Findings... 5 Beliefs and attitudes...5 Climate impacts and extreme weather...6 Support for climate and energy policies...7 Actions to limit global warming...8 Global warming communication...9 Appendices Selected Charts Posted Questionnaire Survey Method Sample Demographics... 39
3 Climate Change in the Ohioan Mind 2 Introduction This report is based on findings from a statewide representative survey of Ohioans conducted by the Yale Project on Climate Change Communication ( A total of 800 adults (18+) were interviewed by telephone July 3 10, To help ensure representativeness of the final sample, the survey was administered to respondents reached on traditional landline telephones (560) as well as to those reached on cellphones (240). The average margin of error for the total sample +/- 3 percentage points at the 95% confidence level. The survey was conducted for YPCCC by Abt SRBI using random digit dial sample supplied by Survey Sampling International. The research was funded by the Skoll Global Threats Fund and the Energy Foundation. Principal Investigators: Anthony Leiserowitz, PhD Yale Project on Climate Change Communication School of Forestry & Environmental Studies Yale University (203) anthony.leiserowitz@yale.edu Geoff Feinberg Yale Project on Climate Change Communication School of Forestry & Environmental Studies Yale University (203) geoffrey.feinberg@yale.edu Peter Howe, PhD Department of Environment & Society Quinney College of Natural Resources Utah State University peter.howe@usu.edu Seth Rosenthal, PhD Yale Project on Climate Change Communication School of Forestry & Environmental Studies Yale University seth.rosenthal@yale.edu Cite as: Leiserowitz, A., Feinberg, G., Howe, P., & Rosenthal, S. (2013) Climate change in the Ohioan mind. Yale University. New Haven, CT: Yale Project on Climate Change Communication.
4 Climate Change in the Ohioan Mind 3 Executive Summary Most Ohioans (70%) believe global warming is happening. Relatively few (16%) believe it is not. About half (49%) believe that if global warming is happening, it is caused mostly by human activities. Ohioans think global warming is important and are worried about it. Two-thirds (67%) say the issue of global warming is at least somewhat important to them personally. And about half (52%) are at least somewhat worried about it. Though virtually all climate scientists agree human-caused global warming is happening, many Ohioans, like most Americans, are unaware of this fact. Fully half (49%) believe that there is a lot of disagreement among scientists about whether or not global warming is happening. Fewer (43%) believe most scientists agree that global warming is happening. Among those who believe global warming is happening, solid majorities believe it is currently having a large or moderate influence on the severity of heat waves (73%), flooding of rivers or lakes (62%), and droughts (58%). Nearly half of Ohioans (45%) say they have personally experienced the effects of global warming. Among Ohioans who believe global warming is happening, large majorities expect to see a myriad of negative effects over the next 50 years. Nine in ten (89%) anticipate more heat waves due to global warming. At least eight in ten believe Ohio will experience worse storms, hurricanes, or tornadoes (84%), increased allergies, asthma, infectious diseases, or other health problems (83%), declining numbers of fish and native wildlife (82%), and increased droughts and water shortages (82%). More than half of Ohioans say that more should be done about global warming at all levels of government from Congress (59%) and President Obama (54%), to Ohio s state legislature (56%) and Governor Kasich (54%), to local government officials (53%). However, even larger numbers of Ohioans believe that corporations and industry (69%) and citizens themselves (65%) should be doing more to address climate change. Six in ten Ohioans (59%) say the United States should reduce greenhouse gas emissions regardless of whether or not other countries do the same. Many Ohioans believe that individual action, and especially collective action, can be effective in addressing global warming. Among those who believe global warming is happening, most (80%) say their own actions would reduce their personal contribution to global warming at least a little. Virtually all Ohioans who believe global warming is happening say that if the same actions were taken by most people in the U.S. (89%) or around the world (91%), it would reduce global warming a little, some, or a lot.
5 Climate Change in the Ohioan Mind 4 A plurality of Ohioans (43%) say that switching from fossil fuels to clean energy sources would increase economic growth and the number of jobs. Many Ohioans are unsure that people will rally to do what s necessary to reduce global warming. A plurality (35%) believes humans could reduce global warming, but that it s unclear at this point whether we will do what is needed. Relatively few are convinced that people can reduce global warming and will do so successfully (7%). Four in ten Ohioans (41%) say that, in the past 12 months, they have rewarded companies that are taking steps to reduce global warming by buying their products at least once, and 38% would like to do it more often in the next 12 months. Moreover, three in ten (31%) have punished companies that are opposing steps to reduce global warming at least once by not buying their products during the past 12 months, and 30% would like to do this more often in the coming year.
6 Climate Change in the Ohioan Mind 5 Key Findings Beliefs and Attitudes Most Ohioans believe global warming is happening and half of them believe it is human caused. Most Ohioans (70%) believe that global warming is happening. Relatively few (16%) do not. About two-thirds (64%) of those who believe global warming is happening are either extremely or very sure it is. Those who do not believe it is happening are also firm in their beliefs, but slightly less so 55% are either extremely or very sure global warming is not happening. About half of Ohioans (49%) believe that, if global warming is happening, it is caused mostly by human activities. However, 28% believe it is caused mostly by natural changes in the environment, while 9% believe it is the result of both human activities and natural changes. Ohioans are less sure that there is agreement about the reality of global warming among scientists. Half (49%) believe that there is a lot of disagreement among scientists about whether or not global warming is happening. By contrast, 43% believe most scientists think global warming is happening. Just 3% believe that most scientists think global warming is not happening. Many Ohioans are concerned about global warming, but only about half believe they have experienced its effects. About half of Ohioans (52%) say they are very or somewhat worried about global warming and two-thirds (67%) say the issue of global warming is at least somewhat important to them personally. By contrast, one in three (32%) say it is not important. Nearly half of Ohioans (45%) say that they have experienced the effects of global warming. Most believe human intervention is needed to reduce global warming. Many Ohioans believe that individual actions can help, and indeed are necessary, to reduce global warming. For example, more than half (55%) disagree that the actions of a single individual won t make any difference in global warming. Similarly, 55% disagree that new technologies can solve global warming without individuals having to make big changes in their lives. Ohioans are uncertain about whether humanity will do what is necessary to reduce global warming. A plurality (35%) believes humans could reduce global warming, but it s unclear at this point whether we will do what s needed. Aside from those who are uncertain, the pessimists outnumber the optimists. More than one in ten (13%) believes humans simply can t reduce global warming, while another one in three (32%) believes that, although we could reduce global warming, people aren t willing to change their behavior to do so. Fewer than one in ten (7%) believe that humans can reduce global warming and will do so successfully.
7 Climate Change in the Ohioan Mind 6 Climate Impacts and Extreme Weather Ohioans have observed increasing flooding of rivers and lakes and, to a lesser extent, heat waves. Slightly over half of Ohioans (54%) say that, over the past several years, flooding of rivers or lakes has become more severe in their state. Of those who believe global warming is happening, a majority (62%) believes global warming has had at least a moderate influence on the severity of flooding in Ohio. Few (9%) believe global warming has had no influence on flooding. Similarly, a plurality (44%) of all Ohioans believes heat waves in the state have become more severe over the past several years. Of those who believe global warming is happening, a solid majority (72%) say that it has had at least a moderate influence on the severity of heat waves, while only 8% say global warming has had no influence. By contrast, relatively few Ohioans say that the state has experienced an increase in drought (28%) or wildfires (9%). Ohioans expect a myriad of negative global warming effects over the next 50 years. Most Ohioans who believe that global warming is happening say that negative climate impacts are at least somewhat likely to occur over the next 50 years as a result. For example, nine in ten (89%) anticipate more heat waves and eight in ten believe the state will experience worse storms, hurricanes, or tornadoes (84%), increased allergies, asthma, infectious diseases, or other health problems (83%), declining numbers of fish and native wildlife (82%), increased droughts and water shortages (82%), and increased power outages (78%) due to global warming. Seven in ten who believe global warming is happening anticipate flooding of major cities (72%). Ohioans tend to see global warming less as a threat to themselves than to others. Seven in ten Ohioans believe that global warming will cause at least a moderate amount of harm to future generations of people (70%) and to plant and animal species (70%). Majorities also believe that global warming will harm people in modern industrialized countries (59%), in developing countries (57%), or in the United States (57%). Fewer Ohioans, however, believe that global warming will harm people in their own families (44%) or communities (44%). Still fewer think they will be personally harmed by global warming, with only 35% saying global warming will do at least a moderate amount of harm to them personally, while one in three (32%) say they will not be harmed at all.
8 Climate Change in the Ohioan Mind 7 Support for Climate and Energy Policies Ohioans say industry, citizens, and government should do more to address global warming. A large majority of Ohioans (83%) say that global warming should be a very high, high, or medium priority for the president and Congress. At least half of Ohioans want their representatives at all levels of government to do more to address global warming, including Congress (59%), Ohio state legislators (56%), President Obama (54%), Governor Kasich (54%), and local government officials (53%). However, more Ohioans say that corporations and industry (69%) and citizens themselves (65%) should be doing more to address climate change. Ohioans say the U.S. should act alone on global warming if necessary. The majority of Ohioans (59%) say the United States should reduce greenhouse gas emissions regardless of what other countries do. Very few (4%) say the U.S. should act only if other industrialized countries also reduce their emissions, and only 10% say the U.S. should wait for both other industrialized and developing countries to act. Some (13%) say the U.S. should not reduce its emissions in any case. Further, two in three (65%) say the U.S. should make a medium- or large-scale effort to reduce global warming, even if there are, respectively, medium or large economic costs. Only one in ten (11%) says the U.S. should make no effort to reduce global warming. Ohioans support switching to clean energy sources. Most Ohioans (78%) support tax rebates for people who purchase energy-efficient vehicles or solar panels. By contrast, only 19% of Ohioans would oppose this policy. A majority (59%) supports requiring electric utilities to produce at least 20% of their electricity from wind, solar, or other renewable energy sources even if it costs the average household an extra $100 a year. Comparatively few (35%) would oppose this policy. About four in ten Ohioans (43%) believe that if the state switched from fossil fuels (e.g., coal and oil) to clean energy sources (e.g., solar and wind), it would increase economic growth and the number of jobs in the state, while an additional 17% say it would make no difference. One in four (26%) says a switch to clean energy would decrease economic growth and the number of jobs. Ohioans are evenly split in their opinion of fracking 26% support it while 25% oppose it. A plurality (45%) is currently undecided.
9 Climate Change in the Ohioan Mind 8 Actions to limit global warming Many Ohioans are engaged in actions to limit global warming and are interested in doing them more frequently. Most Ohioans (86%) have at least a few compact fluorescent lights in their home. Only 7% have none. Among Ohioans who do not yet have all or most bulbs replaced with CFLs, one in three (33%) says that over the next 12 months he or she would like to replace them and probably will. Others would like to replace them, but probably won t (21%). About one in five (21%) does not want to replace them, and 25% are not sure. Six in ten Ohioans (60%) say they set their thermostats always, often, or sometimes to 68 degrees or cooler in the winter. In contrast, 37% do it rarely or never. More than one in three Ohioans (36%) at least sometimes walk or bike instead of drive. More (62%), however, do it rarely or never. One in five (20%) at least sometimes use public transportation or car pool. The majority (78%), however, rarely or never do so. Ohioans agree individuals can make a difference, but together we can make a bigger difference. Of those who believe that global warming is happening, most (80%) think that the actions they are already taking and those they would like to take over the next 12 months would reduce their personal contribution to global warming at least a little. One in five (19%) says individual actions will not help reduce global warming at all. Ohioans believe that the same actions would be more effective if done collectively. Virtually all who believe that global warming is happening say that if most people in the United States (89%) or in the modern industrialized countries around the world (91%) did the same things, it would reduce global warming at least a little. Many Ohioans reward or punish companies based on their efforts to reduce global warming. About four in ten Ohioans (41%) say that, over the past 12 months, they have rewarded companies that are taking steps to reduce global warming by buying their products at least once. Moreover, about three in ten (31%) say that, over the past 12 months, they have punished companies that are opposing steps to reduce global warming by not buying their products. One in four Ohioans (24%) says that, over the past 12 months, he or she has volunteered with or donated money to an organization working to reduce global warming.
10 Climate Change in the Ohioan Mind 9 Global warming communication Global warming is a topic of conversation for most Ohioans. Nearly half of Ohioans (46%) say they discuss global warming with their family and friends often or occasionally. Over half (59%) say that all, most, or some of their friends share their views on global warming. Only 15% say that none of their friends do. Some Ohioans have communicated with government officials about global warming. About one in ten Ohioans (11%) has written letters, ed, or phoned government officials about global warming at least once in the past 12 months. Among them, the large majority (82%) says they urged officials to take action to reduce global warming. Only 9% urged them not to take action. One in four Ohioans (24%) says he or she would like to contact government officials more often over the next 12 months. Of those, two in three (65%) would urge officials to take action to reduce global warming, compared to 10% who would urge them not to take action. Half or more Ohioans say President Obama, Senator Sherrod Brown, and Governor John Kasich are believable when talking about energy- and climate-related issues. The majority of Ohioans (57%) say that President Obama is very or somewhat believable when speaking about energy- and climate-related issues. One in three (33%) says he is either not very or not at all believable. About half of Ohioans also say that Senator Sherrod Brown (52%) and Governor John Kasich (49%) are believable regarding energy and climate issues. Fewer (43%) say that Senator Rob Portman is believable.

11 Climate Change in the Ohioan Mind 10 Appendix I: Selected Charts


12 Climate Change in the Ohioan Mind 11


13 Climate Change in the Ohioan Mind 12
14 Climate Change in the Ohioan Mind 13

15 Climate Change in the Ohioan Mind 14
16 Climate Change in the Ohioan Mind 15 Appendix II: Posted Questionnaire 1. How often do you do each the following never, rarely, sometimes, often, or always? If something I say doesn t apply to you, just let me know. First [READ EACH ITEM. REPEAT SCALE AS NECESSARY.] Never Rarely Sometimes Often Always Not app. NS REF In the winter, set the thermostat to 68 degrees or cooler Use public transportation or car pool 27% 10% 19% 13% 28% 4% 1% --% Walk or bike instead of drive Over the next 12 months, would you like to do each of the following more frequently than you do now, less frequently than you do now, or about as frequently as you do now? [READ EACH ITEM. REPEAT SCALE AS NECESSARY.] Less frequently About the same More frequently NS REF In the winter, set the thermostat to 68 degrees or cooler Use public transportation or car pool Walk or bike instead of drive 15% 67% 17% 2% 1%
17 Climate Change in the Ohioan Mind How many light bulbs in your home are energy-efficient compact fluorescent lights All, most, some, a few, none of them, or are you not sure? All 28% Most 27 Some 18 A few 13 None 7 Not sure 8 Refused -- [ASK RESPONDENTS WHO ANSWER Q3=3,4, OR 5; n=308] 4. Over the next 12 months, how likely will you be to change most of the light bulbs in your home to energy-efficient compact fluorescent lights? Would you say you d like to and probably will, or that you d like to but probably won't, or that you don t want to and therefore won t, or are you not sure? Yes, I d like to and probably will 33% Yes, I d like to but probably won t 21 No, I don t want to 21 Not sure 25 Refused --
18 Climate Change in the Ohioan Mind In your view, do you think each of the following has become much less severe, somewhat less severe, stayed about the same, become somewhat more severe, or much more severe in Ohio over the past several years? [READ EACH ITEM. REPEAT SCALE AS NECESSARY.] Much less severe Somewhat less severe Same Somewhat more severe Much more severe NS REF Wildfires 18% 13% 46% 5% 4% 13% --% Flooding of rivers or lakes Drought Heat waves a. Do you think global warming is a bad thing or a good thing? If you ve never heard of global warming, just let me know. Bad thing 68% Good thing 9 Never heard of global warming 6 Not sure 14 Refused 3
19 Climate Change in the Ohioan Mind 18 [ASK RESPONDENTS WHO ANSWER Q6a=1; n=531] 6b. And do you think global warming is a very bad thing, moderately bad thing, or slightly bad thing? Very bad 52% Moderately bad 30 Slightly bad 14 Not sure 3 Refused -- [ASK RESPONDENTS WHO ANSWER Q6a=2; n=68] 6c. And do you think global warming is a very good thing, moderately good thing, or slightly good thing? Very good 18% Moderately good 36 Slightly good 45 Not sure 1 Refused --
20 Climate Change in the Ohioan Mind Recently, you may have noticed that global warming has been getting some attention in the news. Global warming refers to the idea that the world s average temperature has been increasing over the past 150 years, may be increasing more in the future, and that the world s climate may change as a result. What do you think: Do you think that global warming is happening, or not? If you re not sure, just let me know. Yes 70% No 16 Not sure 14 Refused -- [ASK RESPONDENTS WHO THINK GLOBAL WARMING IS HAPPENING (Q7=1); n=534] 8. How sure are you that global warming is happening not at all sure, somewhat sure, very sure, or extremely sure? Not at all sure 4% Somewhat sure 31 Very sure 34 Extremely sure 29 Not sure 2 Refused 4 [ASK RESPONDENTS WHO THINK GLOBAL WARMING IS NOT HAPPENING (Q7=2); n=148] 9. How sure are you that global warming is not happening not at all sure, somewhat sure, very sure, or extremely sure? Not at all sure 16% Somewhat sure 29 Very sure 26 Extremely sure 28 Not sure 2 Refused 16
21 Climate Change in the Ohioan Mind Assuming global warming is happening, do you think it is [READ EACH ITEM DO NOT ACCEPT RESPONSE UNTIL ALL ITEMS HAVE BEEN READ.] Caused mostly by human activities, or 49% Caused mostly by natural changes in the environment, or 28 Something else (Please specify), or [10] Both human activities and natural changes in the environment 9 Other 1 None of these, because global warming isn t happening 8 Not sure Which of the following statements comes closest to your own view? If you re not sure, just let me know. [READ EACH ITEM DO NOT ACCEPT RESPONSE UNTIL ALL ITEMS HAVE BEEN READ.] Most scientists think global warming is happening, or 43% Most scientists think global warming is not happening, or 3 There is a lot of disagreement among scientists about whether or not global warming is happening 49 Not sure 5 Refused --
22 Climate Change in the Ohioan Mind 21 [ASK RESPONDENTS WHO THINK GLOBAL WARMING IS HAPPENING (Q7=1); n=534] 12. Thinking about the energy-saving actions you re already taking and those you d like to take over the next 12 months, If you did most of these things, how much do you think it would reduce your personal contribution to global warming not at all, a little, some, or a lot? Not at all 19% A little 33 Some 31 A lot 16 Not sure 2 Refused --
23 Climate Change in the Ohioan Mind 22 [ASK RESPONDENTS WHO THINK GLOBAL WARMING IS HAPPENING (Q7=1); n=534] 13. If most people in the United States did these same actions, how much do you think it would reduce global warming not at all, a little, some, or a lot? Not at all 9% A little 22 Some 27 A lot 40 Not sure 2 Refused -- [ASK RESPONDENTS WHO THINK GLOBAL WARMING IS HAPPENING (Q7=1); n=534] 14. If most people in the modern industrialized countries around the world did these same actions, how much do you think it would reduce global warming not at all, a little, some, or a lot? Not at all 7% A little 15 Some 22 A lot 54 Not sure 2 Refused --
24 Climate Change in the Ohioan Mind How worried are you about global warming very worried, somewhat worried, not very worried, or not at all worried? Very worried 14% Somewhat worried 38 Not very worried 23 Not at all worried 24 Not sure 1 Refused Please tell me whether you think global warming will harm each of the following not at all, only a little, a moderate amount, or a great deal? If you re not sure about an item, just let me know. First [READ EACH ITEM. REPEAT SCALE AS NECESSARY.] Not at all Only a little A moderate amount A great deal Not sure REF You personally 32% 25% 21% 14% 8% --% Your family People in your community People in the United States People in modern industrialized countries People in developing countries Future generations of people Plant and animal species
25 Climate Change in the Ohioan Mind When do you think global warming will start to harm people in the United States? Would you say [READ EACH ITEM DO NOT ACCEPT RESPONSE UNTIL ALL ITEMS HAVE BEEN READ.] They are being harmed right now, or 35% In 10 years, or 13 In 25 years, or 14 In 50 years, or 9 In 100 years, or 9 Never 16 Not sure 5 Refused 0 [ASK RESPONDENTS WHO THINK GLOBAL WARMING IS HAPPENING (Q7=1); n=534] 18. Do you think it is very likely, somewhat likely, somewhat unlikely, or very unlikely that each of the following will occur in Ohio over the next 50 years due to global warming? [RANDOMIZE] Very unlikely Somewhat unlikely Somewhat likely Very likely NS REF Increased allergies, asthma, infectious diseases or other health problems 5% 7% 29% 54% 6% --% Power outages More heat waves Droughts and water shortages Worse storms, hurricanes, or tornadoes Flooding of major cities Declining numbers of fish and native wildlife
26 Climate Change in the Ohioan Mind 25 [ASK RESPONDENTS WHO THINK GLOBAL WARMING IS HAPPENING (Q7=1); n=534] 19. In your opinion, is global warming having no influence, a small influence, a moderate influence, or a large influence on the severity of [ITEM] in Ohio? [READ EACH ITEM. REPEAT SCALE AS NECESSARY.] No influence Small influence Moderat e influence Large influence NS REF Wildfires 19% 29% 25% 20% 7% --% Flooding of rivers or lakes Drought Heat waves How much had you thought about global warming before today not at all, a little, some, or a lot? Not at all 15% A little 24 Some 32 A lot 30 Not sure -- Refused --
27 Climate Change in the Ohioan Mind How important is the issue of global warming to you personally would say it is not at all important, not too important, somewhat important, very important, or extremely important? Not at all important 14% Not too important 18 Somewhat important 33 Very important 24 Extremely important 10 Not sure -- Refused On some issues, people feel that they have all the information they need in order to form a firm opinion, while on other issues they would like more information before making up their mind. For global warming, would you say you [READ EACH ITEM DO NOT ACCEPT RESPONSE UNTIL ALL ITEMS HAVE BEEN READ.] Do not need any more information, or you 38% Need a little more information, or you 14 Need some more information, or you 25 Need a lot more information 22 Not sure -- Refused --
28 Climate Change in the Ohioan Mind Please tell me whether you strongly disagree, somewhat disagree, somewhat agree, or strongly agree with each of the following statements. First [READ EACH ITEM. REPEAT SCALE AS NECESSARY.] Strongly disagree Somewhat disagree Somewhat agree Strongly agree NS REF I could easily change my mind about global warming The actions of a single individual won t make any difference in global warming New technologies can solve global warming without individuals having to make big changes in their lives I have personally experienced the effects of global warming 40% 22% 28% 9% 2% 0% How often do you discuss global warming with your family and friends never, rarely, occasionally, or often? Never 30% Rarely 24 Occasionally 32 Often 14 Not sure -- Refused --
29 Climate Change in the Ohioan Mind How many of your friends share your views on global warming none, a few, some, most, or all? None 15% A few 17 Some 26 Most 28 All 5 Not sure 10 Refused Which one of the following statements comes closest to your view? [READ EACH ITEM DO NOT ACCEPT RESPONSE UNTIL ALL ITEMS HAVE BEEN READ.] [PROGRAMMER: HALF OF RESPONDENTS SHOULD BE READ ITEMS 1-5; OTHER HALF SHOULD BE READ ITEMS 5-1] Global warming isn t happening, or 11% Humans can t reduce global warming, even if it is happening, or 13 Humans could reduce global warming, but people aren t willing to change their behavior, so we re not going to, or Humans could reduce global warming, but it s unclear at this point whether we will do what s needed, or Humans can reduce global warming, and we are going to do so successfully 7 Not sure 3 Refused 0
30 Climate Change in the Ohioan Mind Do you think global warming should be a low, medium, high, or very high priority for the president and Congress? [READ EACH ITEM.] Low priority 27% Medium priority 24 High priority 32 Very high priority 15 Not sure 2 Refused Do you think each of the following should be doing much more, more, less, or much less to address global warming, or do you think they are currently doing the right amount to address it? [READ EACH ITEM. REPEAT SCALE AS NECESSARY.] [RANDOMIZE] Much less Less Currently doing the right amount More Much more NS REF The U.S. Congress 10% 10% 12% 28% 31% 8% 1% President Obama Corporations and industry Citizens themselves Your local government officials Your state legislators Your governor
31 Climate Change in the Ohioan Mind 30 [SPLIT SAMPLE A; n=388] 29a. Do you think your state government should be doing much more, more, less, much less, or about the same amount as it is doing now to prepare for the potential impacts of global warming? Much more 38% More 26 Same amount 17 Less 5 Much less 10 Not sure 3 Prefer not to answer -- [SPLIT SAMPLE B; n=412] 29b. Do you think your local government should be doing much more, more, less, much less, or about the same amount as it is doing now to prepare for the potential impacts of global warming? Much more More Same amount Less Much less Not sure Prefer not to answer 32%
32 Climate Change in the Ohioan Mind People disagree about whether the United States should reduce greenhouse gas emissions on its own, or make reductions only if other countries do so. Which of the following statements comes closest to your own point of view? If you re not sure, just let me know. The United States should reduce its greenhouse gas emissions [READ EACH ITEM DO NOT ACCEPT RESPONSE UNTIL ALL ITEMS HAVE BEEN READ.] Regardless of what other countries do, or 59% Only if other industrialized countries (such as England, Germany, and Japan) reduce their emissions, or Only if other industrialized countries and developing countries (such as China, India, and Brazil) reduce their emissions, or 4 10 The U.S. should not reduce its emissions 13 Don t know 14 Refused How big of an effort should the United States make to reduce global warming? Would you say [READ EACH ITEM DO NOT ACCEPT RESPONSE UNTIL ALL ITEMS HAVE BEEN READ.] No effort, or 11% A small-scale effort, even if it has small economic costs, or 21 A medium-scale effort, even if it has moderate economic costs, or 35 A large-scale effort, even if it has large economic costs 30 Not sure 3 Refused --
33 Climate Change in the Ohioan Mind Over the past 12 months, how many times have you done each of the following never, once, two or three times, four or five times, or six or more times? Your best estimate is fine, and if you re not sure, just let me know. [READ EACH ITEM. REPEAT SCALE AS NECESSARY.] Never Once 2-3 times 4-5 times 6 or more times Not sure REF Rewarded companies that are taking steps to reduce global warming by buying their products Punished companies that are opposing steps to reduce global warming by NOT buying their products 42% 6% 18% 6% 11% 17% --% Over the next 12 months, would you like to punish companies that are opposing steps to reduce global warming by NOT buying their products [READ EACH ITEM DO NOT ACCEPT RESPONSE UNTIL ALL ITEMS HAVE BEEN READ.] More frequently than you do now, or 30% Less frequently than you do now, or 9 About the same as you do now 56 Not sure 5 Refused Over the next 12 months, do you intend to buy the products of companies that are taking steps to reduce global warming [READ EACH ITEM DO NOT ACCEPT RESPONSE UNTIL ALL ITEMS HAVE BEEN READ.] More frequently than you do now, or 38% Less frequently than you do now, or 5 About the same as you do now 54 Not sure 3 Refused --
34 Climate Change in the Ohioan Mind Over the past 12 months, how many times have you done the following never, once, two or three times, four or five times, or six or more times? Your best estimate is fine, and if you re not sure, just let me know. [READ EACH ITEM. REPEAT SCALE AS NECESSARY.] Never Once 2-3 times 4-5 times 6 or more times Not sure REF [A] Volunteered with or donated money to an organization working to reduce global warming [B] Written letters, ed, or phoned government officials about global warming 73% 9% 8% 3% 4% 2% 0% [ASK RESPONDENTS WHO HAVE CONTACTED A GOVERNMENT OFFICIAL AT LEAST ONCE (Q35B=2,3,4 OR 5); n=100] 36. When you contacted a government official did you [READ EACH ITEM DO NOT ACCEPT RESPONSE UNTIL ALL ITEMS HAVE BEEN READ.] Urge them to take action to reduce global warming, or 82% Urge them NOT to take action to reduce global warming, or 9 Something else? (Please specify) 9 Not sure -- Refused --
35 Climate Change in the Ohioan Mind Over the next 12 months, would you like to do each of the following less often, more often, or about as often as you do now? [READ EACH ITEM. REPEAT SCALE AS NECESSARY.] Less often About the same More often NS REF [A] Volunteer with or donate money to an organization working to reduce global warming [B] Write letters, , or phone government officials about global warming 17% 57% 25% 1% --% [ASK RESPONDENTS WHO WOULD LIKE TO CONTACT GOVERNMENT OFFICIALS OVER THE NEXT YEAR WITH AT LEAST THE SAME FREQUENCY AS IN THE PAST (Q37B=2 OR 3); n=636] 38. If you were to contact government officials about global warming, would you [READ EACH ITEM DO NOT ACCEPT RESPONSE UNTIL ALL ITEMS HAVE BEEN READ.] Urge them to take action to reduce global warming, or 65% Urge them NOT to take action to reduce global warming, or 10 Something else? (Please specify) 16 Not sure 8 Refused --
36 Climate Change in the Ohioan Mind Please tell me whether you strongly oppose, somewhat oppose, somewhat support, or strongly support each of the following. First [READ EACH ITEM. REPEAT SCALE AS NECESSARY.] Strongly oppose Somewhat oppose Somewhat support Strongly support NS REF Provide tax rebates for people who purchase energy-efficient vehicles or solar panels Require electric utilities to produce at least 20% of their electricity from wind, solar, or other renewable energy sources, even if it costs the average household an extra $100 a year 11% 8% 34% 44% 3% --% Fracking is a way to extract natural gas from shale rock deep underground. Based on anything you may have heard or read about fracking, do you [READ EACH ITEM] Strongly oppose fracking 18% Somewhat oppose it 7 I m undecided 45 Somewhat support it 13 Strongly support it 13 [DO NOT READ] Don t know 4 [DO NOT READ] Prefer not to answer --
37 Climate Change in the Ohioan Mind If Ohio were to switch from fossil fuels like coal and oil to clean energy sources like solar and wind, do you think it would [READ EACH ITEM. DO NOT ACCEPT AN ANSWER UNTIL BOTH ITEMS ARE READ.] Increase economic growth and the number of jobs in Ohio 43% Have no effect on the economic growth and number of jobs in Ohio 17 Decrease economic growth and the number of jobs in Ohio 26 [DO NOT READ] Don t know 14 [DO NOT READ] Prefer not to answer -- [IF 41=1,2, OR 3, ASK; n=687] 42. How strongly do you agree with the statement that switching from fossil fuels to clean energy sources would [INSERT STATEMENT FROM Q41]? Do you strongly agree, moderately agree, slightly agree, or do you not agree with the statement at all? Strongly agree Moderately agree Slightly agree Agree not at all Not sure Prefer not to answer 42%
38 Climate Change in the Ohioan Mind As you know, sometimes different people speak out on public policy issues. Please tell me how believable you would find each of the following people regarding the energy and climate related issues we have been discussing - Very believable, somewhat believable, not very believable, or not at all believable. If you are not familiar with one of these individuals please just say so and we will move on. [READ EACH ITEM.] Very believable Somebelievable Not very believable Not at all believable NS REF President Obama 21% 36% 13% 20% 10% --% Governor John Kasich U.S. Senator Rob Portman U.S. Senator Sherrod Brown How often do you watch or listen to the following shows or visit their websites Often, sometimes, hardly ever, or never. [READ EACH ITEM] [RANDOMIZE] Never Hardly ever Sometim es Often NS REF The Daily Show with Jon Stewart The Colbert Report with Stephen Colbert National Public Radio, or NPR Public Broadcasting Service, or PBS The Fox News Cable Channel 62% 11% 15% 11% 1% --% The New York Times Rush Limbaugh CNN The national nightly network news on CBS, ABC, or NBC MSNBC
39 Climate Change in the Ohioan Mind 38 Appendix III: Survey Method The data in this report are based on a statewide representative survey of 800 Ohio adults, age 18 and older, conducted July 3 10, All interviews were administered by telephone. To help ensure representativeness of the final sample, the survey was administered to respondents reached on traditional landline telephones (70%; n=560) as well as to those reached on cellphones (30%; n=240). Respondents within each household were selected using the next/last birthday selection method. If the selected person was not at home during the initial contact, he or she was called back and interviewed at a convenient time. The average margin of error for the total sample +/- 3 percentage points at the 95% confidence level. The survey was conducted for YPCCC by Abt SRBI using random digit dial sample supplied by Survey Sampling International. Rounding error For tabulation purposes, percentage points are rounded off to the nearest whole number. As a result, percentages in a given chart may total slightly higher or lower than 100%.
40 Climate Change in the Ohioan Mind 39 Appendix IV: Sample Demographics N % Total (unweighted) (weighted) Sex Men Women or older Refused 12 1 Less than high school 59 8 High school graduate Technical/Trade school 19 3 Some college College graduate Some graduate school 19 2 Graduate degree Refused 5 1 Under $10, $10,000 to under $20, $20,000 to under $30, $30,000 to under $40, $40,000 to under $50, $50,000 to under $75, $75,000 to under $100, $100,000 to under $150, $150,000 or more 44 5 (VOL) Don't know 33 6 (VOL) Refused 78 8 Yes 16 3 White, Caucasian (non-hispanic) Black, African-American (non-hispanic) Other/Not sure/refused 58 6

41
climate change in the columbus, ohioan mind CLIMATE
 climate change in the columbus, ohioan mind CLIMATE Climate Change in the Columbus, Ohioan Mind 1 Table of Contents Introduction... 2 Executive Summary... 4 Key Findings... 6 Beliefs and attitudes...6
public support for climate and energy policies in september 2012
 public support for climate and energy policies in september Public Support for Climate and Energy Policies in ember 1 This report is based on findings from a nationally representative survey Climate Change
politics & global warming December 2018
 politics & global warming December 2018 Politics & Global Warming, December 2018 1 Table of tents Introduction...2 Reading Notes...3 Executive Summary...4 1. The Politics of Global Warming Beliefs...7
politics & global warming, may 2017
 politics & global warming, may 2017 Politics & Global Warming, May 2017 1 Table of tents Introduction... 2 Reading Notes... 3 Key Findings... 4 1. The Politics of Global Warming Beliefs... 7 2. Should
politics & global warming, october 2017
 politics & global warming, october 2017 Politics & Global Warming, October 2017 1 Table of tents Introduction... 2 Reading Notes... 3 Executive Summary... 4 1. The Politics of Global Warming Beliefs...
public support for climate and energy policies in may 2011
 public support for climate and energy policies in may 2011 Climate Change in the American Mind: Public Support for Climate & Energy Policies in May 2011 Interview dates: April 23, 2011 May 12, 2011 Interviews:
climate change in the american mind October 2017
 climate change in the american mind ober Climate Change in the American Mind: ober 1 Table of Contents Introduction... 2 Executive Summary... 3 1. Global Warming Beliefs... 5 2. Emotional Responses to
ENERGY, WATER AND CLEAN AIR: WHAT KIND OF LEADERSHIP DO AMERICANS WANT?
 ENERGY, WATER AND CLEAN AIR: WHAT KIND OF LEADERSHIP DO AMERICANS WANT? Conducted for Civil Society Institute & Environmental Working Group January 10, 2013 Table of Contents Page Methodology. 3 Executive
9/19/2015. Simple clear messages, repeated often, by a variety of trusted voices. My guiding principle for spreading ideas:
 My guiding principle for spreading ideas: Communicating Effectively About Change & Health Simple clear messages, repeated often, by a variety of trusted voices. & Health Summit: Creating Health Leaders
American Climate Metrics Survey New York City
 American Climate Metrics Survey 2018 New York City BELIEF AND AWARENESS New Yorkers believe humans have a role in climate change and are personally concerned. American Climate Metrics Survey 2018 New York
American Climate Metrics Survey: New York 2018
 New York City Tops the Charts in Understanding Climate Facts The American Climate Metrics Survey found that New Yorkers report strong concern about climate change, but remain hopeful, and feel strong senses
OREGON ELECTRICITY SURVEY
 OREGON ELECTRICITY SURVEY by Stephen M. Johnson, Ph.D., Associate Director with the assistance of Kimberlee Langolf January 1999 OREGON SURVEY RESEARCH LABORATORY UNIVERSITY OF OREGON EUGENE OR 97403-5245
Survey of Pennsylvanians on the Issue of Global Warming KEY FINDINGS REPORT
 The Morning Call/ Muhlenberg College Institute of Public Opinion Survey of Pennsylvanians on the Issue of Global Warming KEY FINDINGS REPORT Release Date June 7, 2007 KEY FINDINGS: 1. As the issue of global
3. Gender. DNR = Volunteered response * indicates responses totaled 0.4% or less
 1. Form 3. Gender A 50% B 50 Male 49% Female 51 2. Region 4. Phone use King County 30% North Puget 18 Western Washington 30 Eastern Washington 22 Wireless only 24% Dual use 63 Landline only 12 No answer
A National Survey Of News Directors About Climate Change: Preliminary Findings
 A National Survey Of News Directors About Climate Change: Preliminary Findings June 30, 2010 Lead Investigators: Edward Maibach, MPH, PhD Center for Climate Change Communication George Mason University
Barometer. Findings in the United States. A research report prepared for:
 2011 Global Customer Service Barometer Findings in the United States A research report prepared for: Research Method This research was completed online among a random sample of consumers aged 18+. A total
Washington Post-ABC News Poll: Environment Trends The Washington Post Friday, April 20, 2007
 Hello jliuchicago Edit Profile Sign Out PRINT EDITION Subscribe to SEARCH: News Top 20 E-mailed Articles washingtonpost.com > Nation > Science Washington Post-ABC News Poll: Environment Trends The Washington
A PLEASE CONSIDER YOUR FEELINGS ABOUT "GLOBAL WARMING."
 American Opinions of Global Warming 1. Have you ever heard of global warming? (Skip to question 37 on page 10) A PLEASE CONSIDER YOUR FEELINGS ABOUT "GLOBAL WARMING." 2. Do you have any negative feelings
PUBLIC OPINION AND THE ENVIRONMENT: THE NINE TYPES OF AMERICANS
 Issue Brief PUBLIC OPINION AND THE ENVIRONMENT: THE NINE TYPES OF AMERICANS Contrary to common rhetoric, the American public is not simply polarized into pro- and anti-environment groups, according to
B I S C O N T I R E S E A R C H, I NC.
 B I S C O N T I R E S E A R C H, I NC. New Findings: US Public Opinion about Nuclear Energy www.bisconti.com 301-657-5556 Press Release 64 Percent Favor Nuclear Energy, October 2017 Contact Dr. Ann S.
FRACKING AND CLEAN WATER: A SURVEY OF PENNSYLVANIA RESIDENTS. A Survey Conducted for the Civil Society Institute
 FRACKING AND CLEAN WATER: A SURVEY OF PENNSYLVANIA RESIDENTS A Survey Conducted for the Civil Society Institute December 21, 2010 Methodology The survey was conducted November 26-30, 2010 among a sample
HOW CLIMATE CHANGE AFFECTS ASTHMA. and what you can do about it
 HOW CLIMATE CHANGE AFFECTS ASTHMA and what you can do about it Climate change IS REAL. AND it is DANGEROUS. Climate change is causing more wildfires and more extreme storms. It is also harming our health.
Public Attitudes About New Coal-Fired Power Plants in Indiana
 Copyright 2008. Opinion Research Corporation. All rights reserved. Public Attitudes About New Coal-Fired Power Plants in Indiana A Survey of Indiana Adults Prepared for The Civil Society Institute (CSI)
R e l e a s e # Sarah Henry, N e x t 10, (650)
") THE FIELD POLL CO P Y R I G H T 2 0 0 7 BY FI E L D RE S E A R C H CO R P O R A T I O N. R e l e a s e # 2 2 5 0 Embargoed for Publication: Contacts: Mark DiCamillo, The Field Poll, (415) 392-5763 Sarah
THE FIELD POLL CO P Y R I G H T 2 0 0 7 BY FI E L D RE S E A R C H CO R P O R A T I O N. R e l e a s e # 2 2 5 0 Embargoed for Publication: Contacts: Mark DiCamillo, The Field Poll, (415) 392-5763 Sarah
meeting the challenge
 meeting the challenge WORKBOOK Please return this workbook in the envelope provided by April 25, 2007. This workbook is also available online at www.alberta.ca. setting the stage Fossil fuels play an important
Sierra Club National Survey on Coal, Climate and Carbon Pollution Key Findings
 Sierra Club National Survey on Coal, Climate and Carbon Pollution Key Findings February 4, 2014 Methodology These findings are based on a national survey of 1,000 registered voters, conducted by Greenberg
THE PIPA/KNOWLEDGE NETWORKS POLL.
 THE PIPA/KNOWLEDGE NETWORKS POLL. THE AMERICAN PUBLIC ON INTERNATIONAL ISSUES PIPA-Knowledge Networks Poll: Americans on Climate Change Questionnaire Dates of Survey: June 8 14, 2004 Sample Size: 753 Margin
Harris County Flood Control District Bond Election Survey
 Harris County Flood Control District Bond Election Survey Figure 1. This August, Harris County voters will be asked to approve a 2.5 billion dollar bond to fund flood risk reduction projects throughout
2014 BOULDER COUNTY ISSUES SURVEY
 2014 BOULDER COUNTY ISSUES SURVEY Hello, my name is. First, I want to assure you that we're not selling anything, or asking for money. I'm with Talmey-Drake Research, a public opinion research company
Demographics. Likely November Voters 600. Men 48% Women 52% Democrats 33% Independent/Other 42% Republican 25% % %
 Demographics Gender Party Affiliation Likely November Voters 600 Democrats 52% 48% Men Women Men 48% Women 52% 25% 42% 33% Independent/Other Republican Age Democrats 33% Independent/Other 42% Republican
Americans and Energy Policy: The Myth of the Partisan Divide. A Survey for the Civil Society Institute April 25, 2012
 Americans and Energy Policy: The Myth of the Partisan Divide A Survey for the Civil Society Institute April 25, 2012 Table of Contents Page Methodology. 3 Executive Summary.... 4 Detailed Findings......
MIT Carbon Sequestration Initiative
 Question 1: Consider the following issues. What are the three most important issues facing the US today? [Note the graph does not include issues with less than five percent support.] Economy Health care
Survey questionnaire and topline
 Survey questionnaire and topline PEW RESEARCH CENTER S AMERICAN TRENDS PANEL WAVE 17 May FINAL TOPLINE May 10 June 6, FORM 3 N=1,534 ASK ALL FORMS [N=4,563]: TALK Thinking about conversations you have
I. Survey Methodology
 I. Survey Methodology The Elon University Poll is conducted using a stratified random sample of households with telephones and wireless telephone numbers in the population of interest in this case, citizens
Public Opinion & Environmental Policy in the Commonwealth
 April 5, 2017 Public Opinion & Environmental Policy in the Commonwealth Views of Virginia Voters in 2017 Dr. Quentin Kidd, Director e-mail qkidd@cnu.edu O: (757) 594-8499 Wason Center for Public Policy
Center for Western Priorities/Resources Legacy Fund Montana Public Lands Survey June 2016
 Center for Western Priorities/Resources Legacy Fund Montana Public Lands Survey June 2016 METHODOLOGY Purple Insights conducted 600 telephone interviews of likely 2016 voters in Montana, between June 11th
DAVE METZ & LORI WEIGEL
 Key Findings from Qualitative Research and a Statewide Voter Survey March 2016 DAVE METZ & LORI WEIGEL 220-4328/230-571 Research Methodology 801 telephone interviews with registered New York voters likely
Key Findings From a Statewide Voter Survey Conducted September 1-8,
 Key Findings From a Statewide Voter Survey Conducted September 1-8, 2016 220-4638 Research Methodology 503 interviews with Montana voters likely to participate in the November 2016 election Conducted September
Is the Public Willing to Pay to Help Fix Climate Change?
 Is the Public Willing to Pay to Help Fix Climate Change? Conducted by The Associated Press-NORC Center for Public Affairs Research With funding from The Energy Policy Institute at the University of Chicago
PPIC Statewide Survey: Californians and the Environment
 PPIC Statewide Survey: Californians and the Environment July 28, 16 Mark Baldassare, Dean Bonner, David Kordus, Lunna Lopes Supported with funding from The Dirk and Charlene Kabcenell Foundation, the Heising-Simons
Americans Views On The President s Climate And Carbon Pollution Plan
 Americans Views On The President s Climate And Carbon Pollution Plan Key findings from nationwide survey among 808 registered voters reached on landline and cell phones July 1 7, 2013 for Margin of error
Water Conservation Quantitative Research Report Summary
 Water Conservation Quantitative Research Report Summary Report Summary Contents Executive Summary 1 Conclusions 2 Research Objectives 2 Research Methodology 2 Detailed Findings: 2 Opinions About Amount
TAMPA BAY WATER Public Opinion Survey. kerr&downs R E S E A R C H. Supplying Water To The Region
 TAMPA BAY WATER Supplying Water To The Region 2015 Public Opinion Survey kerr&downs R E S E A R C H TAMPA BAY WATER Supplying Water To The Region 2015 Public Opinion Survey Project Directors: Phillip
CLIMATE CHANGE. On many issues, public opinion is so. What Americans Think about
 What Americans Think about CLIMATE CHANGE Polling Americans about climate change reveals a largely united desire for government action and other surprises. Jon A. Krosnick, Nuri Kim, and Bo MacInnis report.
Copyright 2019 January 9-22, AZ Interviews Sierra Club Multi-State RV Survey - Arizona
 Copyright 2019 January 9-22, 2019 615 AZ Interviews Sierra Club Multi-State RV Survey - Arizona 01.19 19085 B1. You will now see the names of several organizations, people, and policies. Please indicate
CTECIntelligence. America s Biggest Employer. Voters believe that technology is the industry that will create the most jobs over the next 10 years
 CTECIntelligence 25 M the number of new American jobs technology will create over the next 15 years $11.1 T the total economic impact of the Internet of Things by 2020 67% potential increase in global
NUS Insight: Students and climate change
 NUS Insight: Students and climate change Attitudes towards climate change Since April 2014, the National Union of Students (NUS) has been tracking students attitudes towards climate change. Surveys have
Public Opinion on Wind Energy in Alberta and Ontario
 Online Survey Report Public Opinion on Wind Energy in Alberta and Ontario Canadian Wind Energy Association (CanWEA) 1600 Carling Avenue, Suite 710 Ottawa, ON K1Z 1G3 February 2018 Available at www.canwea.ca
Customer Support For SmartGrid / Smart Meter Investments
 Customer Support For SmartGrid / Smart Meter Investments February 2011 David C. Lineweber, Ph.D. Managing Partner 601 SW Oak Street, Portland, OR 97205 503.575.7630, ext. 802 David.Lineweber@yougov.com
1 PEW RESEARCH CENTER
 1 Methodology The analysis in this report is based on telephone interviews conducted Jan. 8-Feb. 7, 2019, among a national sample of 1,502 adults, 18 years of age or older, living in all 50 U.S. states
WIND FARM OPINION POLL. Conducted 11th 13th May 2015
 WIND FARM OPINION POLL Conducted 11th 13th May 2015 Abstract An insight into opinions regarding renewable energy and the environment in the Bournemouth area, and the feasibility of the Navitus Bay Wind
Home Composter Bin User Study
 Home Composter Bin User Study Data Tables MarketLine Research SM, Inc. December 2002 Report questions may be directed to: Dave Bender 612.767.2583 Dbender@mktline.com MarketLine Research is located at:
Communicating with the Public about Climate Change: Understanding Global Warming s Six Americas
 Communicating with the Public about Climate Change: Understanding Global Warming s Six Americas Ohio Sea Grant Webinar November 8, 2012 Teresa Myers, PhD tmyers6@gmu.edu Identify your Audience Meet Global
NEW HAMPSHIRE OCTOBER TOPLINES
 NEW HAMPSHIRE OCTOBER TOPLINES Area Code: West/North ------------------------------------------------------- 108 21.60 Central ------------------------------------------------------------ 128 25.60 Rockingham
Environment America, The Natural Resources Defense Council, Sierra Club, & Union of Concerned Scientists
 TO: FROM: RE: Environment America, The Natural Resources Defense Council, Sierra Club, & Union of Concerned Scientists The Mellman Group, Inc. Voters Overwhelmingly Support Stricter Fuel Efficiency Standards
Skip a Week Campaign Pre- and Post-Advertising Study
 2010 - and -Advertising Study 2010 - and -Advertising Study Project Directors: Phillip E. Downs, Ph.D. Joey St. Germain, Ph.D. Jennifer Burnside Kerr & Downs Research 2992 Habersham Dr Tallahassee, FL
Q. 1. Generally speaking, would you say that your community is going in the right direction, or has it gotten off onto the wrong track?
 2011 NORTH CAROLINA STATEWIDE SURVEY 4/27 4/29/2011 N=800, +/- 3.46% General Election Voters (percentages may not add up to 100% due to rounding) www.fallonresearch.com Q. 1. Generally speaking, would
Topline questionnaire
 22 Topline questionnaire S AMERICAN TRENDS PANEL WAVE 13 DECEMBER FINAL TOPLINE November 24 December 21, TOTAL WEB RESPONDENTS N=4,317 MAIL RESPONDENTS N=470 SHOP1. Thinking about your general shopping
Wikimedia Survey Findings
 Wikimedia Survey Findings By David Mermin, Celinda Lake, and Liesl Newton Washington, DC Berkeley, CA New York, NY LakeResearch.com Methodology Survey conducted from October 30-November 3, 2015. Online
Survey on EPA Carbon Regulations in 9 Senate Battleground States
 Survey on EPA Carbon Regulations in 9 Senate Battleground States 806 Voters across AR, AK, CO, IA, LA, MI, NH, NC and VA Two-thirds of voters favor an EPA plan to address climate change that aims to reduce
VICTORIANS PERCEPTIONS OF CLIMATE CHANGE
 VICTORIANS PERCEPTIONS OF CLIMATE CHANGE KEY FINDINGS SOCIAL RESEARCH ON CLIMATE CHANGE ATTITUDES AND BEHAVIOURS Background & Methodology Background & Aims Sustainability Victoria (SV) engaged an external
Conservative Voters in Ohio Overwhelmingly Support Clean Energy Policies and Ask GOP Candidates To Do So
 TO: FROM: RE: Interested Parties Lori Weigel, Public Opinion Strategies Conservative Voters in Ohio Overwhelmingly Support Clean Energy Policies and Ask GOP Candidates To Do So DATE: September 16, 2016
Spotlight on Low Income Consumers Final Report
 Spotlight on Low Income Consumers Final Report September 18, 2012 2011 2012 Smart grid Consumer Collaborative. All Rights Reserved. Spotlight on Low IncomE Consumers, SEPTEMBER 2012 Table of Contents Background
Princeton Survey Research Associates International for The National Hydropower Association. Final Topline Results January 13, 2014
 Total: 1,006 adults age 18 and older Margin of error: Plus or minus 3.5 percentage points Interviewing dates: January 9-12, 2014 Princeton Survey Research Associates International for The National Hydropower
Energy Literacy Survey
 Note: questions have been updated in September 2013 with most recent data available from the U.S. Energy Information Administration. Energy Literacy Survey A Broad Assessment of Energy-related Knowledge,
Sierra Club National Survey on Coal, Climate and Carbon Pollution Key Findings
 Sierra Club National Survey on Coal, Climate and Carbon Pollution Key Findings February 4, 2014 Methodology These findings are based on a national survey of 1,000 registered voters, conducted by Greenberg
Van Buren County Recreation Plan Meeting Page Growing Greener in Southwest Michigan Overview and Significant Findings
 Van Buren County Recreation Plan 02.26 Meeting Page 1 Growing Greener in SW Michigan - OVERVIEW Survey Goals The overall Growing Greener in Southwest Michigan Goal is to develop a regional green infrastructure
MIT Carbon Sequestration Initiative
 Question 1: Consider the following issues. What are the three most important issues facing the US today? [2006 survey included Iraq war, Fuel/oil prices, Illegal immigrants, and Quality of government leaders
Skagit Climate Science Consortium (SC 2 ) and Global Warming Polling in Skagit County. Key findings
 and Global Warming Polling in Skagit County. Key findings") Skagit Climate Science Consortium (SC 2 ) and Global Warming Polling in Skagit County Key findings Carol Macilroy Skagit Council of Governments January 20, 2016 Today Brief background on SC 2 Skagit County
Skagit Climate Science Consortium (SC 2 ) and Global Warming Polling in Skagit County Key findings Carol Macilroy Skagit Council of Governments January 20, 2016 Today Brief background on SC 2 Skagit County
SEA Polling & Strategic Design Page 1 March Greater Tampa Chamber of Commerce n = 400 Hillsborough County
 SEA Polling & Strategic Design Page 1 March 28-31 2016 Rec# Phone # Page# of [1-4] [5-14] Int Name Emp# Date / /12 Seat # [5-18] [19-22] Hello, my name is (first & last name) from SE&A Research. We are
Santa Fe Water Source Protection Fund Laura McCarthy, New Mexico Field Office
 Santa Fe Water Source Protection Fund Laura McCarthy, New Mexico Field Office Cerro Grande Fire: too close for comfort Federally Funded Forest Restoration Federally Funded Forest Restoration How to Maintain
TRCP Sportsmen National Survey
 TRCP Sportsmen National Survey National survey of 1,000 hunters and anglers March 2018 #18119 Methodology Public Opinion Strategies conducted a survey of N =1,000 sportsmen throughout the United States
CHINA ENERGY UTILIZATION QUESTIONNAIRE FORM NONGRID HOUSEHOLD SURVEY 1
 CHINA ENERGY UTILIZATION QUESTIONNAIRE FORM NONGRID HOUSEHOLD SURVEY 1 HOUSEHOLD SURVEY FORM Household ID no.: Date of interview: Time start: Time end: Interviewer s name: Supervisor s name: HOUSEHOLD
THE ECONOMIST ENERGY SURVEY
 December 2015 THE ECONOMIST ENERGY SURVEY Attitudes and Opinions of Readers and Non-Readers INSIGHTS FROM BOTH READERS AND NON-READERS 2 1,001 global Economist Insighters (readers) 550 non-reader Economist
POLLING RESULTS (all results mentioned here are for total polled-unless specified)
") POLLING RESULTS (all results mentioned here are for total polled-unless specified) Polling details Number Percentage Total polled 1007 100% Males: 494 49% Females: 513 51% Ages: 18-24: 112 11% 25-34: 193
POLLING RESULTS (all results mentioned here are for total polled-unless specified) Polling details Number Percentage Total polled 1007 100% Males: 494 49% Females: 513 51% Ages: 18-24: 112 11% 25-34: 193
WBUR Poll Survey of 504 Registered Voters in Massachusetts Field Dates: March 16-18, 2018
 Conducted for WBUR by WBUR Poll Survey of 504 Registered Voters in Massachusetts Field Dates: March 16-18, 2018 I'm going to read you the names of several people and organizations who are active in public
2018 Chittenden County Stormwater Awareness Study
 2018 Chittenden County Stormwater Awareness Study Prepared for Chittenden County Regional Planning Commission by the Castleton Polling Institute Castleton College 6 Alumni Drive Castleton, Vermont 05735
BY Cary Funk and Brian Kennedy 1 PEW RESEARCH CENTER. FOR RELEASE MAY 16, 2017 FOR MEDIA OR OTHER INQUIRIES:
 1 FOR RELEASE MAY 16, BY Cary Funk and Brian Kennedy FOR MEDIA OR OTHER INQUIRIES: Lee Rainie, Director, Internet, Science and Technology Research Cary Funk, Associate Director, Research Dana Page, Senior
GLOBAL WARMING. Impacts, Solutions, Actions
 GLOBAL WARMING Impacts, Solutions, Actions Bob Martinka Why Audubon? Global warming poses the greatest threat to biological diversity in human history. Photo: Bob Martinka At Risk At Risk Bob Martinka
Suffolk University/USA Today FINAL April 8-13, 2015
 Region: Northeast ---------------------------------------------------------- 206 20.60 South --------------------------------------------------------------- 335 33.50 Midwest ------------------------------------------------------------
SUMMARY REPORT. Results of a Fall 2007 Survey of Cornell Undergraduate Students
 CORNELL UNDERGRADUATES ATTITUDES TOWARD CARBON NEUTRALITY SUMMARY REPORT Results of a Fall 2007 Survey of Cornell Undergraduate Students Principal Investigator: Dr. Katherine A. McComas, Department of
Report to. Traverse City Light & Power. for Customer Research
 Report to Traverse City Light & Power for 2012 Customer Research Submitted by: Dr. Cathlyn Sommerfield Research Services - Northwestern Michigan College September 2012 TABLE OF CONTENTS Section Page EXECUTIVE
QUANTIFYING THE BUSINESS IMPACT OF CUSTOMER SERVICE
 December 2018 Sponsored by Introduction Irritating issues affect customers daily. In every industry a customer will inevitably contact customer service to voice a problem. I ve bought your product but
ENTERTAINMENT HABITS SURVEY RESULTS MAY 2007
 ENTERTAINMENT HABITS SURVEY RESULTS MAY 27 MEDIA CONTACT: Ms. Patch Canada pcanada@goldstarevents.com 73 727 4439 27 Copyright www.goldstarevents.com Goldstar Events, Inc. TM The survey was conducted through
Spring Change Assessment Survey 2010 Final Topline 6/4/10 Data for April 29 May 30, 2010
 Spring Change Assessment Survey 2010 Final Topline 6/4/10 Data for April 29 May 30, 2010 for the Pew Research Center s Internet & American Life Project Sample: n= 2,252 national adults, age 18 and older,
Sample: n=2,252 people age 16 or older nationwide, including 1,125 cell phone interviews Interviewing dates:
 Survey questions Library Services Survey Final Topline 11/14/2012 Data for October 15 November 10, 2012 Princeton Survey Research Associates International for the Pew Research Center s Internet & American
FINAL COLORADO OCTOBER TOPLINES
 FINAL COLORADO OCTOBER TOPLINES Area Code: Denver / Boulder ------------------------------------------------- 129 25.80 Jefferson / Arapahoe ------------------------------------------- 177 35.40 West ------------------------------------------------------------------
SEPTEMBER 18-22, 2014 NEW YORK ENERGY ISSUES SURVEY WT N=802 MARGIN OF SAMPLING ERROR ±4.0% (95% CONFIDENCE INTERVAL) A/B SPLITS
 A/B SPLITS") SEPTEMBER 18-22, 2014 NEW YORK ENERGY ISSUES SURVEY 220-3959-WT N=802 MARGIN OF SAMPLING ERROR ±4.0% (95% CONFIDENCE INTERVAL) A/B SPLITS Hello, I'm from FM3, a public opinion research company. We're conducting
SEPTEMBER 18-22, 2014 NEW YORK ENERGY ISSUES SURVEY 220-3959-WT N=802 MARGIN OF SAMPLING ERROR ±4.0% (95% CONFIDENCE INTERVAL) A/B SPLITS Hello, I'm from FM3, a public opinion research company. We're conducting
Climate Matters in the Newsroom: Society of Environmental Journalists Member Survey, March 2018
 Climate Matters in the Newsroom: Society of Environmental Journalists Member Survey, 2018 March 2018 Edward W. Maibach, Richard T. Craig, William A. Yagatich, Joshua Murphy, Shaelyn M. Patzer, and Kristin
Orange County Voters and Conservation
 Orange County Voters June 2005 120-014 Santa Monica, CA Oakland, CA Madison, WI Mexico City Methodology 600 interviews with registered voters likely to cast ballots in November 2006 Interviews conducted
Consumer Pulse and Market Segmentation Study Wave 5
 Consumer Pulse and Market Segmentation Study Wave 5 Consumer Pulse and Market Segmentation Study Wave 5 Table of Contents Executive Summary... 4 Residential Consumer Segments... 6 Consumer Knowledge of,
Broad Concern about Global Warming Boosts Support for New EPA Regulations
 ABC NEWS/WASHINGTON POST POLL: Global Warming/Greenhouse Gases EMBARGOED FOR RELEASE AFTER 1 p.m. Monday, June 2, 2014 Broad Concern about Global Warming Boosts Support for New EPA Regulations Seven in
Civic Satisfaction & Performance Survey 2018 Telephone and Online Panel
 Civic Satisfaction & Performance Survey 2018 and Panel June/July 2018 Table of Contents PURPOSE... 2 EXECUTIVE SUMMARY... 3 Satisfaction/Quality of Life... 4 Most Important Issues... 4 Perceived Value
American Lung Association Frequency Questionnaire
 American Lung Association Frequency Questionnaire February 7-14, 2011 1021 Likely Voters Q.3 First of all, are you registered to vote? Yes... 100 No...- Don't know/refused...- (ref:screen1) Q.6 Many people
Massachusetts Support for Cape Wind, State Clean Energy Leadership
 Copyright 2006. Opinion Research Corporation. All rights reserved. Massachusetts Support for Cape Wind, State Clean Energy Leadership Prepared for Civil Society Institute (CSI) Prepared by March 6, 2008
The Kyoto Protocol. Pre-Reading. A. Warm-Up Questions. B. Vocabulary Preview. Mini-Debates. 1. Do you usually use public transit or drive a car?
 The Kyoto Protocol Pre-Reading A. Warm-Up Questions 1. Do you usually use public transit or drive a car? 2. What is global warming? Do you know what causes global warming? 3. Why is global warming a problem?
CAP Western States Survey Interview Schedule
 CAP Western States Survey Interview Schedule Field Dates: September 10 14 Public Opinion Strategies/FM3 Margin of Error: +2.54% overall N=200 per state: NM, CO, MT, UT, ID, NV, WY and OR * Denotes result
Readiness Activity. (An activity to be done before viewing the video)
") KNOWLEDGE UNLIMITED NEWS Matters Global Warming: Hot Enough for You? Vol. 3 No. 5 About NEWSMatters Global Warming: Hot Enough for You? is one in a series of six NewsMatters programs for the 1999-2000
KNOWLEDGE UNLIMITED NEWS Matters Global Warming: Hot Enough for You? Vol. 3 No. 5 About NEWSMatters Global Warming: Hot Enough for You? is one in a series of six NewsMatters programs for the 1999-2000
Appendix B: Voting Frequency Survey Weighted Topline
 Screener Appendix B: Voting Frequency Survey Weighted Topline Citizen [S] N=3763 (100%) Are you a citizen of the United States? 1 Yes 3763 (100%) 2 No qualified Reg. [S] N=3763 (100%) Many people are not
Green Energy Act, 2009 Survey
 Green Energy Act, 2009 Survey Presented to: The Green Energy Act Alliance April 2009 Table of Contents Section Slide Methodology 3 Key Findings 4 Ontario-Wide Results 7 Essex County Results 13 Scarborough