Water Management and Conservation Plan Final Draft
|
|
|
- Barnaby Greer
- 6 years ago
- Views:
Transcription


1 Water Management and Conservation Plan Final Draft Prepared for: City of Silverton 306 S. Water St. Silverton, OR January 2016 Prepared by: Oregon Association of Water Utilities
2 Table of Contents Section Page Section One: Water Supplier Description Introduction.. 1 Scope.. 2 Purpose Sources of Water Water Diversions Storage Capacities Interconnections / Intergovernmental Agreements Current Service Area (2) Adequacy / Reliability of Existing Source (3) Quantification of Present and Historical Use (4) Water Rights (5) Water Use Characteristics (6) Interconnections (7) Water System Schematic (8) Quantification of Water Leakage (9) 16 Map Distribution System Pipe Material.. 17 Map Figure 4 Priority 1 & 2 Distribution System Improvements 18 Map City of Silverton Comprehension Plan.. 20 Map City of Silverton Water System 21 Map City of Silverton Water System schematic Transmission Lines.. 22 Section Two: Water Conservation Element Progress Report Past WMCP (1) Water Use Measurements and Reporting (2) Measurements Already Implemented (3).. 24
3 Contents Continued: 2.4 Annual Water Audit (4) (a) Full Metering System (4) (b) Meter Testing and Maintenance (4) (c) Rate Structure (4) (d) Leak Detection Program (4) (e) Public Education Program (4) (f) Expansion / Diversion (5) Population Criteria (6) System Leakage (6) (a) Technical /Financial Assistance (6) (b) Financial Retrofitting (6) (c) Rate Structures (6) (d) Recycle / Reuse (6) (e) Other Conservation Measures (6) (f).. 30 City of Silverton Water Rate Structure 31 Section Three: Water Curtailment Elements Assessing Water Supply (1) Stages of Alerts (2) Alert Triggers (3) Curtailment Actions (4). 37 Section Four: Water Supply Element Delineation Current and Future Service Area (1) Population Projections (1) Schedule of Permit Usage (2) Demand Forecast (3) Comparison Future Needs and Sources (4) Expansion / Diversion (5) (a) 44
4 Contents Continued: 4.7 Interconnections (5) (b) Cost Savings Measures (5) (c) Permit Diversion (6) Mitigation Actions (7) New Water Rights (8) Green Light Water Request OAR (7)(a) OAR (7)(b) OAR (7)(c) Identified Conservation Measures (8) (a) Regional Management (8) (b) Cost Appropriations (8) (c) 48 Section Five: Other Items List of Affected Governments (5) Updated Plan Submittal (6) Additional Time (7). 50 Tables, Maps and Charts: Western Regional Climate 30 year average temperature... 1 Table 1-1: Water Rights Correlation Permits / Certificates. 3 Table 1-2: Water Production Rights Relationship.. 5 Table 1-3: Water Volume Delivery 6 Table 1-4: Water Usage Variation Table 1-5: Water Source Permit Table 1-6: Water Usage / Permit.. 8 Table 1-7: Water Right Development / Completion 9 Table 1-8: Endangered Species... 9 Map Molalla Pudding River Watershed 11
5 Contents Continued: Map - Fish Distribution and Habitat Area Pudding River Watershed 12 Map - Spring Chinook Spawning Rearing Migration Areas in Molalla Pudding Sub-basin 13 Map - Winter Steelhead Spawning Rearing Migration Areas in Molalla Pudding Sub-basin 14 Table 1-9: Water Use Characteristics.. 16 Table 1-10: Water / Production Loss Quantification. 19 Table 2-1: Conservation Education Goals. 27 Table 2-2: Water Conservation Activities. 28 Table 3-1: Trigger Levels.. 36 Table 3-2: Action Levels of Curtailment. 38 Table 3-3: Curtailment Goals. 39 Table 4-1: Population Projections..40 Table 4-2: Permit Usage Forecast.. 42 Table 4-3: Water Demand Projections 43 Chart 4-1: Future Water Requirements. 44 Table 4-4: Permit Usage Rates. 45 Map Marion County Rural Zoning.. 49 Appendices Abiqua Creek Watershed Information (Abiqua Creek Watershed) Silver Creek Watershed Information (Silver Creek Watershed) Chinook / Steelhead Critical Habitat Information (Chinook Critical Habitat) Final Order Extension of Time for Permit # S-3226 Certificate of Water Right 2400 Water Right Permit # S-3226 Final Order Extension of Time for Permit # S Water Right Permit # S Water Right Permit # R-5948 (Reservoir) Upper Willamette Chinook ESU Map Page A B C D-I J K-N O-P Q-T U-Y Z
6 Upper Willamette Steelhead DPS Map Public Information Flyer Water Curtailment Alert - Stage 1 Public Information Flyer Water Curtailment Alert - Stage 2 AA BB CC


7 City of Silverton WATER MANAGEMENT CONSERVATION PLAN INTRODUCTION: Situated in the northern east area of the Willamette Valley, the City of Silverton was incorporated in 1885 after approximately 40 years of settlers processing timber and producing power in an upstream area called Milford. By 1894, the population was nearly 900. The young town was a trading and banking center of prominence and ranked among the most progressive towns of western Oregon. 1 One hundred years later, the City of Silverton serves a population of approximately 9,540, and has seen a growth of 26% since Situated in Marion County the county is home to a population of 315,400 as of The United States Census Bureau indicates an increase of 2.6% annually growth from Median household incomes during was $46, Annual rainfall is almost 47 inches, with 50% occurring between October and January. Like many areas of Oregon, the hottest month occurs in August while the coldest month is usually December. The average mean minimum temperature is 43 0 F as the average mean maximum temperature is F. 4 Source: 1- OHA-DWP data online American Community Survey, 3- U.S. Census Bureau, 4 -Western Regional Climate Center / Oregon Climate Services / Oregon State University, Map provided by Western Regional Climate Center. Precipitation legend taken from Natural Resource Conservation Service Report profiling hydrologic unit
8 SCOPE: The scope of this water management and conservation plan is to consider the workings of the water system from various points as it is operated by the City of Silverton. The primary concern is the management of existing water sources; and the sustainability of said sources as they relate to the understanding of the growth in and around the area. Equally important is continuing to supply water to both existing and future customers as well as keep them informed about conservation ideals and methods. Management of the water under continual satisfactory conditions will be an effort for both water system personnel and the community. PURPOSE: The purpose of this water management and conservation plan is to gain a better understanding of the balance of water from the source, through the water system and how it is expended by the customers, meeting OAR requirements and guidelines towards water management and conservation. The City of Silverton does meet the criteria established under OAR (6), serving a population of 9,540 through 3,000 connections. Source Drinking Water Services, Drinking Water Data Online This water management and conservation plan is an initial report submitted to Water Resources Department and is written as a guideline for the City of Silverton s continued efforts towards water conservation. The next update for a water management and conservation plan is in the form of a progress report due in Every five years, the City of Silverton will update Water Resources Department with a progress report on how the benchmarks are being implemented as well as any changes in the efforts of water management and conservation. Following the administrative rules, the city proposes to submit a progress report as key benchmarks are completed and water use progress is established. Progress reports will be written and sent to the Water Resources Department as addendums to this water management and conservation plan. The organization of this document is compiled by Oregon Association of Water Utilities with authorization from the City of Silverton. This water management and conservation plan complies with the Oregon Administrative Rules (OAR) Chapter 690, Division 86.
9 SECTION ONE MUNICIPAL WATER SUPPLIER 1.1 Municipal Water Supplier Description: OAR (1) A description of the supplier's source(s) of water; including diversion, storage and regulation facilities; exchange agreements; intergovernmental cooperation agreements; and water supply or delivery contracts; Sources of water: (Water Permits) The water rights summary is placed in the table below: Table 1-1: Water Right Permit / Certificates Application Number Permit Number Certificate Number Source Beneficial Use Priority Date Permitted CFS MGD Gallons Per Minute S-4924 S-3226 NA Abiqua Creek Municipal 5/24/ A 6.5 4, S-1297 S Silver Creek Municipal, Domestic S S NA Silver Creek Reservoir R R-5948 NA Silver CreekReservioir 3/16/ , Municipal 3/20/ af annually N/A* Municipal 3/20/ af NA NA GR-367 G-353 NA Well 1 Municipal 2/10/ A Water right has Development Limitation at 7.0 cfs * - Limitation of use is set at 200 acre-feet per year 1,300 acre feet (af) annually, calculated at 1.79 CFS 1 Well in database for OWRD. City informed OWRD well has been abandoned per water analysis performed in May 2001, Tetra-Tech/KCM 2 Well production volumes not included in total figures Permits S-3226, S extended completion date of 10/1/2038 Permit R-5948 extended completion date of 10/1/1975 Total (does not include well) ,732 2 Water Source: The City of Silverton; incorporated in 1885, gathers water from both Abiqua and Silver Creeks. This primary source is runoff from the Pudding Watershed, which consist of five large streams flow west out of the Cascade Mountains to join the Pudding River as it meanders north across the broad Willamette Valley and to its confluence with the Molalla River near Canby. The watershed encompasses 528 square miles, much of which is used for farming, timber harvest, manufacturing,andrecreation.
10 Winter precipitation usually falls as rain in the lower elevations of the watershed while a transient snow pack can develop at higher elevations Diversions Abiqua Creek delivers water by gravity to the Water Treatment Plant (WTP), with an intake screen installed in Using Oregon standard slotted openings, the intake screen allows a maximum velocity of 0.4 ft./sec and in theory a flow rate of 6.5 MGD. 1 Passing through the intake, water travels 7 miles of transmission line, varying in size from 20 to 24, with the latest improvements completed in Transmission line capacity is 4.8 mgd. 1- Water Master Plan Keller Associates Silver Creek intake has a capacity of 2.3 MGD with two pumps running and 1.7 MGD with a one single pump operating. Water travels through a 12 inch pipeline, approximately 2,200 feet long to the WTP. The water right associated with this intake is 3.2 MGD, not including the 1,200 acre feet of reservoir storage Storage Capacities The City of Silverton utilizes three reservoirs totaling 4.5 MG, with the largest reservoir located in the southeast quadrant of Silverton with a capacity of 2 million gallons, using electronics to control and measure water levels. Two smaller 1.0 MG and 1.5 MG reservoirs located just east of city center on Ames Street Inter-ties and Inter-Governmental Agreements: The City of Silverton has no interconnections or governmental agreements with any other public and private water systems. In subsection 3.5 of Keller Associates Water Master Plan 2011 for the City of Silverton, a mention of possible future water service to the City of Mt. Angel, but no formal discussions have taken place as of the writing of this management and conservation plan. The City of Silverton is a partner of the Pudding River Watershed Place-based Planning Group, which submitted a grant application to the Oregon Water Resources Department for funding under SB Current Service area: (2); a delineation of the current service areas and an estimate of the population served and a description of the methodology (ies) used to make the estimate; The City of Silverton s water system serves an area approximately 3.50 square miles which includes approximately 3,000 connections and a population of 9, Residential usage accounts for 67 percent, while commercial consumption equals 31 percent. 2 1 Oregon Health Authority Drinking Water Program Data Online Webpage, 2 Taken from Water Master Plan Keller Associates
11 1.3 Adequacy and Reliability of Existing Water: OAR (3) An assessment of the adequacy and reliability of the existing water supply considering potential limitations on continued or expanded use under existing water rights resulting from existing and potential future restrictions on the community's water supply. Current water allowances total 15 cubic feet per second or 6,732 gallons per minute. Based on historical water usage records, the water service area s highest peak daily demand has been approximately 3.02 million gallons per day (mgd). 1 Currently the city is using approximately 22.1 percent of their combined total water rights averaged over the year. 2 Water permit #G- 353 and associated well was abandoned by the City of Silverton, due to water quality concerns. 1, 2, - Figures established from July 2009 through June Table 1-2: Water Production / Rights Relationship: Intake Name Water Right Permit Certified Water Allowance (cfs) Water Allowance (gpm) Actual Usage MG per month 1 Average Usage (cfs) per month % of Total Water Right % of Total Based on Supply Capacity Abiqua Creek S-3226 NA 10.0 A 4, % Silver Creek S , % Well G-353 NA NA NA NA Silver Creek 1,300 af * Reservoir S NA 806 NA NA NA Silver Creek Usage R-5948 NA 0 0 NA NA NA Total ,732 Figures calculated using Silverton annual OWRD reports from October 2009 through September A Water right has Development Limitation at 7.0 cfs, * af development limitation at 200 acre-feet per year. not included with water allowances, 1 averaged monthly total usage, 2- does not include permitted water on well or reservoir. The only wording on potential limitations or potential future restrictions found on City of Silverton s certificates and permits stating; The amount of water appropriated shall be limited to the amount which can be applied to beneficial use and not exceed x cubic feet per second, or its equivalent in case of rotation. This statement is written on both permits S-3226 and S- 622 and correlates with the amount of water allowance stated in Table 1-2. In-stream requirements in the Molalla-Pudding sub-basin for supporting aquatic life, minimizing pollution and providing spawning abilities and resident fish surroundings. These minimum flow rates vary from season to season for both Abiqua and Silver Creeks and will be noted in later sections of this water management and conservation plan.
12 1.4 Quantification of Present and Historical Use: (4) A quantification of the water delivered by the water supplier that identifies current and available historic average annual water use, peak seasonal use, and average and peak day use; Table 1-3: City of Silverton Water Sales in Cubic Feet (gpcd = gallons per Capita per day) Month January 3,160,909 3,099,163 3,596,318 3,064,854 3,064,911 February 2,740,887 2,746,128 2,447,222 2,828,683 3,097,277 March 3,240,920 2,836,804 2,667,584 2,565,308 2,841,593 April 2,930,039 2,640,415 2,997,347 11,316,276 3,266,156 May 3,068,363 3,179,782 2,965,838 4,581,408 3,238,812 June 3,983,004 3,603,438 4,156,409 4,708,200 4,886,158 July 9,520,707 5,830,425 5,825,343 6,926,396 6,891,120 August 10,559,716 7,249,627 6,077,424 9,151,517 6,337,500 September 10,014,464 6,465,858 7,038,574 5,240,810 8,674,855 October 3,625,254 4,336,644 5,092,633 3,385,005 4,957,851 November 2,996,933 2,690,312 3,221,162 3,450,138 2,943,594 December 2,906,793 2,568,075 2,812,959 3,262,152 3,320,376 Peak Day Use 7/26 = 3.06 MGD 8/4 = 2.43 MGD 8/15 = 2.78 MGD 8/10 = 3.00 MGD 8/9 = 2.50 MGD Mo. Average 4,895,666 3,937,223 4,074,901 5,780,211 4,460,017 Population 9,222 9,344 9,356 9,369 9,369 Gallons Per Capita Daily Annual Totals 58,747,989 47,246,671 48,898,813 60,480,747 53,520,203 Figures taken from Water Use Summary Average gpcd Totals Monthly Ave 5 year Average 1 1 Average figured based on totals gpcd 53,778, MCF Pool Leak No Wastewater being delivered to Oregon Gardens, potable water used during highlighted months The average daily water delivered for the past five years is 147,339 cubic feet (1.10 MGD), equates approximately 123 gallons per capita daily. The table above illustrates both normal usage and peak seasonal use occurring in the highlighted months, typical for an Oregon water utility. Shown in blue indicates a leak found at the public swimming pool. Green shaded cells signify the times the wastewater treatment plant would not be supplying the Oregon Gardens with irrigation water, yet instead using potable water.
13 The gallon per capita per day figure is slightly skewed as the averages include increased water to the Oregon Gardens those seven months during the five year term of review. Extrapolating the same months (July through October) from those years where wastewater was substituted for potable water, averaging the figures among the number of months, indicates a substantial reduction in over-all averages. Table 1-4 compares those months when potable water was sold when reclaimed water could not be substituted. It is a goal of the City of Silverton to continue to find ways to use water from another means other than water from the drinking water treatment plant for irrigation purposes at the Oregon Gardens. Table 1-4: Variation in Water Usage Month Years 5 Yr. Mo. Average Adjusted Averages 1 Difference July 11, 12, MCF 6.16 MCF 11% August 11, 12, MCF 6.51 MCF 17% September MCF 6.23 MCF 17% October MCF 4.07 MCF 4% 1 Adjusted figures when the anomaly month is not factored into the average. 1.5 Water Rights: OAR (5) a tabular list of water rights held by the municipal water supplier that includes the following information: (a) Application, permit, transfer, and certificate numbers (as applicable); (b) Priority date(s); (c) Source(s) of water; (d) Type(s) of beneficial uses specified in the right; (e) Maximum instantaneous and annual quantity of water allowed under each right; (f) Maximum instantaneous and annual quantity of water diverted under each right to date; (g) Average monthly and daily diversions under each right for the previous year, and if available for the previous five years; (h) Currently authorized date for completion of development under each right; and (i) Identification of any stream flow-dependent species listed by a state or federal agency as sensitive, threatened or endangered that are present in the source 1, any listing of the source as water quality limited and the water quality parameters for which the source was listed 2, and any designation of the source as being in a critical ground water area. 3
14 Table 1-5: City of Silverton Source Permits Application # Permit # Source Authorized Beneficial Development Priority Date Amount Use Limitation cfs (mgd) S 4924 S 3226 Abiqua Creek Municipal 05/24/ cfs A 7.0 cfs (6.5 mgd) S 1297 S 622 Silver Creek Municipal 03/16/ cfs (3.2 mgd) 5.0 cfs S S Silver Creek 03/20/1973 1,300 acre feet B 200 acre feet Municipal Reservoir R R 5948 Silver Creek Municipal 03/20/1973 NA NA Reservoir (Storage for) GR-367 NA Well Municipal 02/10/ gpm (0.72 mgd) NA Totals 15 cfs A (9.7 mgd) 12 cfs (7.7) Permit S 622 = Certified /14/1911 A Water right has Development Limitation at 7.0 cfs, B stored water only, * Associated with Reservoir = Table 1-6: City of Silverton Usage / Permit Permit # Maximum Instantaneous Allowed Daily Maximum Allowed Annual Quantity Allowed Average Monthly / Daily Diversions 1 Ave Annual Water Diverted * Max. Month Instantaneous Diverted S cfs 6.5 mgd 2.36 BG 4.89 MCF MCF MCF 9.93 MCF MG 2 S cfs 3.2 mgd 1.18 BG MCF MCF 5.05 MCF 2.80 MCF MG 3 S R N/A G NA NA NA 0.00 MCF Totals MCF MCF MCF MCF MG Calculated based on figures from Water Use Recording Form, 2 highest single month in timeframe, July 2010, 3 April 2014, 4 S-3226 Permit only, * - Averaged annual water diverted October 2009 through September 2014, MCF = million cubic feet An authorized date for completion for development of each water right, based on population growth, industry changes and efficiency of the water system can be difficult to ascertain. Reviewing past conservation documents and the City of Silverton s current Water Master Plan, the basis for establishing any guidelines is focused on population growth and the gallons per capita per day. Three figures representing annual growth for the Silverton area are 1.3%, 1.5% and 1.92%, procured from 2003 Water Management Conservation Plan, 2011 Water Master Plan (section 2.2) and Portland State University -Population Research Center, respectively.
15 Using a median range, 1.57% annual growth rate was applied to the projected growth and potential completion of each water right, displayed in Table 1-7. Using 123 gallons per capita per day, applying prospective 1.57% annual growth, will assist in determining total demand of necessary water to meet the City of Silverton s requirements for the upcoming 20 years. Averaged over the past 5 years, 92% of water is diverted from Abiqua Creek and the remaining from Silver Creek. These figures will be applied to the beneficial use of each water right. The decisive factors do not take in account a surge in building or development in the City of Silverton s service area. Nor does it take into account any future change in land use zoning or a decline in population. Table 1-7: Water Right Development / Completion Permit # Date Amount Population Speculation 9,369 10,104 10,263 11,068 11,948 S /16/ cfs A S 622 Cert # mgd 03/16/ cfs 3.2 mgd Totals 15.0 cfs 9.79 mgd S /20/ cfs R mgd 1.69 cfs mgd 1.92 cfs 1.24 mgd 1.95 cfs 1.26 mgd 2.10 cfs mgd 2.27 cfs 1.47 mgd 16.9 % 19.2 % 19.5 % 2.10 % 22.7 % 0.14 cfs 0.15 cfs 0.16 cfs 0.17 cfs 0.18 cfs mgd mgd mgd mgd mgd 2.8 % 3.0% 3.2% 3.4% 3.6% 1.83 cfs 2.07 cfs 2.11 cfs 2.27 cfs 2.45 cfs mgd 1.33 mgd 1.36 mgd 1.46 mgd 1.58 mgd 0.00 cfs NA NA NA NA 0.00 mgd 0% 0% 0% 0% 0% S 3226 Peak Day 4.3 cfs 4.5 cfs 4.7 cfs 5.1 cfs 5.5 cfs Water Use Peak Day Use as % of Water Right 43% 45% 47% 51% 55% All calculations are determined by maximum gallons consumed for a single month from October 2009 through September 2014, figured at 123 gallons per capita daily. As system improvements continue to be applied, actual water consumption will likely be reduced, A Water right has Development Limitation at 7.0 cfs The water sources for the City of Silverton are both the Abiqua Creek and Silverton Creek, which are situated in the upper Willamette River Watershed basin, 4 th field hydrologic unit code (HUC) , sub-basin The sub-basin areas are shown in maps depicting the Molalla-Pudding River Watershed, Fish Distribution and Habitat areas, both the Chinook and Steelhead Distribution maps on pages Table 1-8 designates the two species of fish, the area of the water source, their listing as sensitive, threatened or endangered. The Pudding River Watershed is considered an Evolutionary Significant Unit ESU for both Chinook and Steelhead Trout, which contains
16 spawning, rearing, or migration of these primary constituent elements PCE, as well as management activities that may affect the PCEs in the watersheds. Table 1-8: Endangered Species Species ESU Area ESA Listing Area Designation ESA Critical Habitat Upper Willamette Basin Water Shed - Hydrologic Unit Code National Oceanic Atmospheric Association Chinook Upper Willamette * Threatened ESU Yes (9-2-05) Spring Chinook Upper Willamette Threatened SMU Yes (9-2-05) Steelhead Upper Willamette * Threatened ESU Yes (9-2-05) Molalla Pudding Sub Basin - Hydrologic Unit Code Oregon Department Fish and Wildlife Chinook Upper Willamette * Critical ESU SMU Spring Chinook Upper Willamette * Critical ESU SMU Steelhead Upper Willamette * Vulnerable ESU SMU - winter * - ESU, evolutionary significant unit is a Federal listing as threatened or endangered by either NOAA National Marine Fisheries Service (6/28/2005) or the U.S. Fish and Wildlife Service. 1 Distinct Population Segment =NOAA National Marine Fisheries = ESU, SMU significant management unit. Water quality concern is dissolved oxygen The Critical Habitat Analytical Review Team CHART elevated the Abiqua Creek/Pudding River HUC5 from a low to medium conservation value, noting that recent data from a watershed assessment indicate that this HUC5 has some of the highest-quality habitat in the Pudding River sub-basin, (M. Simmons, NOAA Fisheries, pers. com), noting that this particular sub-basin has relatively low abundance and distribution objectives identified by ODFW for spring Chinook. Due to higher quality water in Abiqua Creek, the CHART noted that Abiqua Creek/ Pudding River has higher order of densities and more fish. 1 An additional concern for water quality is the level of dissolved oxygen, as a parameter that will be continually monitored in the future. 1 NOAA Fisheries, Upper Willamette River Chinook/Steelhead ESU Final Assessment Report
17 Molalla Pudding River Watershed

18 Map ODFW Pudding Watershed clearing house data 2006 Fish Distribution and Habitat Area Pudding River Watershed


19 Map ODFW Pudding Watershed clearing house data 2006 Spring Chinook Spawning Rearing Migration Areas in Molalla Pudding Sub-basin

20 Map National Oceanic Atmospheric Administration National Marine Fisheries Service Winter Steelhead Spawning Rearing Migration Areas in Molalla Pudding Sub-basin

21 In 2008, the Water Quality Management Plan (WQMP) by the Department of Environmental Quality was to establish the Total Maximum Daily Load (TMDL) parameters for a series of pollutants. A TMDL is a regulatory term describing a value of the maximum amount of a pollutant that a body of water can receive while still meeting water quality standards. Alternatively, TMDL is an allocation of that water pollutant deemed acceptable to the subject receiving waters. In a study, 28 stream segments within the Molalla-Pudding Watershed were listed in 303(d) section of the Clean Water Act as water quality limited or needing TMDLs. According to the DEQ 2010 Integrated Report for assessed water quality the database for water quality limited and the water quality parameters for which the Abiqua and Silver Creeks were listed was a single pollutant of dissolved oxygen. 1 This report is currently effective until the 2012 Integrated Report is finalized by the Environmental Protection Agency. See Appendix A for Abiqua and Spring Creek information taken from the 2010 Integrated Water Quality Assessment Report. Regarding any designation of the source as being in a critical ground water area, the map depicts those areas (Mt. Angel) that have been studied and showing some decline in the groundwater table. This 22 square mile are just north of the City of Silverton has shown water levels in wells has declined in the Mt Angel area 3.3 to 8.2 feet per year (early 1970s to 1992). 1 1 (Runyon, et al.,2006) DEQ TMDL WQMP December 2008, Map ODFW Pudding Watershed clearing house data Water use characteristics: OAR (6) A description of customers served including other water suppliers and the estimated numbers; general water use characteristics of residences, commercial and industrial facilities, and any other uses; and a comparison of the quantities of water used in each sector with the quantities reported in the water supplier's previously submitted water management and conservation plan and progress reports; The City of Silverton serves approximately 9,500 people using 3,000 connections; with water served mainly to rural residential users (68%) and approximately 26% commercial/industrial consumers. The remaining 6-7% of consumed water is provided to governmental, school and churches. Typical water usage ranges from 105 to 123 gallons per capita per day. Average daily metered water for the past five years is 154,320 cubic feet (1.15 MGD), gallons. Since this water management and conservation plan is the initial plan to the Water Resources Department, the characteristics of water use amounts are taken from 2009 through 2014.
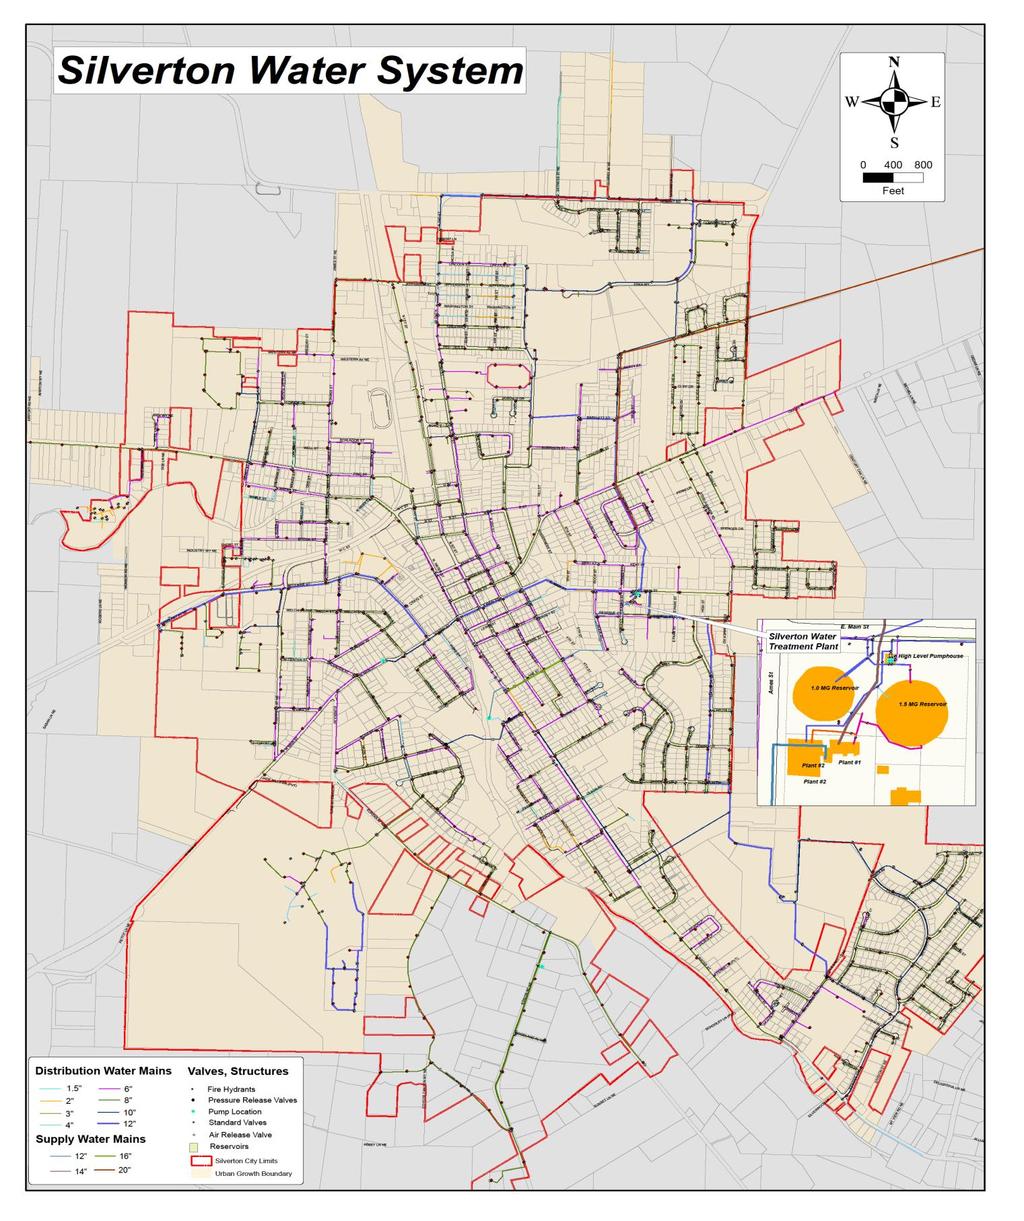
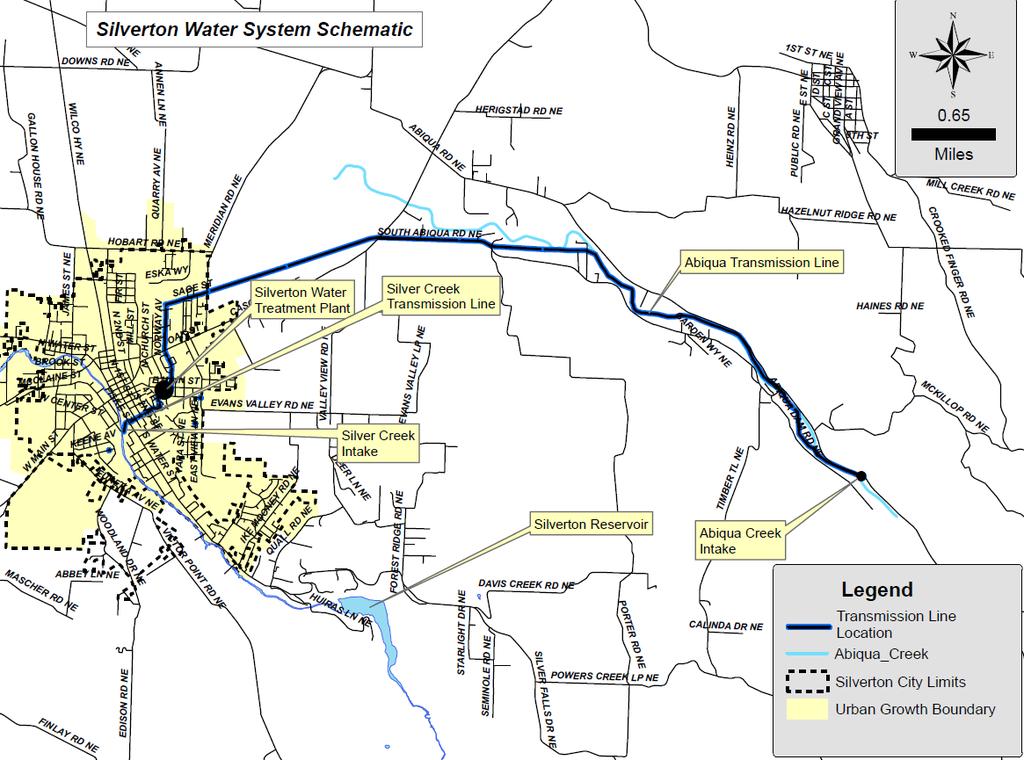
22 Table 1-9: Water Use Characteristics Classification Consumption Gallons per day % of total gallons Residential 68.0 Commercial / Industrial 26.0 Governmental, Schools etc. 6.0 Totals 100 Gallons per day capita = approximately 123 gallons, which includes all classifications of users. Water usage report Interconnections with other systems: OAR (7) Identification and description of interconnections with other municipal supply systems; Presently, the City of Silverton has no inter-ties with any entity, either public or private, primarily due to the rural setting in which the city is located. Mt. Angel, approximately 3 miles north of the City of Silverton, consumes nearly 0.50 MG per day (2010), with a peak demand at 0.84 MG. The City of Silverton should anticipate being approached by Mt. Angel in the future as they look for a more long-term regional solution to their water supply. 1 1 Taken from Silverton Water Master Plan 2011 Keller Associates 1.8 System Schematic OAR (8) A schematic of the system that shows the sources of water, storage facilities, treatment facilities, major transmission and distribution lines, pump stations, interconnections with other municipal supply systems, and the existing and planned future service area; and The City of Silverton s water system schematic was provide by the city. The map depicts aerial views using a drawn map outlining the city s storage and treatment facilities, major transmission and distribution lines, service boundary limits, urban growth locations of distribution system components, and planned future service in the form of urban growth boundary. See Silverton Water System at the end of this section. 1.9 Quantification of System Leakage: OAR (9) a quantification and description of system leakage that includes any available information regarding the locations of significant losses. Taken from the water production and usage reports; dated from July 2009 through June 2014, and placed in the Table 1-9, the City of Silverton has an approximate water loss of 17.4 percent, not including figures for major breaks that are expeditiously repaired, and un-metered authorized or un-authorized uses, The typical method for estimating system leakage is to take the difference between the metered diversions at the source and metered customer use, corrected for any un-metered use such as, main flushing, street cleaning and all other known uses.
23
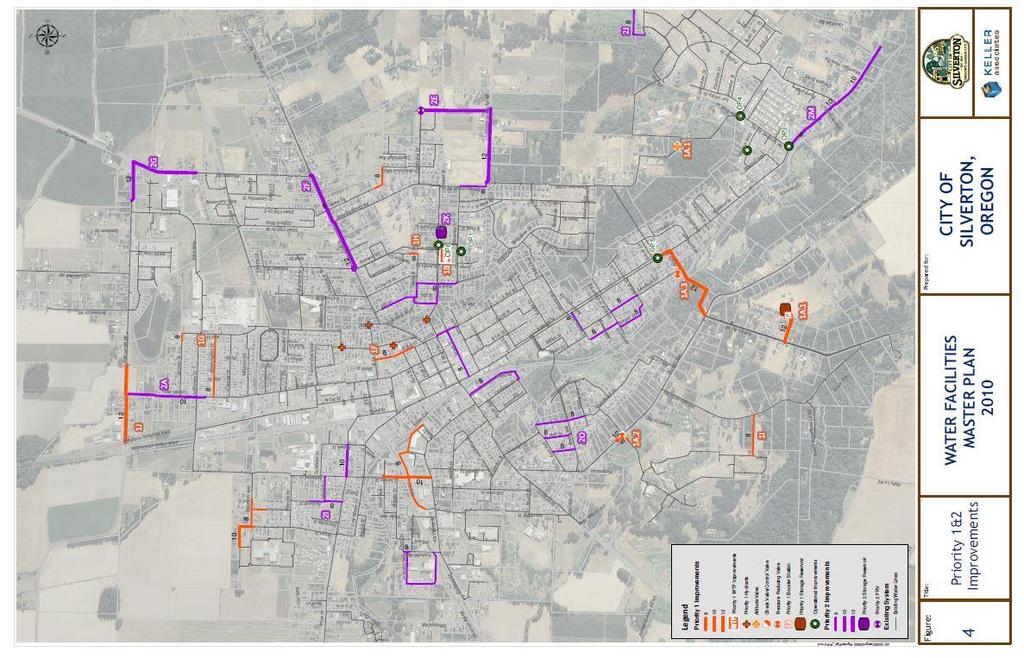
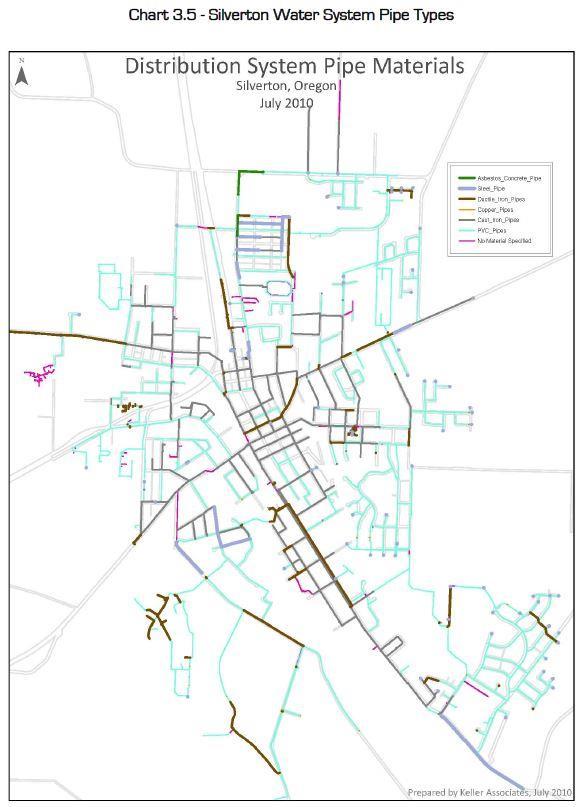
24
25 Inserted on pages 17 and 18, are two maps taken from the 2011 Water Master Plan depicting both the water distribution system by the type of pipe currently in use and the replacement timeline for older, leaking pipe as part of the Capital Improvement Plan. The city is completing Project ID number 1G on the Water Facilities Master Plan to improve fire flow and remove problematic lines. Striving to complete the entire list, variable circumstances enter the equation as to the decisions made to complete any identified task. The City of Silverton will continue an effort to complete projects based on the most appropriate task, cost to complete and resources available. Table 1-10: Water Production / Water Loss (million cubic feet) Year Raw Water Customer Usage System Ops Water Loss % % % % % % Annual Ave: % 1 Water loss is a percentage of raw water figures The other uses, such as treatment plant back pulse, sedimentation basin cleaning, line- flushing and hydrant maintenance are figured and accounted for, yet not used in determining water loss. Even though these maintenance procedures are necessary in maintaining valuable water quality, the quantities of water used during these procedures are not calculated in the above figures. As routine repair and distribution system upgrades are scheduled in the future, City of Silverton will likely reduce the percentage of unaccounted water and remain under the 15% threshold. One single aspect with the most impact (pertaining to water usage) is the use of effluent from the wastewater treatment plant for irrigation of the Oregon Gardens. When the effluent is not available, the city supplies potable water from the water production plant as a substitute. From May 2014 through October 2014, an average MGD was supplied to the Oregon Gardens. Best management practices are continually being reviewed to keep this process in place, using wastewater effluent as a primary source for irrigation water at the Oregon Gardens.
26
27
28
29 SECTION TWO WATER CONSERVATION ELEMENT Water conservation activities provide for the sustainability of water for the future. Not all conservation efforts are going to be effective. It is those that have been implemented and continued efforts behind them that will show the greatest results. The City of Silverton will employ a number of water conservation efforts which may include water system audits, leak detection, public education, and retrofitting of inefficient water devices. Evidence may show a greater requisite of time and resources to research, implement and prove the effects of water conservation activities. 2.1 Progress Report: (1) A progress report on the conservation measures scheduled for implementation in a water management and conservation plan previously approved by the Department, if any; This is the first water management conservation plan for City of Silverton. It is the intent of both city administration and the City Council to continue to enhance the ideals of conservation through system repair, customer s knowledge, and implementation of conservation measures. Tthe city will review efforts made in meeting the benchmarks established and provide a progress report approximately five years from Measurements and Reporting: (2) A description of the water supplier's water use measurement and reporting program and a statement that the program complies with the measurement standards in OAR Chapter 690, Division 85, that a time extension or waiver has been granted, or that the standards are not applicable; The measurement and reporting information is taken from the annual report, due December 31 of each year, to the Water Resources Department. This report includes the amount of water that is diverted during the previous year, October 1 through September 30. The City of Silverton adheres to the measurement and reporting requirements established in the Oregon Administrative Rules. Flow meters are placed throughout water treatment process units that report to the programmable logic controller. For finished water on the potable side of the water treatment plant, a meter is used to identify how much water is produced and pumped to the customers. Production meter readings are documented on a daily basis. The City of Silverton complies with the measurement standards in Chapter 690, Division 85 of the Oregon Administrative Rules. These standards require the submittal of annual water use, and the methods for measuring and computing water use. The City of Silverton applies the flow meter method to determine the quantities of water diverted at their intakes, and put to beneficial use. Neither time extensions nor waivers are necessary to meet this standard.
30 2.3 Implemented Measures: (3) A description of other conservation measures, if any, currently implemented by the water supplier, including any measures required under water supply contracts; At the time of this writing, the City of Silverton has taken steps in implementing conservation efforts other than a review of water rates and how those rates can reduce the consumption. As the progress in water conservation expands, the focus will be assisting both residential and commercial customers with continued educational guidelines regarding water saving devices. Information in this water management conservation plan including public education; the addition of sending wastewater effluent to the Oregon Gardens; the meter replacement program; and quantity based billing software, has been and will continue to be implemented. 2.4 Annual Water Audit: OAR (4) A description of the specific activities, along with a schedule that establishes five-year benchmarks, for implementation of each of the following conservation measures that are required of all municipal water suppliers: (4)(a) An annual water audit that includes a systematic and documented methodology for estimating any un-metered authorized and unauthorized uses; The City of Silverton regularly performs an annual water audit by means of reviewing both amount of water produced in comparison to the amount of water sold to customer s. This includes reviewing water usage characteristics per customer; water used for line flushing and backwash water; and finally comparing those measurements against the measurements at the intakes on Abiqua and Silver Creeks. Table 1-10 on page 17, outlines the City of Silverton s production, sold, and loss reports that indicate an average of 17.4 percent loss or unaccounted water. The 17.4 percent water loss is a realistically acceptable number in regard to water loss percentages. With new infrastructure projects to the distribution system during the upcoming years, the probability of a reduction loss below 15 percent is obtainable. The City of Silverton will make every effort to continue to reduce the percentages of water loss (unaccounted water), looking at a goal of possibly single digit percentages of unaccounted for water. At the time of writing this document, there is no significant findings to explain the discrepancy of the large leak estimates from 2011 through 2014.
31 2.5 Full Metering of System: OAR (4) (b) if the system is not fully metered, a program to install meters on all un-metered water service connections. The program shall start immediately after the plan is approved and shall identify the number of meters to be installed each year with full metering completed within five years of approval of the water management and conservation plan; The City of Silverton is a fully metered water system which includes meters on both the raw water sources and consumer connections. Production meters are read daily and customer meters are read monthly. 2.6 Meter Testing and Maintenance: OAR (4) (c) A meter testing and maintenance program; The City of Silverton approaches meter testing and maintenance (replacement) using a program with the following these steps: 1. Usage - any discrepancy that is found in consumption being either below or above normal average of any single user, during any specific time of year. 2. At the time of writing this water management and conservation plan, maintenance crews have replaced sixty percent of all customer s meters with remote read meters.pplans are to replace 250 meters annually for the next five years. This action will provide the city with all meters less than ten years of age. The city has enhanced their efforts of meter replacements from a fifteen year timeline to ten years. 3. The city continues to test larger (3 +) meters annually. 2.7 Rate Structure: OAR (4) (d) A rate structure under which customers' bills are based, at least in part, on the quantity of water metered at the service connections; The City of Silverton utilizes a monthly rate, incorporating a flat cost charge based on meter size and a consumption charge for all water consumed. Customers outside city limits are charged at 1.5 times the residential rate for both water. The City s base rate, effective July 1 st, 2015, is currently $15.87 per month for residential users having a 5/8 meters, 3/4" meters and one inch meters required by fire codes having sprinklers. An additional cost of $2.27 for every unit (100 cubic feet or 748 gallons) consumed. Copy of rates included at the end of the section. 2.8 Excessive Leakage: OAR (4) (e) If the annual water audit indicates that system leakage exceeds 10 percent, a regularly scheduled and systematic program to detect leaks in the transmission and distribution system using methods and technology appropriate to the size and capabilities of the municipal water supplier; and Currently, the City of Silverton estimates that an annual 17.4 percent system leakage has been properly calculated. Leaks are categorized into two priorities, a) leaks report by City staff and, b) leaks reported by customer complaint. Both situations are assessed and prioritized. Large water leaks are repaired immediately. Smaller leaks are listed in software database called
32 iworq that assists in managing schedules for work permits that the crews are then assigned to repair. Bi-annual valve and hydrant exercising is part of the routine flushing program, with broken items placed on a list for replacement. With the many tasks water crews perform, repairs to the distribution system are performed throughout the year. The Water Master Plan Capital Improvement Projects for upgrading the water system includes detailed information regarding (Priority 2) steps taken to improve fire flows, pressure circulation, hydrant coverage, pipeline replacement, operational improvements and improved maintenance. Tthese aspects will contribute to a reduction in water loss to a goal of ten percent and possibly single digit percentage water loss. A benchmark to be considered in the future will be the acquisition of in-house leak detection equipment. A cost analysis will be performed to weigh the expense of the equipment against the value and purchase price. Leak detection performed in 1994, 1996 and 1997 did not find significant leakage findings compared to the cost the city spent for an outside contractor. 2.9 Public Education Program: (4) (f) A public education program to encourage efficient water use and the use of low water use landscaping that includes regular communication of the supplier's water conservation activities and schedule to customers; Future City webpage additions will include educational points that encourage the consumers in water conservation: Landscape suggestions with native plants and drought tolerant to reduce water requirements. Convert older fixtures to more water efficient devices. Instill the idea of sweeping patios, drives and sidewalks instead of washing them with water. Articles prompting consumers to fix leaks in a timely manner. Examples of dripping sinks and running toilets relating to wasting thousands of gallons of water, which increases the water bill. Water in early morning or late evening. Less water will be lost to evaporation, and try not to water things that don't grow, like sidewalks and fences The City of Silverton will continue the efforts of water conservation by; 1) providing additional information to the consumers through the annual Consumer Confidence Report;, 2) updating of the City webpage; 3) and distributing brochures which encourage the use of water saving devices and water friendly gardening techniques. The drought of 2015 prompted the City of Silverton to engage the community with enhanced information regarding water conservation. Methods implemented during 2015 included presentations to city council (televised), preparation and distribution of flyers, updates to the city s website, information added to the utility bill, and an alert system used to disseminate curtailment information. This
33 approach will be the foundation for the future when similar conditions develop. The City of Silverton has provided copies of two informational flyers that were distributed to the citizens. Copies can be found in appendices AA and BB. Table 2-1: Conservation Goals Year Measure Annual Audit Metered System Meter Replacement / Testing Rate Structure Being considered Excessive Leakage Public Education Retrofit Fixtures Develop for future 3 year - Measure continues as an on-going effort towards overall conservation Expansion / Diversion OAR (5) If the municipal water supplier proposes to expand or initiate diversion of water under an extended permit for which resource issues have been identified under OAR (5)(i), a description of the specific activities, along with a schedule that establishes five-year benchmarks, for implementation of a system-wide leak repair or line replacement program to reduce system leakage to no more than 15 percent or sufficient information to demonstrate that system leakage currently is no more than 15 percent. The City of Silverton has been and will continue to be proactive about their water source and the final destination of its produced water. The five-year average peak day demand (2.8 mgd) uses about 43% of the City s water rights in Abiqua Creek. The dual water sources are the Abiqua and Silver Creeks, with Abiqua Creek accounting for 18.9 percent of water right S-3226, or 12.6 percent of the city s total water rights (See Table 1-2). Specific activities will include and follow the capital improvement plan recommended by Keller Associates in the Silverton Water Master Plan. Listed as Priority 2 Improvements include distribution line replacement with an estimated cost of $3.05 million dollars. As the list is implemented, the percentage of lost water through system leakage will be reduced. Coordinating efforts with the recommendations and conservation planning will be presented as a benchmark Population Criteria OAR (6) If the municipal water supplier serves a population greater than 1,000 and proposes to expand or initiate diversion of water under an extended permit for which resource issues have been identified under OAR (5)(i), identification of any stream flow-dependent species listed by a state or federal agency as sensitive, threatened or endangered that are present in the source, any listing of the source as
34 water quality limited and the water quality parameters for which the source was listed, and any designation of the source as being in a critical ground water area, or if the municipal water supplier serves a population greater than 7,500, a description of the specific activities, along with a schedule that establishes five-year benchmarks, for implementation of each of the following measures; or documentation showing that implementation of the measures is neither feasible nor appropriate for ensuring the efficient use of water and the prevention of waste: The City of Silverton should not need to expand or initiate diversion of water under the extended permit on Abiqua Creek within the next 20 years. The forcasted peak day demand of 5.5 cfs should not exceed the 7 cfs limit in the extended permit. The city serving a population of 9,540,, will apply a series of activities over the next five years to both promote water efficiency and reduce waste. Using the historical data for comparison, the staff will continue to perform the operational tasks as recommended in the water master plan and based on the budget that is voted on annually. An enhanced educational program will provide the necessary means to instruct the consumers on the importance of water waste, potential limitations of the source, low flow fixtures and landscape system efficiencies. Conversations with city staff indicate the awareness of stream flows (minimal and reduced), minor water right holders and the potential impact water consumption will play in regard to the entire water basin. Outlined in the curtailment section are trigger points that will provide more restrictive approach during times of long term arid conditions or when stream flows fall below the instream requirements to support aquatic life and habitat. Table 2-2: Conservation Activities Year Measure Leak Testing On-going System Repair 1 Low Flow Fixtures Develop for future 3-4 year timeline Landscaping Being considered Irrigation Schedule 2 Public Education On-going 1 Determined based on revenues and availability of time. 2 Put in action when low rainfall/drought conditions exist System Leakage: OAR (6) (a) A system-wide leak repair program or line replacement to reduce system leakage to 15 percent, and if the reduction of system leakage to 15 percent is found to be feasible and appropriate, to reduce system leakage to 10 percent;
35 As per subsection 2.8, the City of Silverton is continually looking towards the betterment of their entire water system through tasks that reduces water loss. The need to implement line replacement in various locations is taken from the most current water master plan, yet coordinating both monetary and staff resources will be the hurdle to overcome. The primary goal for the City of Silverton is to reduce system-wide leaks to under 15 percent. Speculatively it can be conceived that total water loss can be reduce to 10 percent when implementation of the recommended repairs and replacements are completed Technical and Financial Assistance OAR (6) (b) Technical and financial assistance programs to encourage and aid residential, commercial, and industrial customers in implementation of conservation measures; The City of Silverton currently does not provide technical or financial assistance in developing water conservation ideas, such as rebates for water efficient fixtures, water audits for households, and public information. As stated in sub-section 2.9, the city will be using their webpage as its primary means to share information with its consumers. Any future ideas regarding water conservation will be decided by either city administration staff or the City Council Financed Retrofitting: OAR (6) (c) Supplier financed retrofitting or replacement of existing inefficient water using fixtures, including distribution of residential conservation kits and rebates for customer investments in water conservation; Retrofitting is the replacement of an older water fixture with one that is more water efficient, and ultimately offers considerable water saving potential in the home and business. Since an increase in the number of connections has occurred in recent times, it is believed that water efficient fixtures were placed in a majority of the current dwellings for the City of Silverton s consumers. A review of dwellings and the time frame in which they were constructed, along will an informal survey, will assist the city in determining the need to promote a fixture replacement program Rate Structures: OAR (6) (d) Adoption of rate structures, billing schedules, and other associated programs that support and encourage water conservation; In subsection 2.7, details to the rate structure is provided as well as a copy of the current rates found at the end of this section. A visit to City of Silverton s webpage at will provide information on the most current rates. The City of Silverton management team has recently been assessing the rates to change from a flat block rate to an increase block rate. At this time, this option will not be implemented.
36 2.16 Recycle / Reuse: OAR (6) (e) Water reuse, recycling, and non-potable water opportunities; and Reuse, recycling and use of non-potable water by homeowners and businesses has not been considered for the City of Silverton. Cost effectiveness of implementing a recycle / reuse program of non-potable water is relatively high as compared to those techniques currently in place at other entities. Future contemplation of non-potable water reuse will be determined if rules require such actions and the cost associated with such a task makes it feasible. The City of Silverton would be open to learning about this type of usage, but presently no conversations have been initiated, as the idea seems too far into the future. The single most relevant step towards water reuse is the implementation of using recycled water (effluent) from the City s wastewater treatment plant to assist the Oregon Garden for irrigation purposes. Tracking the quantity of used water is increasing in its priority due to the large consumption that would otherwise be supplied by potable water. Records show that an additional 30-50% more water is produced over average monthly uses when wastewater cannot be supplied for irrigation. See Table Other Conservation Measures: OAR (6) (f) any other conservation measures identified by the water supplier that would improve water use efficiency. The City of Silverton will continue to review all possible activities that provide greater benefit of water use, and are more cost effective, feasible, and long-lasting. At this time, the City of Silverton has identified the possibility of supplying recycled wastewater at the highest levels as well as looking at other water sources that may assist in supplying non-potable water to the Oregon Gardens.
37
38 SECTION THREE WATER CURTAILMENT ELEMENTS Water curtailment is designed to minimize the impacts of a short term emergency water shortage by reducing the demand and possibly look for an alternative water supply. Generally, conservation measures and a secondary supply, or a combination of the two are the most important tools water suppliers can use to immediately reduce the shock on the primary source. Curtailment plans usually develop through voluntary and mandatory restrictions of usage, dependent upon the severity of the shortage. 3.1 Assessing Water Supply: (1) A description of the type, frequency and magnitude of supply deficiencies within the past 10 years and current capacity limitation. The description shall include an assessment of the ability of the water supplier to maintain delivery during long-term drought or other source shortages caused by a natural disaster, source contamination, legal restrictions on water use, or other circumstances; For the past 15 years, the city has not experienced a drought or mechanical failure which resulted in a supply deficiency. Severe winter storms that increase turbidity and upset the water treatment plant(s), does not affect the supply side of service but does increase the procedure time in order to restore filtration process. Pertaining to capacity limitations, the intake screens on Abiqua Creek match up with flow rates and permit S-3226 with an allowance of 10.0 CFS or 6.5 MGD This water permit has a development limitation of 7.0 CFS. The transmission lines have a limited carrying capacity of 7.42 CFS or 4.8 MGD, due to the minimum pipe size at 20 inches. On Silver Creek the permit S-622 allows for 5.0 CFS which equates to 3.23 MGD, the pump capacity (with 2 pumps operating) equals 3.55 CFS or 2.3 MGD and a single pump at 2.63 CFS or 1.7 MGD. The reservoir capacity of 1,300 acre feet per year, has a limitation rate of 14 CFS or 9 MGD, and does not limit the flow of water based on permit R-5948 and permit The water treatment plant has two facilities that operate in parallel which allows for adaptability during times of maintenance, failures and emergencies. Neither treatment facility has been incapacitated in such a way to negatively impact the water supply to the consumers. Based on the locations of the intakes for both Abiqua and Silver Creeks, the vulnerability to contamination is limited Regarding capacity flows of both creeks, it is difficult to determine the comparison of actual flows to the flows establish as minimum requirements to support aquatic life, fish habitat and minimize pollution. Factors as sample site locations, and various change in times of the year make it difficult to compare minimum flows at the intake locations against said flows downstream.
39 Abiqua Creek - Willamette Basin - Hydrologic Unit Water District 16 Abiqua Creek * Discharge (CFS) Below minimum flow Date Measure Hydrologic Unit (CFS) ^! 6/15/ /2/ /16/ /16/ ! 7/19/ /17/ ! 6/22/ /23/ /30/ ! 7/10/ ! 7/10/ /4/ /12/ ! 7/17/ ! 8/14/ ! 6/25/ /23/ /1/ ! 7/29/ /19/ /11/ /27/ /4/ ! 7/25/ /22/ ! 6/23/ /18/ /5/ ! 9/2/ ! June July August 8 15 September 12 * in-stream requirements for supporting aquatic life, resident fish habitat and minimizing pollution ^ stream flow data - OWRD - miscellaneous measurements for instream water rights Notes from stream flow with Marion County having oversight. USGS now has oversight measurement taken above gage near mouth of Pudding River, measurement taken at Nusom Road above gage measurement taken upstream from gage, measurements taken at Highway 214 Flow measurements taken from OWRD for 2004 through 2014 (Marion County had oversight of measurements)
40 Silver Creek - Willamette Basin - Hydrologic Unit Water District 16 Silver Creek * Below Minimum flow Date Measure Hydrologic Unit Discharge (CFS) ^ (CFS)! 7/1/ /21/ ! 8/23/ ! 7/14/ ! 7/20/ ! 6/22/ /30/ ! 7/27/ ! 7/1/ /26/ ! 8/12/ ! 6/22/ /6/ ! 8/5/ ! 7/15/ /27/ /6/ ! 9/14/ ! 7/9/ June July August September 23 * in stream requirements for support aquatic life, resident fish habitat and minimizing pollution ^ stream flow date - OWRD - miscellaneous measurements for instream water rights Notes from stream flow with Marion County having oversight. USGS now has oversight measurement taken above gage at mouth of Pudding River measurement taken at Nusom Road above gage measurement taken upstream from gage measurement taken at Highway 214
41 Three scenarios could produce a long term water shortage: Complete source contamination Devastation of the water treatment plant or Elimination of the 2 million gallon reservoir. During any time that the area is declared a severe drought by the Governor s office, the City of Silverton will implement those steps outlined in sub-section 3.3: Voluntary efforts in reduction of total consumption. Appropriate allocation of water, based on the amount of stored water available at the time of event. The City of Silverton will associate the guidelines in the city s emergency response plan with the stages of alert defined in this water management and conservation plan. 3.2 Stages of Alerts: (2) A list of three or more stages of alert for potential shortage or water service difficulties. The stages shall range from a potential or mild alert, increasing through a serious situation to a critical emergency; The City of Silverton will be adopting a five level approach for curtailment of water use, with the primary goal of maintaining sufficient supplies to meet essential uses such as drinking, cooking, sanitation and fire flow. A secondary goal is to maintain flow under normal conditions for consumers at all times. The five levels of alert will be designated as low, mild, moderate, serious, and critical/emergency. The triggers in Table 3-1 are based on all sources of water supply in order to give the City the greatest flexibility in dealing with a shortage. Events causing this plan to be activated would include, but not limited to the following: Mechanical or electrical malfunctions of pumping capabilities or one of the booster stations. Interruption of the local power company supply. Abnormal weather conditions, determined by low rainfall reducing levels in either Abiqua or Silver Creeks. Declaration of a drought for their particular area by the Governor pursuant to Oregon Revised Statute Natural disasters that damage critical infrastructure preventing the water system to operate under normal conditions. A deliberate act of contamination of water at various points in the water system.
42 3.3 Alert Triggers: (3) A description of pre-determined levels of severity of shortage or water service difficulties that will trigger the curtailment actions under each stage of alert to provide the greatest assurance of maintaining potable supplies for human consumption; and Table 3-1: Five Levels of Alert Triggers (Based on all sources of water supply) Low Alert Level Water usage reaches 80% of capacity (water production) for three consecutive days Construction projects that impede full capacity flow of system for more than 5 days A complete shut down or any action that may reduce flow capacity below 80% A sudden drop in flows from Abiqua Creek by 40% Mild Alert Level Usage reaches 85 percent of capacity Stream flows decrease by 50% on Abiqua Creek Moderate Alert Level Water use reaches 90% of capacity (water production) for three consecutive days High level pumping capacity is reduce to 80% of normal finish water output Normal flow in water system is reduced to 80% Stream flows decrease by 60% on Abiqua Creek High Alert Level Water use reaches 95% of capacity (water production) for three consecutive days High level pumping capacity is reduced to 70% Normal flow is reduced to 70% The area is declared in a severe drought per declaration by the Governor Stream flows decrease by 70% on Abiqua Creek Extreme Alert Level High level pumping capacity is reduced to 50% Normal flow is reduced to 50% in water system, creek flows are limited A natural disaster that incapacitates the water system, or contaminates the water source Intentional act causing long term disabling of the water system or sustained deficit of water Stream flows decrease by 80% on Abiqua Creek Note: Stream flows are measured by the Water Quality Supervisor at the Abiqua intake gauge. Percentages will be compared to sudden decrease in stream flows.
43 3.4 Curtailment Actions: (4) A list of specific standby water use curtailment actions for each stage of alert ranging from notice to the public of a potential alert, increasing through limiting nonessential water use, to rationing and/or loss of service at the critical alert stage. Coordinated efforts to implement any curtailment or restrictions in water usage will be carried out by the Public Works Director. The Director will be responsible to share information with the Mayor, City Manager and City Council about any situation that might trigger such actions. Each step will be carried out according to city procedural protocol, using various methods of communications. If curtailment triggers define when to impose restrictions, then the curtailment actions will establish the type of restriction to impose. There are no defined methods on the types of restrictions, yet curtailment actions will start with a notice to the public of the potential alert, limiting of non-essential uses of water and end with rationing (possibly from a single location) and/or loss of service at the most critical stage of alert. If any of the curtailment triggers are met, all users will be notified in the following manners: Public announcements in the local newspaper, the local radio station, door to door, the City s website and leaflets placed in conspicuous locations, (i.e. city hall, post office, and public locations) Once steps are implemented, procedures following the coordinated efforts outlined in the emergency response plan provide the necessary coordinated actions, including contacts of both State and local county authorities. Specific actions may be applied to the entire water system or to those zones which are directly affected by the water shortage. The Public Works Director, working with the Divisions Supervisors, will be responsible for executing the plan provisions once the level of emergency has been determined and declared. Working in conjunction with the Mayor, City Manager and City Council, the effectiveness of the established procedures will be evaluated to determine if any further actions need to be taken, maintained, or rescinded. Plan provisions will remain in effect until the emergency is declared ended by the City Council or City Manager. These goals established by each level of curtailment action are based on the reduction of peak demand. On the next page, the levels of action taken by the City of Silverton in response to either a temporary or long term event occurring are displayed in Table 3-2. Both general and specific steps are outlined based on the level of concern towards water conservation.
44 Table 3-2: Curtailment Actions Low Level Action (1) The Public Works Director, following the policies established in the city s ordinances, will issue a general request for a voluntary reduction in water use by all water users. The request will be made at a time when there is a strong indication that the city s water supply or production capabilities will be reduced below the capacity to provide adequate service to all water customers. The request will include a summary of the current water situation, the reason for the requested reduction in use, and a warning that mandatory cutbacks will be required if the voluntary measures do not sufficiently reduce water usage. Also a time frame for the voluntary reduction will be established, indicating the date and time when the reduction will be concluded. Mild Level Action (2) A second step would be to implement mandatory reduction in water use by all consumers. This step will assure normal capacity flow during reduced production or delivery schedules and help eliminate peak demands that may create other concerns for the water system. This step is the next natural level of curtailment moving towards a moderate level of action. The goal of this step is to maintain 95% water production flow rates using a 10% reduction. Moderate Level Action (3) City of Silverton will put into place the following: No flushing of system line unless essential. Implement schedules for irrigation of lawns and landscape. Commercial use to be reduced by 10% and residential use by 20%. Washing of vehicles will be prohibited. The goal is to maintain 85% water production flow rates using a 20% overall reduction in usage. Critical Level Action (4) City of Silverton will put into place the following: Establish a drought rate surcharge. All outdoor use of water is prohibited. All customers will be set at a daily allotment in number of gallons per day. Water service will be disconnected if allotment if disregarded. Commercial users will be reduced to 70% of the previous year allotment. Bulk water sales/usage will be terminated until further notice The goal is to maintain a 75% water production flow rate assuming a 30% overall reduction in usage. Emergency Level Action (5) It is not if an emergency is going to occur, but when an emergency situation will take place.
45 There are a number of circumstances that can result in an emergency response condition, all resulting in the water system being incapable of supplying water to the consumers. This step is launched to provide the minimum of 70 gallons per person per day. See City s Emergency Response Plan. Table 3-3: Action Levels of Curtailment: Shortage Condition Level Water Curtailment and Reduction Goals Reduction Usage Goal Type of Rationing 5% 1 10% Voluntary 5% 2 10% Mandatory 15% 3 20% Mandatory 25% 4 30% Mandatory Water System Failure % Mandatory
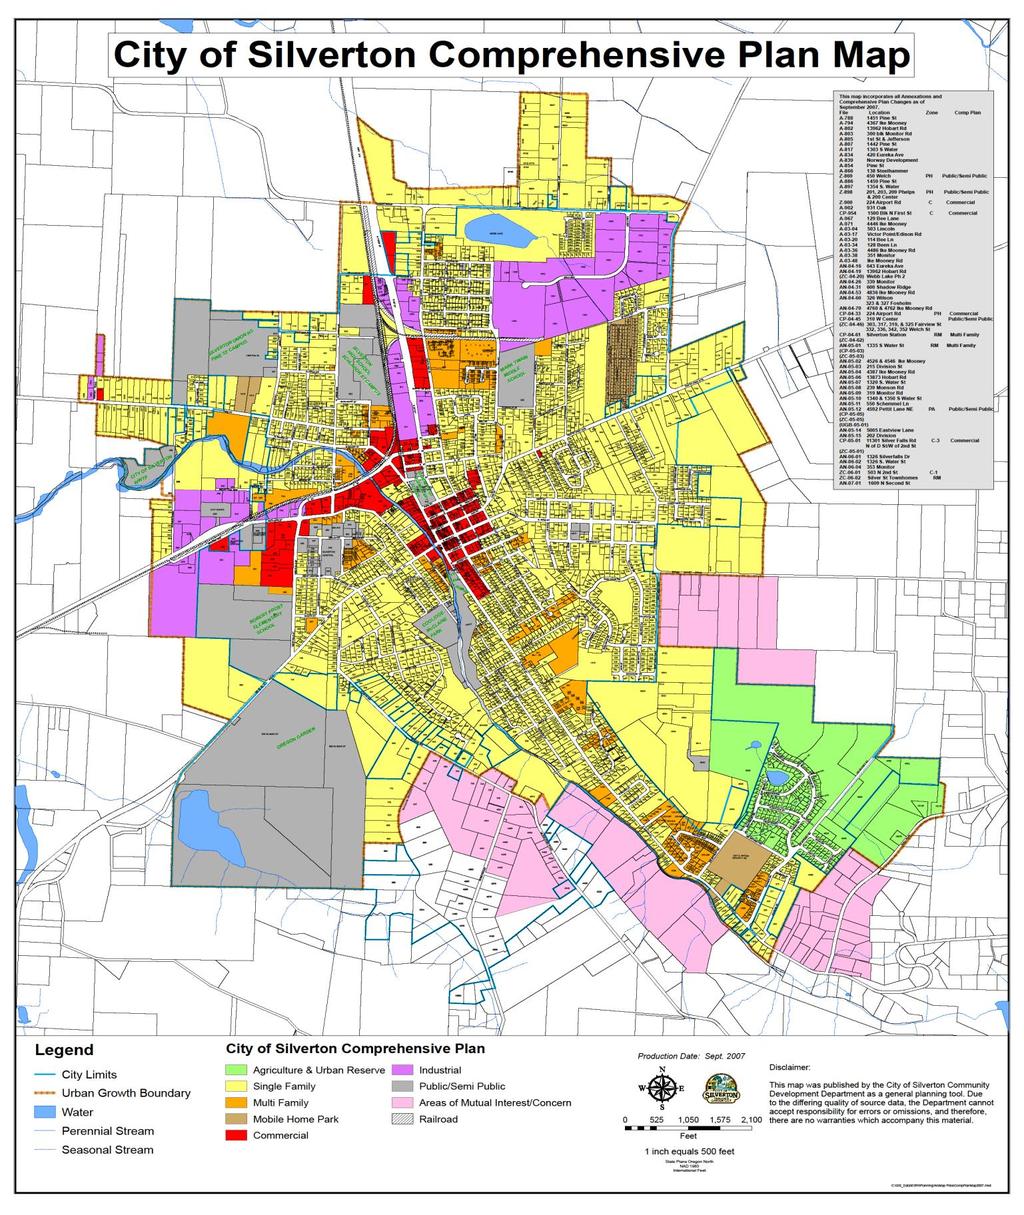
46 SECTION FOUR WATER SUPPLY ELEMENT Municipal Water Supply Element the water supply element shall include at least the following: 4.1 Delineation of Current and Future service areas: OAR (1) A delineation of the current and future service areas consistent with state land use law that includes available data on population projections and anticipated development consistent with relevant acknowledged comprehensive land use plans and urban service agreements or other relevant growth projections; The current area of service for the City of Silverton s boundaries correspond with the Marion County s Comprehensive Land Use Plan. Land use designations are classified into various descriptions that would resemble typical rural community setting. See Maps at the end of this section 4.2 Populations Projections: OAR (1) At the present time (2015), the City of Silverton is serving a population of 9,540 (3,000 connections) in an area approximately 3.5 square miles. Population estimates can be difficult to project since communities may experience both growth and decline. Three figures representing annual growth for the Silverton area are 1.3%, 1.5% and 1.92%, from the 2004 Water Management Conservation Plan, 2011 Water Master Plan (section 2.2) and Portland State University -Population Research Center, respectively. Using a median range, 1.57% annual growth rate was applied to the projected growth and potential completion of each water right, displayed in Table 1-7. These estimates use the U.S. Census Bureau average of 2.62 persons per connections. Total number of connections could reach 3,919 with a population estimate figured at 11,948 for the year Source: Portland State University Population Forecast for Marion County, 2008

47 Source: Portland State University Population Forecast for Marion County, 2008 Map shows UGB in yellow and extensive growth possibilities to the south-west of the City of Silverton. Water management and conservation planning will be based on a 20+ year term of identifying, sustaining, and improving the efficiency of supplying water. Taken from the existing records of consumption and population served, an estimated usage of 123 gallons per capita/day was averaged based on historical figures. Applying the average to the potential 11,900 consumers in year 2035, water production demands will increase by 20% from million gallons annually to million gallons annually, which converts to an additional 0.47cfs. 4.3 Schedule of Permit Usage: OAR (2) An estimated schedule that identifies when the water supplier expects to fully exercise each of the water rights and water use permits currently held by the supplier; Compiling data from Portland State University, Keller Associates, various state agencies and historical information, prediction for population estimates were factored to year 2035, based on annual growth of 1.57 percent annually. Carrying the estimates to year 2035, a total of 1.44 MGD can potentially become the average demand, using 123 gallons per day capita. In preparing a schedule that proves to fully exercise each water right, the City of Silverton is obligated to determine usage by forecasting and justifying the need for additional water. Using the calculations provided by the water system from the data covering January 2010 through December 2014, water demand estimates are based on population forecasts and gallons per capita per day.
48 Historically, the average per day consumption has been approximately 1.1 MGD or 123 gallons per capita daily. Maximum day demand has reached 3.06 MGD. The anticipated population growth, factored at 5 year intervals, will be multiplied by the maximum day demand and applied to the appropriate water use permit. The water supply source, under one permit and one certificate, currently allows for 15 cfs (12 with develop limitations) which are labeled municipal as beneficial use. Development limitations on permit S-3226 states 7.0 cfs until final order approving Water Management Conservation Plan. The City of Silverton has water rights that are greater than current usage. Table 4-2 outlines both the current usage, based on actual pumping records and the anticipated schedule, based on maximum daily demand, as to when the City of Silverton will apply a percentage or expect to fully exercise each of its water certificates and permits. Table 4-2: Permit Usage Forecast based on actual pumping records from January 2010 through December 2014 Permit Number S 3226 (Abiqua) S 622 (Silver Crk) S (Use of Stored H20) R (Storage) Totals Certificate Priority Date Use Allowable Rate NA 03/16/1911 M 10.0 cfs A 6.46 mgd 2400 * 03/16/1911 M 5.0 cfs 3.23 mgd NA 03/20/1973 M 1.79 cfs 1.16 mgd Pump Rate 3.55 cfs 2.3 MGD / 1,598 gpm 0.31 cfs 0.2 MGD /138 gpm 0.0 cfs 000 gpm NA 03/20/1973 M NA 0.0 cfs 000 gpm 15.0 cfs 3.86 cfs mgd 2.50 MGD / 1,736 gpm Source Abiqua Creek Silver Creek Silver Creek Silver Creek % of total allowed by permit % 0.06 % 0 % 0 % 23 % Year Population Notes: M municipal use, 1- Maximum water allowed by certificate / permit, 2 Average gallons diverted from 2010 through 2014 Usage Usage Total % All 1 Daily Daily Total Gals 2 cfs Permits Associated Permit S-3226 S-3226 S-622 S (based on max day) , MGD % % 43% 1.32 % 0 % , MGD % % 46% 1.36 % , MGD % % 47% 1.43 % , MGD % % 51% 1.49 % , MGD % % 55% 1.52 % Notes: 1 based on 1.57% growth annually, 2- forecast usage based on maximum daily demand at 189 gallons per capita/day, actual historical usage is approximately 123 gallons per day capita. 3 1,300 acre/feet per year at a rate up to 14 cfs. * - water right is certified. A - Development Limitation set at 7.0 cfs
49 4.4 Demand Forecast: OAR (3) Based on the information provided in section (1) of this rule, an estimate of the water supplier's water demand projections for 10 and 20 years, and at the option of the municipal water supplier, longer periods; The rate at which the City of Silverton will grow is founded on how the various classifications of users expand. In sub-section 4-2, it was estimated the service area could eventually serve a population of 11,900 by the year Based on a population of 11,900 multiplied by a maximum daily consumption of 189 gallons per capita/day, generates 2.25 MGD or 67.5 million gallons per month. Current raw water intakes have a combined total limited flow of 6.5 MGD equaling 4,513 GPM. Adjustment of the flow rate based on seasonal demands varies from 423 gallons per minute during winter to 1,828 gallons per minute during summer. The figures are based on the low and high months of pumping data from 2010 through 2014, Table 1-3 Table 4-3: Water Projection Demand City of Projected Year Silverton Million Gallons per Month Ave. Month Demand (2.77 cfs) 60.6 (3.12 cfs) 63.5 (3.27cfs) 66.3 (3.41cfs) 67.4 (3.48cfs) Peak Day Demand 2.8 (4.3 cfs) 3.0 (4.6 cfs) Note: 1-Based on maximum day demand at 189 gallons per day per capita 3.03 (4.7 cfs) 3.3 (5.1 cfs) 3.6 (5.5 cfs) Table 4-3 figures are estimates from Table 1-3, which are the comparison figures taken from the data collected from 2010 through Since these figures are taken from historical data, the estimates could be considered higher than current peak demand due to improved management of the water system through data controls, system replacement and procedural changes. 4.5 Comparison of Future Needs / Sources: OAR (4) A comparison of the projected water needs and the sources of water currently available to the municipal water supplier and to any other suppliers to be served considering the reliability of existing sources; Chart 4-1 provides the comparison of the projected water required consumption for the City of Silverton, which is 2.25 million gallons per day, (3.48 cfs; 1,562 GPM) based on maximum daily demand for the year Historically, ( ) Abiqua Creek has an estimated average flow in June of 101 cfs, while August is 8 cfs. Silver Creek maintains an estimated average flow of 24 cfs during the same period. Periods outside of the summer months, reveals no concerns of limited available water or minimum stream flows. The tables on pages indicate stream flow measurements for the period in time from 2004 through 2014.
50 CFS With City of Silverton s projected use at 3.48 cfs (5.5 cfs peak day), and the available two sources of water, and with 1,300 acre feet in storage on Silver Creek, the existing sources will be reliable. No other municipal suppliers are permitted to divert water within the city s point of use or point of diversion areas. (Research data taken from Oregon s Water Resource Department, Point of Diversion Summary Report.) Chart 4-1: Future Water Requirements: Water Rights Held Pump Capacity Water Usage YEARS 4.6 Expansion / Initial Diversions: OAR (5)(a) If any expansion or initial diversion of water allocated under existing permits is necessary to meet the need shown in section (3) of this rule, an analysis of alternative sources of water that considers availability, reliability, feasibility and likely environmental impacts. The analysis shall consider the extent to which the projected water needs can be satisfied through: (a) Implementation of conservation measures identified under OAR ; 1. Through implementation of conservation steps, (i.e. review of consumption cycles, rate settings, consumer informational packets, and meter calibration,) the City of Silverton has identified conservation measures that are both practical and feasible at this time. It is the goal of the City to lower the per capital consumption of water through conservation methods, prior to applying for additional water rights. Given the total amount of water rights, including the ability to exercise the use of water under permit S (associated with the reservoir on Silver Creek), the City of Silverton at this time is not seeking to addadditional water rights. The City s plan for their water rights include:permit R-5948 (storage of 1,300 acre-feet of water in Silverton Reservoir). The City plans to file a Claim of Beneficial Use (COBU) because this reservoir was built and filled to capacity in Permit S-3226 (surface water right on Abiqua Creek). The City plans to file a partial perfection Claim of Benefial Use for the capacity of the source water transmission line from the intake to the water treatment plant (4.8 mgd = 7.4 cfs). 4.7 Interconnections: OAR (5) (b) Interconnection with other municipal supply systems and cooperative regional water management; and
51 Presently, the City of Silverton does not have an inter-tie with any other public or private entities within the area due to the vicinity of neighboring water systems. In subsection 3.5 of Keller Associates Water Master Plan 2011 for the City of Silverton, there is mention of possible future water service to the City of Mt. Angel. No formal discussions have taken place as of the writing of this management and conservation plan. The City of Mt. Angel is approximately 3 miles to the north of the City of Silverton. The City of Silverton is a partner of the Pudding River Watershed Place-based Planning Group, which submitted a grant application to the Oregon Water Resources Department for funding under SB Cost Saving Measures: OAR (5) (c) Any other conservation measures that would provide water at a cost that is equal to or lower than the cost of other identified sources. At this time, the City of Silverton has not developed any other conservation measures that will affect the cost of supplying water. The primary focus in conservation efforts is to reduce the demand (see Table 2-2) on their existing supplies in order to maintain current sources. 4.9 Permit Diversions: OAR (6) If any expansion or initial diversion of water allocated under existing permits is necessary to meet the needs shown in section (3) of this rule, a quantification of the maximum rate and monthly volume of water to be diverted under each of the permits; No expansion of water allocated under existing permits is necessary for existing or future needs. Table 4-3 below shows usage rates as they relate to the permit or certificate. Also included are the single monthly maximum water diverted to date. Table 4-4: Permit Usage Rates Permit # Instantaneous Maximum Rate Allowed Daily Maximum Rate Allowed Monthly Maximum Quantity Allowed Monthly Maximum Diverted to Date 1 S cfs A 6.46 mgd MG MG S 622 * 5.00 cfs 3.23 mgd 96.9 MG MG S cfs 1.16 mgd 34.7 MG NA R (N/A) (N/A) Total cfs 9.6 mgd MG MG * - certified water right, 1 based on historical records , highest single month NA not applicable, A water right has development limitation at 7.0 cfs 4.10 Mitigation Actions: OAR (7) For any expansion or initial diversion of water under existing permits, a description of mitigation actions the water supplier is taking to comply with legal requirements including but not limited to the Endangered Species Act, Clean Water Act, Safe Drinking Water Act; and
52 The City of Silverton has placed additional emphasis towards mitigating actions, such as system enhancements, (i.e. intake screen with backflow capabilities), study and review of water shed characteristics, and SCADA telemetry. These actions are considered in an effort to better understand the management of the resource. The City s goal is to maintain the high quality of water in both Abiqua and Silver Creeks. The city will certainly consider the idea of participating in regional water supply planning activities New Water Rights: OAR (8) If acquisition of new water rights will be necessary within the next 20 years to meet the needs shown in section (3) of this rule, based on the information provided in section (1) of this rule, (1) A delineation of the current and future service areas consistent with state land use law that includes available data on population projections and anticipated development consistent with relevant acknowledged comprehensive land use plans and urban service agreements or other relevant growth projections; an estimate of the water supplier's water demand projections for 10 and 20 years, and at the option of the municipal water supplier, longer periods) an analysis of alternative sources of the additional water that considers availability, reliability, feasibility and likely environmental impacts and a schedule for development of the new sources of water. The analysis shall consider the extent to which the need for new water rights can be eliminated through: Under Marion County s Land Use Comprehensive Plan, the zoning classifications established the water service area for the City of Silverton. Data from the various entities, (i.e. Portland State University) indicated future annual averaged growth rate at 1.57% through 2035 or a total approximate population of 11,900 for the year Evidence (flow data) of the current source proves adequate supply for probable future requirements in terms of quantity. There has been no investigation of alternative sources for additional water by the City. The City of Silverton, through discussions with current management personnel, is ever mindful of the reliability, adequacy, and impact water has to sustain a community, both locally and regionally. Data compiled in this plan indicates that there will be no need to acquire new water rights in the future. Access to an additional 3.0 cfs of Greenlight water under permit S-3226 on Abiqua Creek for future demands will be made when the City s demand for more water becomes apparent Greenlight Water Request: OAR (7): if during the next 20 years a water supplier will need to divert water under an extended permit at a maximum rate of diversion that is greater than the maximum rate of diversion authorized under a final order approving the permit extension of time or a previous WMCP, the water supplier must document that the WMCP includes: a schedule for implementation of lower cost conservation measures; [except in those circumstances described in OAR (7)(a)];
53 For existing extended water use permits that are conditioned with Development Limitations, a WMCP provides the basis and justification for OWRD to approve a request for Greenlight Water. OWRD s criteria for approving Greenlight Water requests, the City of Silverton, based on the assumption of predicted growth, the need to divert water under the extended permit at the maximum rate will be slightly greater than the rate authorized (7.0 cfs) (additional 3.0 cfs as Greenlight Water ) under the final order approving this water management conservation plan. See table 4-3 Water Projection Demand for total quantities predicted. The City of Silverton understands the Development Limitation established by the Final Order Extension for current use under Permit S-3226 to be capped at no more than 7.0 cfs. The City of Silverton also understands that diversion of water beyond 7.0 cfs shall only be authorized upon issuance of a final order approving this water management and conservation plan. Regarding the development limitation on permit # S (Silverton Reservoir) at 200 acre feet, according to the Conditions listed on said permit: Diversion of stored water from Silver Creek Reservoir (constructed under Permit #R5948) beyond AF under Permit #S shall only be authorized upon issuance of a final order approving a Water Management and Conservation Plan under OAR Chapter 690, Division 86. The City believes additional water beyond the AF is available, and will be used for emergency shortage needs. The City of Silverton will correspond with Oregon Water Resources to announce any changes or requests pertaining to diversion of water if necessary. It will be at the time of either evolving into the need for more water (proven with data) or the completion of a future WMCP, that the City of Silverton will request access to greenlight water OAR (7)(a): justification that the selected source is the most feasible and appropriate supply alternative; and whether the supplier is complying with mitigation requirements to address development of permits with identified environmental resource issues under OAR (5)(i), if any. The City of Silverton and its current source is the most feasible and appropriate supply and has not considered an alternative supply source. The City of Silverton is complying with all mitigation actions under state or federal law in relation to development of its permits for which environmental resource issues are identified under OAR (5)(i) OAR (7)(b): Increased use from the source is the most feasible and appropriate water supply alternative available to the supplier. The City of Silverton due to its proximity to the limited ground water area, (declining wells) both the Abiqua, Silver Creeks and Silverton Reservoir are the most appropriate supply, and the City is not currently looking for an alternative to their current supply OAR (7)(c): If mitigation is legally required to address limitations or restrictions on the development of permits for which resource issues are identified under OAR (5)(i), the plan contains documentation that the supplier is complying with the
54 mitigation requirements. The Department may consult with federal and state agencies in making this determination. Resource issues identified with the sources include the presence of sensitive, threatened and endangered, listed stream flow dependent species, as outlined in Table 1-8 Endangered Species. Research on both Abiqua and Silver Creeks indicate no minimum instream flows for protection of fish habitat, maintain the persistence of listed fish species and/or water withdrawal restrictions Due to the low summer flows for Abiqua Creek, one discussion proposed for future decision making is an enhanced review of stream flows, and rotating the divergence of water between the sources of Abiqua and Silver Creeks. Currently approximately 92 percent of diverted water for the City of Silverton is from Abiqua Creek. The rotation of sources is primarily based on the sufficiency of water flow (less decline) in Silver Creek in comparison to Abiqua Creek. The City of Silverton is complying with all mitigation requirements and this water management and conservation plan documents such requirements Identified Conservation Methods: OAR (8) (a) Implementation of conservation measures identified under OAR ; At present, the City of Silverton will sustain their efforts towards implementing conservation practices through the following steps a) consumer awareness, b) water system operations, c) education information, and d) possible replacement of existing inefficient water using fixtures with low flow devices Regional Management: OAR (8) (b) Interconnection with other municipal supply systems and cooperative regional water management; and At this time the City of Silverton is and will continue to be a proponent in regional water management. One goal of regional management is fostering good relationships with the communities within the watershed and exchanging ideas to sustain the resources currently available. Discussions with utilities in the watershed are beneficial and educational and the City welcomes the opportunity. One recommendation is developing annual meetings with other water systems within the immediate area for general discussions inviting local area experts to update enhanced (scientific) understanding of the present and future sustainability of the regional resources. These steps should yield valuable information to assist in better management practices of resources resulting in maintaining available waters, reliability, and environmental impacts. The City of Silverton is a partner of the Pudding River Watershed Place-based Planning Group, which submitted a grant application to the Oregon Water Resources Department for funding under SB Cost Appropriations: OAR (8) (c) Any other conservation measures that would provide water at a cost that is equal to or lower than the cost of other identified sources.
 will not require the acquisition of additional d water rights.")


55 Currently and future speculations, the City of Silverton, with their available water rights at 15 cubic feet per second (see Table 1-2, on page 5) will not require the acquisition of additional d water rights. The City of Silverton will focus on maintaining existing water sources through continued efforts from a managerial practice. Long term benefits of these endeavors will keep the City from having to look at additional sources and will be substantially less expensive than developing new sources. A map depicting a portion of Marion County Rural Zoning Map Section 24 Rural Zoning Map Legend Marion County Rural Zoning Section 25 Map showing a portion of Section 34. Maps provided by Marion County Rural Zoning Map Index. The maps above show the related areas of land use zoning for the City of Silverton in conjunction with the Marion County Rural Zoning Maps. Only the portion relevant to the City of Silverton is shown from Sections 24, 25, and 34.
56 SECTION FIVE OTHER ITEMS 5.1 Affected Local Governments: (5) A list of the affected local governments to whom the draft plan was made available pursuant to OAR (6) and a copy of any comments on the plan provided by the local governments; The City of Silverton provided a copy of this water management and conservation plan to Marion County (Planning Department) 5.2 Updated Plan Submittal: (6) A proposed date for submittal of an updated plan within no more than 10 years based on the proposed schedule for implementation of conservation measures, any relevant schedules for other community planning activities, and the rate of growth or other changes expected by the water supplier; or an explanation of why submittal of an updated plan is unnecessary and should not be required by the Department; and Following regulations OAR (6) City of Silverton is proposing to submit an updated conservation plan within ten years of the final order approving this plan. The City understands as changes occur with system improvements or pumping capacity. This will necessitate a review every five years by the Public Works Director and staff. Conservation and water use practices are constantly evolving. Table 2.1 will be reviewed annually by assigned administrative staff, enabling the City to determine progress of the management conservation plan. All efforts towards management and conservation will be noted and retained for the progress report which will be submitted every five years by City of Silverton. The next progress report will be due by the January of Additional Time: (7) If the municipal water supplier is requesting additional time to implement metering as required under OAR (4)(b) or a benchmark established in a previously approved plan, documentation showing additional time is necessary to avoid unreasonable and excessive costs. The City of Silverton is a fully metered water system and will not need additional time to implement metering as required by OAR (4)(b).
57 Appendices: Watershed Characteristics Abiqua Creek > Pudding River at Mouth Latitude of Outlet degrees Longitude of Outlet degrees Latitude of Centroid degrees Longitude of Centroid degrees Drainage Area square miles Stream Length miles Perimeter miles Lakes and Ponds percent Area/Perimeter unitless Maximum Relief 3999 feet Mean Slope degrees Average Aspect degrees Mean Elevation 1604 feet Area above 3000 ft percent Area above 4000 ft percent Area above 5000 ft 0.0 percent Area above 6000 ft 0.0 percent Mean Annual Precip inches Mean Annual Min Temp inches Mean January Min Temp degrees Fahrenheit Mean February Min Temp degrees Fahrenheit Mean March Min Temp degrees Fahrenheit Mean April Min Temp degrees Fahrenheit Mean May Min Temp degrees Fahrenheit Mean June Min Temp degrees Fahrenheit Mean July Min Temp degrees Fahrenheit Mean August Min Temp degrees Fahrenheit Mean September Min Temp degrees Fahrenheit Mean October Min Temp degrees Fahrenheit Mean November Min Temp degrees Fahrenheit Mean December Min Temp degrees Fahrenheit
58 Watershed Characteristics Silver Creek > Pudding River at Mouth Latitude of Outlet degrees Longitude of Outlet degrees Latitude of Centroid degrees Longitude of Centroid degrees Drainage Area square miles Stream Length miles Perimeter miles Lakes and Ponds percent Area/Perimeter unitless Maximum Relief 3468 feet Mean Slope degrees Average Aspect degrees Mean Elevation 1558 feet Area above 3000 ft percent Area above 4000 ft 0.0 percent Area above 5000 ft 0.0 percent Area above 6000 ft 0.0 percent Mean Annual Precip inches Mean Annual Min Temp inches Mean January Min Temp degrees Fahrenheit Mean February Min Temp degrees Fahrenheit Mean March Min Temp degrees Fahrenheit Mean April Min Temp degrees Fahrenheit Mean May Min Temp degrees Fahrenheit Mean June Min Temp degrees Fahrenheit Mean July Min Temp degrees Fahrenheit Mean August Min Temp degrees Fahrenheit Mean September Min Temp degrees Fahrenheit Mean October Min Temp degrees Fahrenheit Mean November Min Temp degrees Fahrenheit Mean December Min Temp degrees Fahrenheit
 or distinct")

59 CHINOOK / STEELHEAD CRITICAL HABITAT TRIBUTARIES Federal Register Vol. 70, page 52630, September 2, 2005 for 12 evolutionarily significant units (ESU) or distinct population segments (DPS)of Pacific salmon (Chinook, chum, and sockeye) and steelhead in Oregon
60
61
62
63
64
65
66
67
68
69
70
71
72
73
74
75
76
77
78
79
80
81
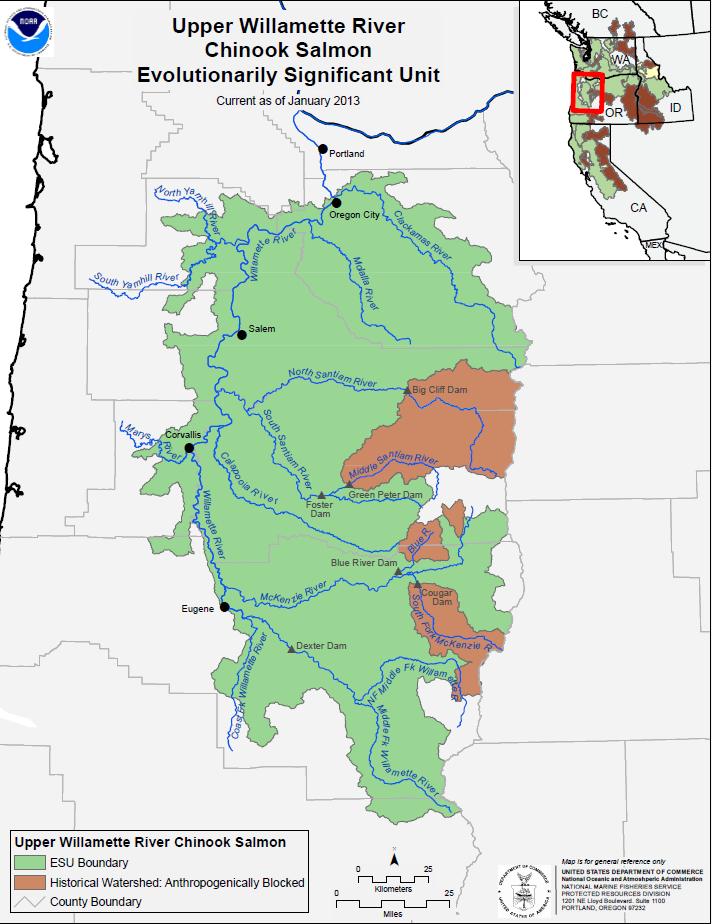
82
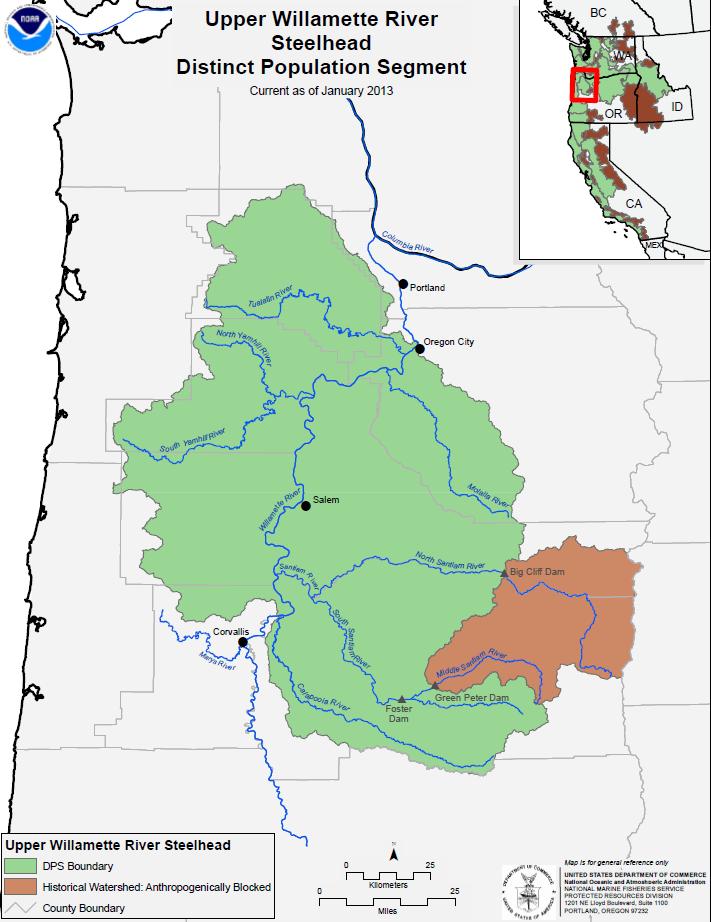
83
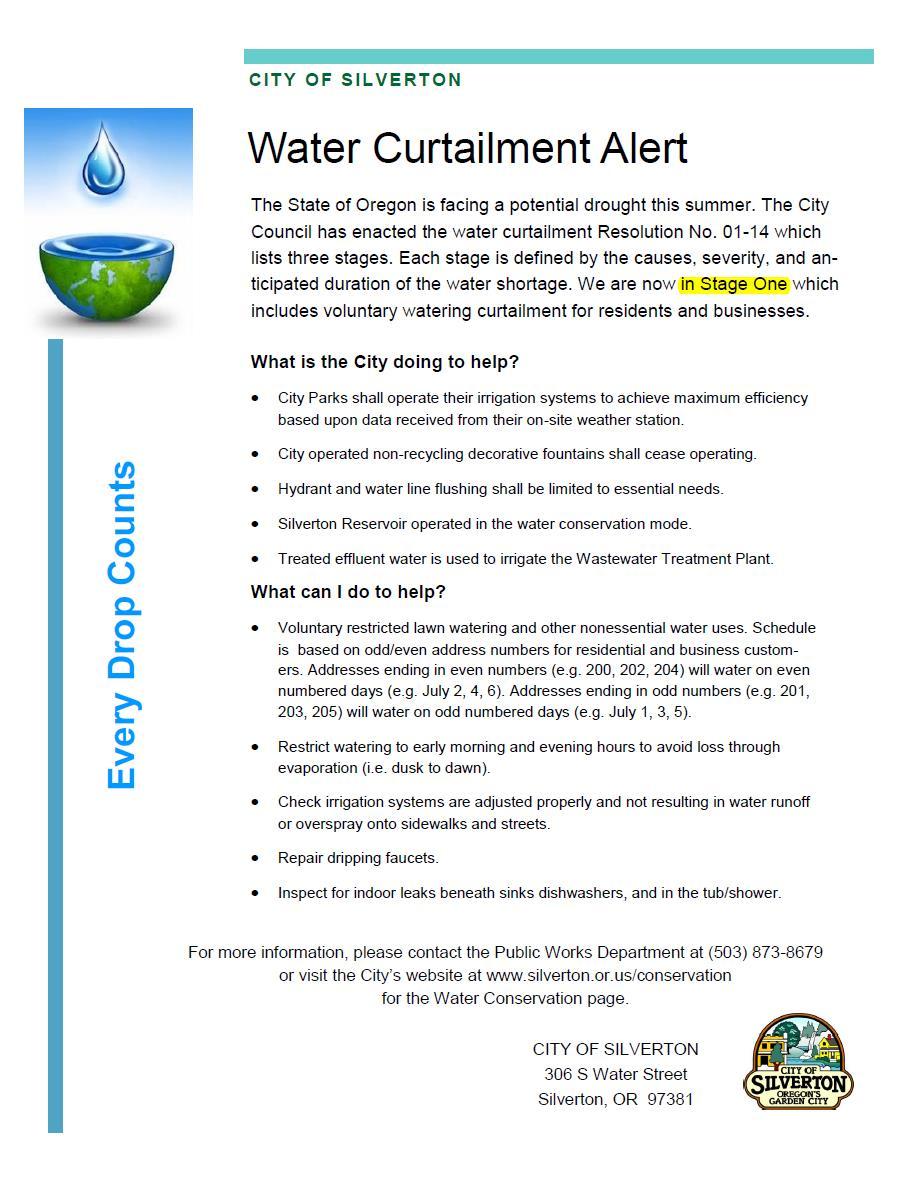
84
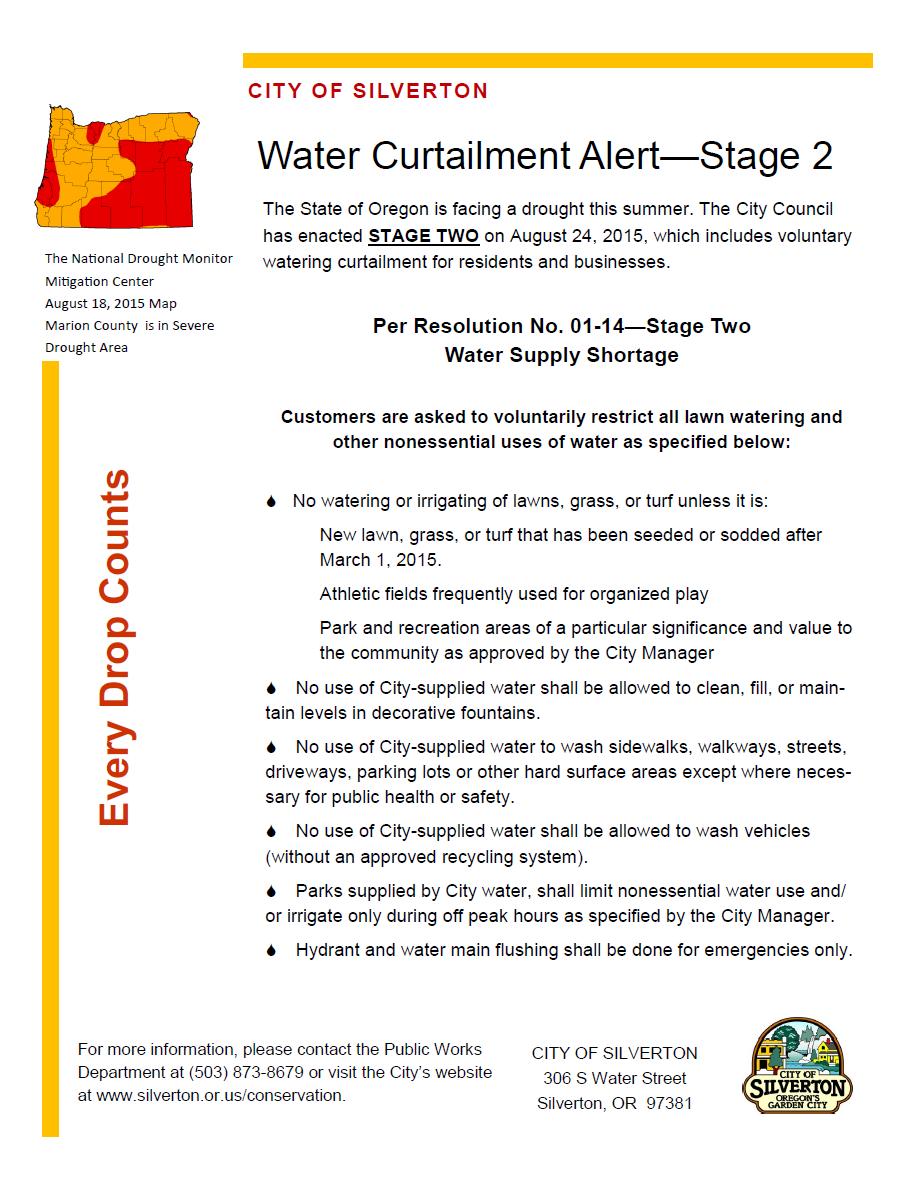
85
Water Management and Conservation Plan
 Water Management and Conservation Plan Prepared for: City of Silverton 306 S. Water St. Silverton, OR. 97381 Approved by City Council February 1, 2016 Prepared by: Oregon Association of Water Utilities
CITY OF ROSEBURG LONG-RANGE WATER SUPPLY PLAN
 FILE COpy CITY OF ROSEBURG LONG-RANGE WATER SUPPLY PLAN Project No. 06WA23 July 2009 In Association With: LONG-RANGE WATER SUPPLY PLAN FOR CITY OF ROSEBURG, OREGON JULY 2009 Expires 613012010 Prepared
CONSERVATION PLAN April 2009
 CONSERVATION PLAN April 2009 1. INTRODUCTION AND OBJECTIVES Water supply has always been a key issue in the development of Texas. In recent years, the growing population and economic development of North
CITY OF LAGRANGE, GEORGIA UTILITY DEPARTMENT WATER CONSERVATION AND DROUGHT CONTINGENCY PLANS
 CITY OF LAGRANGE, GEORGIA UTILITY DEPARTMENT WATER CONSERVATION AND DROUGHT CONTINGENCY PLANS Modified: May 2012 WATER CONSERVATION PLAN SYSTEM MANAGEMENT AND SALES Permit Information. The City of LaGrange
Conn. Agencies Regs d-2 Preparation of plans and schedule for submission
 As of February 1, 2012 Conn. Agencies Regs. 25-32d-2 Preparation of plans and schedule for submission (a) Each water company supplying water to 1,000 or more persons or 250 or more consumers, and any other
Springfield Utility Board, Oregon Rainbow Water District, Oregon
 WATER MANAGEMENT AND CONSERVATION PLAN Springfield Utility Board, Oregon Rainbow Water District, Oregon August 2012 WATER MANAGEMENT AND CONSERVATION PLAN FOR SPRINGFIELD UTILITY BOARD AND RAINBOW WATER
5.0 Water Supply Element
 5.0 Water Supply Element The 2012 Wilsonville Water System Master Plan covers a 20-year planning period from 2010 to 2030. The following pages of this chapter summarize pertinent information contained
CHAPTER SEVEN: UTILITIES
 CHAPTER SEVEN: UTILITIES 7.1 Introduction The Water Works Board of the City of Auburn (AWWB) is the primary potable water service provider for the City of Auburn (City) and Auburn University. There are
Exhibit 1 City of Lake Oswego WMCP Progress Report Progress Report for Benchmarks Listed in the 2007 WMCP (Appendix E: Matrix 1 and 2)
") Exhibit 1 Progress Report for Benchmarks Listed in the 2007 WMCP (Appendix E: Matrix 1 and 2) Item Status 1. Water Audit Results of the annual water audit can be found in exhibits 3 and 4. The City records
Exhibit 1 Progress Report for Benchmarks Listed in the 2007 WMCP (Appendix E: Matrix 1 and 2) Item Status 1. Water Audit Results of the annual water audit can be found in exhibits 3 and 4. The City records
FINAL DRAFT WATER MANAGEMENT AND CONSERVATION PLAN. Canby Utility. June DRAFT
 FINAL DRAFT WATER MANAGEMENT AND CONSERVATION PLAN Canby Utility June 2010 - DRAFT WATER MANAGEMENT AND CONSERVATION PLAN FOR CANBY UTILITY JUNE 2010 FINAL DRAFT Prepared by: 09-1067.408 MURRAY, SMITH
Water Conservation Plan
 Water Conservation Plan Adopted April 21, 2014 Town Manager: Mike Slye Town of Trophy Club 100 Municipal Drive Trophy Club, TX 76262 (682) 831-4610 Town of Trophy Club Public Improvement District Public
TITLE 9. ENVIRONMENT STATE WATER CONTROL BOARD
 November 2, 2005 TITLE 9. ENVIRONMENT STATE WATER CONTROL BOARD Title of Regulation: 9 VAC 25-780. Local and Regional Water Supply Planning (adding 9 VAC 25-780-10 through 9 VAC 25-780-190). Statutory
3. Water Conservation Program
 3. Water Conservation Program The City of Tumwater s conservation program consists of both independent and regional cooperative efforts. Tumwater partners with the LOTT Alliance, the regional wastewater
2.0 Description of Wilsonville s Water System
 2.0 Description of Wilsonville s Water System 2.1 SOURCES The City s primary water supply is treated water from the Willamette River. As a back-up supply, the City has maintained eight wells capable of
CHAPTER SEVEN: UTILITIES
 CHAPTER SEVEN: UTILITIES 7.0 Introduction T he Water Works Board of the City of Auburn (AWWB) is the primary potable water service provider for the City of Auburn (City) and Auburn University. There are
Water Management and Conservation Plan
 Water Management and Conservation Plan May 2013 Prepared for City of Redmond, Oregon Prepared by Contents Executive Summary... ES-1 Description of Municipal Water Supplier... ES-1 Water Conservation...
Water Management and Conservation Plan
 Water Management and Conservation Plan March 2009 Water Management and Conservation Plan March 2009 CVO\082060036 Contents Section Page 1 Introduction...1-1 Overview...1-1 Plan Organization...1-3 Affected
Water Management and Conservation Plan. LEE-PACE Project Number Revised June Prepared by:
 City of Sweet Home Water Management and Conservation Plan LEE-PACE Project Number 3415 Revised June 2006 Prepared by: L E E - P A C E E N G I N E E R S 1300 John Adams St. Oregon City, OR 97045 (503) 655-1342
The PUD Supply-Side conservation program consists of the two (2) measures listed below.
 measures listed below.") WATER USE EFFICIENCY The State of Washington Department of Health (DOH) revised water conservation planning requirements as a result of the 2003 Municipal Water Law. An outgrowth of that law is the Water
WATER USE EFFICIENCY The State of Washington Department of Health (DOH) revised water conservation planning requirements as a result of the 2003 Municipal Water Law. An outgrowth of that law is the Water
Table of Contents Part Title Page
 Table of Contents Part Title Page 1 System Information 1 2 Rate Structure 1 3 Conservation Goals 2 4 Implementation and Tracking 3 5 Conservation Measures 4 Appendix A Appendix B Appendix C Utility Profile
ORDINANCE NO NOW, THEREFORE, BE IT ORDAINED BY THE CITY COUNCIL OF THE CITY OF GARLAND, TEXAS: SECTION 1
 ORDINANCE NO. 6781 AN ORDINANCE AMENDING CHAPTER 51, "GENERAL UTILITY PROVISIONS", OF THE CODE OF ORDINANCES OF THE CITY OF GARLAND, TEXAS; PROVIDING A PENALTY CLAUSE, A SAVINGS CLAUSE, AND A SEVERABILITY
4.2 Step 2 Profile of Water Demands and Historical Demand Management
 4.2 Step 2 Profile of Water Demands and Historical Demand Management Step 2 involves an overview of the historical water demand trends as well as the influence of historical water demand management on
Water Conservation Plan
 Water Conservation Plan Page 1 of 11 1 Water Conservation Plan for the City of Lawrence TABLE OF CONTENTS INTRODUCTION 3 WATER CONSERVATION PLAN. 4 LONG TERM WATER USE EFFICIENCY 4 Water Use Conservation
National Water Demand Management Policy
 National Water Demand Management Policy Introduction In 1997, the Ministry of Water and Irrigation developed Jordan s Water Strategy and the following four policies, which include: Water Utility Policy;
Agua Special Utility District (Agua SUD) Water Conservation Plan
 Water Conservation Plan") Agua Special Utility District (Agua SUD) Prepared by Agua Special Utility District 3201 North Abram Palmview, Texas 78572 TABLE OF CONTENTS 1. INTRODUCTION Brief Description of the Project and Planning
Agua Special Utility District (Agua SUD) Prepared by Agua Special Utility District 3201 North Abram Palmview, Texas 78572 TABLE OF CONTENTS 1. INTRODUCTION Brief Description of the Project and Planning
Contents 8/31/2017 DRAFT REGIONAL IMPACT FEE FACILITIES PLAN & ANALYSIS
 Contents Executive Summary... 2 Introduction... 2 Impact Fee Facilities Plan and Impact Fee Analysis... 2 Level of Service... 2 Excess Capacity Used by New Development... 3 Building Facilities for New
Chris Kowitz. Oregon s Water Management and Conservation Plan Program A Tool for Understanding Current and Future Water Needs
 Oregon s Water Management and Conservation Plan Program A Tool for Understanding Current and Future Water Needs Chris Kowitz Water Management and Conservation Analyst Oregon Water Resources Department
Water Management and Conservation Plans. A Guidebook for Oregon Municipal Water Suppliers
 Water Management and Conservation Plans A Guidebook for Oregon Municipal Water Suppliers M a y 2 0 0 3 Water Management and Conservation Plans A Guidebook for Oregon Municipal Water Suppliers M a y 2 0
City of Richland Comprehensive Water System Plan
 City of Richland June 2010 RH2 Engineering, Inc 114 Columbia Point Drive, Suite C Richland, WA 99352 Contact: Paul R. Cross, P.E. (509) 946-5181 Prepared by: June 2010 Signed: 6/28/2010 Signed: 6/28/2010
Water Use Efficiency Program 2019 Update
 Water Use Efficiency Program 2019 Update INTRODUCTION The City of Enumclaw recognizes that water is a valuable and essential natural resource that needs to be used wisely. This program provides an approach
CHAPTER SEVEN: UTILITIES
 CHAPTER SEVEN: UTILITIES 7.1 Introduction T he Water Works Board of the City of Auburn (AWWB) is the primary potable water service provider for the City of Auburn (City) and Auburn University. There are
Overview of Local Facilities. Integrated Resource Planning Advisory Committee
 Overview of Local Facilities Integrated Resource Planning Advisory Committee City of Henderson Utility Services System Overview 2 CITY OF HENDERSON Department of Utility Services The Department of Utility
Water Management and Conservation Plan
 Water Management and Conservation Plan Prepared for Kernville-Gleneden Beach-Lincoln Beach Water District January 2006 Prepared by Executive Summary Kernville-Gleneden Beach-Lincoln Beach Water District
CERTIFICATION AND FINANCING PROPOSAL
 DRINKING WATER SYSTEM IMPROVEMENTS PROGRAM: METER REPLACEMENT SUNLAND PARK, NM Submitted: April 12, 2013 DRINKING WATER SYSTEM IMPROVEMENT PROGRAM: METER REPLACEMENT SUNLAND PARK, NEW MEXICO TABLE OF CONTENTS
UrbanSAT- Urban System Analysis Tool : For delivering urban water balancing and reporting
 19th International Congress on Modelling and Simulation, Perth, Australia, 12 16 December 2011 http://mssanz.org.au/modsim2011 UrbanSAT- Urban System Analysis Tool : For delivering urban water balancing
UWMP Standardized Tables. City of Hawthorne District Urban Water Management Plan Appendix H
 UWMP Standardized Tables City of Hawthorne District 2015 Urban Water Management Plan Appendix H Table 2-1 Retail Only: Public Water Systems Public Water System Number Public Water System Name Number of
UWMP Standardized Tables. Livermore District Urban Water Management Plan Appendix H
 UWMP Standardized Tables Livermore District 2015 Urban Water Management Plan Appendix H Table 2-1 Retail Only: Public Water Systems Public Water System Number Public Water System Name Number of Municipal
Santa Cruz Water Department: Water Resources, Conservation, and Water Shortage Contingency Plan. Santa Cruz Neighbors February 18, 2009
 Santa Cruz Water Department: Water Resources, Conservation, and Water Shortage Contingency Plan Santa Cruz Neighbors February 18, 2009 Presentation Overview Overview of City s Water Supply System Challenges
Water Audit and Water Loss Abatement Program
 Water Audit and Water Loss Abatement Program Background Every gallon of water lost or wasted due to system inefficiencies comes at an increasing cost to our communities and natural resources. Water audits
IMPLEMENTING THE PERFECT LONG TERM WATER SUPPLY STRATEGY FOR BEND, OREGON
 IMPLEMENTING THE PERFECT LONG TERM WATER SUPPLY STRATEGY FOR BEND, OREGON 2016 AWWA Regional Conference Boise, ID Patrick Griffiths City of Bend Water Resources Manager ALTERNATE TITLE: A FUNNY THING HAPPENED
Outlines for Water Saving Practices in Kuwait
 Outlines for Water Saving Practices in Kuwait M. Al-Senafy, A. Al-Khalid, A.Mukhopadhyay and K. Al-Fahad Water Resources Division Kuwait Institute for Scientific Research Introduction The increasing imbalance
UWMP Standardized Tables. Palos Verdes District Urban Water Management Plan Appendix H
 UWMP Standardized Tables Palos Verdes District 2015 Urban Water Management Plan Appendix H Table 2-1 Retail Only: Public Water Systems Public Water System Number Public Water System Name Number of Municipal
SILVER LAKE WATER & SEWER DISTRICT
 SILVER LAKE WATER & SEWER DISTRICT OBJECTIVE WATER USE EFFICIENCY PROGRAM The objectives of this document are to identify the conservation and water use efficiency requirements pertaining to the Silver
PROGRESS REPORT WATER MANAGEMENT AND CONSERVATION PLAN
 PROGRESS REPORT WATER MANAGEMENT AND CONSERVATION PLAN Prepared for Washington County, Oregon AU GUS T 2015 Prepared by This page intentionally left blank. Table of Contents Executive Summary... ES-1
UWMP Standardized Tables. Dominguez District Urban Water Management Plan Appendix H
 UWMP Standardized Tables Dominguez District 2015 Urban Water Management Plan Appendix H Table 2-1 Retail Only: Public Water Systems Public Water System Number Public Water System Name Number of Municipal
UWMP Standardized Tables. King City District Urban Water Management Plan Appendix H
 UWMP Standardized Tables King City District 2015 Urban Water Management Plan Appendix H Table 2-1 Retail Only: Public Water Systems Public Water System Number Public Water System Name Number of Municipal
Summary of KPUD s Water Use Efficiency Program and Proposed Future Water Efficiency Goals December, 2013
 Summary of KPUD s Water Use Efficiency Program and Proposed Future Water Efficiency Goals December, 2013 Introduction This document is a summary of Kitsap Public Utility District (KPUD) Water Use Efficiency
CHAPTER 4 SYSTEM DESIGN CRITERIA
 INTRODUCTION CHAPTER 4 SYSTEM DESIGN CRITERIA Adequate design of the District s wastewater conveyance facilities requires the determination of the quantity of wastewater from contributing sources. The
Overview of Drinking Water Regulations
 Overview of Drinking Water Regulations REGULATIONS William (Bill) Sullivan, Sanitary Engineer 3 Connecticut Department of Public Health Enforcement & Compliance Unit Purpose and Authority The Regulations
Overview and Background Information. Tualatin Valley Water District
 Overview and Background Information Introduction The ( TVWD or the District ) is in the process of conducting a comprehensive rate study. As a part of the process, TVWD has formed a Rate Advisory Committee
Water Management and Conservation Plan
 Water Management and Conservation Plan Prepared for City of Salem, Oregon November 2014 Prepared by This page left intentionally blank. Table of Contents EXECUTIVE SUMMARY... ES-1 Description of Municipal
Table of Contents. Executive Summary..pg Notice to Affected Local Governments.pg Proposed WMCP Update Schedule...pg 5
 Arch Cape Domestic Water Supply District Water Management and Conservation Plan FINAL DRAFT, December 2015 Table of Contents Executive Summary..pg 4 SECTION 1: WMCP Plan Elements 1.1 Notice to Affected
CHAPTER 2 TECHNICAL APPROACH 2 TECHNICAL APPROACH
 CHAPTER 2 TECHNICAL APPROACH 2 TECHNICAL APPROACH The approach used in the update of the County of Hawaii WUDP was documented in the Project Description, as required by the Framework. The Project Description
Water Supply and Water Conservation Management Plan
 Water Supply and Water Conservation Management Plan May 2009 Prepared By: AECOM Metropolitan North Georgia Water Planning District [This page intentionally left blank] Water Supply and Water Conservation
MUNICIPAL WATER CONSERVATION PLAN FOR THE CITY OF CHANUTE JUNE 2010
 MUNICIPAL WATER CONSERVATION PLAN FOR THE CITY OF CHANUTE JUNE 2010 Municipal Water Conservation Plan For the City of Chanute TABLE OF CONTENTS INTRODUCTION LONG TERM WATER USE EFFICIENCY Water Use Conservation
UWMP Standardized Tables. Los Altos Suburban District Urban Water Management Plan Appendix H
 UWMP Standardized Tables Los Altos Suburban District 2015 Urban Water Management Plan Appendix H Table 2-1 Retail Only: Public Water Systems Public Water System Number Public Water System Name Number of
DROUGHT CONTINGENCY PLAN
 DROUGHT CONTINGENCY PLAN NUECES COUNTY WATER CONTROL AND IMPROVEMENT DISTRICT #3 501 E. MAIN ST. PO BOX 1147 ROBSTOWN, TX 78380 (361) 387-4549 (Adopted September 10, 1991, revised July 11, 2005, July 29,
Executive Directive #5 Issue Date: October 14, 2014 Subject: Emergency Drought Response Creating a Water Wise City Introduction Los Angeles and
 Executive Directive #5 Issue Date: October 14, 2014 Subject: Emergency Drought Response Creating a Water Wise City Introduction Los Angeles and California as a whole are currently experiencing extreme
UWMP Standardized Tables. Salinas District Urban Water Management Plan Appendix H
 UWMP Standardized Tables Salinas District 2015 Urban Water Management Plan Appendix H Table 2-1 Retail Only: Public Water Systems Public Water System Number Public Water System Name Number of Municipal
Chapter 6 Population Forecast and Projections of Water Demand, Peak Day Requirements and Wastewater Flow
 Chapter 6 Population Forecast and Projections of Water Demand, Peak Day Requirements and Wastewater Flow Purpose and Scope This chapter uses the Washoe County Consensus Population Forecast (Washoe County,
Raw water sources, facilities, and infrastructure
 WATER AND WASTEWATER SERVICES IN STEAMBOAT SPRINGS Prepared by Jay Gallagher, General Manager Mt. Werner Water and Sanitation District (February, 2015) Raw water sources, facilities, and infrastructure
SECTION 13 REGIONAL WASTEWATER PLANNING
 SECTION 13 REGIONAL WASTEWATER PLANNING 13.1 Introduction Regional wastewater planning is needed with the expected growth in Caldwell County. Evaluation of several options regarding collection treatment
ANNUAL REPORT
 . ANNUAL REPORT 2016-2017 City of Santa Rosa City of Rohnert Park City of Petaluma City of Sonoma City of Cotati North Marin Water District Valley of the Moon Water District Marin Municipal Water District
3F. Hydrology and Water Quality
 This section provides an analysis of potential hydrological and water quality impacts associated with implementation of the proposed project. The section also evaluates and describes the potential impacts
Subsequent to these early efforts, the complexities associated with potable water provision have increased significantly.
 10.1 INTRODUCTION The reliable supply, treatment and distribution of potable water is vital to the health, safety and welfare of urban areas. The citizens and officials of the have long been involved with
Water Supply FAQ August 11, 2015
 Water Supply FAQ August 11, 2015 1) What s the latest information on water supply? After the driest May-July on record, and in preparation of a potentially drier-than-normal fall, Tacoma, along with Everett
Volume 1 Executive Summary
 2013 Cheyenne Water and Wastewater Master Plans Final November 27, 2013 Prepared for: City of Cheyenne Board of Public Utilities 2416 Snyder Ave. Cheyenne, WY 82001 Prepared by: HDR Engineering AMEC Earth
APPENDIX L MODEL WATER CONSERVATION PLANS FOR MUNICIPAL AND NON MUNICIPAL USE
 APPENDIX L MODEL WATER CONSERVATION PLANS FOR MUNICIPAL AND NON MUNICIPAL USE APPENDIX L MODEL WATER CONSERVATION PLANS FOR MUNICIPAL AND NON MUNICIPAL USE Appendix L includes one model municipal and
Chapter Nine, Potable Water Subelement City of St. Petersburg Comprehensive Plan
 POTABLE WATER SUBELEMENT Chapter Nine, Potable Water Subelement Sections: 9.1.1 INTRODUCTION 9.1.2 GOAL, OBJECTIVES AND POLICIES ISSUE: Rehab/Upgrade of Potable Water Facilities ISSUE: Extension of Potable
WATER USE EFFICIENCY PROGRAM
 WATER USE EFFICIENCY PROGRAM The following describes the City s current water use efficiency (WUE) goals, current and future water conservation measures, and potential water savings from the City s WUE
Potable Water Supply, Wastewater & Reuse Element
 Potable Water Supply, Wastewater & Reuse Element GOAL ONE: HIGH QUALITY AND AFFORDABLE POTABLE WATER WILL BE AVAILABLE TO MEET THE EXISTING AND PROJECTED DEMANDS OF PINELLAS COUNTY UTILITY CUSTOMERS. 1.1.
POTABLE WATER ELEMENT
 Goal 4.0. Provide current and future residents of the County's utility service areas, and large users of the regional raw water system a cost-effective and equitable potable or raw water supply system
OPERATING POLICY MANUAL
 Page 1 of 9 Section 1. PURPOSE The purpose of this plan is to provide for the declaration of the official phases of water supply shortages and for the implementation of voluntary and mandatory water conservation
Regional Feather River Diversion Feasibility Study
 Regional Feather River Diversion Feasibility Study I. Project Sponsor Contact Information YCWA-13 Lead Agency/Organization Yuba County Water Agency Name of Primary Contact(s) Curt Aikens Mailing Address
UWMP Standardized Tables. Kern River Valley District Urban Water Management Plan Appendix H
 UWMP Standardized Tables Kern River Valley District 2015 Urban Water Management Plan Appendix H Table 2-1 Retail Only: Public Water Systems Public Water System Number Public Water System Name Number of
Water Conservation Plan Annual Report Retail Water Supplier
 Water Conservation Plan Annual Report Retail Water Supplier CONTACT INFORMATION Name of Utility: Goforth SUD Public Water Supply Identification Number (PWS ID): TX1050019 Certification of Convenience and
ACRONYMS and ABBREVIATIONS
 ACRONYMS and ABBREVIATIONS AF acre-feet AF/YR acre-feet per year AMI Automated Metering Infrastructure AWWA American Water Works Association cfs cubic feet per second City City of Montrose CWCB Colorado
Districtwide Water Conservation Efforts
 Districtwide Water Conservation Efforts Board of Trustees Meeting May 16, 2016 Prepared by: Facility Planning, District Construction & Support Services EARTH S TOTAL WATER 97% Ocean 3% Freshwater Surface
ROGUE BASIN PROJECT CONSERVATION RELEASE SEASON OPERATING PLAN WATER YEAR 2018
 ROGUE BASIN PROJECT CONSERVATION RELEASE SEASON OPERATING PLAN WATER YEAR 2018 1. General Operational planning for the conservation release season for the Rogue Basin Project begins with the January forecast
City of Albany, Oregon. Willamette Basin TMDL Implementation Plan
 City of Albany, Oregon Willamette Basin TMDL Implementation Plan July 1, 2013 - June 30, 2018 TABLE OF CONTENTS BACKGROUND... 1 LOCATION IN THE WATERSHED... 1 SCOPE AND SUMMARY OF TMDL IMPLEMENTATION PLAN...
Hood River Water Conservation Strategy: achieving long-term water resource reliability for agriculture & local fish populations
 Hood River Water Conservation Strategy: achieving long-term water resource reliability for agriculture & local fish populations Cindy Thieman Hood River Watershed Group Ed Salminen & Niklas Christensen
Tucson Water s Rainwater Harvesting Incentive Workshop Provided as a community service by
 Tucson Water s Rainwater Harvesting Incentive Workshop Provided as a community service by A 501(c)3 Non-profit organization Rainwater Harvesting Systems Capturing rainwater for beneficial use 1. Harvest
Planning for Our Water Future: City of Santa Cruz & Soquel Creek Water District. September
 Planning for Our Water Future: City of Santa Cruz & Soquel Creek Water District September 2011 www.scwd2desal.org 1 Overview Background information on City of Santa Cruz and Soquel Creek Water District
4 PLANNING DATA AND WATER DEMAND FORECASTING
 4 PLANNING DATA AND WATER DEMAND FORECASTING This chapter discusses the planning data and water demand forecast information used to assess the current and future capabilities of the District s water system.
Marion County Office of the County Engineer Water Resources. Water Use Efficiency Plan FY 2016/17
 Marion County Office of the County Engineer Water Resources Water Use Efficiency Plan FY 2016/17 Contents Water Use Efficiency Plan Overview 3 Public Education Initiatives 5 Incentive Based Programs 7
SUMMARY WATER BALANCE ASSESSMENT
 Guangdong Chaonan Water Resources Development and Protection Demonstration Project (RRP PRC 46079) SUMMARY WATER BALANCE ASSESSMENT I. Water Resource Assessment in Chaonan District A. Natural Condition
TOWN OF PAYSON WATER RESOURCES MANAGEMENT
 TOWN OF PAYSON WATER RESOURCES MANAGEMENT 2011 Status Report APRIL 5 TH, 2011 Prepared By: Town of Payson Water Department 2011 PAYSON WATER RESOURCES STATUS SUMMARY The Town of Payson desires to maintain
Summary Report of MWRA Demand Management Program Fiscal Year 2015
 Summary Report of MWRA Demand Management Program Fiscal Year 2015 This report is organized into four sections, as follows: 1. Summary 2. Background and Long Range Water Supply Program 3. Ongoing Demand
WATER MANAGEMENT AND CONSERVATION PLAN FOR THE BEAVER DAM VILLAGE SPECIAL SERVICE DISTRICT FINAL. September 14, 2004 Job Number:
 WATER MANAGEMENT AND CONSERVATION PLAN FOR THE BEAVER DAM VILLAGE SPECIAL SERVICE DISTRICT FINAL September 14, 2004 Job Number: 0352-05-01 PWS ID Number: 09093 PREPARED FOR: Beaver Dam Village Special
Advanced Metering Infrastructure and Water Use Analytics
 Advanced Metering Infrastructure and Water Use Analytics NCAWWA/WEA Annual Conference November 13, 2017 Adam Sharpe Sarah Braman, Town of Cary Jeff Adkins, Town of Cary Presentation Overview Brief Summary
ORANGE WATER AND SEWER AUTHORITY Quality Service Since 1977
 ORANGE WATER AND SEWER AUTHORITY Quality Service Since 1977 Mayor Kevin Foy Town of Chapel Hill 306 North Columbia Street Chapel Hill, NC 27516 Chairman Barry Jacobs Orange County Board of Commissioners
Description of Water Systems
 Description of Water Systems 1 WATER SYSTEM OWNERSHIP AND MANAGEMENT The City is a Washington State municipal corporation that owns and operates a Group A community water system within the boundaries of
Section 3 - Land Use, Population, and Water Demands. Section 3
 Section 3 - Land Use, Population, and Water Demands Section 3 SECTION 3 DEMANDS LAND USE, POPULATION, AND WATER This section describes the existing water demands, the population projections, and the projected
Water Treatment Plant and Water Supply Study CITY OF SNOHOMISH, WASHINGTON
 Water Treatment Plant and Water Supply Study CITY OF SNOHOMISH, WASHINGTON May 2009 TABLE OF CONTENTS EXECUTIVE SUMMARY Page Purpose and Background... ES-1 Existing Water System... ES-1 Water Demands...
TWDB Statewide Municipal Water Conservation Quantification Project Report to the Plateau Regional Water Planning Group Region J 2017
 TWDB Statewide Municipal Water Conservation Quantification Project Report to the Plateau Regional Water Planning Group Region J 2017 1 Executive Summary In 2015, the Texas Legislature appropriated funds
Water Resources of Central Iron County and Washington County
 Water Resources of Central Iron County and Washington County An Alternative to the Lake Powell Pipeline Project Jesse Pope Instructor: Dr. Tarboton CEE 6440 2013 2 Table of Contents INTRODUCTION....3 Figure
Model Drought Management Plan and Response Ordinance
 Model Drought Management Plan and Response Ordinance (Provided by the South Carolina Department of Natural Resources as required by the South Carolina Drought Response Act of 2000.) Contents Drought Management
Municipal Service Review
 Willow Creek Community Services District Municipal Service Review May 2008 Prepared by: For the District Sphere of Influence Report TABLE OF CONTENTS Page Local Agency Formation Commission Authority...
Municipal Stormwater Management Plan Prepared For The Borough of Cape May Point By Van Note-Harvey Associates VNH File No.
 Municipal Stormwater Management Plan Prepared For The Borough of Cape May Point By Van Note-Harvey Associates 2005 VNH File No. 35317-210-21 Table of Contents Introduction... 3 Goals... 3 Storm water Discussion...
NISP Communities Water Conservation Efforts. A Key Component to Meeting Future Water Needs
 NISP Communities Water Conservation Efforts A Key Component to Meeting Future Water Needs Water Conservation is Part of the Mix Water is a precious resource to the people who live, work and play in Northern