Ecosystem Status Assessment in Korea
|
|
|
- Marlene Newman
- 6 years ago
- Views:
Transcription
1 Ecosystem Status Assessment in Korea Sinjae Yoo Indicators of Status and Change within North Pacific Marine Ecosystems: A FUTURE Workshop Honolulu,
2 Purpose To introduce monitoring and assessment programs in Korea Outline Monitoring networks in Korea National Investigation of Marine Ecosystems Problems in assessment Determination of reference conditions Sampling problems: Confounding regional and interannual differences On-going and future works
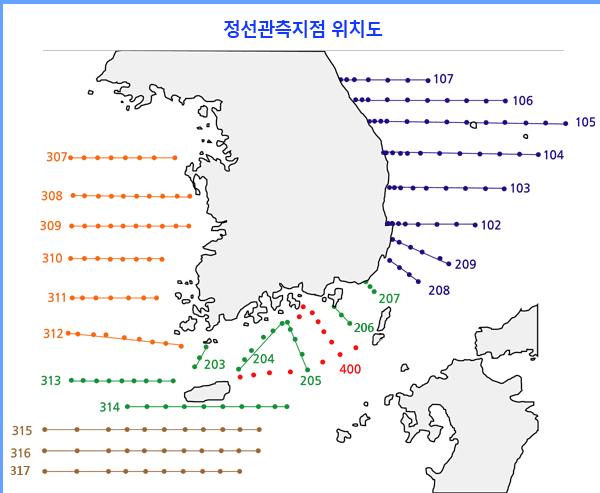
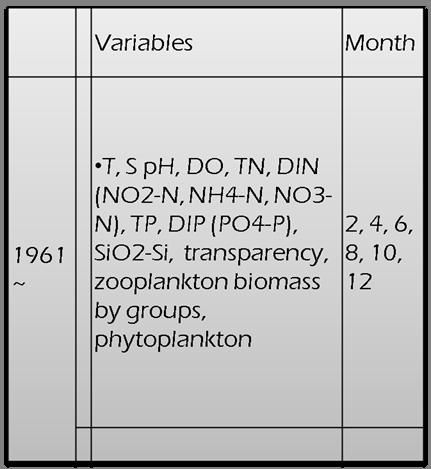
3 Station-based Monitoring Network (1961~)
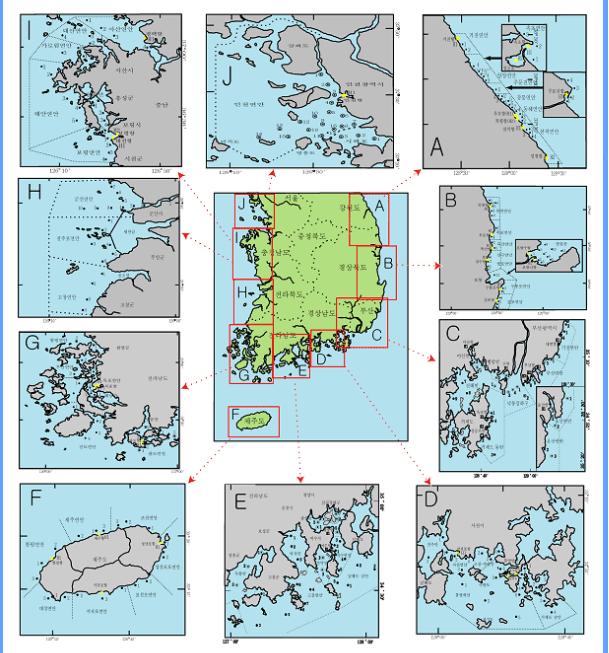
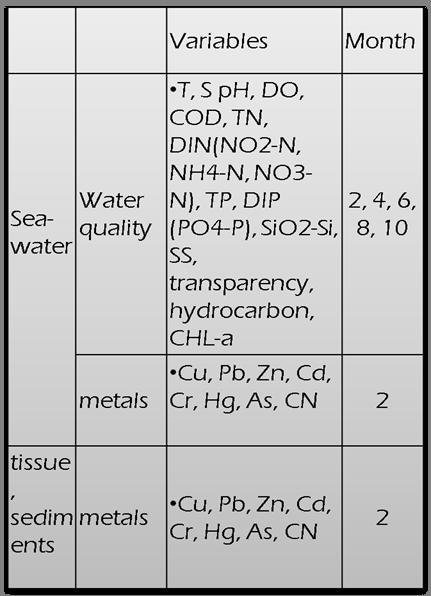
4 National Environmental Monitoring Network (1996~)

5 National Investigation of Marine Ecosystems (NIMO: 2006~) 8 domains in coastal areas (>300 stations) Seasonal surveys at one domain per year (8 year monitoring cycle) Pelagic Water quality Phytoplankton Zooplankton Nekton* -- Ichthyoplankton -- Fish -- Crustacean -- Cephalopods Benthic Water quality Meiofauna Macrofauna Macro algae
6 Purposes Assessment and thematic maps in NIMO Scientific summary of massive observational data Spatio-temporal distribution of ecosystem properties Holistic interpretation of ecosystem dynamics Visual presentation of thematic maps Assessment of ecosystem status in Korean waters Ecosystem status Impact assessment for stressors Basis for management policy
7 Stressors and ecosystem properties (Yellow Sea) Eutrophication Nutrient imbalance Overfishing Hazardous substances NIS Habitat disturbance Reduction of freshwater input Sea warming Ecosystem structure Biodiversity Biomass Productivity foodwebs Based on YSLME Transboundary Diagnostic Analysis
8 Theme 1: Indicators of Ecosystem Status Phyto- plankton Zoo- plankton Bethos Macro- algae Ichthyo- plankton Nekton Structure Biomass, abundance, Dominant species Biomass, abundance, Dominant species Biomass, abundance, Dominant species Biomass, abundance, Dominant species Abundance of dominant species Biomass, abundance, Dominant species Diversity Sp. Richness, Sp. Diversity Sp. Richness, Sp. Diversity Sp. Richness, Sp. Diversity Sp. Richness, Sp. Diversity Sp. Richness, Sp. Diversity Producti- vity Should be added could be estimated Should be added could be estimated Food- web Trophic linkage Trophic linkage

9 Theme 2: Indocators of Ecosystem Stressors

10 38 0'N Occurence of warm water phytopl. sp 'N 'N 35 0'N 2008 (Min et al., 2009) 34 0'N 'E 126 0'E 127 0'E 128 0'E
11 Problems with NIMO data What would be confounding effects of year-to-year variations and regional differences? Reference values Data from pristine conditions are rare. Different references for oceanographic conditions? Yellow Sea vs. East Sea Neritic waters vs. open sea

12 SST anomaly

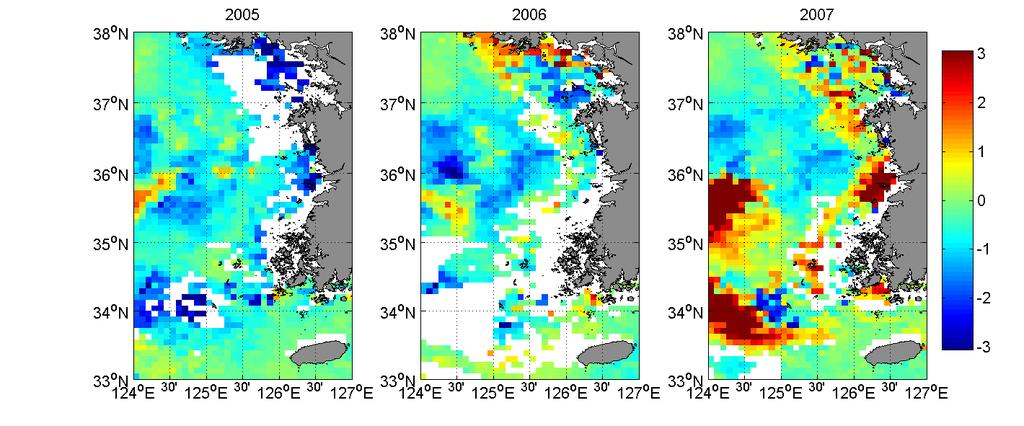
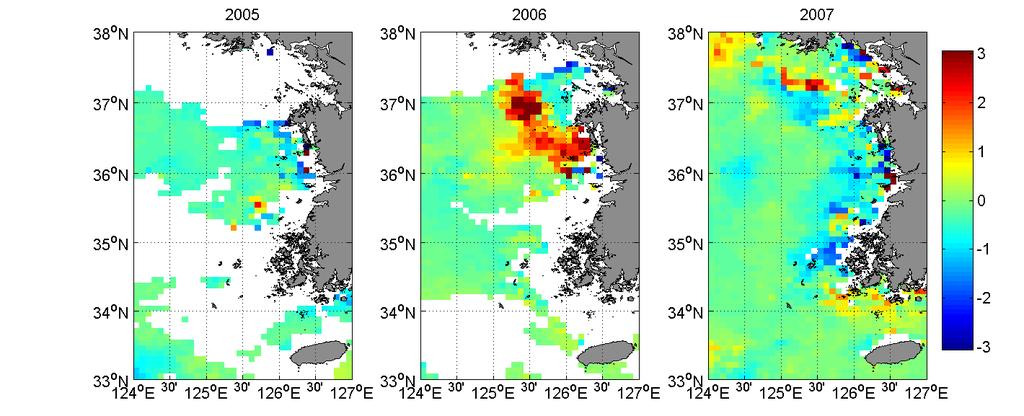
13 2/ /30-4/6 5/25-6/1
14 Method for determination of reference conditions (European Commission, 2007)
15 Reference conditions (first try) Phytoplankton species diversity Literature: 1977~1996 Macrofauna species diversity European Water Framework Directive Nutrients (DO, COD, DIP, DIN, N:P, N:Si) National Env. Monitoring ( ) Chlorophyll-a National Env. Monitoring ( )
16 time phytoplankton species diversity H
17 National Environmental Monitoring Network data 1996~2007 Coastal areas: 14 st. (Yellow Sea), 34 st. (East China Sea), 14 st. (East Sea) 7,300 records 14 oceanographic and env. variables Temp, Salinity, ph, DO, COD NH 4, Nitrite, Nitrate, TN DIP, TP SiO 2 SS Chlorophyll-a
18 Mean Seasonal, regional distribution DIN 95% DIN Mean DIN 95% DIN 0.1 YS ECS ES Group Feb May Jun Group Aug Nov % 4 CHL CHL Mean 3 Mean YS ECS ES Feb May Jun Aug Nov
19 38 0'N CHL 12 X = Y = 'N 36 0'N H I G H Compared to NEMN datasets 35 0'N M O D E R A TE 'N 2009 L O W 125 0'E 126 0'E 127 0'E 128 0'E 0

20 Ecological Quality Ratio (EQR) Reference value and slope (European Commission, 2007)
21 38 0'N CHL 'N 'N EQR 35 0'N 'N 'E 126 0'E 127 0'E 128 0'E
22 38 0'N Phyto H (min) 'N 'N EQR 35 0'N 'N 'E 126 0'E 127 0'E 128 0'E
: total organic carbon (TOC), nitrogen (TN), phosphorus (TP) content (w/w%) TOC TN TP Mostly harmless diatom blooms (> 1,000 ml -1 ). Cochlodinium blooms in 1998 and 2000.")
23 Eutrophication in the Yellow Sea Calendar Year Element chronographs of the Yellow Sea sediment (123.5oE, 35oN): total organic carbon (TOC), nitrogen (TN), phosphorus (TP) content (w/w%) TOC TN TP Mostly harmless diatom blooms (> 1,000 ml -1 ). Cochlodinium blooms in 1998 and No significant economic damages have been reported.
24 Reference values: historical data (DIN:1984; DIP:1976; Si:1976) (Lin et al., 2005 )
25 Reference values: historical data (DIN:1984; DIP:1976; Si:1976)
26 38 0'N DIN (mean) 'N 'N EQR 35 0'N 'N 'E 126 0'E 127 0'E 128 0'E
 1 0.")

27 125 0'E 126 0'E 127 0'E 128 0'E 38 0'N DIP (mean) 'N 'N EQR 'N 'N 0.1
28 38 0'N Si (mean) 'N 'N EQR 35 0'N 'N 'E 126 0'E 127 0'E 128 0'E
29 On-going and future works Improvement of reference conditions Tuning of grades Relationship between stressor indicators and status indicators Statistical analysis of community structure in reference to indicator space Ordination techniques, e. g., CCA Integration of indicators
30 Thank you!
Food web structure in the continental shelf and slope waters of the Korean peninsula: Stable isotope approach and prospects for future research
 PICES XVII End-to-end food webs: Impacts of a changing ocean October 28 28 Food web structure in the continental shelf and slope waters of the Korean peninsula: Stable isotope approach and prospects for
Regional Seas Indicators Working Group
 18 th Global Meeting of the Regional Seas Conventions and Action Plans 30 September 1 October 2016, Incheon, the Republic of Korea Regional Seas Indicators Working Group Black Sea Commission Irina Makarenko
Joint Cruise Methodology
 Joint Cruise Methodology Alexander Mikaelyan & Tamara Shiganova Batumi, 22 May The main goal of the Joint Cruises To provide ecosystem monitoring of the open waters of the Black Sea on inter-annual and
The 2nd Yellow Sea Regional Science Conference in Xiamen, China, Feb 24-26, 2010
 The 2nd Yellow Sea Regional Science Conference in Xiamen, China, Feb 24-26, 2010 NOWPAP region The Common Procedures Holistic Secondary Assessment checkup for finding drivers Detailed Holistic assessment
Filling the gaps: The Case of the Yellow Sea
 Filling the gaps: The Case of the Yellow Sea Sinjae Yoo KORDI, South Korea 1. Background 2. Knowledge gaps 3. YSLME Acknowledgements Details of the YSLME plan is an outcome of joint efforts by many members
Swedish experiences on the importance of N and P
 Danish Coastal Eutrophication Conference Copenhagen 213-6-19 Swedish experiences on the importance of N and P Ragnar Elmgren & Ulf Larsson Dept. Ecology, Environment & Plant Sciences Stockholm University
Developments in the ecological box modelling of the Curonian Lagoon
 Developments in the ecological box modelling of the Curonian Lagoon /9/9, Klaipeda Dr. Ali Ertürk Istanbul Technical University Department of Environmental Engineering INTRODUCTION 1 What is ESTAS? EcoSystem
Biogeochemical fluxes in scenario simulations for the Baltic Sea in the period with Saint-Petersburg Baltic Eutrophication Model (SPBEM)
") Biogeochemical fluxes in scenario simulations for the Baltic Sea in the period 196-2 with Saint-Petersburg Baltic Eutrophication Model (SPBEM) Vladimir Ryabchenko1, Alexey Isaev2, Mikhail Molchanov2, Tatjyana
Biogeochemical fluxes in scenario simulations for the Baltic Sea in the period 196-2 with Saint-Petersburg Baltic Eutrophication Model (SPBEM) Vladimir Ryabchenko1, Alexey Isaev2, Mikhail Molchanov2, Tatjyana
1. Regional Sea Progra r m and NOWP m and NOWP
 Satellite based monitoring of marine and coastal environment of the Northwest Pacific Genki Terauchi *1 and Joji Ishizaka 2 1.NOWPAP CEARAC 2.Nagoya University Outline 1. Regional Sea Program and NOWPAP
LME 20 Barents Sea. Contents 1/9. LME overall risk 2. Bordering countries: Norway, Russia, Svalbard LME Total area: 2,023,335 km 2
 Bordering countries: Norway, Russia, Svalbard LME Total area: 2,023,335 km 2 Contents LME overall risk 2 Productivity 2 Chlorophyll-A 2 Primary productivity 3 Sea Surface Temperature 3 Fish and Fisheries
Efforts Towards Marine Conservation for the Sustainable Utilization of Kuwait s Marine Environment
 Efforts Towards Marine Conservation for the Sustainable Utilization of Kuwait s Marine Environment Faiza Y. Al-Yamani Kuwait Institute for Scientific Research The Convention on Biological Diversity (CBD)
Benthic Nutrient Cycling in Boston Harbor and Massachusetts Bay
 Benthic Nutrient Cycling in Boston Harbor and Massachusetts Bay Anne Giblin, Charles Hopkinson & Jane Tucker The Ecosystems Center, Marine Biological Laboratory Woods Hole, MA 2543 September 22, 1999 Boston
Jeffrey Polovina 1, John Dunne 2, Phoebe Woodworth 1, and Evan Howell 1 Julia Blanchard 3
 Projected expansion of the subtropical biome and contraction of the temperate and equatorial upwelling biomes in the North Pacific under global warming Jeffrey Polovina 1, John Dunne 2, Phoebe Woodworth
Impacts of global warming on bio-products of marine and coastal system Ling TONG Qisheng TANG
 Impacts of global warming on bio-products of marine and coastal system Ling TONG Qisheng TANG Yellow Sea Fisheries Research Institute, CAFS Both environmental and human factors affect the bioproducts in
Nutrient Response to Sewage Abatement in Hong Kong
 Nutrient Response to Sewage Abatement in Hong Kong Prof. Paul J. Harrison Atmospheric, Marine & Coastal Environment Program Institute for the Environment HK University of Science & Technology Outline Background
PICES Activities for Conservation of Marine Ecosystems
 PICES Activities for Conservation of Marine Ecosystems Sinjae Yoo, Tom Therriault PICES AUG 04, 2011 NOWPAP Expert Meeting Outline About PICES North Pacific Ecosystem Status Report FUTURE -- 2 nd Integrative
Total Budget for FY2006-FY2008: 92,332,000Yen (FY2008; 28,019,000Yen) Silica Deficiency, Diatom, Autonomous Sinking, Nutritions Export, Jellyfish
 Silica Deficiency, Diatom, Autonomous Sinking, Nutritions Export, Jellyfish") D-061-E-1 D-061 Study on the Ecological Deterioration of East Asian Marginal Seas due to the Anthropogenic Change in the Effluent Nutrient Ratio of N: P: Si (Abstract of the Final Report) Contact person
D-061-E-1 D-061 Study on the Ecological Deterioration of East Asian Marginal Seas due to the Anthropogenic Change in the Effluent Nutrient Ratio of N: P: Si (Abstract of the Final Report) Contact person
Includes the coastal zone and the pelagic zone, the realm of the oceanographer. I. Ocean Circulation
 Includes the coastal zone and the pelagic zone, the realm of the oceanographer I. Ocean Circulation II. Water Column Production A. Coastal Oceans B. Open Oceans E. Micronutrients F. Harmful Algal Blooms
Jellyfish blooms as consequences of human perturbed environmental and ecosystems
 2nd Climate Change Effects Symposium (Yeosu, 2012) Jellyfish blooms as consequences of human perturbed environmental and ecosystems Shin-ichi Uye (Hiroshima University, Japan) QuickTimeý Dz ÉtÉHÉg - JPEG
Wachnicka, A. 1, Browder, J. 2, Bouck, D. 2, Kelble, C. 2, Visser, L. 2, Jackson, T. 2, Bellmund, S
 Microalgae as a Powerful Tool in Assessment of Ecological Health of Biscayne Bay Nearshore Habitats in Support of the Biscayne Bay Coastal Wetlands Restoration Project Wachnicka, A. 1, Browder, J. 2, Bouck,
Feedback mechanisms between cyanobacterial blooms, transient hypoxia and benthic phosphorus regeneration in shallow coastal environments
 Low oxygen environments in marine, estuarine and fresh waters 46th International Liege colloquium 5-9 May 214 Feedback mechanisms between cyanobacterial blooms, transient hypoxia and benthic phosphorus
Patterns of Productivity
 Phytoplankton Zooplankton Nutrients Patterns of Productivity There is a large Spring Bloom in the North Atlantic (temperate latitudes remember the Gulf Stream!) What is a bloom? Analogy to terrestrial
Climate Change and Phenology in Narragansett Bay Phytoplankton. Introduction
 Sarah Blackstock OCG561: Biological Oceanography Susanne Menden-Deuer Research Project 3 December 2013 Climate Change and Phenology in Narragansett Bay Phytoplankton Introduction As time-series on plankton
7.9 Nitrogenous Nutrients and Plankton Production in Jamaica Bay, NY
 7.9 Nitrogenous Nutrients and Plankton Production in Jamaica Bay, NY Ray Sambrotto 7.9.1 SUMMARY Two blooms characterize phytoplankton growth in Jamaica Bay: the winter/spring bloom, between February and
Dead-Zones and Coastal Eutrophication: Case- Study of Chesapeake Bay W. M. Kemp University of Maryland CES Horn Point Laboratory Cambridge, MD
 Dead-Zones and Coastal Eutrophication: Case- Study of Chesapeake Bay W. M. Kemp University of Maryland CES Horn Point Laboratory Cambridge, MD Presentation to COSEE Trends Orientation at UMCES HPL 4 August
Zooplankton variability in the Balearic Sea and its relation to North Atlantic climate : A boundary area in the Western Mediterranean.
 Effects of climate change on the world s oceans Symp.: Gijon 18-23, 28 Workshop 1: Zooplankton and climate: response modes and linkages among regions, regimes and trophic levels Zooplankton variability
DEVOTES main research on biodiversity: progress and findings
 DEVOTES main research on biodiversity: progress and findings Angel Borja 8 th February 2016, Pasaia, ICES WG Biodiversity Introduction Descriptors and indicators Biodiversity Foodwebs Seafloor integrity
TR MINISTRY OF ENVIRONMENT AND URBANIZATION. Pollution Monitoring and Assessment Advisory Group (PMA AG) 24th Meeting
 24th Meeting") TR MINISTRY OF ENVIRONMENT AND URBANIZATION Pollution Monitoring and Assessment Advisory Group (PMA AG) 24th Meeting Hacer SELAMOĞLU ÇAĞLAYAN Environment and Urbanization Exp./Chemist 01-02.10.2014 CONTENT
TR MINISTRY OF ENVIRONMENT AND URBANIZATION Pollution Monitoring and Assessment Advisory Group (PMA AG) 24th Meeting Hacer SELAMOĞLU ÇAĞLAYAN Environment and Urbanization Exp./Chemist 01-02.10.2014 CONTENT
The Baltic Proper Ecosystem & Climate Change
 Baltic Earth/BEAM Summer School Askö 2015-08-28 The Baltic Proper Ecosystem & Climate Change Ragnar Elmgren Dept. Ecology, Environment & Plant Sciences Take home message: We are still extremely uncertain
Production and Life OCEA 101
 Production and Life OCEA 101 Overview Photosynthesis Primary production Phytoplankton biomass Controls on primary production and biomass Food webs Photosynthesis Photosynthesis requires: (i) sunlight (ii)
1. Introduction Background
 Procedures for assessment of eutrophication status including evaluation of land-based sources of nutrients for the NOWPAP region (Developed in June 2009) Contents 1. Introduction... 1 1-1. Background...
Classification of systems. Aquatic Ecosystems. Lakes 9/9/2013. Chapter 25
 Aquatic Ecosystems Chapter 25 Classification of systems Aquatic systems classified by physical environment Salinity most important Marine divided broadly into coastal and open water Freshwater divided
DEVELOPMENT OF ECOSYSTEM INDICATORS WITHIN PICES
 DEVELOPMENT OF ECOSYSTEM INDICATORS WITHIN PICES Hal Batchelder Deputy Executive Secretary, PICES Institute of Ocean Sciences Sidney, British Columbia Canada V8L 4B2 Email: hbatch@pices.int WHAT IS PICES?
Monitoring and modeling of phytoplankton and marine primary production. Nansen Environmental and Remote Sensing Center, Bergen, Norway
 Monitoring and modeling of phytoplankton and marine primary production Lasse H. Pettersson, Annette Samuelsen and Anton Korosov lasse.pettersson@nersc.no Nansen Environmental and Remote Sensing Center,
Support Project of Total Pollutant Load Control System ( TPLCS ) introduction
 introduction") Support Project of Total Pollutant Load Control System ( TPLCS ) introduction Ryuji Tomisaka Director Office of Environmental Management of Enclosed Coastal Seas Ministry of the Environment of JAPAN (MOE
Support Project of Total Pollutant Load Control System ( TPLCS ) introduction Ryuji Tomisaka Director Office of Environmental Management of Enclosed Coastal Seas Ministry of the Environment of JAPAN (MOE
LME 34 Bay of Bengal 1/13. LME overall risk 2
 LME 34 Bay of Bengal Bordering countries: Bangladesh, India, Indonesia, Malaysia, Maldives, Myanmar, Sri Lanka, Thailand. LME Total area: 3,657,502 km 2 List of indicators LME overall risk 2 Productivity
MODELING NUTRIENT LOADING AND EUTROPHICATION RESPONSE TO SUPPORT THE ELKHORN SLOUGH NUTRIENT TOTAL MAXIMUM DAILY LOAD
 MODELING NUTRIENT LOADING AND EUTROPHICATION RESPONSE TO SUPPORT THE ELKHORN SLOUGH NUTRIENT TOTAL MAXIMUM DAILY LOAD Martha Sutula Southern California Coastal Water Research Project Workshop on The Science
Marine lifestyles and relationships
 Marine lifestyles and relationships Marine Lifestyles and Enviros. Benthic organisms (benthos) live on or buried in the ocean floor (sediment) Can be sessile (attached) or mobile (moving) Pelagic organisms
Changes in coastal environment and mass occurrence of jellyfish in Tokyo Bay. Haruto ISHII. (Tokyo University of Marine Science and Technology)
") Changes in coastal environment and mass occurrence of jellyfish in Tokyo Bay Haruto ISHII (Tokyo University of Marine Science and Technology) Ecosystem in hyper eutrophicated bay High concentrations of
Changes in coastal environment and mass occurrence of jellyfish in Tokyo Bay Haruto ISHII (Tokyo University of Marine Science and Technology) Ecosystem in hyper eutrophicated bay High concentrations of
2012 Nutrient Regulations Update
 2012 Nutrient Regulations Update OWEA Government Affairs Workshop March 1, 2012 Guy Jamesson, PE, BCEE Malcolm Pirnie, The Water Division of ARCADIS Imagine the result Agenda Nutrient impacts Nutrient
Phytoplankton and Upper Ocean Biogeochemical Cycles Along Line P
 Phytoplankton and Upper Ocean Biogeochemical Cycles Along Line P Angelica Peña Institute of Ocean Sciences, Fisheries & Oceans Canada. Contribution: Diana Varela, Department of Biology & School of Earth
Diatom/Dinoflagellate Ratio
 Diatom/Dinoflagellate Ratio Concept: Norbert Wasmund, IOW/Germany, partly based on Klais et al. 2011 (Est., FI); support from national WG on Eutrophication, Nutrients and Plankton Interest signalled also
Channel Islands Harbor. Water Quality Event June & July, 2018
 Channel Islands Harbor Water Quality Event June & July, 2018 Dr. David A. Caron Presented by: Professor of the Department of Biological Sciences, USC (since 1999) Chief Science Officer of Aquatic EcoTechnologies,
Multimetric Phytoplankton Index (MPI): description of the method and study cases in Mediterranean Sea.
: description of the method and study cases in Mediterranean Sea.") Multimetric Phytoplankton Index (MPI): description of the method and study cases in Mediterranean Sea. Chiara FACCA1, Fabrizio BERNARDI AUBRY2, Stefania FINOTTO2, Emanuele PONIS3, Francesco ACRI2, Adriano
Multimetric Phytoplankton Index (MPI): description of the method and study cases in Mediterranean Sea. Chiara FACCA1, Fabrizio BERNARDI AUBRY2, Stefania FINOTTO2, Emanuele PONIS3, Francesco ACRI2, Adriano
Impact of Damming and Eutrophication on DSi:DIN Variation in River Water, a case study of Yahagi River, Japan
 Impact of Damming and Eutrophication on DSi:DIN Variation in River Water, a case study of Yahagi River, Japan Masashi Kodama* * & Katsuhisa Tanaka** *National Research Institute of Fisheries Science, Fisheries
Nutrient Limitation of Phytoplankton By Nitrogen and Phosphorus: Erosion of the Phosphorus Paradigm
 Utah State University DigitalCommons@USU Watershed Sciences Faculty Publications Watershed Sciences 2009 Nutrient Limitation of Phytoplankton By Nitrogen and Phosphorus: Erosion of the Phosphorus Paradigm
A limnologist s approach to numerical lake modeling: A case study at Lake Wister, OK
 A limnologist s approach to numerical lake modeling: A case study at Lake Wister, OK J. Thad Scott, Associate Professor of Biology, Baylor University @ScottBiogeochem Thad_Scott@baylor.edu Lake models
Understanding and Managing the Range of Phosphorus Forms Contributing to Eutrophication
 Understanding and Managing the Range of Phosphorus Forms Contributing to Eutrophication Marc Stutter, Benoit Demars The Macaulay Land Use Research Institute, Aberdeen, UK Session 3: Monitoring and evaluation
Dr. Claudette Spiteri
 Dr. Claudette Spiteri 1. General context Indicators MSFD & indicators 2. Indicator development Process Pan European Regional Seas National Content Descriptors Criteria Indicators Monitoring parameters
Integrated End-to-End and Fisheries Bio-Economic Modeling for Evaluating Ecosystem-Wide Effects of Human Pressures in the Baltic Sea
 Integrated End-to-End and Fisheries Bio-Economic Modeling for Evaluating Ecosystem-Wide Effects of Human Pressures in the Baltic Sea J. Rasmus Nielsen, Artur Palacz, Sieme Bossier, Francois Bastardie,
What Characterizes the Taninim Estuary in Relation to Other Mediterranean Microestuaries in Israel and Implications for the River rehabilitation
 What Characterizes the Taninim Estuary in Relation to Other Mediterranean Microestuaries in Israel and Implications for the River rehabilitation Sarig Gafny (sarig@ruppin.ac.il) The RIME team: Gitai Yahel,
Manual for Marine Monitoring in the COMBINE. Programme of HELCOM. Part C Programme for monitoring of eutrophication and its effects
 Manual for Marine Monitoring in the COMBINE Programme of HELCOM Part C Programme for monitoring of eutrophication and its effects Last updated: 31.03.2006 PART C PROGRAMME FOR MONITORING OF EUTROPHICATION
Support Project of Total Pollutant Load Control System ( TPLCS ) introduction
 introduction") Support Project of Total Pollutant Load Control System ( TPLCS ) introduction Ryuji Tomisaka Director Office of Environmental Management of Enclosed Coastal Seas Ministry of the Environment of JAPAN (MOE
Support Project of Total Pollutant Load Control System ( TPLCS ) introduction Ryuji Tomisaka Director Office of Environmental Management of Enclosed Coastal Seas Ministry of the Environment of JAPAN (MOE
The use of ecological models to assess indicators in support of the EU Marine Strategy Framework Directive
 The use of ecological models to assess indicators in support of the EU Marine Strategy Framework Directive Chiara Piroddi Brussels, 20-21 January 2016 Background * EU FP7 project Ocean of Tomorrow : DEVelopment
13. ESTUARINE & COASTAL AREAS: HOW TO PREVENT DEGRADATION AND RESTORE
 13. ESTUARINE & COASTAL AREAS: HOW TO PREVENT DEGRADATION AND RESTORE Management: Estuarine & Coastal Areas ECOHYDROLOGY AND PHYTOTECHNOLOGY AS MANAGEMENT TOOLS FOR ESTUARIES AND COASTAL AREAS Basic to
Interannual variations of nutrients and primary production over the southeastern Beirng Sea shelf during spring of 1997,1998,and 1999
 Interannual variations of nutrients and primary production over the southeastern Beirng Sea shelf during spring of 1997,1998,and 1999 TaeKeun Rho,Terry E. Whitledge, and John J. Goering Institute of Marine
The Lake Partner Program
 The Lake Partner Program Anna DeSellas Scientist, Inland Lakes Monitoring & Lake Partner Program Coordinator Dorset Environmental Science Centre 1 Phosphorus and water quality Phosphorus: A nutrient that
Environmental flow requirements (EFRs) related to preference of phytoplankton in the Yellow River Estuary (YRE) based on an ecohydrodynamic model
 related to preference of phytoplankton in the Yellow River Estuary (YRE) based on an ecohydrodynamic model") Environmental flow requirements (EFRs) related to preference of phytoplankton in the Yellow River Estuary (YRE) based on an ecohydrodynamic model R. Zhao, Z. F. Yang*, T. Sun State Key Laboratory of Water
Environmental flow requirements (EFRs) related to preference of phytoplankton in the Yellow River Estuary (YRE) based on an ecohydrodynamic model R. Zhao, Z. F. Yang*, T. Sun State Key Laboratory of Water
Turning water quality data into lake-specific nutrient standards
 Turning water quality data into lake-specific nutrient standards 2015 Tribal Lands and Environment Forum Nancy Schuldt, Water Projects Coordinator Fond du Lac Reservation Current Narrative Standard:
Biogeochemical Treatment of ARD at the Island Copper Mine Pit Lake
 Biogeochemical Treatment of ARD at the Island Copper Mine Pit Lake Presented by: C. Pelletier, D. Muggli, M. Wen, and G. Poling Rescan Environmental Services Ltd. Rupert Inlet and Island Copper Mine Site
LME 32 Arabian Sea 1/13. LME overall risk 2
 LME 32 Arabian Sea Bordering countries: Bahrain, Djibouti, India, Iran, Iraq, Kuwait, Oman, Pakistan, Qatar, Saudi Arabia, Somalia, United Arab Emirates, Yemen. LME Total area: 3,950,421 km 2 List of indicators
SUNLIGHT & OCEAN ZONATION
 PLANKTON, PRIMARY PRODUCTIVITY, AND BIOGEOCHEMISTRY EPSS 15 Fall 2017 LAB #7 SUNLIGHT & OCEAN ZONATION Sunlight is critical to the distribution of oceanic life The base of the food chain (phytoplankton)
Shen Zhen. New Territories. Stonecutters Island Kowloon. Victoria Harbor WM4 VM2 VM5 SM10. Hong Kong SM6. South China Sea.
 Shen Zhen Pearl River Estuary Latitude ( o N) New Territories Stonecutters Island Kowloon Victoria Harbor WM4 VM7 SM VM VM Hong Kong Lantau Islannd SM9 WM Island EM3 South China Sea Longitude ( o E) Fig..
Taxonomy. Classification of Marine Organisms 11/7/2012. CH 12 Marine Life and the Marine Environment
 CH 12 Marine Life and the Marine Environment There are more than 250,000 identified marine species Most live in sunlit surface seawater A species success depends on the ability to o find food o avoid predation
Ecosystem responses to climate in the context of multiple drivers
 Ecosystem responses to climate in the context of multiple drivers Thorsten Blenckner Baltic Nest Institute, Stockholm Resilience Centre, Stockholm University, Sweden Aronias 10-årsjubileum i Ekenäs, Finland
Dissolved inorganic nitrogen (DIN)
") Dissolved inorganic nitrogen (DIN) Key Message HELCOM core indicator report July 2017 The core indicator evaluates average dissolved inorganic nitrogen concentration in the surface (0 10 m) during winter
Dissolved inorganic nitrogen (DIN) Key Message HELCOM core indicator report July 2017 The core indicator evaluates average dissolved inorganic nitrogen concentration in the surface (0 10 m) during winter
Common Procedure for the Identification of the Eutrophication Status of the OSPAR Maritime Area. UK National Report
 Common Procedure for the Identification of the Eutrophication Status of the OSPAR Maritime Area UK National Report 1 Table of contents Table of contents 2 1 Introduction 4 2 Description of assessed areas
Genki Terauchi September 11, 2008 NOWPAP CEARAC
 Development of Draft Procedures for assessment of eutrophication status including evaluation of land based sources of nutrients for the NOWPAP region and a case study in Toyama Bay Genki Terauchi September
Modelling sea ice biogeochemistry: key findings from 1-D sensitivity experiments and plans for 3-D study
 Modelling sea ice biogeochemistry: key findings from 1-D sensitivity experiments and plans for 3-D study Hakase Hayashida1, Eric Mortenson1, Nadja Steiner2,3, Adam Monahan1 1 School of Earth and Ocean
This is the text on which the Marine Strategy Regulatory Committee gave a positive opinion on 10 November 2016.
 This is the text on which the Marine Strategy Regulatory Committee gave a positive opinion on 10 November 2016. It is still a draft text as it has not yet been through the scrutiny of the European Parliament
Regional variation in N vs. P limitation in the Baltic Sea the role of sediment mineralisation processes
 Regional variation in N vs. P limitation in the Baltic Sea the role of sediment mineralisation processes Petri Ekholm & Jouni Lehtoranta Finnish Environment Institute (SYKE) COST869 Mitigation options
Chapter VI. Primary and Secondary Production rate in the Arabian Sea. Using Remote Sensing. 6.1 Introduction Results and Discussion
 Primary and Secondary Production rate in the Arabian Sea Using Remote Sensing 6.1 Introduction 6.2. Results and Discussion 6.2.1 Primary production 6.2.2 Secondary production CHAPTER VI Primary and Secondary
Florida Nutrient Criteria Update
 Standards and Assessment Florida Nutrient Criteria Update Russ Frydenborg Path Forward March 15, 2013: FDEP and EPA announced agreement to continue the protection of Florida s waterways from excess nitrogen
6th International Conference on Electronic, Mechanical, Information and Management (EMIM 2016)
") 6th International Conference on Electronic, Mechanical, Information and Management (EMIM 2016) Effects of the Water and Sediment Discharge Regulation Project on Zooplankton in the Yellow River Estuary
6th International Conference on Electronic, Mechanical, Information and Management (EMIM 2016) Effects of the Water and Sediment Discharge Regulation Project on Zooplankton in the Yellow River Estuary
Izabela Zgud, Adam Sokołowski, Maciej Wołowicz
 Preliminary results of experimental study on application of Mytilus trossulus farming to remediate the environmental state of the southern Baltic Sea (Poland) Izabela Zgud, Adam Sokołowski, Maciej Wołowicz
Perspectives on integrated assessment of marine biodiversity with background from the EU s Marine Strategy Framework Directive(MSFD)
") Perspectives on integrated assessment of marine biodiversity with background from the EU s Marine Strategy Framework Directive(MSFD) Sabine K.J. Cochrane, J.H. Andersen, T. Berg, A. Borja, Norwegian marine
Perspectives on integrated assessment of marine biodiversity with background from the EU s Marine Strategy Framework Directive(MSFD) Sabine K.J. Cochrane, J.H. Andersen, T. Berg, A. Borja, Norwegian marine
Development in plankton community: the Barents Sea. E. Eriksen SEAPOP, April 2017
 Development in plankton community: the Barents Sea E. Eriksen SEAPOP, 27-28 April 2017 Arctic ocean The Barents Sea short description The Barents Sea is a shelf sea (~ 1.6 million km 2 ) and a transition
Nitrogen Cycling, Primary Production, and Water Quality in the New River Estuary. Defense Coastal/Estuarine Research Program (DCERP)
") Nitrogen Cycling, Primary Production, and Water Quality in the New River Estuary Defense Coastal/Estuarine Research Program (DCERP) Introduction: A key theme of the ongoing DCERP program is monitoring
Nitrogen Cycling, Primary Production, and Water Quality in the New River Estuary Defense Coastal/Estuarine Research Program (DCERP) Introduction: A key theme of the ongoing DCERP program is monitoring
Operational oceanography and the ecosystem approach
 Operational oceanography and the ecosystem approach Einar Svendsen with input from many others PICES ASC, Victoria BC 02 November, 2007 Operational Vision Deliver operational information of the marine
Future climate scenarios for phosphorus and nitrogen dynamics in the Gulf of Riga
 Future climate scenarios for phosphorus and nitrogen dynamics in the Gulf of Riga Bärbel Müller Karulis, Latvian Institute of Aquatic Ecology Juris Aigars, Latvian Institute of Aquatic Ecology In colaboration
LME 06 Southeast U.S. Continental Shelf
 LME 06 Southeast U.S. Continental Shelf Bordering countries: United States of America, Bahamas LME Total area: 303,029 km 2 List of indicators LME overall risk 2 Productivity Chlorophyll-A 2 2 Primary
Modeling climate change effects on Delta phytoplankton in CASCaDE II
 Modeling climate change effects on Delta phytoplankton in CASCaDE II Lisa Lucas, USGS Wim Kimmerer, SF State Univ. Hans Los, Deltares Image Courtesy Mick van der Wegen 1. Why do we care? 2. What do phytoplankton
Model reconstruction and future evolution of Phaeocystis colony blooms in Belgian coastal waters as a function of human activity on the watershed
 Model reconstruction and future evolution of Phaeocystis colony blooms in Belgian coastal waters as a function of human activity on the watershed Christiane LANCELOT and Nathalie GYPENS Ecologie des Systèmes
Lower Cape Fear River Basin Cape Fear DO Issues
 Lower Cape Fear River Basin Cape Fear DO Issues by Jim Bowen, Assoc. Professor Civil Engr. Dept., UNC Charlotte Cape Fear Basin TMDL Conference Raleigh, NC September 9, 2003 Outline of Talk 1. Water Quality
Cultural accelerated by anthropogenic activities
 EUTROPHICATION IMPLICATIONS OF N & P Intent of this lecture? Link our discussions of terrestrial N & P dynamics with its influences on receiving water bodies How the relative amounts of N & P can influence
Using dynamic biomes and a climate model to describe the responses of the North Pacific to climate change over the 21 st Century
 Using dynamic biomes and a climate model to describe the responses of the North Pacific to climate change over the 21 st Century Jeffrey Polovina 1, John Dunne 2, Phoebe Woodworth 1, and Evan Howell 1
COMMON IMPLEMENTATION STRATEGY FOR THE WATER FRAMEWORK DIRECTIVE (2000/60/EC)
") Technical Report - 2009-030 COMMON IMPLEMENTATION STRATEGY FOR THE WATER FRAMEWORK DIRECTIVE (2000/60/EC) Guidance Document No. 23 GUIDANCE DOCUMENT ON EUTROPHICATION ASSESSMENT IN THE CONTEXT OF EUROPEAN
Technical Report - 2009-030 COMMON IMPLEMENTATION STRATEGY FOR THE WATER FRAMEWORK DIRECTIVE (2000/60/EC) Guidance Document No. 23 GUIDANCE DOCUMENT ON EUTROPHICATION ASSESSMENT IN THE CONTEXT OF EUROPEAN
Detection of redtides/habs: A Remote Sensing Perspective
 Detection of redtides/habs: A Remote Sensing Perspective P. Shanmugam 1 and Yu-Hwan Ahn 2 1 Indian Institute of Technology, Madras, India 2 Korea Ocean Research and Development Institute, Korea This presentation
Fish Conservation and Management
 Fish Conservation and Management CONS 486 Trophic pyramids, food webs, and trophic cascades oh my! Ross Chapter 2, Diana Chapter 1 Trophic interactions Limnological classification review Trophic pyramids
Overview National Aquatic Resource Surveys
 Overview National Aquatic Resource Surveys Tribal Water Workshop Oct. 6 th 2016 Mari Nord- USEPA Region 5 Sarah Lehmann USEPA Headquarters 1 Designed to Answer Key Policy Questions What is the condition
2009/2010 Water Column Overview, Red Tide Update, and Bay Eutrophication Model 2010 Results. OMSAP Meeting June 30, 2011.
 29/21 Water Column Overview, Red Tide Update, and Bay Eutrophication Model 21 Results OMSAP Meeting June 3, 211 Scott Libby Contributions from D. Anderson, D. Borkman, C.S. Chen, R. Geyer, and C. Oviatt
Michael Suplee, Ph.D. Montana Dept. of Environmental Quality. Prepared For: Flathead Lake Watershed Advisory Group Meeting June 17, 2013
 Michael Suplee, Ph.D. Montana Dept. of Environmental Quality Prepared For: Flathead Lake Watershed Advisory Group Meeting June 17, 2013 Review of events leading to the lake targets proposed in late 1990s
Recovery of marine ecosystems: Regime shifts, resilience and shifting baselines
 Recovery of marine ecosystems: Regime shifts, resilience and shifting baselines Jacob Carstensen Dept. of Bioscience, Aarhus University Phase I eutrophicatio n model Source: Cloern (001) Mar.Ecol.Prog.Ser.
4/28/2013. Transmission of Light in Seawater. Color in the Ocean Color of ocean ranges from deep blue to yellow-green Factors Turbidity from runoff
 1 2 3 4 5 6 7 8 9 10 11 12 13 14 CHAPTER 13 Biological Productivity and Energy Transfer Chapter summary in haiku form Primary produce Sunlight and phytoplankton Ocean is garden Chapter Overview Productivity
Session 2 Biodiversity Conservation
 Session 2 Biodiversity Conservation Nutrient Concentration and Water Turbidity on Coral Reef Area and their Effects on the Living Coral Koichi KINJO Okinawa Prefectural Institute of Health and Environment
Contributing authors:
 2 This document is based on the activities of the MISIS project (MSFD Guiding Improvements in the Black Sea Integrated Monitoring System) with the financial support from the EC DG Env. Programme "Preparatory
WASaF project team Kampala - Uganda
 The eutrophication of Lake Victoria: Consequences on the functioning of the lakes and on its use for the production of drinking water, monitoring strategies WASaF project team Kampala - Uganda What are
St. Lucie Estuary: Analysis of Annual Cycles and Integrated Water Column Productivity
 St. Lucie Estuary: Analysis of Annual Cycles and Integrated Water Column Productivity Tom Gallo, Malcolm Pirnie Inc. Clifton Bell, Malcolm Pirnie Inc. Peter Doering, South Florida Water Management District
WFD and MSFD in Slovenia regional perspective from a research point of view
 WFD and MSFD in Slovenia regional perspective from a research point of view Janja FRANCÉ & Martina ORLANDO-BONACA National Institute of Biology, Marine Biology Station Fornače 41, SI-6330 Piran WFD was
Thresholds in Recovery of Eutrophic Bay Sub-Systems: Five Case-Studies
 Thresholds in Recovery of Eutrophic Bay Sub-Systems: Five Case-Studies W. Michael Kemp, Walter Boynton, and Denise Breitburg University of Maryland CES & SERC (Collaborators: J. Testa, Y. Lee, J. Hagy,