2009/2010 Water Column Overview, Red Tide Update, and Bay Eutrophication Model 2010 Results. OMSAP Meeting June 30, 2011.
|
|
|
- Everett Cameron
- 6 years ago
- Views:
Transcription
1 29/21 Water Column Overview, Red Tide Update, and Bay Eutrophication Model 21 Results OMSAP Meeting June 3, 211 Scott Libby Contributions from D. Anderson, D. Borkman, C.S. Chen, R. Geyer, and C. Oviatt 7/6/211 1
2 29/21 Water Column Overview Nutrient, chlorophyll, and DO results Typical trends generally observed in these parameters Major Events - Variability in bloom frequency and magnitude (Phaeocystis, diatoms, and Alexandrium) Contingency Plan threshold results - 29 Alexandrium exceedance (and 211) - No exceedances in 21 Compare post transfer years and baseline Have nutrients changed near the outfall or in the farfield? Has phytoplankton biomass changed? Has dissolved oxygen changed? Has productivity changed? No Yes Yes, but regionally Yes, decreased 2

3 29/21 WQ Monitoring Program 12 Nearfield surveys/year 6 Farfield surveys/year Suite of oceanographic parameters measured In situ hydrographic parameters Nutrients Dissolved Oxygen Biomass Primary Production Phytoplankton and Zooplankton Community Structure Additional data from Other components of the MWRA HOM program GoMOOS & NOAA buoys 3
4 Nutrients NO NO 3 (µm) 6 NO 3 (µm) Boston Harbor Coastal Nearfield Offshore N. Boundary Cape Cod Baseline Mean Post-Diversion Mean Nearfield NO 3 (µm)
5 Nutrients SiO SiO 4 (µm) 6 SiO 4 (µm) Boston Harbor Coastal Nearfield Offshore N. Boundary Cape Cod Baseline Mean Post Mean Nearfield SiO 4 (µm)
6 Nutrients NH NH 4 (µm) 3 NH 4 (µm) Boston Harbor Coastal Nearfield Offshore N. Boundary Cape Cod NH 4 (µm) Baseline Mean Post-Diversion Mean Boston Harbor NH 4 (µm) Baseline Mean Post-Diversion Mean Nearfield
7 Annual Mean Nutrients NH 4 Post Diversion Large Decrease in Boston Harbor (red) Decrease in Coastal area (green) Initial doubling in nearfield (black) Unchanged elsewhere MB and CCB After 23 Decrease across all areas Current nearfield levels comparable to 9 s NH 4 (µm) Other nutrients more interannual variability and no long-term trends (except for decreases in all nutrients in Boston Harbor) Boston Harbor Coastal Nearfield N. Boundary Cape Cod Bay 7
8 Areal Chlorophyll Areal Chla (mg m -2 ) Areal Chla (mg m -2 ) Boston Harbor Coastal Nearfield Offshore N. Boundary Cape Cod Areal Chla (mg m -2 ) Boston Harbor Baseline Mean Post-Diversion Mean Areal Chla (mg m -2 ) Baseline Mean Post-Diversion Mean Nearfield 25 8
9 Particulate Organic Carbon POC (µm) 3 POC (µm) Boston Harbor Coastal Nearfield Offshore N. Boundary Cape Cod Nearfield Baseline Mean Post-Diversion Mean POC (µm) 3 2 POC (µm) 3 2 Baseline Mean 1 Boston Harbor Post-Diversion Mean
 3")


10 Nearfield Phytoplankton Abundance (1 6 cells L -1 ) Nearfield Area Phaeocystis Dinoflagellate Pennate Diatom Centric Diatom Cryptophytes Microflagellate Abundance (1 6 cells L -1 ) 6-Feb 25-Feb 18-Mar 8-Apr 12-May 15-Jun 21-Jul 17-Aug 1-Sep 3-Sep 2-Oct 1-Nov Nearfield Area 6-Feb 25-Feb 18-Mar 8-Apr 12-May 15-Jun 21-Jul 17-Aug 1-Sep 3-Sep 2-Oct 1-Nov 1
11 Abundance (1 6 cells L -1 ) Cape Cod Bay Phytoplankton Cape Cod Bay Areal Chla (mg m -2 ) Areal Chla 6-Feb 25-Feb 18-Mar 8-Apr 12-May 15-Jun 21-Jul 17-Aug 1-Sep 3-Sep 2-Oct 1-Nov Abundance (1 6 cells L -1 ) Cape Cod Bay Areal Chla (mg m -2 ) Feb 25-Feb 18-Mar 8-Apr 12-May 15-Jun 21-Jul 17-Aug 1-Sep 3-Sep 2-Oct 1-Nov Boston Harbor Coastal Nearfield Offshore N. Boundary Cape Cod Phaeocystis Dinoflagellate Pennate Diatom Centric Diatom Cryptophytes Microflagellate 11
12 Abundance (1 6 cells L -1 ) Northern Boundary Phytoplankton N. Boundary Area Areal Chla (mg m -2 ) Areal Chla 6-Feb 25-Feb 18-Mar 8-Apr 12-May 15-Jun 21-Jul 17-Aug 1-Sep 3-Sep 2-Oct 1-Nov 3 N. Boundary Area 3 Abundance (1 6 cells L -1 ) Areal Chla (mg m -2 ) Feb 25-Feb 18-Mar 8-Apr 12-May 15-Jun 21-Jul 17-Aug 1-Sep 3-Sep 2-Oct 1-Nov Boston Harbor Coastal Nearfield Offshore N. Boundary Cape Cod Phaeocystis Dinoflagellate Pennate Diatom Centric Diatom Cryptophytes Microflagellate 12
13 Abundance (1 6 cells L -1 ) Boston Harbor Phytoplankton Boston Harbor POC (µm) POC 6-Feb 25-Feb 18-Mar 8-Apr 12-May 15-Jun 21-Jul 17-Aug 1-Sep 3-Sep 2-Oct 1-Nov Abundance (1 6 cells L -1 ) Boston Harbor POC (µm) Feb 25-Feb 18-Mar 8-Apr 12-May 15-Jun 21-Jul 17-Aug 1-Sep 3-Sep 2-Oct 1-Nov Boston Harbor Coastal Nearfield Offshore N. Boundary Cape Cod Phaeocystis Dinoflagellate Pennate Diatom Centric Diatom Cryptophytes Microflagellate 13
14 Primary Production 4 3 Nearfield Baseline Mean Post-Diversion Mean N4 mg C m -2 d Boston Harbor Baseline Mean Post-Diversion Mean F N18 Baseline Mean Post-Diversion Mean mg C m -2 d -1 2 mg C m -2 d
15 Annual Productivity Harbor and Nearfield Annual Production (gc m -2 y -1 ) Comparison to Baseline Productivity Harbor Annual production decreased by 48% (P<.5) Nearfield station N16/N18 decreased by 3% (P<.5) No change in production at nearfield station N4 Large decrease in annual prod at all 3 stations after 22 N4 N16/N18 Post Diversion decreases in productivity coincident with (driven by?) regional decreases Exploring effects associated with regional forcing factors (i.e. winds and resulting stratification) F23 15
16 Baseline vs. Post-discharge Bottom DO Nearfield & Stellwagen DO (mg L -1 ) Nearf ield DO (mg L -1 ) Stellwagen Basin DO (% saturation) Nearf ield DO (% saturation) Stellwagen Basin 6 6 Baseline Mean Post-Diversion Mean

17 River Discharge 58th percentile 97 th percentile record-max* 28 th 24 th 98 th 58 th record-max* 3 rd 61 st record-min* Two Major Differences 29 very wet summer record high discharge th percentile 97 th percentile record-max* 28 th 66 th 98 th 83 rd record-max* 29 th 24 th Very wet winter record high discharge Very dry summer record low discharge * Conditions in summer 21 led to warmer, more saline waters Contributed to low DO levels in late summer/early fall 17
18 29-21 Summary Nutrients 29 high concentrations in February and March with sharp decline (except for SiO 4 ) coincident with the Phaeocystis bloom in MA Bay in April 21 lower concentrations in February with early diatom and Phaeocystis blooms 29/21 relatively low during summer with increasing concentrations and variability into the fall Chlorophyll Trends dominated by regional phytoplankton trends 29 large April Phaeocystis bloom in offshore MB waters, August diatom bloom observed in coastal, harbor, and CCB areas, and a late fall diatom bloom in MB 21 Phaeocystis dominated bloom in CBB and offshore waters of MB in February, large April diatom bloom in MB, subsequent diatom bloom in Boston Harbor and coastal waters in June, fall blooms of diatoms and dinoflagellates in nearfield waters. Low seasonal and annual chlorophyll vs. thresholds though close to baseline and post-diversion means Dissolved Oxygen Relatively high bottom water DO in 29 with fall minimum of >7 mg/l in nearfield Relatively low bottom water DO in 21 with fall minimum of <6.5 mg/l in nearfield Low bottom water DO levels correlated to warmer, more saline bottom waters consistent with 21 results 18
19 Baseline Comparison Summary Nutrients Increase in nearfield NH 4 in vicinity of the outfall Overall there has been decrease in NH 4 (and NO 3, SiO 4, and PO 4 ) in Boston Harbor and adjacent coastal waters Biomass Chlorophyll and POC Trends in Nearfield compared to baseline - Higher in winter/spring with March/April (Phaeocystis due to diatoms in 21) - Summer levels comparable - Early fall levels have decreased while late fall levels have increased vs. baseline 2-29 spring Phaeocystis blooms were regional events that contributed to a change in trends for winter/spring biomass levels in northern boundary, offshore and nearfield areas (April vs. February/March peak) No change in coastal, CCB or Boston Harbor areas. Productivity Rates have decreased since relocation in the harbor and nearfield Baseline vs. Post-diversion comparisons appear to be influenced by long-term trends that may be related to regional forcing mechanisms 19
20 Threshold Values for Nuisance Species Parameter Phaeocystis pouchetii (cells L -1 ) Pseudonitzschia (cells L -1 ) Alexandrium Time Period Winter/ spring Caution Level ,2, 186,4 269, 482, 2,87, 438,5 383, 2,15, 1,98, 42, 53,3 Summer 357 absent 14,9 1,7 164, , absent absent absent absent Autumn 2,54 absent absent absent absent absent absent absent absent absent absent Winter/ spring 21, 6, absent 77.5 absent absent 61 Summer 43, ,32 absent absent 54 absent 54 Autumn 24,7 6,3 3,21 12, absent 171 1,46 1,16 Any nearfield sample ,831 5, , No Phaeocystis exceedance in 29 & 21 Exceedance of Alexandrium threshold in May 29 2
 Sept 2 Transfer to Bay Outfall 1 6 Cells L -1 6 3 1992")

21 Phaeocystis pouchetii blooms Phaeocystis pouchetti (D. Borkman) Sept 2 Transfer to Bay Outfall 1 6 Cells L Boston Harbor Coastal Nearfield Offshore N. Boundary Cape Cod 21
22 Diatom and Phaeocystis Trends (time series analysis) Nearfield Abundance Trend Thousands of cells per liter Diatom TREND (cells / L) Phaeocystis TREND (cells / L) Year Diatom trend of long-term decline but increasing in 21 Phaeocystis peaking in Inverse correlation (Pearson r = -.47, P<.5) 22
23 Pseudo-nitzschia blooms Sept 2 Transfer to Bay Outfall Cells L Boston Harbor Coastal Nearfield Offshore N. Boundary Cape Cod 23
24 Nearfield Alexandrium Abundance Alexandrium per sample (cells/l +1 ) pre-discharge discharge caution level Minor blooms for both 29 and 21 in Massachusetts Bay Abundances >1 cells/l in 29 (= threshold exceedance) A major bloom had been forecast for 21, but counts <1 cells/l 24
25 Nuisance Species Summary Phaeocystis 29 large bloom in April highest in offshore MB waters 21 present in the bays in February-April, but at low abundances (lowest since 1999 when it was absent) Phaeocystis and diatoms are inversely correlated currently looking at what factor may be contributing to this trend Pseudo-nitzschia continues 1+ year trend of low abundances Alexandrium May/June 29 bloom cell abundance in MB was relatively low, but did exceed the 1 cell/l threshold. Overall a relatively minor bloom, but did result in some PSP toxicity closures in MB Observed early in 21, but only a minor bloom in MB (and Gulf of Maine) and did not result in a threshold exceedance or PSP toxicity in the bay Alexandrium model forecast for a moderate bloom for 29 and a major bloom in 21 25
26 29 ensemble forecast (1997) 26
27 29 Alexandrium Bloom in the Bay May 2 May 27 June 8 Bloom over by June 8 in the bay 27

28 29 Alexandrium Bloom Report of red water off Portsmouth, NH on July 1, 29 WHOI confirms Alexandrium abundances of 25, to nearly 1,8, cells L -1! WHOI survey on July 12 showed elevated abundances off Cape Ann reaching 7,2 cells L -1 offshore Much lower abundances in Massachusetts Bay Overall 29 bloom was minor to moderate in Massachusetts Bay Abundances in 1s cells L -1 PSP closures in the bay July 12 28
29 21 ensemble forecast 29
30 21 Alexandrium Bloom in the Bay May 3 May 11 May 21 Nearfield peak abundance May 3 at N1 79 cells/l Maximum abundance May 11 at AF4 (south shore) 285 cells/l Minor Alexandrium event in Massachusetts Bay and Gulf of Maine No PSP toxicity in MA or NH in 21 3
 - early May (WHOI, bottom) Source: McGillicuddy et al.")
31 21 Alexandrium Bloom Disconnect between observations and model: - early April (WF14, top) - early May (WHOI, bottom) Source: McGillicuddy et al. submitted 31
32 So what happened? Why was the forecast so wrong? Working hypothesis: A mesoscale Gulf of Maine water mass change occurred that was outside the envelope of observations from the last six years used as the basis of the 21 ensemble forecast. - GOMTOX cruise data are being used to assess this hypothesis and these factors. Alexandrium cysts germinated into conditions not supportive of normal growth (i.e. the endogenous clock that regulates germination was out of synch with the environment in 21). Forecast was for a moderate bloom in 211 Indications that similar water mass conditions are present in
33 211 ensemble forecast 33
34 211 Alexandrium Bloom in the Bay April 4 May 2 May 25 Early presence of Alexandrium in MB in April low abundance Nearfield peak abundance May 2 at N7 2,453 cells/l Relatively high abundances present through late May 34

35 211 Alexandrium Bloom in the Bay June 1 June 8 June 16 Elevated counts (5-18 cells L -1 ) in nearfield and coastal waters in early June Bloom was over by mid-june Overall a Moderate Alexandrium event in Massachusetts Bay Abundances in the 1s cells L -1 PSP toxicity closures from Cape Ann south to Plymouth 35
36 211 Observations vs. Model Good overall concurrence between data and model Captured initial, peak and end of the bloom Some variability, but essentially captured the temporal and spatial trends in the observed data 36
37 Red Tide Summary Moderate blooms in 29 and 211 Higher cell abundances observed in 211 PSP toxicity closures from Cape Ann to along the South Shore Minor bloom in 21 Peaked below 1 cells L -1 No PSP toxicity closures in Massachusetts Bay Model Forecasts Good results forecasting the moderate blooms in 29 and 211 Still a work in progress understanding 21 bloom result Date evaluation and interpretation on 211 bloom ongoing 37
38 MB FVCOM domain:.5-1 km Modeling 21 in Massachusetts Bay Unstructured-grid Bay Eutrophication Model Regional FVCOM domain: up to 2.5 km 38
39 Model-predicted temperature and salinity Temperature Salinity 39


40 21 model results and observations at Station N18 4

41 F26 F27 Observation of DIN in the bottom-layer at stations F26 and F27 Near the northern open boundary 41
42 Multi-year comparison of DIN in the surface layer Black: 28. Blue: 29. Red: 21. Stations: Outfall, N18, N7, F15, F13, F1) 42
43 Multi-year comparison of chlorophyll in the surface layer Black: 28. Blue: 29. Red: 21. Stations: Outfall, N18, N7, F15, F13, F1) 43
44 Multi-year comparison of DO in the bottom layer Black: 28. Blue: 29. Red: 21. Stations: Outfall, N18, N7, F15, F13, F1) 44
45 DIN projection (black: with outfall; red: without outfall) Surface waters Bottom layer 45
46 Do and chlorophyll projection (black: with outfall; red: without outfall) Bottom DO Surface chlorophyll 46
47 Modeling Summary Model with data assimilation is able to capture general trends in observed 21 water quality physical conditions, DIN, and DO. Measured nutrient concentrations in February 21 were significantly lower than previous year. Driven by these lower levels the model failed to capture the spring Chl-a peak. Model-simulated Chl-a concentration is very sensitive to the nutrient flux condition on the northern boundary area Model-based conclusions about the impact of MWRA outfall remains similar to previous years Model showed differences in DIN in nearfield and vicinity No apparent differences in the DO or Chl-a modeled results Agreement between model output and monitoring observations. 47

48 Acknowledgements The data presented are the result of the efforts from many HOM7 & HOM8 team members including: Presenters from the 211 Technical Meeting who provided slides: D. Anderson, D. Borkman, C.S. Chen, R. Geyer, & C. Oviatt Battelle Coastal and Marine Systems field group Battelle, subcontractor, and MWRA labs Matt Fitzpatrick for helping with data analysis & graphics WHOI/Don Anderson s team for Alexandrium information 48
49 49

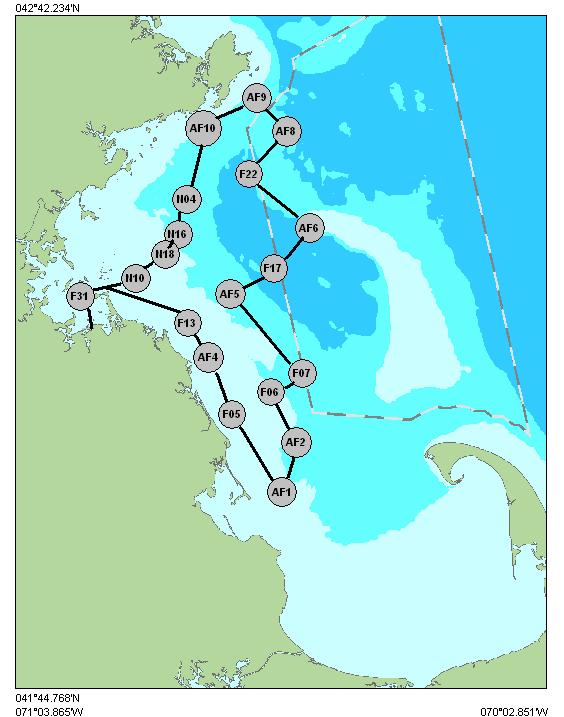
50 211 Station Maps 5
51 Annual Production Harbor Annual production decreased by 48% Nearfield station N16/N18 decreased by 3% No change in production at station N4 Annual Production 8 6 g C m -2 y F23 N16/N18 N4 51


52 Conceptual Model 25 Bloom Regional blooms initiated in western Gulf of Maine and driven by physical forcing mechanisms Expect these blooms to continue with regularity in GoM and lead to frequent toxicity in Massachusetts Bay 52

 Endogenous Clock Multi-nested configuration")

53 A Coupled Bio-physical Numeric Model for Alexandrium fundyense Dennis McGillicuddy, Ruoying He, Don Anderson, Bruce A. Keafer and others Cyst Dist. (# / cm^2) Endogenous Clock Multi-nested configuration for the regional GOM circulation and A. fundyense bloom population dynamics modeling. Germ. rate (% / day) Growth (per day) 53


54 21 Forecast Cyst Maps 29 Source: McGillicuddy et al. submitted 54
; 33 rivers; WRF-assimilated meteorological forcing (wind, net heat flux/solar irradiance, and precipitation")
55 Nested Regional and MB FVCOM System Regional FVCOM domain: up to 2.5 km Driven by five tidal constituents at GOM open boundary (M 2, S 2, N 2, K 1 and O 1 ); 33 rivers; WRF-assimilated meteorological forcing (wind, net heat flux/solar irradiance, and precipitation minus evaporation). - Data assimilation of all available T, S data MB FVCOM domain:.5-1 km Driven by Regional FVCOM fields at the nested boundary and the same meteorological and river discharges (13 rivers). Total vertical layers: 3. 55
 atmospheric loading boundary conditions extrapolated based bio-monthly MWRA observations")
56 UG-RCA Simulation UG-RCA Driven by hourly FVCOM physical fields WRF-calculated solar radiation for photosynthesis winds for DO reareation point source loadings non-point source loadings rive discharges (3 rivers) atmospheric loading boundary conditions extrapolated based bio-monthly MWRA observations 56
57 At 4413 In MB Monthly averaged wind Surface net flux River discharges 57
MODELING 2010 IN MASSACHUSETTS BAY USING THE UNSTRUCTURED-GRID BAY EUTROPHICATION MODEL
 MODELING 2010 IN MASSACHUSETTS BAY USING THE UNSTRUCTURED-GRID BAY EUTROPHICATION MODEL C. Chen, L. Z. Zhao, R. C. Tian and P. F. Xue MITSG 12-26 Sea Grant College Program Massachusetts Institute of Technology
2008 Water Column Monitoring Results
 2008 Water Column Monitoring Results Massachusetts Water Resources Authority Environmental Quality Department Report 2009-12 Citation Libby PS, Anderson DM, Borkman DG, Geyer WR, Keller AA, Oviatt CA,
2017 Water column monitoring results. Massachusetts Water Resources Authority Environmental Quality Department Report
 2017 Water column monitoring results Massachusetts Water Resources Authority Environmental Quality Department Report 2018-04 Citation Libby PS, Borkman DG, Geyer WR, Turner JT, Costa AS, Wang J, Codiga
List of proposed interim changes to MWRA s Effluent Outfall Ambient Monitoring Plan April 15, 2009
 LIST OF PROPOSED INTERIM CHANGES TO MWRA S EFFLUENT OUTFALL AMBIENT MONITORING PLAN APRIL 2009 Changes to the plan are based on data collected and technical reports written since the monitoring began,
2008 Outfall Monitoring Overview
 2008 Outfall Monitoring Overview Massachusetts Water Resources Authority Environmental Quality Department Report 2009-16 Citation: Werme C, Rex AC, Hall MP, Keay KE, Leo WS, Mickelson MJ, Hunt CD. 2009.
2009 ANNUAL LIST OF PROPOSED CHANGES TO MWRA S EFFLUENT OUTFALL AMBIENT MONITORING PLAN OCTOBER 23, 2009
 2009 ANNUAL LIST OF PROPOSED CHANGES TO MWRA S EFFLUENT OUTFALL AMBIENT MONITORING PLAN OCTOBER 23, 2009 Proposed changes to the plan are based on data collected and technical reports written since the
Semiannual water column monitoring report
 Semiannual water column monitoring report February - June 21 Massachusetts Water Resources Authority Environmental Quality Department Report ENQUAD 22-1 Citation: Libby PS, McLeod LA, Mongin CJ, Keller
Modeling 2011 in Massachusetts Bay using the unstructured grid Bays Eutrophication Model
 Modeling 2011 in Massachusetts Bay using the unstructured grid Bays Eutrophication Model Massachusetts Water Resources Authority Environmental Quality Department Report 2012 13 Citation: Zhao LZ,Tian Chen
Modeling 2012 in Massachusetts Bay using the unstructured grid Bays Eutrophication Model
 Modeling 2012 in Massachusetts Bay using the unstructured grid Bays Eutrophication Model Massachusetts Water Resources Authority Environmental Quality Department Report 2015 02 Modeling 2012 in Massachusetts
Semiannual water column monitoring report
 Semiannual water column monitoring report February - July 2 Massachusetts Water Resources Authority Environmental Quality Department Report ENQUAD 2-19 Citation: Libby PS, McLeod LA, Mongin CJ, Keller
MECHANISM STUDIES OF SEASONAL VARIABILITY OF DISSOLVED OXYGEN IN MASS BAY: A MULTI- SCALE FVCOM/UG-RCA APPLICATION. P. Xue, C. Chen et al.
 MECHANISM STUDIES OF SEASONAL VARIABILITY OF DISSOLVED OXYGEN IN MASS BAY: A MULTI- SCALE FVCOM/UG-RCA APPLICATION P. Xue, C. Chen et al. MITSG 14- Sea Grant College Program Massachusetts Institute of
Nutrient Response to Sewage Abatement in Hong Kong
 Nutrient Response to Sewage Abatement in Hong Kong Prof. Paul J. Harrison Atmospheric, Marine & Coastal Environment Program Institute for the Environment HK University of Science & Technology Outline Background
2005 Annual benthic nutrient flux monitoring report
 5 Annual benthic nutrient flux monitoring report Massachusetts Water Resources Authority Environmental Quality Department Report ENQUAD 6-17 Citation: Tucker J, Kelsey S, Giblin A, and Hopkinson C. 6.
2003 Annual benthic nutrient flux monitoring report
 3 Annual benthic nutrient flux monitoring report Massachusetts Water Resources Authority Environmental Quality Department Report ENQUAD 4-5 Citation: Tucker J, Kelsey S, Giblin A, and Hopkinson C. 4. 3
Benthic Nutrient Cycling in Boston Harbor and Massachusetts Bay
 Benthic Nutrient Cycling in Boston Harbor and Massachusetts Bay Anne Giblin, Charles Hopkinson & Jane Tucker The Ecosystems Center, Marine Biological Laboratory Woods Hole, MA 2543 September 22, 1999 Boston
5.0 PHYTOPLANKTON PHYSIOLOGY. Luke Twomey Christopher P. Buzzelli Hans W. Paerl. 5.1 Introduction
 5. PHYTOPLANKTON PHYSIOLOGY Luke Twomey Christopher P. Buzzelli Hans W. Paerl 5.1 Introduction Phytoplankon production is the primary source of organic carbon in the water column of the NRE (Matson and
Journal of Marine Systems
 Journal of Marine Systems 131 (14) 1 11 Contents lists available at ScienceDirect Journal of Marine Systems journal homepage: www.elsevier.com/locate/jmarsys Mechanism studies of seasonal variability of
l ake Biology terc.ucdavis.edu
 l ake Biology Algae growth (primary productivity) Yearly since 1959 Primary productivity (PPr) is a measure of the rate at which algae produce biomass through photosynthesis. At Lake Tahoe, it has been
The 2005 New England red tide of Alexandrium fundyense: observations, causes, and potential outfall linkages
 The 2005 New England red tide of Alexandrium fundyense: observations, causes, and potential outfall linkages Massachusetts Water Resources Authority Environmental Quality Department Report ENQUAD 2007-10
A. Brief summary of A. fundyense bloom and toxicity patterns for the years that
 A. Brief summary of A. fundyense bloom and toxicity patterns for the years that relate to those in which cyst surveys were conducted. 1997. This was a year of low shellfish toxicity in the WGOM and EGOM
Massachusetts Water Resources Authority
 Massachusetts Water Resources Authority Sediment Studies in Mass. Bay Wastewater Advisory Committee January 7, 2011 Frederick A. Laskey Executive Director Benthic Nutrient Flux Study Study design Four
Younjoo Lee and Walter Boynton. Horn Point Laboratory and Chesapeake Biological Laboratory University of Maryland Center for Environmental Science
 Younjoo Lee and Walter Boynton Horn Point Laboratory and Chesapeake Biological Laboratory University of Maryland Center for Environmental Science 1 Data and Method Summer Hypoxia Dissolve Oxygen Patterns
Science of the Causes of Hypoxia Nancy Rabalais et al.
 Science of the Causes of Hypoxia Nancy Rabalais et al. In support of overview of diversions and hypoxia, and context for refining science needs; July 14, 2014 Scientific Curiosity Hypothesis Testing Management
Alexandrium Rapid Response Study Survey Plan. Revision 1. Massachusetts Water Resources Authority Environmental Quality Department Report
 Alexandrium Rapid Response Study Survey Plan. Revision 1 Massachusetts Water Resources Authority Environmental Quality Department Report 2013-06 Citation Libby PS, Rex AC, Keay KE, Mickelson MJ. 2013.
HYPOXIA Definition: ~63 µm; 2 mg l -1 ; 1.4 ml l -1 ; 30 %
 HYPOXIA Definition: ~63 µm; 2 mg l -1 ; 1.4 ml l -1 ; 30 % Consequences of hypoxia Reduce habitat for living resources Change biogeochemical processes P released from sediments Denitrification reduced
BIOLOGY TERC.UCDAVIS.EDU
 10 Algae growth (primary productivity) Yearly since 1959 Primary productivity is a measure of the rate at which algae produce biomass through photosynthesis. It was first measured at Lake Tahoe in 1959
Current and estimated future atmospheric nitrogen loads to the Chesapeake Bay Watershed
 Current and estimated future atmospheric nitrogen loads to the Chesapeake Bay Watershed Jesse O. Bash, Kyle Hinson, Patrick Campbell, Norm Possiel, Tanya Spero, Chris Nolte 1 Outline Background of historic
St. Lucie Estuary: Analysis of Annual Cycles and Integrated Water Column Productivity
 St. Lucie Estuary: Analysis of Annual Cycles and Integrated Water Column Productivity Tom Gallo, Malcolm Pirnie Inc. Clifton Bell, Malcolm Pirnie Inc. Peter Doering, South Florida Water Management District
Development of Carbon Data Products for the Coastal Ocean: Implications for Advanced Ocean Color Sensors
 Development of Carbon Data Products for the Coastal Ocean: Implications for Advanced Ocean Color Sensors Antonio Mannino NASA Goddard Space Flight Center Greenbelt, Maryland USA Field Activities & DOC
Causes of Gulf of Mexico Hypoxia
 Causes of Gulf of Mexico Hypoxia Nancy N. Rabalais 1 R. Eugene Turner 2 1 Louisiana Universities Marine Consortium 2 Louisiana State University Center for Sponsored Coastal Ocean Research, Coastal Ocean
CONTINGENCY PLAN REVISION 1
 CONTINGENCY PLAN REVISION 1 MAY 2001 Massachusetts Water Resources Authority Environmental Quality Department Report ENQUAD ms-071 Citation: MWRA. 2001. Massachusetts Water Resources Authority Contingency
Climate Change and Phenology in Narragansett Bay Phytoplankton. Introduction
 Sarah Blackstock OCG561: Biological Oceanography Susanne Menden-Deuer Research Project 3 December 2013 Climate Change and Phenology in Narragansett Bay Phytoplankton Introduction As time-series on plankton
A review of issues related to the development of a food web model for important prey of endangered species in Massachusetts and Cape Cod Bays
 A review of issues related to the development of a food web model for important prey of endangered species in Massachusetts and Cape Cod Bays Massachusetts Water Resources Authority Environmental Quality
Joint Cruise Methodology
 Joint Cruise Methodology Alexander Mikaelyan & Tamara Shiganova Batumi, 22 May The main goal of the Joint Cruises To provide ecosystem monitoring of the open waters of the Black Sea on inter-annual and
Fig. 1. Map for location
 The Asian Journal of Biology Education (2002) Number 1 3 Faculty of Education, Shiga University 2--1 Hiratsu, Otsu, 20-0862. Japan. Introduction Lake Biwa (Fig. 1) is the largest lake in Japan and one
Meredith Howard Karen McLaughlin Nikolay Nezlin
 Meredith Howard Karen McLaughlin Nikolay Nezlin SCCWRP Objectives For Diversion Determine the fate of effluent nitrogen How quickly is effluent nitrogen consumed or transformed? Is effluent nitrogen being
Climate change impact assessement considering water discharge and nutrients in a mesoscale coastal watershed
 Climate change impact assessement considering water discharge and nutrients in a mesoscale coastal watershed - input from a catchment to its lagoon- Anastassi Stefanova 1 *, Cornelia Hesse 1, Valentina
Chemical and Physical Analysis of the Cape Fear Estuary
 The Cape Fear River Chemical and Physical Analysis of the Cape Fear Estuary The Cape Fear River (CFR), the most industrialized of all North Carolina s rivers, winds for over miles through the heart of
Model Study of Coupled Physical-Biogeochemical Variability in the Labrador Sea
 Model Study of Coupled Physical-Biogeochemical Variability in the Labrador Sea Hakase Hayashida M.Sc. Thesis (Physical Oceanography) Memorial University of Newfoundland January 14, 214 Global carbon cycle:
Annual Report on Clam Bay Numeric Nutrient Concentration (NNC) Criteria
 Criteria") March 7, 2018 Tim Hall, Turrell, Hall and Associates, Inc. David Tomasko, Ph.D. Emily Keenan, M.S. Annual Report on Clam Bay Numeric Nutrient Concentration (NNC) Criteria Executive Summary Water quality
March 7, 2018 Tim Hall, Turrell, Hall and Associates, Inc. David Tomasko, Ph.D. Emily Keenan, M.S. Annual Report on Clam Bay Numeric Nutrient Concentration (NNC) Criteria Executive Summary Water quality
Upper Mississippi River Lake Pepin Modeling Lake Pepin Municipal Sector Meeting August 6, 2008
 Upper Mississippi River Lake Pepin Modeling Lake Pepin Municipal Sector Meeting August 6, 2008 Lake Pepin Photo by Guy Schmickle Overview Fundamentals Why model? What is a model? Model Development How
Nutrients, Algal Blooms and Red Tides in Hong Kong Waters. Paul J. Harrison and Jie XU
 Nutrients, Algal Blooms and Red Tides in Hong Kong Waters Paul J. Harrison and Jie XU Division of Environment, Hong Kong University of Science & Technology 1. Introduction The Pearl River is China's second
Monitoring Cruise Report
 r/v Gunnar Thorson Monitoring Cruise Report Cruise No.: GT 248 Time: 19-23 January 2009 Area: The Sound, the Arkona Sea, the Belt Sea and the Kattegat National Environmental Research Institute Aarhus University
Hypoxia in the Gulf of Mexico: Benefits and Challenges of Using Multiple Models to Inform Management Decisions
 Hypoxia in the Gulf of Mexico: Benefits and Challenges of Using Multiple Models to Inform Management Decisions Multiple Models for Management (M3.2) in the Chesapeake Bay February 25, 2013 Annapolis MD
COMBINED WORK/QUALITY ASSURANCE PROJECT PLAN (CWQAPP) for
 for") COMBINED WORK/QUALITY ASSURANCE PROJECT PLAN (CWQAPP) for WATER COLUMN MONITORING 2002 2005 Tasks 9, 10, 12, 13, 14, 15 MWRA Harbor and Outfall Monitoring Project submitted to MASSACHUSETTS WATER RESOURCES
COMBINED WORK/QUALITY ASSURANCE PROJECT PLAN (CWQAPP) for WATER COLUMN MONITORING 2002 2005 Tasks 9, 10, 12, 13, 14, 15 MWRA Harbor and Outfall Monitoring Project submitted to MASSACHUSETTS WATER RESOURCES
Shen Zhen. New Territories. Stonecutters Island Kowloon. Victoria Harbor WM4 VM2 VM5 SM10. Hong Kong SM6. South China Sea.
 Shen Zhen Pearl River Estuary Latitude ( o N) New Territories Stonecutters Island Kowloon Victoria Harbor WM4 VM7 SM VM VM Hong Kong Lantau Islannd SM9 WM Island EM3 South China Sea Longitude ( o E) Fig..
SWEM QUESTIONS FOR MODEL WORKSHOP
 SWEM QUESTIONS FOR MODEL WORKSHOP A. Management Overview What is the purpose (i.e., heuristic or predictive?) of the model as a management tool? In principle, SWEM is meant to be a predictive tool, although
Boston Harbor Water Quality ( ) Massachusetts Water Resources Authority Environmental Quality Department Report
 Massachusetts Water Resources Authority Environmental Quality Department Report") Boston Harbor Water Quality (1994-2015) Massachusetts Water Resources Authority Environmental Quality Department Report 2016-08 Citation: Taylor, DI. 2016. Boston Harbor Water Quality (1994-2015). Boston:
Boston Harbor Water Quality (1994-2015) Massachusetts Water Resources Authority Environmental Quality Department Report 2016-08 Citation: Taylor, DI. 2016. Boston Harbor Water Quality (1994-2015). Boston:
NGOMEX: Effects of moderate hypoxia on benthic organisms in the Gulf of Mexico
 NGOMEX: Effects of moderate hypoxia on benthic organisms in the Gulf of Mexico Ed Buskey, Laura Ryckman, Wayne Gardner and Peter Thomas Marine Science Institute The University of Texas at Austin What is
Recovery of the Great Salt Lake Brine Shrimp Population
 Recovery of the Great Salt Lake Brine Shrimp Population By: Brad Marden INVE Aquaculture, Inc. Utah Strategic Alliance, LLC TOPICS Population Dynamics : 1 to 5 years Decline and Recovery: Management and
in Puget Sound? What caused the 50-y north-to-south
 What about HAB in Puget Sound? What caused the 50-y north-to-south spread of PSP? Harmful algal species in PS Alexandrium catenella: paralytic shellfish poisoning (PSP) and diatoms in the genus Pseudo-nitzschia
In Situ Chlorophyll Fluorescence Observations on NERACOOS Mooring A01: Revised Data Flagging and Changing Phenology
 In Situ Chlorophyll Fluorescence Observations on NERACOOS Mooring A01: Revised Data Flagging and Changing Phenology Massachusetts Water Resources Authority Environmental Quality Department Report 2016-15
Massachusetts Water Resources Authority. Environmental Quality Department Report ENQUAD 99-09
 Scope of work for a food web model to characterize the seasonal abundance for important prey species of endangered species in Massachusetts and Cape Cod Bays Massachusetts Water Resources Authority Environmental
Effects of Winds on Hypoxia Formation in the Pearl River Estuarine Coastal Waters
 The 1th International Estuarine Biogeochemistry Symposium May 19-22, 28, Xiamen China Effects of Winds on Hypoxia Formation in the Pearl River Estuarine Coastal Waters Kedong YIN 1,2,3, Paul J. Harrison
Production and Life OCEA 101
 Production and Life OCEA 101 Overview Photosynthesis Primary production Phytoplankton biomass Controls on primary production and biomass Food webs Photosynthesis Photosynthesis requires: (i) sunlight (ii)
Boston Harbor Water Quality Update Massachusetts Water Resources Authority Environmental Quality Department Report
 Boston Harbor Water Quality Update 1995-217 Massachusetts Water Resources Authority Environmental Quality Department Report 218-6 Citation: Taylor, DI. 218. Boston Harbor Water Quality Update, 1995-217.
Ireland: Predictions. NMP Current closures ASP AZP DSP PSP
 HAB Bulletin [status of harmful and toxic algae] Ireland: Predictions Week 46: November 11 th - 17 th 2018 Week runs from Sunday to Saturday ASP event: AZP event: DSP event: PSP event: Low steady and currently
Feedback mechanisms between cyanobacterial blooms, transient hypoxia and benthic phosphorus regeneration in shallow coastal environments
 Low oxygen environments in marine, estuarine and fresh waters 46th International Liege colloquium 5-9 May 214 Feedback mechanisms between cyanobacterial blooms, transient hypoxia and benthic phosphorus
A Review of the EcoGEM Modeling Approach as applied to Narragansett Bay, RI
 A Review of the EcoGEM Modeling Approach as applied to Narragansett Bay, RI Jason Krumholz Jamie Vaudrey (UConn), Mark Brush (VIMS) Dave Ullman (URI) Long Island Sound Water Quality Workshop July 14 15,
Interannual variations of nutrients and primary production over the southeastern Beirng Sea shelf during spring of 1997,1998,and 1999
 Interannual variations of nutrients and primary production over the southeastern Beirng Sea shelf during spring of 1997,1998,and 1999 TaeKeun Rho,Terry E. Whitledge, and John J. Goering Institute of Marine
Management of the Niemen River basin with account of adaptation to climate change
 Management of the Niemen River basin with account of adaptation to climate change Assessment of current status of water resources in the Niemen River Basin Vladimir Korneev, Egidijus Rimkus v_korn@rambler.ru
Relationships between Residence Time and Cyanobacterial Blooms in a Nutrient-Rich River System
 Relationships between Residence Time and Cyanobacterial Blooms in a Nutrient-Rich River System Michael F. Coveney, John C. Hendrickson, Erich R. Marzolf, Rolland S. Fulton, Jian J. Di, Clifford P. Neubauer,
Sensitivity of the Oxygen Dynamics in the Black Sea North Western Shelf to physical and biogeochemical processes : 3D model approach.
 Sensitivity of the Oxygen Dynamics in the Black Sea North Western Shelf to physical and biogeochemical processes : 3D model approach titre Capet Arthur, Grégoire M, Beckers, JM.,Joassin P., Soetaert K.,
Operational System for Coastal Waters of Gdansk Region
 Operational System for Coastal Waters of Gdansk Region Goals Supporting the Region Authority and the society with essential information about the coastal water conditions Coastal water dangers warning
Predicting algal growth under climate change in the upper Thames Mike Hutchins, CEH Wallingford
 Predicting algal growth under climate change in the upper Thames Mike Hutchins, CEH Wallingford (plus Richard Williams, Christel Prudhomme, Sue Crooks) Changes in the Thames by 2080 Brought about by economic
Pacific Coastal Ecology Branch Physical and Water Quality Data
 Pacific Coastal Ecology Branch Physical and Water Quality Data Data Contributors: Cheryl A. Brown, Peter Eldridge, Robert Ozretich, Anne Sigleo & David Specht CRUISES CTD profiles using (SBE 19 SEACAT)
Bolton Town Hall February 24, George Knoecklein Northeast Aquatic Research Mansfield, CT
 Bolton Town Hall February 24, 214 George Knoecklein Northeast Aquatic Research Mansfield, CT Working Hypothesis 1. Deep drawdowns of Middle Bolton Lake fueled high growth rates of naiad in Lower Bolton
To upscale or downscale? Thoughts on bridging disparate scales of space and time in linking the planetary to the plankton
 To upscale or downscale? Thoughts on bridging disparate scales of space and time in linking the planetary to the plankton Nate Mantua University of Washington JISAO/SMA Climate Impacts Group PICES/CLIVAR
Massachusetts Bay Eutrophication Model: Simulation
 Massachusetts Bay Eutrophication Model: 2002-2004 Simulation Massachusetts Water Resources Authority Environmental Quality Department Report ENQUAD 2006-13 Jiang M, Zhou M. 2006. Massachusetts Bay Eutrophication
PRESS RELEASE. LOUISIANA UNIVERSITIES MARINE CONSORTIUM July 28, Abstract
 PRESS RELEASE LOUISIANA UNIVERSITIES MARINE CONSORTIUM July 28, 2013 Abstract The 2013 area of low oxygen, commonly known as the Dead Zone, measured 15,120 square kilometers (= 5,800 square miles) in this
Dead-Zones and Coastal Eutrophication: Case- Study of Chesapeake Bay W. M. Kemp University of Maryland CES Horn Point Laboratory Cambridge, MD
 Dead-Zones and Coastal Eutrophication: Case- Study of Chesapeake Bay W. M. Kemp University of Maryland CES Horn Point Laboratory Cambridge, MD Presentation to COSEE Trends Orientation at UMCES HPL 4 August
Dog River Watershed Management Plan
 Dog River Watershed Management Plan Preliminary Water Quality Data Analysis Doug Robison, PWS ESA is where solutions and service meet. Water Quality - Regulatory Primer Designated Use Categories Swimming
Chromophoric Dissolved Organic Matter (CDOM) in United States Estuaries. Robert F. Chen, Bernie Gardner, Wei Huang & Francesco Peri
 in United States Estuaries. Robert F. Chen, Bernie Gardner, Wei Huang & Francesco Peri") Chromophoric Dissolved Organic Matter (CDOM) in United States Estuaries Robert F. Chen, Bernie Gardner, Wei Huang & Francesco Peri CDOM in Coastal Waters Chromophoric Dissolved Organic Matter (CDOM) Absorbs
Chromophoric Dissolved Organic Matter (CDOM) in United States Estuaries Robert F. Chen, Bernie Gardner, Wei Huang & Francesco Peri CDOM in Coastal Waters Chromophoric Dissolved Organic Matter (CDOM) Absorbs
7.9 Nitrogenous Nutrients and Plankton Production in Jamaica Bay, NY
 7.9 Nitrogenous Nutrients and Plankton Production in Jamaica Bay, NY Ray Sambrotto 7.9.1 SUMMARY Two blooms characterize phytoplankton growth in Jamaica Bay: the winter/spring bloom, between February and
Chesapeake Bay. report card
 Chesapeake Bay report card 2010 C- C Healthy water quality provides better habitat conditions for crabs, fish, and other aquatic species. issolved oxygen is essential to the survival of all these organisms;
Time-series and Underway Assessments of Ocean Acidification and Carbon System Properties in Coastal Waters
 NGI Annual Meeting 2012 Time-series and Underway Assessments of Ocean Acidification and Carbon System Properties in Coastal Waters Wei-Jun Cai, Xinping Hu, Scott Noakes, Joe Salisbury, Doug Vandemark,
Real time Water Quality Monitoring
 Real time Water Quality Monitoring Robert Schuster New Jersey Department of Environmental Protection Water Monitoring and Standards Bureau of Marine Water Monitoring Presented at NJWMCC Meeting September
Monitoring Cruise Report
 r/v Gunnar Thorson Monitoring Cruise Report Cruise no.: GT 247 Time: 15-19 September 2008 Area: The Sound, the Arkona Sea, the Belt Sea and the Kattegat National Environmental Research Institute University
Patterns of Productivity
 Phytoplankton Zooplankton Nutrients Patterns of Productivity There is a large Spring Bloom in the North Atlantic (temperate latitudes remember the Gulf Stream!) What is a bloom? Analogy to terrestrial
increase in mean winter air temperature since 1950 (Ducklow et al, 2007). The ocean
. The ocean") Exploring the relationship between Chlorophyll a, Dissolved Inorganic Carbon, and Dissolved Oxygen in the Western Antarctic Peninsula Ecosystem. Katie Coupland December 3, 2013 Since the start of the industrial
Exploring the relationship between Chlorophyll a, Dissolved Inorganic Carbon, and Dissolved Oxygen in the Western Antarctic Peninsula Ecosystem. Katie Coupland December 3, 2013 Since the start of the industrial
Will a Shift in Algal Composition in. System Help Achieve the CLRMA
 Presented By: Craig Wolf Will a Shift in Algal Composition in Response to the Destratification System Help Achieve the Chlorophyll a Standard? CLRMA Denver, CO November, 2011 Where am I going Today! Background
Nutrient Sources, Fate, Transport, and Effects Study of Galveston Bay, Texas Rachel Windham,
 Nutrient Sources, Fate, Transport, and Effects Study of Galveston Bay, Texas Rachel Windham, Department of Marine Biology Texas A&M University at Galveston 2 Acknowledgements: Dr. Antonietta Quigg Members
Bellingham Bay hypoxia and water quality study
 Bellingham Bay hypoxia and water quality study Jude Apple Shannon Point Marine Center Western Washington University Dan Burns, Charlotte Clausing, L. Jessica Urbanec, Jason Seber and Eleno Alaniz Northwest
Figure 1. Platte River Sub-Watersheds and Monitoring Locations.
 Figure 1. Platte River Sub-Watersheds and Monitoring Locations. 10 2 1 9 7 BL Pond 8 Hatchery 6 3 5 4 1 Platte River at Fewins Rd 6 B. Creek to Hatchery Spring 2 Platte River at Stone Bridge 7 Platte River
24 months after offshore transfer : an update of water quality improvements in Boston Harbor
 24 months after offshore transfer : an update of water quality improvements in Boston Harbor Massachusetts Water Resources Authority Environmental Quality Department Report ENQUAD 2003-04 24 months after
Assessing the efficiency of iron fertilization on atmospheric CO2 using an intermediate complexity ecosystem model of the global ocean
 The Ocean in a High CO2 World Assessing the efficiency of iron fertilization on atmospheric CO2 using an intermediate complexity ecosystem model of the global ocean Olivier Aumont 1 and Laurent Bopp 2
Includes the coastal zone and the pelagic zone, the realm of the oceanographer. I. Ocean Circulation
 Includes the coastal zone and the pelagic zone, the realm of the oceanographer I. Ocean Circulation II. Water Column Production A. Coastal Oceans B. Open Oceans E. Micronutrients F. Harmful Algal Blooms
The Hawaii Ocean Time-series (HOT): Highlights and perspectives from two decades of ocean observations
: Highlights and perspectives from two decades of ocean observations") The Hawaii Ocean Time-series (HOT): Highlights and perspectives from two decades of ocean observations MATTHEW CHURCH UNIVERSITY OF HAWAII OCB SCOPING WORKSHOP SEPTEMBER 2010 A Dedicated HOT Team NSF What
The Hawaii Ocean Time-series (HOT): Highlights and perspectives from two decades of ocean observations MATTHEW CHURCH UNIVERSITY OF HAWAII OCB SCOPING WORKSHOP SEPTEMBER 2010 A Dedicated HOT Team NSF What
Future climate scenarios for phosphorus and nitrogen dynamics in the Gulf of Riga
 Future climate scenarios for phosphorus and nitrogen dynamics in the Gulf of Riga Bärbel Müller Karulis, Latvian Institute of Aquatic Ecology Juris Aigars, Latvian Institute of Aquatic Ecology In colaboration
Climate Change Impacts for the Central Coast and Hunter Regions
 Climate Change Impacts for the Central Coast and Hunter Regions http://www.ozcoasts.gov.au/climate/ima ges/f1_risks.jpg Peter Smith 1 Climate change will have increasing impacts on a wide range of natural
Calibration, correction and flagging from the chlorophyll fluorometer on GoMOOS Buoy A01: November 2005-June 2014
 Calibration, correction and flagging from the chlorophyll fluorometer on GoMOOS Buoy A01: November 2005-June 2014 Massachusetts Water Resources Authority Environmental Quality Department Report 2014-14
Appendix I: Fixed-400,000 af Flood Storage Operation
 Appendix I: Fixed-400,000 af Flood Storage Operation 1.0 FIXED-400,000 AF FLOOD STORAGE OPERATION This operation set provides a comparison of operations before the SAFCA/Reclamation interim agreement in
Watershed and Water Quality Modeling to Support TMDL Determinations Lake Oologah
 Watershed and Water Quality Modeling to Support TMDL Determinations Lake Oologah 26 th Annual Conference Oklahoma Clean Lakes and Watersheds Association (OCLWA) April 5-6, 2017 Stillwater, Oklahoma Lake
Summary. Maritimes Region Ecosystem Status Report 2004/003
 Ecosystem Status Report 2004/003 2002 State of the Ocean: Chemical and Biological Oceanographic Conditions in the Gulf of Maine - Bay of Fundy, Scotian Shelf and the Southern Gulf of St. Lawrence Background
Big Bend Model. Wayne Magley Watershed Evaluation and TMDL Section FDEP. March 7, 2016
 Big Bend Model Wayne Magley Watershed Evaluation and TMDL Section FDEP March 7, 2016 BACKGROUND As outlined in the EPA November 30, 2012 document Methods and Approaches for Deriving Numeric Criteria for
Distribution and Cycling of Dissolved Organic Carbon and Colored Dissolved Organic Carbon on the West Florida Shelf
 Distribution and Cycling of Dissolved Organic Carbon and Colored Dissolved Organic Carbon on the West Florida Shelf Dr. Paula Coble College of Marine Science University of South Florida 10 7 th Ave South
Long Pond Post-Treatment Summary Report through 2013
 Long Pond Post-Treatment Summary Report through 13 March 1 Prepared by Water Resource Services TABLE OF CONTENTS Introduction... 1 Water Clarity... 3 Phytoplankton... Oxygen... Phosphorus... 1 Conclusions
Colorado River Environmental Models
 Colorado River Environmental Models Presented to Mid-Central Water Quality Advisory Committee by Dean Thomas, P.E. LCRA Water Quality Protection January 20, 2015 Presentation Overview What is CREMS? A
monitor, understand and predict? PICES-2017 Annual Meeting, Vladivostok, Russia Sept. 22 Oct. 1, 2017 Vazhova Anna S.
 S4 Adverse impacts on coastal ocean ecosystems: How do we best measure, monitor, understand and predict? PICES-217 Annual Meeting, Vladivostok, Russia Sept. 22 Oct. 1, 217 SEASONAL DYNAMICS OF NUTRIENTS
Two different Hypoxic Cases: Kangjin Bay, South Sea Chunsu Bay, Yellow Sea, Korea
 Yeosu,Korea May.15-18, 18, 2012 Two different Hypoxic Cases: Kangjin Bay, South Sea Chunsu Bay, Yellow Sea, Korea May 17, 2012 (S7) Young Jae Ro 1, Baek Jin Kim Baek Jin Kim 1 Kwang Young Jung 1 and Kwang