Investor Presentation Full Year Results
|
|
|
- Vernon Hamilton
- 6 years ago
- Views:
Transcription


1 Investor Presentation 2017 Full Year Results February 19, 2018
2 Disclaimer This document contains information resulting from testing, experience and know-how of GTT, which are protected under the legal regime of undisclosed information and trade secret (notably TRIPS Art. 39) and under Copyright law. This document is strictly confidential and the exclusive property of GTT. It cannot be copied, used, modified, adapted, disseminated, published or communicated, in whole or in part, by any means, for any purpose, without express prior written authorization of GTT. Any violation of this clause may give rise to civil or criminal liability - GTT
3 Disclaimer This presentation does not contain or constitute an offer of securities for sale or an invitation or inducement to invest in securities in France, the United States or any other jurisdiction. It includes only summary information and does not purport to be comprehensive. No representation, warranty or undertaking, express or implied, is made as to, and no reliance should be placed on, the accuracy, completeness or correctness of the information or opinions contained in this presentation. None of GTT or any of its affiliates, directors, officers and employees shall bear any liability (in negligence or otherwise) for any loss arising from any use of this presentation or its contents. The market data and certain industry forecasts included in this presentation were obtained from internal surveys, estimates, reports and studies, where appropriate, as well as external market research, including Poten & Partners, Wood Mackenzie and Clarkson Research Services Limited, publicly available information and industry publications. GTT, its affiliates, shareholders, directors, officers, advisors and employees have not independently verified the accuracy of any such market data and industry forecasts and make no representations or warranties in relation thereto. Such data and forecasts are included herein for information purposes only. Where referenced, as regards the information and data contained in this presentation provided by Clarksons Research and taken from Clarksons Research s database and other sources, Clarksons Research has advised that: (i) some information in the databases is derived from estimates or subjective judgments; (ii) the information in the databases of other maritime data collection agencies may differ from the information in Clarksons Research database; (iii) while Clarksons Research has taken reasonable care in the compilation of the statistical and graphical information and believes it to be accurate and correct, data compilation is subject to limited audit and validation procedures. Any forward-looking statements contained herein are based on current GTT s expectations, beliefs, objectives, assumptions and projections regarding present and future business strategies and the distribution environment in which GTT operates, and any other matters that are not historical fact. Forward-looking statements are not guarantees of future performances and are subject to various risks, uncertainties and other factors, many of which are difficult to predict and generally beyond the control of GTT and its shareholders. Actual results, performance or achievements, or industry results or other events, could materially differ from those expressed in, or implied or projected by, these forwardlooking statements. For a detailed description of these risks and uncertainties, please refer to the section Risk Factors of the Document de Référence ( Registration Document ) registered by GTT with the Autorité des Marchés Financiers ( AMF ) under No. R on April 27, 2017 and the half-yearly financial report released on July 20, 2017, which are available on the AMF s website at and on GTT s website at The forward-looking statements contained in this presentation are made as at the date of this presentation, unless another time is specified in relation to them. GTT disclaims any intent or obligation to update any forward-looking statements contained in this presentation. 3
4 Agenda 1. Company overview 2. Market update 3. Business activity 4. Financials 5. Outlook Appendices 4
5 1 Company overview 5

6 GTT, a French engineering company, global leader in liquefied gas containment systems Consolidated key figures Profile Leading engineering company Expert in liquefied gas containment systems More than 50-year track record Activities Designs and licenses membrane technologies for containment of liquefied gas Core business: LNG transportation and storage New business: LNG as a fuel for vessel propulsion Provides design studies, construction assistance and innovative services in million Total Revenues Royalties (newbuild) Services Net Income As at December employees (1) (1) Excluding interns 6
7 Key Highlights Core business: orders upturn in 2017: 21 new orders vs 5 in 2016 / already 4 since beg Order book: 89 units 71 LNGC/VLEC (1) 2 FLNG 13 FSRU/RV (1) 2 Onshore storage 1 Barge CORE BUSINESS 2017 movements in the order book New orders: 21 (12 LNGC, 8 FSRU, 1 FLNG) Deliveries: 28 (24 LNGC/VLEC, 3 FSRU, 1 FLNG) Emergence of LNG fuel: CMA CGM 1st ever LNG Fuel order for GTT (Q4) NEW BUSINESS (LNG FUEL) Order book: 9 Ultra Large Container Ships (ULCS) New orders: 9 ULCS Partnerships with Wärtsilä (Finland), DSEC (South Korea) and Cosco Heavy Industries (China) New service offering Global service agreement with Teekay (Q1) and Chevron (Q4) Service contract for Shell Prelude FLNG (Q4) Acquisition of Ascenz (Q4) Closing of the transaction: 31 January 2018 Dividend maintained (2) at 2.66 per share Notes: LNGC Liquefied Natural Gas Carrier, VLEC Very Large Ethane Carrier, FSRU Floating Storage and Regasification Unit, RV Regasification Vessel, FLNG Floating Liquefied Natural Gas,ULCS Ultra Large Container Ships (1) Including a LNGC order conversion into a FSRU order (2) Subject to AGM approval 7
8 2 Market update 8
9 Overall long term outlook bright for gas and LNG Gas share in the energy mix LNG share in total gas trade 40% 30% 20% Oil Gas Coal 10% 0% Bioenergy Nuclear Renewables Hydro Gas is the only fossil energy to increase share in the energy mix Gas is expected to exceed coal by 2035 Drivers: environmental properties, price and availability Gas is increasingly exported thanks to LNG LNG to overpass pipeline trade by 2035 Driver: greater flexibility Source: AIE (World energy outlook, GTT Source: BP base case 2017 &
10 mtpa LNG Supply & Demand could balance from early LNG Supply & Demand balance forecast Demand adjustment due to low prices and FSRUs availability S&D balance in early 2021 Intermediate scenario No demand adjustment S&D balance in Supply - Operationnal Supply - Under Construction Demand Sources: Wood Mackenzie ; GTT Analysis Thanks to a vigorous demand, the expected oversupply by 2021 has reduced vs. previous forecasts New FIDs are expected in
11 mtpa Asian LNG imports growing in 2017 vs due to structural energy mix evolution 200 Top-5 LNG importers demand comparison 2017 vs % 50% Demand of top-5 LNG importing countries (2/3 of imports) grew by 11% in 2017 vs. 2016, mainly due to: % 30% 20% Coal to Gas switch, especially in China due to environmental considerations and LNG competitiveness vs. coal Lower nuclear restart, especially in Japan due to social and legal issues % 5% 12% 11% 10% China has over taken South Korea as #2 LNG importer 0 <1% Japan S. Korea China India Taiwan TOTAL Growth YoY (rhs) 0% Coal progressive slowdown in China and South Korea expected to strengthen in the mid/long term Main sources : National Custody Agencies and Ministries ; Wood Mackenzie 11
12 Mtpa New importing countries contribute to demand growth 25 Incremental LNG demand from new markets Colombia, Malta, Jamaica + 17,9 Mtpa Israel Lithuania Poland Malaysia Singapore +20,7 Mtpa Colombia Malta Israel Jamaica Lithuania Poland Malaysia Singapore Malta ,6 Mtpa Israel Malaysia Singapore + 3,7 Mtpa Malaysia Singapore ~7% of worldwide demand Israel Lithuania + 9,5 Mtpa Israel Poland Malaysia Lithuania Singapore Jordan Pakistan Egypt 40% of the additional demand since 2012 Jordan Pakistan Egypt Jordan Pakistan Egypt forecasted Source : Wood Mackenzie 12
13 LNG price - $/Mbtu US LNG Spread US LNG is competitive in Asia US LNG vs. Asian LNG price depending on Henry Hub and Oil prices 10,0 9,5 Asian LNG < US LNG Asian LNG 9,0 Asian oil indexed LNG competitive 8,5 8,0 7,5 US LNG competitive HH : $4/Mmbtu HH : $3,5/Mmbtu 7, avg avg. HH : $3/Mmbtu 6,5 HH : $2,5/Mmbtu 6,0 HH : $2/Mmbtu 5, Main sources: GTT analysis, EIA, Wood Mackenzie Oil price - $/b 2017 avg : JCC = $53/bl and Henry Hub = $3,0/Mmbtu US LNG $7.1/Mmbtu Asian LNG $8.0/Mmbtu US LNG: Hypothesis HH+15% Tolling Fee: 2.25$ Shipping: 1.43$ (US East ->Japan, 174k cbm Me-GI or X-DF) Asian LNG: Slope: 14% of JCC price Constant: 0.5$ 13

14 LNG Shipping: spot market recovering trend Spot chart rates evolution since 2011 Up to $82k/d in end Dec.2017 Estimated breakeven Recovering trend since 2016 Currently reaching levels not observed for 4 years; above breakeven 14
15 LNG Shipping : c.40 LNGC orders expected from under construction projects LNGC requirements for under construction liquefaction projects Project Location Forecasted Start-Up Contracted Capacity (mtpa) Cameroon GoFLNG Cameroon Q2-18 1,2 Wheatstone LNG T2 Australia Q2-18 4,0 Ichthys Australia Q2-18 8,5 Prelude FLNG Australia Q3-18 3,6 Yamal LNG T2 Russia Q4-18 4,9 Elba Island LNG Export USA Q4-18 2,5 Freeport T1 USA Q1-19 4,6 Corpus Christi LNG T1 USA Q1-19 4,5 Cameron LNG Export T1 USA Q2-19 4,0 Cameron LNG Export T2 USA Q3-19 4,0 Sabine Pass Export Train 5 USA Q2-19 4,5 Freeport T2 USA Q3-19 4,4 Corpus Christi LNG T2 USA Q2-19 4,5 Yamal LNG T3 Russia Q3-19 4,9 Freeport T3 USA Q1-20 4,4 Sengkang LNG Indonesia Q1-20 0,5 Cameron LNG Export T3 USA Q1-20 4,0 PETRONAS FLNG 2 Malaysia Q Tangguh Phase 2 Indonesia Q1-21 3,8 Coral LNG Mozambique Q1-22 3,4 Project ahead of schedule or catching-up Project in time Project behind schedule or slowing-down Projects associated with LNGCs orders TOTAL - Current Orderbook* - Overcapacity** Expected orders LNGCs requirement 132,4 86,3 9,5 36,7 12 LNGCs ordered in 2017 confirming market needs Still, c.40 LNGCs to secure to lift additional volumes Vessels to be ordered mainly by (2-3 years construction time) Downside risks: Start-up delays and/or slow ramp-up Additional LNG contracts swapping (shorter routes) Spot vessels utilization as a bridging solution Wide majority of 2016 and 2017 LNGC orders were dedicated to projects under construction, with some speculative orders reflecting a short/mid term market confidence * Vessels on order for currently operational projects not counted ** Recent / Competitive vessels: 160k cbm, D/TFDE, <30 y.o. Note : All LNGCs numbers normalized to 174k cbm gross capacity (164.4k cbm net) Main sources : GTT analysis, Wood Mackenzie, Clarksons 15
16 Many liquefaction projects ready to be sanctioned soon in order to accompany demand growth Several major liquefaction projects in planning phase with a potential FID in 2018 Project Milestones Name Operator Country Capacity (Mtpa) Feedgas Availability Concept/ Environmental Regulatory Participation Marketing Financing Engineering Fortuna FLNG Ophir Eq. Guinea 2.2 Corpus Christi T3 Cheniere USA 4.5 Sabine Pass T6 Cheniere USA 4.5 Golden Pass Golden Pass Prod. USA 15.6 Magnolia LNG LNG Ltd USA 8.0 Cameron Expansion Cameron LNG USA 10.0 Woodfibre LNG Pacific O&G Canada West 2.1 Milestone reached or about to be reached Progress is being made but details are not finalised Fortuna FLNG and Corpus Christi T3 are the most likely to be sanctioned in 2018 Note: FID Final Investment Decision / Main source: Wood Mackenzie 16
17 3 Business activity 17
18 3.1 Core business 18

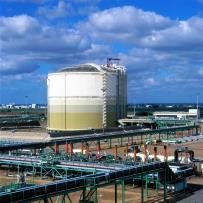
19 Core business GTT 2017 Sales GTT order estimates over FSRU 10% Services FLNG 6% 1% LNGC: units 12 orders in 2017 FSRU: between 30 and 40 units 8 orders in 2017 LNGC/VLEC 83% FLNG: between 5 and 10 units 1 order in 2017 Onshore tanks: between 5 and 10 units Courtesy of Shell Courtesy of Excelerate Energy 19
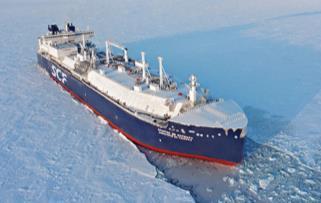
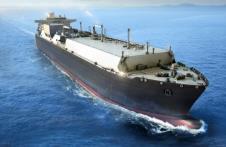
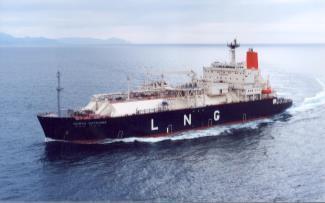
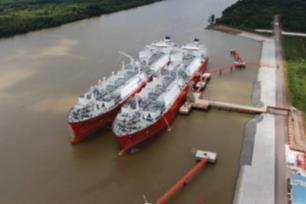
20 LNGCs Our main business Vessels equipped for transporting LNG Existing GTT fleet: 334 units In order: 71 units 24 construction shipyards under license Our strengths Technological leadership, boil-off divided by 2 in the last 5 years Long term industrial partnerships with major shipyards A unique position in the LNG ecosystem, nurtured by 50 years of experience, expertise and customer orientation 20

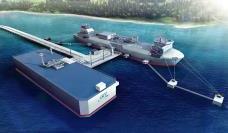
21 FSRUs The game changer for new importing countries Major competitive advantage vs. land-based terminals: Quick to build/deploy & mobile Better local acceptability & easier permitting Affordable / no upfront CapEx Adapted to more volatile LNG prices Quality controlled construction in shipyards with available and skilled workforce Courtesy of Excelerate Energy More than 30 FSRUs currently in service or under construction FSRUs market outlook In order: 13 (incl.8 orders of since January 2017) Worldwide development Asia (India, China, ) Europe (Turkey, Croatia, ) South & West Africa LatAm & Carribeans Source: GasLog 21
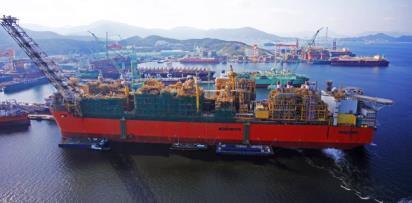
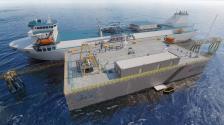
22 FLNGs the new frontier of the LNG world Floating units which ensure treatment of gas, liquefy and store it Existing GTT fleet: 2 units In order: 2 units Courtesy of Shell Main drivers Monetisation of stranded offshore gas reserves Better acceptability (no NIMBY syndrom) GTT key advantages Extended amortization perspectives Deck space available for liquefaction equipment More affordable cost 22
23 3.2 New businesses: LNG Fuel 23


 Positive")

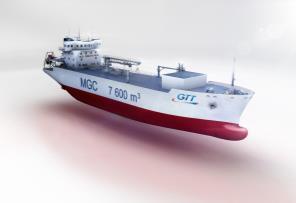
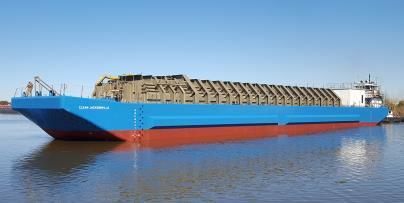
24 LNG Fuel focus CMA CGM order 9 Ultra Large Container Ships with LNG integrated membrane tanks of 18,600 cbm each Space optimization Designed for one bunkering operation per round trip Mark III Flex technology for the fuel storage system Sea proven technology Guaranteed Boil Off Gas Flexibility to handle and store Boil Off Gas (maximal pressure of 700 mbarg) Positive impact on global LNG demand LNG Consumption of 300,000 tons per year for the 9 vessels, i.e. eq. 0.1% of LNG global production 24
25 LNG is the only solution allowing comprehensive environmental compliance Pollutant Level HFO (Heavy Fuel Oil) LS HFO (Low Sulfur HFO) ULS HFO (Ultra Low Sulfur HFO) MGO / MDO 1 (Marine Gasoil/Diesel Oil) Scrubber +HFO LNG 3,5% SOx (Sulfur Oxides) 0,5% 0,1% NOx 2 (Nitrogen Oxides) Tier II Tier III +EGR/SCR 3 Except for certain engines 1) Only DMA and DMB class 2) Depends primarily on engine technology 3) EGR: Exhaust Gas Recirculation ; SCR: Selective Catalytic Reduction Compliance Yes Under condition No LNG is the only mature solution directly compliant with all environmental regulations Implementation of NOx reduction in Northern Europe will degrade oil fuel s and Scrubber s competitiveness 25
26 cbm CMA-CGM Current LNG Fuel market situation Total LNG fuel tank by ship type (in service & on order) Total LNG tanks capacity Max Avg Min Market avg ~750 cbm Notes: Data available for ~70% of the 237 vessels CMA-CGM order not counted in Source: DNV GL A recent market which has started with small ships and where Type C technology has been preferred (tugs, ferries, PSV, with LNG tanks up to several hundreds of m 3 ) Large vessel segment, where GTT technologies are the most relevant, is just emerging (container ships, bulkers, with several thousands of m 3 and more) 26
27 LNG fuel tanks capacity - cbm LNG Fuel market potential: to be driven by newbuilds Shipping markets newbuild potential Container ships (ULCS) 3,000+ avg. annual orders ( ) Fleet of vessels in Oil Tankers (VLCC) Bulkers (VLOC) PCTC Cruise ships LPG Carriers Dredgers Ferries Chemical Tankers General Cargo Tugs - Plateform Supply Vessels Est. maximum LNG fuel tanks capacity cbm Historical average annual orders ( ) Capacity range Source: GTT analysis, Clarksons 27
28 LNG Fuel market potential for GTT Shipping Markets Relevant Market Segments for GTT Historical avg. annual orders ( ) Fleet at end 2017 Tier 1 Container Ships Bulkers Large to Ultra Large ~320 ~4,700 Oil Tankers Cruise Ships > 2,000 passengers ~13 ~400 Car & Truck Carriers > 6,000 CEU ~23 ~400 Tier 2 Container Ships Bulkers Medium to Large ~815 ~13,500 OilTankers Source: GTT analysis, Clarksons Global addressable market represents a pool of ~1,170 ships per year (newbuilds) GTT is particularly focusing on Tier 1 which represents an addressable segment of ~ 360 ships per year LNG as Fuel penetration will mainly depend on spread between LSHFO and LNG price 28


29 GTT s LNG Fuel solutions offering GTT has developed solutions for the main applications of LNG Fuel Solutions for Container Vessels new build and retrofit Cruise Ship optimizing the space for additional passengers Cost effective solution for bulk carriers Lean bunker barge to standardize the market A wide network of partnerships is being set up to benefit from these various opportunities 29
30 3.3 Service activity 30


31 Expand innovative services offer: customised services package fitting industry expectations Excelerate Energy DESIGN CONSTRUCTION OPERATIONS MAINTENANCE UPGRADE Feasibility studies FEED Materials certification On-site technical assistance Gas trials Training courses and customised training simulator Smart on-board services Inspections, maintenance and repair assistance Smart membrane test solutions Engineering support for retrofit, conversion, life extension projects Emergency hotline On-board technical assistance 31
32 Ascenz transaction Acquisition of 75% of the share capital from founders and several investment funds Founders to retain 25% of the share capital and continue to manage the company Funded in cash Transaction closed on 31 January 2018 No significant impact on GTT s financial structure Commercial and technical synergies 32
, container ships, oil and crude carriers, bulk carriers, bunker ships and gas carriers (target) 360+ ships equiped Recipient of the 2016 Singapore")
33 Ascenz is a dynamic EMS 1 provider Activities, markets & awards Based in Singapore, founded in 2008 Provides remote fuel consumption and bunkering monitoring solutions Positioned on fast growing markets Markets : Offshore Supply Vessels (OSV), container ships, oil and crude carriers, bulk carriers, bunker ships and gas carriers (target) 360+ ships equiped Recipient of the 2016 Singapore «Enterprise 50 award» for local companies excelling in their domain, Founders nominated as Singapore s EY Entrepreneurs of the year 2017 Track record in real time data acquisition for a fleet of vessels (1) Energy Management System 33

 Courtesy of Shell")
34 GTT s strategic roadmap Gas handling technologies Fuel Gas handling system for vessels Superior LNG gas handling systems Growth, Technology, Transformation Advanced decision support systems Framework service and maintenance contract (Shell Prelude) Courtesy of Shell Smart shipping 34
35 4 Financials 35
36 Order book overview (core business) IAS 18 Order book in units Order book by year of delivery (units per year) In units In units As at Dec 31, 2016 As at Dec 31, (1) As at Dec 31, 2016 As at Dec 31, Order book in value Revenues expected from current order book (royalties 2 ) In M In M As at Dec 31, 2016, on As at Dec 31, 2017, on As at Dec 31, 2016 As at Dec 31, 2017 (1) Delivery dates could move according to the shipyards/epcs building timetables. (2) Royalties from core business, i.e. excluding LNG as Fuel, services activity. 36
37 Order book overview (core business) IFRS 15 Order book in units Order book by year of delivery (units per year) In units In units As at Dec 31, 2016 As at Dec 31, (1) As at Dec 31, 2016 As at Dec 31, Order book in value Revenues expected from current order book (royalties 2 ) In M In M As at Dec 31, 2016, on As at Dec 31, 2017, on As at Dec 31, 2016 As at Dec 31, 2017 (1) Delivery dates could move according to the shipyards/epcs building timetables. (2) Royalties from core business, i.e. excluding LNG as Fuel, services activity. 37
38 Consolidated accounts Consolidated accounts prepared for the first time in comparatives restated to show consolidated figures Consolidation perimeter excluding ASCENZ (closing signed on 31 January 2018) % of interest Consolidation method Name Activity Country 31-Dec Dec Dec Dec-16 Cryovision Maintenance services France 100,0 100,0 FC FC Cryometrics On board services France 100,0 100,0 FC FC GTT Training Training services United Kingdom 100,0 100,0 FC FC GTT North America Sales office United States of America 100,0 100,0 FC FC GTT SEA Sales office Singapore 100,0 100,0 FC FC 38
39 2017 financial performance In M Summary consolidated accounts Proforma Change Total Revenues ,3% EBITDA (1) % Margin (%) 61.8% 61.4% Operating Income % Margin (%) 60.0% 59.7% Net income % Margin (%) 50.6% 50.2% Free Cash Flow (2) % Change in Working Capital (3) Capex % Dividend paid % in M Proforma 31/12/ /12/2017 Cash Position ,7% Working Capital Requirement (4) Key highlights Limited decrease in revenues (-2.3% in FY 2017 vs -4.7% in H1) Revenues derived from royalties: -3.9%, still reflecting the difficult market environment in 2016 which resulted in a low level of new orders +36% increase in Service revenue, mainly thanks to good performance of maintenance services Lean cost management Reported net margin > 50% One-off items: CIR claims & 2013: M Provision for tax adjustment: M Excluding the impact of the tax provision, increase in net margin ratio from 50.6% to 56.8% (+6pts) Low Capex Change in working capital ( M) mainly due to cut-off effect (account receivable paid in January) Cash position up to 100 M despite strong pay-out (>80%) * 2017 Accounts restated from the impact of provision for tax adjustment (1) Defined as EBIT + the depreciation charge on assets under IFRS (2) Defined as EBITDA - capex - change in working capital (3) Defined as December 31, 2017 working capital December 31, 2016 working capital (4) Defined as trade and other receivables + other current assets trade and other payables other current liabilities 39
40 Cost base GTT consolidated operational costs in M Change (%) Cost of sales (2.0) (1.8) -10% % sales -1% -1% Subcontracted Test and Studies Rental and Insurance (18.0) (12.6) -30% (5.6) (5.8) 4% Travel Expenditures (9.4) (8.6) -9% Other External Costs Total External Costs (11.3) (9.9) -13% (44.3) (36.8) -17% % sales -19% -16% Key highlights External costs: M (-17%) Subcontractors: M Travel costs M Other external costs M Staff costs down 5% due to a decrease in staff count GTT 2017 costs (1) by nature Salaries and Social Charges (36.3) (34.3) -6% Share-based payments (0,9) (0,8) -6% Profit Sharing (6,0) (6,1) 1% Total Staff Costs (43.2) (41.2) -5% % sales -18% -18% External costs 46% Cost of sales 2% Staff costs 52% Other (1) nm % sales 1% 2% (1) Excluding depreciations, amortisations, provisions and impairment of assets 40
41 Dividend Net income available for distribution (French GAAP) M M Total dividend Dividend per share Total amount paid M M ,0 Dividend amount 84% 86% Payout ratio (1) 90% , % , % , Interim Final Payout 0% (1) Dividend payout ratio calculated on profit distributed (and possible distribution of reserves) as % of French GAAP net profit for the financial year. 41
42 5 Outlook 42
43 2018 Outlook GTT revenue (1) 2018 consolidated revenue estimated in a range of 235 M to 250 M EBITDA 2018 consolidated EBITDA estimated in a range of 145 M to 155 M Dividend 2018 dividend amount at least equivalent to Payment (2) 2019 payout of at least 80% (1) In the absence of any significant delays or cancellations in orders. Variations in order intake between periods could lead to fluctuations in revenues (2) Subject to approval of Shareholders' meeting. GTT by-laws provide that dividends may be paid in cash or in shares based on each shareholder s preference 43


44 A wide range of applications integrating GTT technologies Thank you for your attention Image courtesy of STX, Engie, Excelerate, SCF Group, Shell, CMA CGM, Matthieu Pesquet, Conrad 44
45 Appendix 45
46 A proactive sustainable development policy Environmental responsibility Stakeholders GTT Core business Performance of GTT systems Safety of installations and crew New business Development of LNG Fuel Services LNG training sessions for customers and partners Hotline for shipowners Environmental responsibility at site Social responsibility CSR responsibilities form an integral part of GTT project Employment Compensation Training Health and Safety Societal responsibility Continuous and constructive dialogue with all the LNG stakeholders 46
47 GTT SA organisation GTT Group Appendix: a streamlined group and organisation GTT North America Cryovision GTT Training GTT SEA PTE Ltd Cryometrics Philippe Berterottière* Chairman and Chief Executive Officer Lélia Ghilini* General Counsel Frédérique Coeuille* Innovation ~93 employees Julien Bec LNG as fuel ~16 employees David Colson* Commercial ~24 employees Karim Chapot* Technical ~172 employees Marc Haestier* Finance & Administration ~30 employees Isabelle Delattre* Human Resources ~10 employees * Member of the executive committee 47
 Liquefied Natural Gas Carrier (LNGC) Floating Storage and Regasification Unit (FSRU) LNG fuelled ship Gas-to-wire Ethane/")
48 Appendix: GTT exposure to the liquefied gas shipping and storage value chain Exploration & Production Liquefaction Shipping Regasification Off Take / Consumption Offshore clients: shipyards Platform / Installation Floating LNG Production, Storage and Offloading unit (FLNG) Liquefied Natural Gas Carrier (LNGC) Floating Storage and Regasification Unit (FSRU) LNG fuelled ship Gas-to-wire Ethane/ multigas Carriers Barge Onshore clients: EPC contractors Onshore storage liquefaction plant Onshore storage regasification terminal Tank in industrial plant Power plant Source: Company data 48

49 Appendix: GTT ecosystem Oil & Gas Companies End clients and prescribers Shipowners End clients and prescribers provides services provides services and maintenance Classification Societies Regulatory oversight of the industry receives new technology certification and approval Shipyards Direct clients licences its membrane technology and receives royalties provides engineering studies, on-site technical and maintenance assistance 49
50 mtpa Important new LNG volumes to hit the market in 2019 and Contracted supply from liquefaction projects under construction +12 mtpa +31 mtpa +25 mtpa Main sources: GTT analysis, Wood Mackenzie ~ +70 Mtpa of contracted supply to come on stream by 2020 Cameroon GoFLNG PETRONAS FLNG 2 Elba Island LNG Export Coral FLNG Prelude FLNG Tangguh Phase 2 Freeport Train 3 Freeport Train 2 Sabine Pass Export Train 5 Cove Point Export Freeport Train 1 Ichthys Corpus Christi LNG Cameron LNG Export Yamal LNG New ship orders to be placed from early 2018 to be delivered in late 2019 / early


51 GTT membrane technologies General principle: Two membranes Two layers of insulations Containment system anchored to the inner hull Primary insulation Secondary insulation Primary membrane Secondary membrane Hull Mark III system NO96 system 51
52 Focus on GTT s competitive advantages GTT s technology positioning (1) GTT Moss SPB KC-1 Technology Membrane Spherical tank Tank Membrane Construction costs Requires less steel and aluminum than tanks for a given LNG capacity Higher costs Higher costs Slightly higher costs than GTT Operating costs More efficient use of space Limited BOR (0.07%) Higher fuel / fee costs Higher fuel / fee costs Higher opex due to BOR (0.16%) LNGCs in construction LNGCs in operation small None Other Value added services Higher centre of gravity; harder to navigate Japanese technology developed 25 years ago. No significant experience Korean technology with no experience at sea GTT technologies : cost effective, volume optimisation and high return of experience Source: Company data and comment (Dec. 31, 2017), Clarksons (1) Other technologies are being developed, however are not known to have obtained final certification or orders to date (e.g. DSME s Solidus). Excludes vessel orders below 30,000 m 3 52

53 An attractive business model supporting high cash generation Invoicing and revenue recognition Business model supports high cash generation % of contract (1) c. 18 months studies c. 18 months royalties Delivery Revenue is recognized pro-rata temporis between milestones Ship launching Timing of invoicing and cash collection according to 5 milestones Cash Revenue Keel laying Steel cutting Months from receipt of order Negative Working Capital Position Positive Working Capital Position Initial payment collected from shipyards at the effective date of order of a particular vessel (10%) Steel cutting (20%) Keel laying (20%) Ship launching (20%) Delivery (30%) Source: Company (1) Illustrative cycle for the first LNGC ordered by a particular customer, including engineering studies completed by GTT 53
54 Appendix: track record of high margin and strong increase in backlog since Economic crisis US shale gas boom 2011 Fukushima Evolution of new GTT orders (1)(2) LNGC/VLEC FSRU/FLNG Onshore storage Barge Backlog (# of orders) 65% 64% 57% 42% 44% 55% 51% 52% 51% Evolution of revenue (in M) and net margin (4) % 75 33% Revenue Net Margin Source: Company (1) Orders received by period (2) Excl. vessel conversions (3) Represents order position as at December based on company data, including LNGC, VLEC, FLNG, FSRU and on-shore storage units (4) Figures presented in IFRS from 2010 to 2015, French GAAP from 2006 to
55 Contact: /
Investor Presentation
 Investor Presentation First nine months 2017 activity update October 18, 2017 Disclaimer This document is strictly confidential. Any unauthorised access to, appropriation of, copying, modification, use
Investor Presentation. January 11-12, 2018
 Investor Presentation January 11-12, 2018 Disclaimer This document is strictly confidential. Any unauthorised access to, appropriation of, copying, modification, use or disclosure thereof, in whole or
Investor Presentation
 Investor Presentation 2016 Full Year Results February 2017 Disclaimer This document is strictly confidential. Any unauthorised access to, appropriation of, copying, modification, use or disclosure thereof,
TEEKAY LNG PARTNERS Q EARNINGS AND BUSINESS OUTLOOK PRESENTATION February 18, 2016
 TEEKAY LNG PARTNERS Q4-2015 EARNINGS AND BUSINESS OUTLOOK PRESENTATION February 18, 2016 Forward Looking Statement This presentation contains forward-looking statements (as defined in Section 21E of the
Q /05/17. Jon Skule Storheill. Snorre Krogstad
 Q1 2017 Jon Skule Storheill Snorre Krogstad 05/05/17 www.awilcolng.no - 1 - Disclaimer This presentation may include certain forward-looking statements, forecasts, estimates, predictions, influences and
Natural Gas: Challenges for the Industry, the LNG Chain, and Implications for Market Structure
 27 September 216 Algiers Natural Gas: Challenges for the Industry, the LNG Chain, and Implications for Market Structure Plenary Session 2 Introduction Market context Session objectives Low gas prices across
CHENIERE ENERGY, INC. Louisiana Energy Conference. June 2016
 CHENIERE ENERGY, INC. Louisiana Energy Conference June 2016 Forward Looking Statements This presentation contains certain statements that are, or may be deemed to be, forward-looking statements within
ROYAL DUTCH SHELL PLC LEADER IN GLOBAL GAS
 ROYAL DUTCH SHELL PLC LEADER IN GLOBAL GAS DEFINITIONS AND CAUTIONARY NOTE Resources: Our use of the term resources in this announcement includes quantities of oil and gas not yet classified as Securities
LNG market transformation
 LNG market transformation How the next 5 years will change the rules December 2017 www.timera-energy.com 1 Contents Section Contents Summary 5 key takeaways 3 Asian portfolio positions Top 5 Asian buyer
Immediate & Future LNG Opportunities in the Midstream; Reviewing Innovative
 17 th INTERNATIONAL CONFERENCE & EXHIBITION ON LIQUEFIED NATURAL GAS (LNG 17) 17 th INTERNATIONAL CONFERENCE & EXHIBITION ON LIQUEFIED NATURAL GAS (LNG 17) Immediate & Future LNG Opportunities in the Midstream;
LNG market update. Surge in LNG supply creates opportunities to open new markets
 LNG market update Surge in LNG supply creates opportunities to open new markets Royal Vopak Analyst Day 2017 Ton Floors, Global LNG Director 12 December 2017 Forward-looking statement This presentation
Small Scale LNG From Concept to Reality. Chris Johnson, General Manager, LNG New Markets, Shell
 Small Scale LNG From Concept to Reality Chris Johnson, General Manager, LNG New Markets, Shell 0 Table of Contents Table of Contents... 1 Background... 1 Aims... 4 Methods... 5 Results... 11 Conclusions...
RYSTAD ENERGY GAS PERSPECTIVES. Jakarta, November 20 th 2017
 RYSTAD ENERGY GAS PERSPECTIVES Jakarta, November 2 th 217 Agenda 1. Global LNG market outlook Oversupply and new Asian demand 2. Japan LNG Market outlook LNG demand in a nuclear restart 2 Longer distances
Status of first generation of FLNG and trend and perspective for the next generation
 Status of first generation of FLNG and trend and perspective for the next generation TITRE DE LA PRESENTATION Dominique Gadelle SOUS TITRE Technip DE LA Vice President PRESENTATION Upstream / LNG Atelier
GAZOCEAN Pioneer in Maritime Transportation of Liquefied gas
 GAZOCEAN Pioneer in Maritime Transportation of Liquefied gas AFG méditerranée GAZOCEAN 23 Mai 2014 Introduction to GAZOCEAN January 2014 This presentation is not to be reproduced without the permission
LNG Import Facility Infrastructure Options
 LNG Import Facility Infrastructure Options Mangesh Patankar (Head of Business Development Galway Group) 28 th April 2016 www.galwaygroup.com Agenda Introduction to Galway Group Types of Regas terminals
The impact of US LNG on European gas prices
 January 2018 The impact of US LNG on European gas prices Increasing US exports of LNG will change how gas prices are determined in Europe Import dependency for the European Union, pushed higher as a result
GasLog Ltd. Q Results
 GasLog Ltd. Q4 2017 Results 16 February 2018 Forward looking statements 2 All statements in this presentation that are not statements of historical fact are forward-looking statements within the meaning
For personal use only
 Mermaid Marine Supply Base Mermaid Logistics Supply Base UBS Emerging Companies Conference 3 April 2012 Disclaimer This document contains general background information about the activities of Mermaid
Investor Presentation
 Investor Presentation September 2016 Keppel Corporation Meeting the needs of sustainable urbanisation Offshore & Marine Property Infrastructure Investments Offshore rig design, construction, repair and
LNG as a marine fuel in BC. West Coast Marine LNG Workshop 26 th June 2012
 LNG as a marine fuel in BC West Coast Marine LNG Workshop 26 th June 2012 LNG as a Marine Fuel» Marpol Annex VI - Emissions Legislation ECA s commence in 2015 Global sulphur cap in 2020 / 2025 Potential
The Shale Invasion: Will U.S. LNG Cross the Pond? New terminals ramp up exports.
 ? The Shale Invasion: Will U.S. LNG Cross the Pond? New terminals ramp up exports. Morningstar Commodities Research 6 December 2016 Sandy Fielden Director, Oil and Products Research +1 512 431-8044 sandy.fielden@morningstar.com
Membrane CCS for LPG Carrier
 Membrane CCS for LPG Carrier INTERTANKO 04/04/2017 Disclaimer This document is strictly confidential. Any unauthorised access to, appropriation of, copying, modification, use or disclosure thereof, in
RISE OF THE FSRU AND THE LNG MARKET OUTLOOK.
 RISE OF THE FSRU AND THE LNG MARKET OUTLOOK RISE OF THE FSRU AND UPCOMING ORDERS By David Boggs David Boggs is the Managing Director and founder of Energy Maritime Associates, which publishes market leading
GRINDROD LIMITED ADDITIONAL INFORMATION FOR ANALYSTS for the year ended 31 December 2016
 www.grindrod.com GRINDROD LIMITED ADDITIONAL INFORMATION FOR ANALYSTS for the year ended 31 December 2016 MANAGEMENT SEGMENTAL BALANCE SHEETS AS AT 31 DECEMBER 2016 R000 FREIGHT SERVICES SHIPPING FINANCIAL
LNG AS A BUNKER FUEL
 LNG AS A BUNKER FUEL WARTSILA IMSF CONFERENCE, OSLO MAY 2012 / 25 Wärtsilä Until now.. / 25 Wärtsilä From now on. Established Emissions Controlled Areas Emissions Controlled Areas under consideration Shipping
LNG and global gas market trends: Challenges and opportunities for the Baltics Karen Sund Baltic Energy Forum Vilnius, 26 November 2013
 LNG and global gas market trends: Challenges and opportunities for the Baltics Karen Sund Baltic Energy Forum Vilnius, 26 November 2013 Sund Energy helps navigate into the energy future Energy Economics
WÄRTSILÄ SHIP POWER JAAKKO ESKOLA SENIOR EVP DEPUTY TO THE CEO PRESIDENT, SHIP POWER
 WÄRTSILÄ SHIP POWER JAAKKO ESKOLA SENIOR EVP DEPUTY TO THE CEO PRESIDENT, SHIP POWER 1 / Doc.ID: Revision: Status: The most complete Marine Offering on earth 2 / Doc.ID: Revision: Status: Market trends
LNG market developments. 12 th of February 2015 Jonathan Raes development EXMAR LNG Infrastructure
 LNG market developments 12 th of February 2015 Jonathan Raes development EXMAR LNG Infrastructure Introduction EXMAR & LNG EXMAR Company Introduction Shipping & Energy Infrastructure Provider 1829 shipbuilding
Fundamental Prospecting - time for another gold rush?
 Fundamental Prospecting - time for another gold rush? Dr Adam Kent - Maritime Strategies International (MSI) 30th Annual Marine Money Money Week New York City June 19 th to 21 st 2017 Agenda Fundamental
The Technical & Practical challenges of FLNG
 SUT Evening Technical Meeting: On the Fringes of FLNG, Perth 19/08/2015 Jeff Baker Energy Compliance Technical Manager, Australasia Working together for a safer world Agenda Introduction Acknowledgement
Why LNG? LNG is mainly produced for transportation purposes. More economical to transport gas as LNG compared to pipelines over long distances
 Classification: Internal Status: Draft LNG Shipping TEP 10 Gas Processing and LNG - 2008 Trygve G. Egge 2 Topics Why LNG? Historic overview Commercial fundamentals Technical aspects Operational aspects
Dry and Liquefied Gas to European Markets
 Dry and Liquefied Gas to European Markets Competing or Complementary? Graham Bennett Outline Introduction Supply/Demand changes affecting the gas market Innovations impacting gas import/export options
Prospects for LNG in the South Baltic Sea Region
 Scientific Journals Maritime University of Szczecin Zeszyty Naukowe Akademia Morska w Szczecinie 2013, 36(108) z. 1 pp. 59 63 2013, 36(108) z. 1 s. 59 63 ISSN 1733-8670 Prospects for LNG in the South Baltic
Results for the year ended 31 March Richard Longdon, Chief Executive James Kidd, Chief Financial Officer
 Results for the year ended 31 March 2012 Richard Longdon, Chief Executive James Kidd, Chief Financial Officer Safe Harbor Statement During (and in this) presentation we make forward-looking statements.
Development of the Domestic LNG Value Chain and Infrastructure in Indonesia
 Development of the Domestic LNG Value Chain and Infrastructure in Indonesia James Brown Regional LNG and Gas Consulting Manager 1 SAFER, SMARTER, GREENER DNVGL Global network through local support 2 Existing
GasLog Partners LP Wells Fargo Conference
 GasLog Partners LP Wells Fargo Conference December 2017 Forward-Looking Statements 2 All statements in this presentation that are not statements of historical fact are forward-looking statements within
LNG Outlook 2018 Growth and resilience
 www.gasstrategies.com LNG Outlook 2018 Growth and resilience www.gasstrategies.com 3 2 LNG Outlook 2018 Growth and resilience For many LNG suppliers, liquefaction capacity holders and LNG traders, 2017
Introduction of Gas Turbine- Powered, LPG Fueled Ship. Byeongyeol Baek Advanced Lead Engineer GE s Marine Solutions March 6 to 7, 2018
 Introduction of Gas Turbine- Powered, LPG Fueled Ship Byeongyeol Baek Advanced Lead Engineer GE s Marine Solutions March 6 to 7, 2018 Presentation Title February 9, 2 GE s Marine Solutions +1,400 Vessel
Company Presentation. 26 April April
 Company Presentation 26 April 2017 April 2017 1 Disclaimer THIS PRESENTATION (THE PRESENTATION ) HAS BEEN PRODUCED BY FLEX LNG LTD. ("FLEX LNG" OR "THE COMPANY ), SOLELY FOR PRESENTATION PURPOSES AND DOES
Bcma Global LNG Liqufaction capacity existing & FID d/under construction
 OXFORD INSTITUTE FOR ENERGY STUDIES Natural Gas Research Programme Asian LNG Market Development to 2025: pricing and contractual challenges Professor Jonathan Stern Chairman and Senior Research Fellow
Marine Transportation of LNG. Intertanko Conference March 29, 2004 Bob Curt Ship Acquisition Manager, QatargasII Development
 Marine Transportation of LNG Intertanko Conference March 29, 2004 Bob Curt Ship Acquisition Manager, QatargasII Development Marine Transportation of LNG Topics What is LNG? History of LNG Marine Transportation
NASSCO Shipbuilding & LNG Propulsion. Kevin Mooney, VP of Programs September 18, 2013
 NASSCO Shipbuilding & LNG Propulsion Kevin Mooney, VP of Programs September 18, 2013 NASSCO Lines of Business Current Government New Construction Future MLP MLP/AFSB T-AO(X) Current Commercial New Construction
An Outlook for the Maritime Industry Towards 2020
 An Outlook for the Maritime Industry Towards 2020 Future Development in Maritime Shipping Kenneth Vareide 2013-02-28 Topics Background and Key Drivers for the Maritime Industry A Outlook Towards 2020 Current
The future of LNG Carriers
 The future of LNG Carriers - Probability of Further Upsizing and Fuel-Efficiency Improvements Takeshi Hashimoto Member of the Board Senior Managing Executive Officer Mitsui O.S.K. Lines, Ltd. 5 th April,
Recommended acquisition of The BSS Group plc. 5 July 2010
 Recommended acquisition of The BSS Group plc 5 July 2010 Important information This document is being made available only to persons who fall within the exemptions contained in Article 19 and Article 49
SENETAS 2017 INTERIM RESULTS. 27 February 2017
 SENETAS 2017 INTERIM RESULTS 27 February 2017 AGENDA 1. HY17 HIGHLIGHTS 2. KEY FINANCIALS 3. OPERATIONAL REVIEW 4. OUTLOOK HY17 HIGHLIGHTS HY17 highlights Operating revenue up 8% Profit before tax down
2 nd Mare Forum Poland 2017 Sopot, Poland, 16 th May 2017 The Polish Excellence, What can the Polish Maritime Industry do for international shipping
 2 nd Mare Forum Poland 2017 Sopot, Poland, 16 th May 2017 The Polish Excellence, What can the Polish Maritime Industry do for international shipping - Meet the Polish Maritime Industry Industry Trends
Floating LNG Business A breakthrough in offshore gas monetization
 Floating LNG Business A breakthrough in offshore gas monetization LNG Malaysia Forum 2013 19-21 March, Kuala Lumpur Allan Magee, Ph.D. R&D Manager, Offshore Product Line and Technologies, Technip Geoproduction
La tutela ambientale sui mari internazionali (Environmental Regulations of the Shipping Industry)
") RUOLO DELLA MARINA MILITARE PER L IMPIEGO DEL GAS NATURALE NELLA PROPULSIONE NAVALE Roma, 21 / 11/ 2013 La tutela ambientale sui mari internazionali (Environmental Regulations of the Shipping Industry)
RUOLO DELLA MARINA MILITARE PER L IMPIEGO DEL GAS NATURALE NELLA PROPULSIONE NAVALE Roma, 21 / 11/ 2013 La tutela ambientale sui mari internazionali (Environmental Regulations of the Shipping Industry)
LNG strategy and the outlook for global gas markets
 LNG strategy and the outlook for global gas markets October 16 th, 2012 Jean-Marie Dauger Executive Vice-president GDF SUEZ The LNG market Strong growth particularly in Asia An LNG market of ~550 Mt in
Opera Software: Third quarter 2012
 Opera Software: Third quarter 2012 3Q 2012 Financial highlights Financial metric 3Q12 (MUSD) 3Q11 (MUSD) Revenue Total revenue 56.4 40.1 Profitability Adj. EBITDA*/** 17.0 13.6 EBIT** 13.7 11.0 Revenue
GAS BACKBONE OF THE ENERGY SYSTEM TANYA MORRISON, CLIMATE CHANGE GR MANAGER IGU & PGNIG at COP19, Warsaw November 2013
 GAS BACKBONE OF THE ENERGY SYSTEM TANYA MORRISON, CLIMATE CHANGE GR MANAGER IGU & PGNIG at COP19, Warsaw November 2013 Copyright of Royal Dutch Shell plc 1 CAUTIONARY NOTE The companies in which Royal
Cleaner energy and shipping in Indonesia Small scale LNG. By: Jan Valkier
 Cleaner energy and shipping in Indonesia Small scale LNG By: Jan Valkier Jakarta - Mareforum 2012 March 28, 2012 Outline Introduction Anthony Veder Group Fleet LNG focus Our experience in small scale LNG
LNG Liquefaction Projects A North America Focus
 LNG Training Courses LNG Liquefaction Projects A North America Focus 24-26 January 2018 - Houston Sound understanding of the fundamental economics of North American LNG Exports About the Course A decade
Growth Leadership: Vopak s LNG growth strategy
 Growth Leadership: Vopak s LNG growth strategy Capital Markets Day, 7 December 2012 Dirk van Slooten, Global Director LNG Forward-looking statement This presentation contains statements of a forward-looking
November 17. Brochure.
 November 17 Brochure www.nextmaritime.com Index About us Ship Agency Logistics Customs Marine Associates About us............................. THE PREFERRED WORLDWIDE SHIPPING AGENT. Next Maritime is a
Providing LNG Supply and Bunkering Solutions. USCG Sector Delaware Bay LNG Bunkering Workshop Margaret Kaigh Doyle
 Providing LNG Supply and Bunkering Solutions USCG Sector Delaware Bay LNG Bunkering Workshop Margaret Kaigh Doyle AGENDA LNG as Marine Fuel - Why, When, Who What is Small Scale LNG Developing Infrastructure
LNG Impact on U.S. Domestic Natural Gas Markets
 LNG Impact on U.S. Domestic Natural Gas Markets Disclaimer This presentation contains statements about future events and expectations that can be characterized as forward-looking statements, including,
European Gas & LNG Markets, Energy Policy, and Geopolitics October 2016
 European Gas & LNG Markets, Energy Policy, and Geopolitics October 2016 www.rapidangroup.com Leslie.palti-guzman@rapidangroup.com t. +1 301.656.4480 No Quotation or Distribution 1 EU LNG Demand Key Themes:
HAMBURGER HAFEN UND LOGISTIK AG COMPANY PRESENTATION
 HAMBURGER HAFEN UND LOGISTIK AG COMPANY PRESENTATION UNICREDIT GERMAN INVESTMENT CONFERENCE MUNICH, SEPTEMBER 2010 Hamburger Hafen und Logistik AG DISCLAIMER The facts and information contained herein
Matthias Ritters
 LNG as alternative ti fuel -status t and outlook Matthias Ritters 2013-06-19 Content Why LNG as ship fuel? Regulatory development Overview on activities and technologies LNG supply chain and bunkering
Floating LNG What are the key business development risks and mitigation strategies in a FLNG project?
 Floating LNG 2013 What are the key business development risks and mitigation strategies in a FLNG project? What are the key challenges? What are some of the risk mitigation strategies? What are some of
2015 REGIONAL SENIOR EXECUTIVE REWARD SURVEY MERCER EXECUTIVE REMUNERATION GUIDES (MERG) CHINA, HONG KONG, INDIA, JAPAN AND SINGAPORE
 CHINA, HONG KONG, INDIA, JAPAN AND SINGAPORE") 2015 REGIONAL SENIOR EXECUTIVE REWARD SURVEY MERCER EXECUTIVE REMUNERATION GUIDES (MERG) CHINA, HONG KONG, INDIA, JAPAN AND SINGAPORE MERCER EXECUTIVE REMUNERATION GUIDES MERCER S NEW ASIA SENIOR EXECUTIVE
2015 REGIONAL SENIOR EXECUTIVE REWARD SURVEY MERCER EXECUTIVE REMUNERATION GUIDES (MERG) CHINA, HONG KONG, INDIA, JAPAN AND SINGAPORE MERCER EXECUTIVE REMUNERATION GUIDES MERCER S NEW ASIA SENIOR EXECUTIVE
Finding Global End Use Markets for the Growing LPG Supply
 Finding Global End Use Markets for the Growing LPG Supply March 7, 2017 Dr. Walt Hart, Vice President, IHS Natural Gas Liquids Walt.Hart@ihsmarkit.com 2 Finding Global End Use Markets for the Growing LPG
Integrated Gas Philippe Sauquet
 Integrated Gas Philippe Sauquet President Gas, Renewables & Power Gas: Competitive, clean and flexible LNG global demand growing strongly, led by Asia Levelized cost of electricity in Asia $/MWh 2005-25
IHS REVIEWS CONTRASTING 2016 MARKETS: DRY BULK & DIRTY TANKER
 Information IHS MARITIME Analytics & TRADE Expertise FEBRUARY 216 IHS REVIEWS CONTRASTING 216 MARKETS: DRY BULK & DIRTY TANKER Dalibor Gogic, Principal Analyst +44 23 253 2388 Dalibor.Gogic@ihs.com Global
LNG. Liquefied Natural Gas A Strategy for B.C. s Newest Industry
 LNG Liquefied Natural Gas A Strategy for B.C. s Newest Industry LIQUEFIED NATURAL GAS Message from the Premier The BC Jobs Plan released in September is all about leveraging our competitive advantages
3 rd LNG SUPPLY, STORAGE AND TRANSPORTATION PHILLIPINES FORUM 2016 SMX AURA, MANILA
 3 rd LNG SUPPLY, STORAGE AND TRANSPORTATION PHILLIPINES FORUM 2016 SMX AURA, MANILA Growing the market for LNG to Power (L2P) Projects through the Conversion of Existing LNG Carriers Nor Aslam Khan Director
Floating Regasification The Aegean LNG terminal
 Energy and Shipping Athens, March 2013 Floating Regasification The Aegean LNG terminal George Polychroniou Division Head, Strategy & Corporate Development Contents The growing role of FSRUs The case of
Navios South American Logistics Inc. Company Presentation
 Navios South American Logistics Inc. Company Presentation April 2013 Forward Looking Statements This presentation contains forward-looking statements (as defined in Section 27A of the Securities Act of
WÄRTSILÄ CORPORATION
 Stakeholder expectation WÄRTSILÄ CORPORATION ENTSOG 4th Workshop on the European Ten Year Network Development plan September 29, 2011 Juhani Hupli, Vice President, Ship Power Technology Wärtsilä Corporation
Scaling down LNG. Mariana Ortiz Laborde. Gas Natural Fenosa. Portfolio Manager at Global Gas Division
 Scaling down LNG Mariana Ortiz Laborde Portfolio Manager at Global Gas Division Gas Natural Fenosa Executive Committee Workshop March 30, 2017, Muscat, Oman Disclaimer This presentation and the information
Full year results Amsterdam, 5 February 2015
 Full year results 2014 Amsterdam, 5 February 2015 Disclaimer The information contained herein shall not constitute or form any part of any offer or invitation to subscribe for, underwrite or otherwise
Anatomy of LNG Shipping & Operations
 Anatomy of LNG Shipping & Operations 13-17 May 2018 The Møller Centre Cambridge Organised by Cambridge Academy of Transport 48 Whittlesford Road Little Shelford Cambridge CB22 5EW Tel: +44 (0)1223 845242
Beyond the Chicken and the Egg
 Beyond the Chicken and the Egg How will Singapore Consolidate its Position as a LNG Bunkering Hub in Southeast Asia? Alexander Dodge PhD Candidate in Innovation Studies Department of Geography Trondheim,
We deliver gas infrastructure
 We deliver gas infrastructure We are Uniper We are a leading international energy company with operations in more than 40 countries and around 13,000 employees. We combine a balanced portfolio of modern
/ IBE-WATCH FACT SHEET Q1 2017
 IBERDROLA: Net Electricity Production (provisional) TOTAL GROUP GWh % Weight vs 2016 GWh % Weight vs 2016 Renewables 16,331 43% -10.0% 16,331 43% -10.0% Onshore wind 9,501 25% -3.8% 9,501 25% -3.8% Offshore
BIG UNLIMITED FY18 Q1 4C UPDATE OCT 2017
 BIG UNLIMITED FY18 Q1 4C UPDATE OCT 2017 WHAT IS BIG BIG (ASX: BIG) is the parent company of Big Review TV Ltd. Big Review TV are innovative disruptors in the online video space. They are a video driven
For personal use only
 Horizon Oil Limited ABN 51 009 799 455 Level 6, 134 William Street, Woolloomooloo NSW Australia 2011 Tel +61 2 9332 5000, Fax +61 2 9332 5050 www.horizonoil.com.au 29 November 2017 The Manager, Company
2016 ANNUAL RESULTS ANNOUNCEMENT. March, 2017
 2016 ANNUAL RESULTS ANNOUNCEMENT March, 2017 Disclaimer This document has been prepared for general information purposes only and is not, and should be not construed as, an offer for sell or a solicitation
The Global Context for Alaskan Oil and LNG
 The Global Context for Alaskan Oil and LNG PRESENTED TO LSI Energy in Alaska Conference PRESENTED BY Paul R. Carpenter Steven H. Levine Anul Thapa December 12, 2016 Copyright 2015 The Brattle Group, Inc.
Third quarter and first nine months 2017 Results Release. October 19 th, 2017
 Third quarter and first nine months 2017 Results Release October 19 th, 2017 Safe harbor statement Any statements contained in this document that are not historical facts are forward-looking statements
Argus European LPG Markets LPG Shipping - Current Challenges and Future Opportunities
 Argus European LPG Markets 2013. LPG Shipping - Current Challenges and Future Opportunities A presentation prepared by ViaMar AS, Oslo All information provided by ViaMar AS, whether oral or written, is
LNG Import Terminals: Challenges and Opportunities
 LNG Import Terminals: Challenges and Opportunities 13 th October 2016 Mangesh Patankar Head of Business Development (Asia Pacific), Galway Group www.galwaygroup.com 1 Galway Group has been actively involved
Capturing growth through global systems integration
 Energy Solutions: Capturing growth through global systems integration Javier Cavada, President, Energy Solutions, Executive Vice President 1 Wärtsilä 29 September 2016 Javier Cavada Renewables rapidly
microgen plc Audited Preliminary Results for the year ended 31 December 2015
 microgen plc Audited Preliminary Results for the year ended 31 December 2015 To be read in conjunction with the audited preliminary results announcement released on 3 March 2016 1 Group Overview Across
UPSTREAM PERSPECTIVE ON INDONESIA GAS SUPPLY DEMAND. Jean-Francois Hery Head of Commercial Division
 Marc Roussel / Total UPSTREAM PERSPECTIVE ON INDONESIA GAS SUPPLY DEMAND Jean-Francois Hery Head of Commercial Division DISCLAIMER This presentation may include forward-looking statements within the meaning
Sanford Bernstein Strategic Decisions Conference. 2 October 2013
 Sanford Bernstein Strategic Decisions Conference 2 October 2013 André Lacroix Group Chief Executive Agenda 1) Proven business model and strategy 2) The right markets and channel mix 3) Operational excellence
The LNG Leader. Spring Curtis Island LNG Projects Queensland, Australia INFRASTRUCTURE MINING & METALS NUCLEAR, SECURITY & ENVIRONMENTAL
 23 46 20 S 151 11 38 Curtis Island LNG Projects Queensland, Australia INFRASTRUCTURE MINING & METALS NUCLEAR, SECURITY & ENVIRONMENTAL OIL, GAS & CHEMICALS The LNG Leader Spring 2017 Bechtel has built
Axway H Results. Christophe Fabre, Chief Executive Officer 02 August 2012
 Axway H1 2012 Results Christophe Fabre, Chief Executive Officer 02 August 2012 Forward looking statements This document contains forecasts in respect of which there are risks and uncertainties concerning
2 nd Quarter Financial Results for Fiscal 2017 November 9, Tadashi Ishizuka Representative Director, President and COO
 Business Overview 2 nd Quarter Financial Results for Fiscal 2017 November 9, 2017 Tadashi Ishizuka Representative Director, President and COO Contents 1. Project Orders for the First Half of FY2017 2.
GL Your competitive edge Take the lead through innovation
 Costs and benefits of LNG-fuelled feeder container vessels Dr. Pierre C. Sames, Senior Vice President Strategic Research and Development GL Your competitive edge Take the lead through innovation Contents
GLADSTONE TO JAPAN: EXPORT LNG PROJECT. December 2007
 GLADSTONE TO JAPAN: EXPORT LNG PROJECT December 2007 Project Summary Sunshine Gas (SHG) and Sojitz Corporation (SOJITZ) formed relationship to combine upstream and downstream resource expertise to identify
NARUC. Global Liquefied Natural Gas Supply: An Introduction for Public Utility Commissioners
 2009 Global Liquefied Natural Gas Supply: An Introduction for Public Utility Commissioners NARUC October 2009 The National Association of Regulatory Utility Commissioners Funded by the U.S. Department
LNG storage: a growth story? StocExpo Rotterdam commercial manager
 LNG storage: a growth story? StocExpo Rotterdam 17-03-2015 stefaan.adriaens@gateterminal.com, commercial manager Do I have your attention? Goldman Sees LNG as Biggest Commodity After Crude This Year (Bloomberg)
Interim Results FY17/18 For the 6 months ended 30 September November 2017
 Interim Results FY17/18 For the 6 months ended 30 September 2017 23 November 2017 Agenda Group s Financial Performance Business Review by Market Outlook And The Way Forward 1 Group s Financial Performance
LNG Liquefaction Projects A North America Focus
 LNG Training Courses LNG Liquefaction Projects A North America Focus 22-24 March 2017 - Houston Sound understanding of the fundamental economics of North American LNG Exports About the Course A decade
Global trends shaping future shipping
 Global trends shaping future shipping INTERTANKO Meeting Houston 18 th October 2016 Paal Johansen, Executive Vice President and Regional Director DNV GL - Maritime Americas 1 SAFER, SMARTER, GREENER On
XING AG. Dr. Stefan Gross-Selbeck (CEO) & Ingo Chu (CFO) Hamburg, May 12, 2010
 & Ingo Chu (CFO) Hamburg, May 12, 2010") Q1 Results Presentation XING AG Dr. Stefan Gross-Selbeck (CEO) & Ingo Chu (CFO) Hamburg, May 12, 2010 01 Starting Position Recap from FY 2009 results presentation... 2010: The year of profitable growth...
Q1 Results Presentation XING AG Dr. Stefan Gross-Selbeck (CEO) & Ingo Chu (CFO) Hamburg, May 12, 2010 01 Starting Position Recap from FY 2009 results presentation... 2010: The year of profitable growth...