CSI Incentive Calculator User Guide
|
|
|
- Augustus Horton
- 6 years ago
- Views:
Transcription
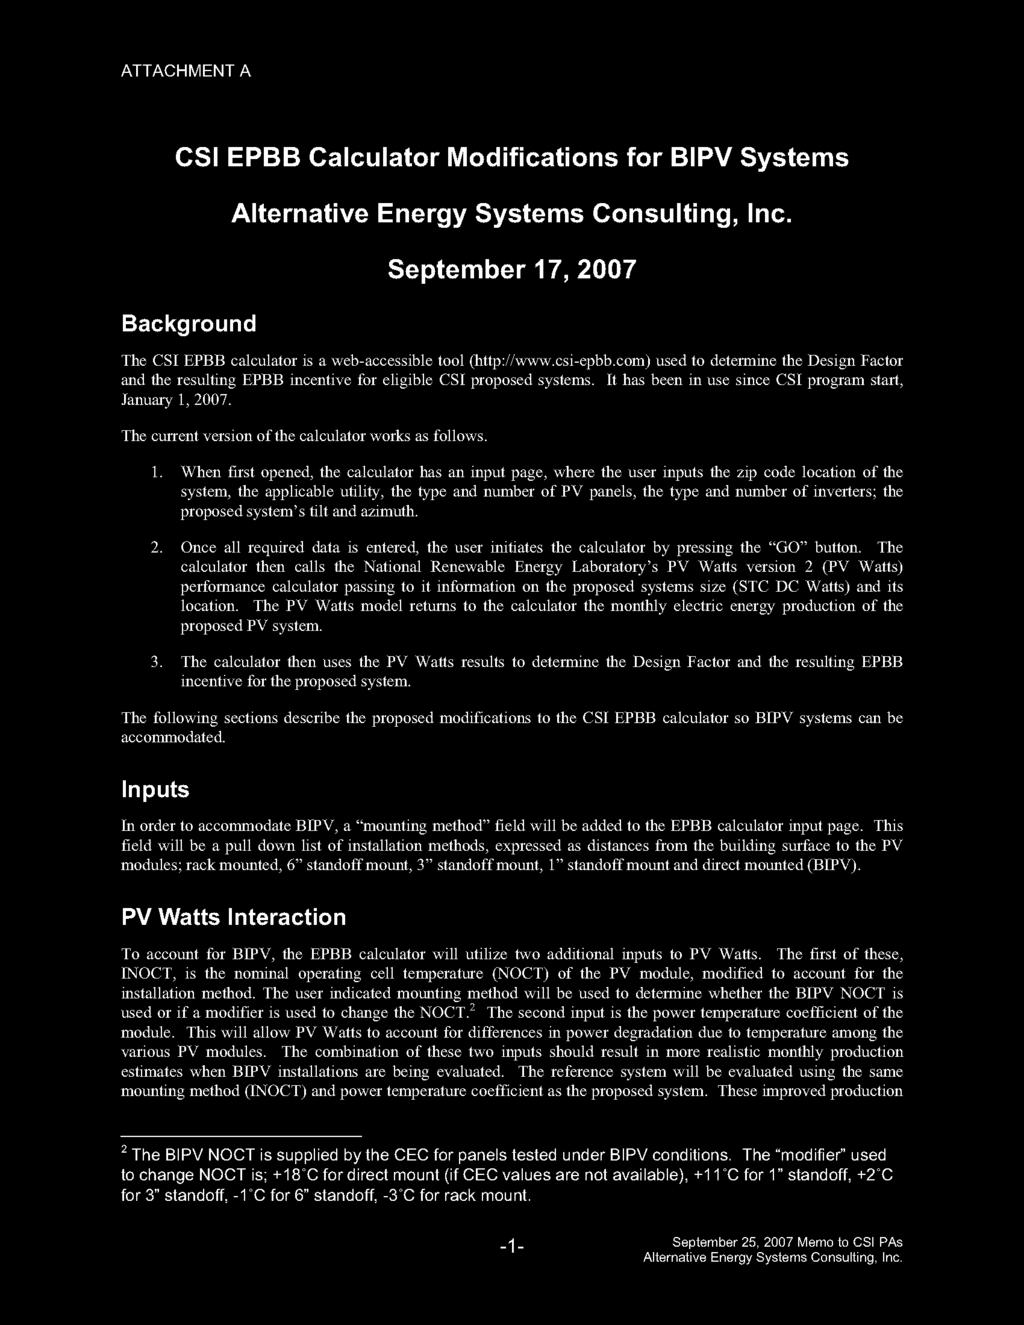
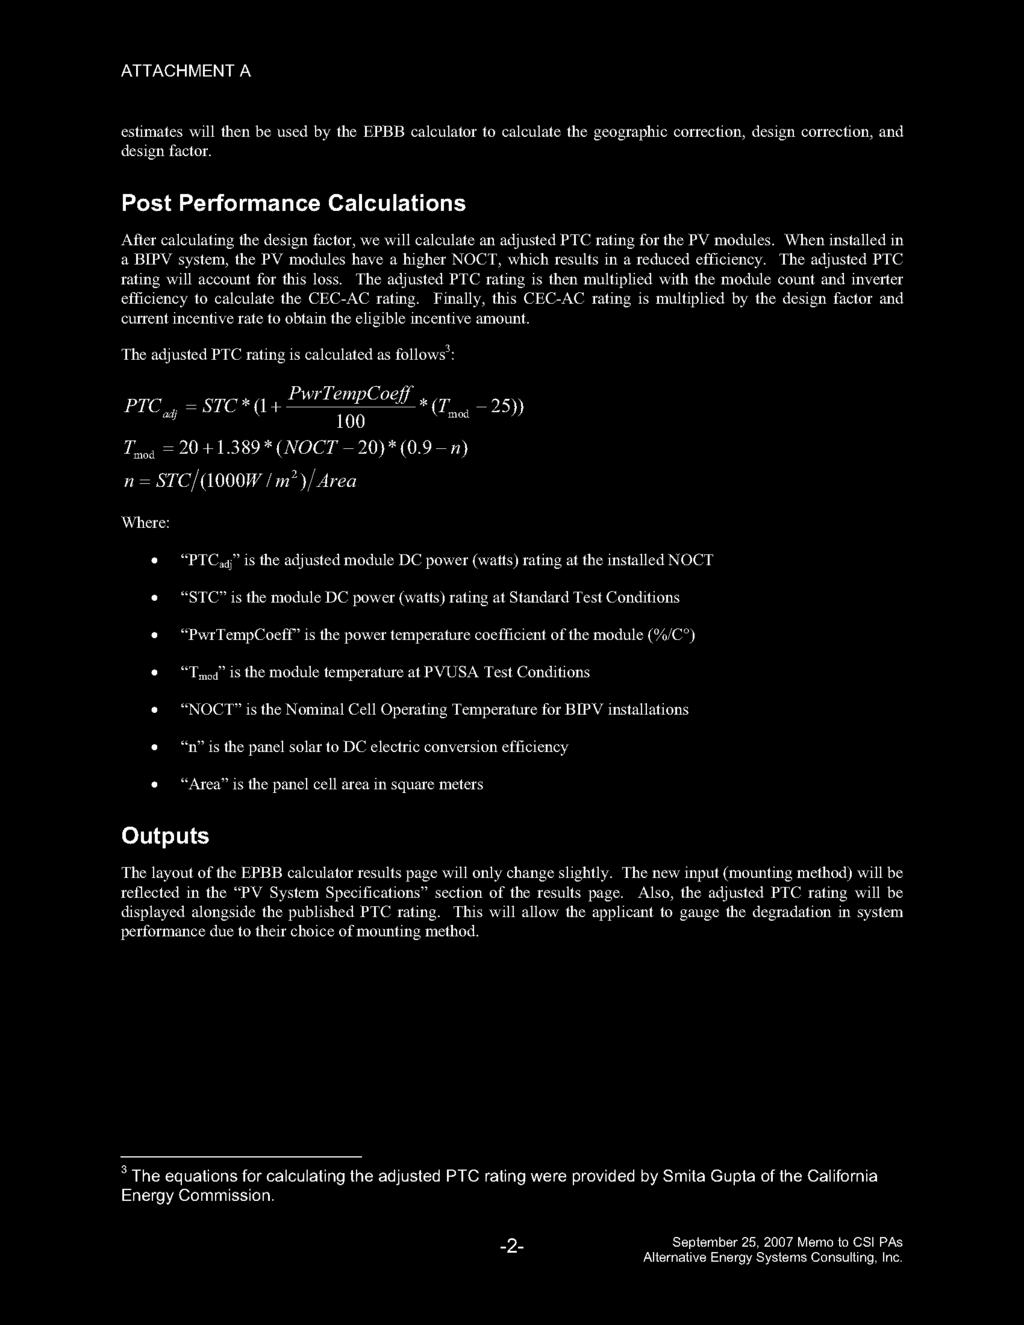
1 CSI Incentive Calculator User Guide CSI Calculator v5 User Guide.doc 1. Guide Overview This User Guide provides background on the California Solar Initiative (CSI) Incentive Calculator, describes how the calculator determines the CSI incentives for a proposed system and detailed step by step instructions on its use. The calculator is web-accessible at The CSI-EPBB calculator is a tool available to participants of the CSI Program to determine the EPBB Design Factor and calculate an appropriate incentive level based on a reasonable expectation of performance for an individual system. The CSI-EPBB Calculator has also been created for consumer s to educate themselves on the differences of solar system design and how changes to the PV system s specifications will produce different kilowatt hour results over the course of a year. Please be aware that actual performance of an installed PV system is based on numerous factors, including some factors that may not be considered in the CSI-EPBB Calculator. While this calculator relies on industry-standard assumptions, and is driven by NREL s PV Watts v. 2 calculator ( there may be other factors that affect the output of your PV System. Senate Bill 1 (SB 1) directed the California Energy Commission (Energy Commission) to establish eligibility criteria, conditions for incentives, and rating standards for projects applying for ratepayer-funded incentives for solar energy systems. These guidelines may be found online at the Go Solar California website ( equipment/index.html). The solar energy system component and design standards were mandated to be implemented no later than July 1, This User Guide provides information specific to the version of the CSI calculator that is compatible with these guidelines, and is identified by the header: Incentive Calculator - CSI Standard PV 2. CSI Eligibility Eligible photovoltaic (PV) projects must be located within sites where the Host Customer is a Pacific Gas & Electric (PG&E), Southern California Edison (SCE) or San Diego Gas & Electric (SDG&E) retail electric customer. 1 Systems between 1 kw and 5,000 kw are eligible to participate in CSI, however incentives are paid on the first 1,000 kw of installed capacity. Proposed systems that have a CEC-AC 2 rating less than 30 kw are 1 Note that the California Center for Sustainable Energy (CCSE) is the Program Administrator for CSI in SDG&E s service territory. 2 The CEC-AC rating is the product of the number of PV panels, the PTC rating per panel and the inverter efficiency
2 eligible for Expected Performance Based Buy down (EPBB) incentives. All systems are eligible for Performance Based Incentives (PBI). All customer classes are eligible for CSI except for residential new construction systems which must apply to the New Solar Home Partnership (NSHP) program. NSHP details may be found at The CSI calculator is currently not applicable to systems applying to the NSHP. Program eligibility details can be found at the Go Solar California and CSI Program Administrators websites listed below Go Solar California PG&E SCE CCSE Municipal electric utility customers are not eligible to receive incentives from the above designated program administrators. 3. CSI Incentive Calculator Overview The CSI calculator is an internet accessible tool ( used to determine the Design Factor and the resulting EPBB or PBI incentive for eligible CSI proposed systems. 3 The calculator determines the CSI incentive for a single type of PV panel and inverter combination. The incentive for multiple units of the same type of PV panel and/or inverter can be accommodated by the calculator in a single calculation. Mixed systems that use different types of inverters, PV panels, tilts and/or azimuths require individual incentive calculations for each combination and the incentives summed. More details on mixed system CSI incentive calculation can be found in Section 6 of this guide. When first opened, the calculator has an input page, where the user inputs the zip code location of the system, the customer s electric utility, type of customer, incentive type, the type and number of PV modules, mounting method, the type and number of inverters, and the proposed system s tilt and azimuth. Once all required data is entered, the user initiates the calculator by pressing the GO button. The calculator then calls the National Renewable Energy Laboratory s (NREL s) PV Watts version 2 (PV Watts) performance calculator passing to it information on the proposed system and its location. The PV Watts model returns to the calculator the monthly electric energy production of the proposed PV system. 3 Note that CSI calculator PBI results are used by the Program Administrator to set-aside funds for future PBI payments. The CSI PBI results are not a guarantee of payment. PBI payments are based on the actual metered output of the proposed system


3 The calculator then uses the PV Watts results to determine the resulting CSI incentive for the proposed system. The overall process is illustrated below. Input Screen Results Screen The user can press the Recalculate button, found at the bottom of the results screen, to return to the input page and make adjustments to their original inputs. 4. Required Calculator Inputs The CSI calculator is configured to calculate the incentive for a single PV panel type, inverter type with one tilt and azimuth. For example if a system utilizes two different inverter models, but the same type of PV panel, the calculator must be run twice. More details on mixed system EPBB incentive calculation can be found in Section 6 of this guide. The inputs for the CSI EPBB Design Factor calculator are described below. ZIP Code: This is the zip code of the location of the proposed PV system. Note that this zip code must be located within the specified utility s service territory where the system is or will be located. Utility: This is the utility in whose service territory the proposed PV system is or will be located. Note that the zip code inputted must be located within the specified utility s service territory. Customer Type: Select the customer classification associated with the Host Customer. For definitions of the various customer types, refer to the latest California Solar Initiative Program Handbook
4 Incentive Type: Select the incentive type, EPBB or PBI, being sought for the proposed system. 4 Proposed systems that have a CEC-AC rating less than 50 kw are eligible for EPBB incentives. All systems are eligible for PBI. The incentive type changes how the calculator determines the incentive and changes the format of the results report. PV Module: Select the module that will be used in the proposed PV system. The options in this pull-down are based on the CEC s list of eligible photovoltaic modules, which can be found at If multiple module types are to be used, you must make multiple CSI calculator runs. Number of Modules: This is the total number of PV modules of the selected type that will be connected to the inverter(s) that are selected below. Mounting Method: This is the average standoff between the mounting surface and bottom of the PV module frame or mounting rack, which ever is closest to the mounting surface. The selections are 0" average standoff (flush mount or BIPV) Where the PV mounting rack is in direct contact with the mounting surface or the PV modules lack outdoor air ventilation. > 0" to 1" average standoff The average standoff is 1 or less > 1" to 3" average standoff The average standoff is 3 or less, but greater than 1 > 3" to 6" average standoff The average standoff is 6 or less, but greater than 3 > 6" average standoff The average standoff is greater than 6 Average standoff (S AVG ) is the sum of the minimum and maximum standoff divided by two. Standoff is the distance perpendicular from the mounting surface to the bottom of the PV module frame. One minimum and maximum standoff distance must be established per array. See illustration below. S AVG = (S MAX + S MIN ) / 2 Maximum Standoff PV Module Roof Surface PV Module Mounting Rack Minimum Standoff 4 Refer to the latest CSI Program Handbook for incentive type definitions and detailed eligibility requirements
5 Inverter: This is the type of inverter that will be used with the proposed PV system. The options in this pull-down are based on the CEC s list of eligible inverters found at If multiple inverter types are to be used, you must make multiple CSI calculator runs. Also, if the CEC-AC rating of the proposed system is greater than 125% of the inverter rating, an error is flagged which must be corrected (by reducing the number of panels, choosing a lower PTC rated panel, increasing the number of inverters or choosing a larger capacity inverter) before being allowed to proceed to the results page. See description of "CEC- AC Rating" in Section 5 of this guide for more discussion on oversized systems. Number of Inverters: This is the total number of inverters of the selected type that will be installed for use with the PV modules selected above. Minimal Shading: This criterion, if checked, indicates that no solar obstruction is closer than a distance twice the height it extends above the PV modules. If this criterion is met and Minimal Shading is checked, no derating due to shading is applied. Note that the reference optimal systems at the proposed and reference locations are always specified to meet the Minimum Shading Criteria. Shading Derate Factors (%): If the proposed system does not meet the Minimum Shading Criteria, the user is required to input monthly non-shaded results from a shading study conducted at the proposed system site. If the Minimal Shading box is unchecked, a table form will appear where the user is to input each month s non-shaded results from the shading study. See Section 7 for more details on obtaining and inputting the shading derate factors. The reference optimal system is specified to meet the Minimum Shading Criteria and thus has no derating of its monthly output due to shading. Tracking (PBI Only): The calculator can accommodate single axis or double axis tracking systems that are applying for PBI. Tracking systems are eligible to apply for EPBB incentives but will be treated as fixed systems for purposes of calculating the eligible incentive. Array Tilt (degrees): This is the proposed system tilt from horizontal. Flat (horizontal) systems have a 0º tilt. For single axis tracking systems (PBI Only), this is the tilt of the axis of rotation. This input is not used for double axis tracking systems. Array Azimuth (degrees): This is the horizontal direction ( true north-south) the proposed system is pointing; due South is 180º azimuth and due North is 0º azimuth. For single axis tracking systems (PBI Only), this is the direction that the axis of rotation is facing. This input is not used for double axis tracking systems. The optimal reference system for proposed flat (horizontal) systems is assumed to have a 180º azimuth. Magnetic direction measured by a compass can be converted to true direction by adding the appropriate magnetic declination for the specific location. Magnetic declination can be determined at the NOAA website (
6 After the inputs are set, the user can click the GO button and the calculations will be executed. If an input error is detected, the calculator will refresh the input page and note the error with a comment at the bottom and an asterisk next to the field containing the error. The error must be corrected before the calculator will proceed to the results output page. 5. Description of the Outputs Once the calculator has completed its computations, it will display a results page containing inputs (Site Specifications and PV System Specifications) and outputs (Results) for the proposed and reference optimal system, as well as the Design Factor and calculated incentive. If the user wishes to apply to the CSI program, they must include a hardcopy of the CSI Calculator results screen in their application materials. All production estimates are obtained from running NREL s PV Watts v2 photovoltaic performance model using the proposed system parameters and weather data for the proposed and reference locations. The outputs are described below. Note that there are differences in what results are reported for EPBB versus PBI incentives. EPBB Incentives PV Module: Lists the specified PV module name and module DC rating per panel; STC, PTC and PTC adj. The PTC adj rating is not reported on the CEC website and is not equivalent to the PVUSA Test Conditions. It is calculated depending on the mounting method, NOCT and power temperature coefficient for that specific module. See Appendix A of this User Guide for a detailed description of the modified PTC calculation. DC Rating (kw STC): This is the calculated total DC STC rated capacity of the PV modules and is calculated by multiplying the STC module rating by the number of panels. This capacity is used as an input to PV Watts to determine the performance of the system. DC Rating (kw PTC): This is the calculated total DC PTC rated capacity of the PV modules and is calculated by multiplying the PTC module rating by the number of panels. This capacity is used to calculate the CEC-AC rating of the system. Estimated Monthly Production: The estimated monthly kwh production of the proposed system is displayed along with the estimated production of one or two systems at optimal tilt. If the reference system (below) has an azimuth other than 180, the chart will include optimal tilt systems at both the reference azimuth and 180 (south facing). Note that the sum of the monthly values may not equal the annual kwh that is displayed due to rounding issues
7 Optimal Tilt (proposed azimuth): This is the system s optimal tilt, maximizing summer output, at the proposed location. The optimal tilt also depends on the azimuth of the optimal reference system. The following illustrates how the reference system azimuth is set to equally treat south and west facing proposed systems. Proposed System Azimuth 270º to 45º Reference System Azimuth = 270º NW 315º N 0º NE 45º Proposed System Azimuth 45º to 180º Reference System Azimuth = 180º W 270º Proposed System 90º E Proposed System Azimuth 180º to 270º Reference System Azimuth = Propose System Azimuth 225º SW 180º S 135º SE Optimal Tilt (facing south): This is the tilt of summer optimal south facing systems at the proposed and reference locations. Annual kwh: This is the estimated annual energy output of the proposed system. This value is reported for the sole purpose of transparency of the calculator and is not a guarantee of future system performance. at optimal tilt: This is the estimated annual energy output of the summer optimized system at the proposed location. This value is reported for the sole purpose of transparency of the calculator. facing south at optimal tilt: This is the estimated annual energy output of south facing summer optimized systems at the proposed and reference locations. These values are used to determine the Geographic Correction. Summer Months: These are the months that define the summer period. The proposed and reference optimal system output for these months is used to determine the Summer kwh. Summer kwh: This is the estimated summer energy output of the proposed system. at optimal tilt: This is the estimated summer energy output of the proposed system, optimized to maximize summer output
8 facing south at optimal tilt: This is the estimated summer energy output of the proposed and reference location systems, both optimized to maximize summer output. CEC-AC Rating: This is the product of the PV module PTC rating, module count and inverter efficiency. If the CEC-AC rating exceeds the rated capacity of the inverter by no more than 125%, a warning is displayed on the results page. This warning is only informational and does not prevent the user from proposing the system in a CSI application. 5 Design Correction: This is the ratio of the Summer Output of the Proposed System and the Summer Output of the Optimal System at the Proposed Location. It indicates how well optimized the proposed system is configured. Geographic Correction: This is the ratio of the annual output of the summer optimal south facing system at the proposed location and the annual output of the summer optimal south facing system at the reference location. It indicates how well a PV system installed at the proposed location performs relative to the reference location. Note that this ratio is capped at 1.0. Installation Correction: This is the ratio of PTC adj and PTC of the proposed system. The PTC is the DC rating of the panels at PVUSA Test Conditions and is listed on the CEC eligible equipment website. The PTC adj rating is not reported on the CEC eligible equipment website and is not equivalent to the PVUSA Test Conditions. It is calculated depending on the mounting method, NOCT and power temperature coefficient for that specific module. See Appendix A of this User Guide for a detailed description of the modified PTC calculation. It accounts for the effects of mounting method on cell temperature and resulting power output. Note that this ratio is capped at 1.0. Design Factor: This is the product of the Design Correction, Geographic Correction and Installation Correction. This Design Factor is used in the EPBB incentive calculation. Incentive Rate: This is the current CSI EPBB incentive rate ($/W) and depends on the selected utility and customer type. It is obtained directly from the CSI Trigger Tracker located at Incentive: This is the total incentive for the proposed system. Report Generated on: is a date and time stamp to document when the report run occurred. 5 Some inverters allow operation above their rated capacity, to a degree, for at least short periods limited by their operating temperature and amperage carrying capability. In addition, some PV systems will not achieve their CEC-AC rating in the field due to local weather conditions and system configuration. Allowing proposed oversized systems, up to 125% of inverter rated capacity, to calculate an EPBB incentive does not guarantee eligibility. The CSI Program Administrators reserve the right to seek justification for proposed oversized systems which may result in poor reliability due to mis-matched equipment
9 PBI Incentive Calculator Outputs (Differences from EPBB Outputs Only) Estimated Monthly Production: The PBI calculator does not calculate any reference systems. The chart of estimated monthly production will only show the results for the proposed system. Unlike EPBB systems that use a reference point to compare against the proposed system, PBI incentives are paid via actual production therefore negating the need for a reference point. Note that the sum of the monthly values may not equal the annual kwh that is displayed due to rounding issues. Capacity Factor: This is the estimated annual output of the proposed system divided by the product of 8760 annual hours and the proposed system s CEC-AC rating. Prevailing Capacity Factor: This is 18% for incentive steps 2 and 3 and 20% for incentive steps 4 through 10. Design Factor: This is the ratio of the Capacity Factor and the Prevailing Capacity Factor. This Design Factor is not used to directly calculate the PBI incentive amount. The Program Administrators use it to modify the CEC-AC rating of the system for incentive trigger tracking purposes. Incentive Rate: This is the current CSI PBI incentive rate ($/kwh) and depends on the selected utility and customer type. It is obtained directly from the CSI Trigger Tracker located at Incentive: This is the estimated total incentive for the proposed system, and is calculated as the estimated annual output times the incentive rate times 5 years. The incentive paid will be based on the actual production of the installed system. 6. Multiple Arrays, Module or Inverter Types If a proposed system consists of PV arrays with different azimuths and tilts or if different PV module or inverter types will be installed as part of a PV system, a CSI calculator run must be done for each configuration and the resulting incentives totaled. For example, a system with 30 PV panels type A with the same tilt and azimuth, and 2 inverters of type Z is proposed; only one calculator run has to be made for this type of system. However, if a single system with 15 panels of type A and 15 panels of type B, with 1 inverter of type Z is proposed, the user must make one calculator run with 15 A panels and 1 Z inverter and a second calculator run with 15 B panels and 1 Z inverter. The incentives from the two runs must then be added together
10 7. Shading Input Requirements Proposed systems meet the Minimum Shading Criteria if any surrounding object is no closer than a distance twice the height it extends above the PV modules (see illustration below). If this criterion is met and Minimal Shading is checked, no derating due to shading is applied. Minimum Shading if D > (2 x H) H D H H D D For systems that do not meet the Minimum Shading Criteria, the user is required to input monthly shade impact results from a shading study conducted at the proposed system site. The study must use a shade analysis tool (and accompanying software) such as the Solar Pathfinder ( or the Solmetric SunEye ( These inputs are used as monthly derate factors (100% = no shading, 0% = total shading) to adjust the PV Watts output for shading. The shade analysis tool must be specific to the location, azimuth and tilt of the system being measured and must correct for magnetic declination. Do not use a shade analysis tool that is only applicable to south facing systems if your system s azimuth is different than 180º. Please reference the shade analysis tool documentation for more instructions on their use and interpretation. The shading study must consist of shading measurements taken at of the system array s major corners with no adjacent measurement being more than 40 feet apart, and the average monthly derate factors input into the calculator. Additional measurements must be taken along any edge that is longer than 40 feet. The points of measurement shall be distributed evenly between two major corners if they are more than 40 feet apart such that the linear distance between any sequential points is no more than 40 feet. However, if any linear edge of the array has no obstructions that are closer than two times the height they project above the lowest point on the array, then the intermediate measurements along that edge do not need to be made. For rectangular areas, a minimum of four shading measurements must be taken, one at each corner. For irregular areas, a shading measurement is taken at each corner as shown below
11 It is not necessary to take measures at each panel corner, for example, in the case of staggered panels. Shade measurements should be made at the major corners of the array as shown below It is critical that the positions of the shade measurements are documented and communicated to the CSI field inspector so they may duplicate the measurement. The measurement locations must be accessible after the PV system has been installed for purposes of field verification by the CSI Program Administrators. It is the applicant s responsibility to document the study. 8. EPBB Incentive & Design Factor Computation Details The EPBB incentive is calculated with the following formula. Where, EPBB Incentive = Incentive Rate x System Rating x Design Factor EPBB Incentive is the monetary incentive paid upfront
12 Incentive Rate is the maximum EPBB incentive rate ($/Watt) available at the time of application. The table below presents the EPBB incentive rate schedule. MW Step MW per step Maximum EPPB Payment Amounts Residential EPBB payments (per watt) Non-Residential Government/ Commercial Non-Profit 1 50 n/a n/a n/a 2 70 $2.50 $2.50 $ $2.20 $2.20 $ $1.90 $1.90 $ $1.55 $1.55 $ $1.10 $1.10 $ $0.65 $0.65 $ $0.35 $0.35 $ $0.25 $0.25 $ $0.20 $0.20 $0.70 System Rating is the product of the PV module PTC rating, module count and inverter efficiency. Design Factor is a factor used to modify the maximum incentive rate based on the proposed system s estimated performance relative to an optimal system at the proposed location, an optimal system at a reference location and a well ventilated module installation. This is the product of the Design Correction (Dcorr), Geographic Correction (Gcorr) and Installation Correction (Icorr). Dcorr is the ratio of the estimated summer kwh production for the proposed system at the proposed location and the estimated summer kwh production for a summer optimal system at the proposed location. Gcorr is the ratio of the estimated annual kwh production for a summer optimal system at the proposed location and the estimated annual kwh production for a summer optimal system at a reference location. Icorr is the ratio of PTC adj and PTC ratings of the proposed system. The PTC adj is calculated depending on the mounting method, NOCT and power temperature coefficient for that specific module. The Design Factor (DF) calculation is - DF = Dcorr * Gcorr * Icorr Dcorr (Design Correction) = S s,p,p / S s,p,o S s,p,p = The system's estimated summer kwh output at the proposed location, with proposed tilt & azimuth
13 S s,p,o = The system's estimated summer kwh output at the proposed location, with summer optimized tilt & azimuth allowing for equal treatment of proposed systems oriented from South to West (i.e. the optimized system s orientation shall be the same as the proposed system for orientations due south to due west). Gcorr (Geographic Correction) = A s,p,o / A s,r,o A s,p,o = The system's estimated annual kwh output at the proposed location, with summer optimized tilt & south azimuth A s,r,o = The system's estimated annual kwh output at the reference location, with summer optimized tilt & south azimuth Icorr (Installation Correction) = PTC adj / PTC PTC adj = The adjusted PTC DC rating accounting for mounting method, NOCT and power temperature coefficient for that specific module. See Appendix A of this User Guide for a detailed description of the modified PTC calculation. PTC = The DC rating of the panels at PVUSA Test Conditions. In addition, the calculator has these characteristics and features, The Summer Period is the defined as May1 through October 31. This encompasses the summer periods as defined by the three California investorowned electric utilities. All estimated kwh outputs are determined from NREL s PV Watt v2 performance model. Gcorr is capped at 1.0 to prevent areas with higher performance than the reference location from obtaining incentives larger than the maximum incentive rate. All systems oriented between 180º and 270º are treated equally. The optimal reference orientation tilt is optimized for summer production corresponding to the different acceptable compass directions from 180º to 270º. Location-specific criteria which account for weather variation and varying degrees of solar insolation, based on local climate and geography
14 An optimal reference latitude tilt that relates to local latitude. 9. PBI Incentive Computation Details The PBI incentive is calculated with the following formula. Where, PBI Incentive = Incentive Rate x Est. Annual Output x Five Years PBI Incentive is the total estimated monetary incentive paid monthly over a five year period. Note that this estimate is used by the Program Administrators to set-aside funds for future payments. It is not a guarantee of payment. Actual payments are based on the metered output of the PV system, which may vary significantly from the PBI Incentive estimate provided by the calculator. Incentive Rate is the PBI incentive rate ($/kwh) available at the time of application. The table below presents the PBI incentive rate schedule. MW Step MW per step PBI Payment Amounts Residential PBI payments (per kwh) Non-Residential Government Commercial Non-Profit 1 50 n/a n/a n/a 2 70 $0.39 $0.39 $ $0.34 $0.34 $ $0.26 $0.26 $ $0.22 $0.22 $ $0.15 $0.15 $ $0.09 $0.09 $ $0.05 $0.05 $ $0.03 $0.03 $ $0.03 $0.03 $0.10 Annual kwh: This is the estimated annual energy output of the proposed system. This value is not a guarantee of future system performance. 10. Calculator Interaction with PV Watts v2 The CSI EBPP calculator utilizes NREL s PV Watts v2 to estimate the performance of proposed and optimal systems. PV Watts v2 calculates electrical energy produced by a grid-connected photovoltaic (PV) system. PV Watts v2 uses hourly Typical Meteorological Year (TMY) weather data and a PV performance model based on Sandia National Laboratories' PVFORM to estimate monthly and annual AC energy production
15 (kwh). PV Watts v2 extends the capabilities of PV Watts v1 by incorporating NREL's 40 km resolution solar resource data to permit site-specific calculations. PV Watts v2 calculates performance using hourly data for a nearby TMY2 site that is climatologically similar, and then the output is adjusted based on differences between the TMY2 site and the grid cell with respect to the solar resource (direct, diffuse horizontal, and global horizontal radiation) and daily maximum temperature. PV Watts v2 has a number of default derate factors that it includes to account for various system losses. The CSI calculator assumes a fixed set of losses in the proposed and optimal systems totaling 16.3%, which is the default in PV Watts v2. These derate factors include PV Watts Default Derate Factors for AC Power Rating at STC Component Derate Factors PVWATTS Default Range PV module nameplate DC rating Inverter and Transformer User Input Mismatch Diodes and connections DC wiring AC wiring Soiling System availability Shading Sun-tracking Age Reference: Note that the CSI Incentive calculator adopts these factors as defaults except for Inverter and Transformer. The CSI calculator uses the proposed inverter efficiency specified by the user. A detailed discussion of appropriate derate factors can be found at NREL reports that PV Watts v2 results may vary due to weather patterns and other uncertainties associated with the weather data and the model used to model the PV performance. The variations may be as much as ±20% when compared to individual years. Compared to long-term performance over many years, the values in the table are accurate to within 10% to 12%. NREL also cautions that the energy production values in the table are valid only for crystalline silicon PV systems. In addition to these uncertainties, PV Watts v2 utilizes NREL s 40 km resolution solar resource data to permit site-specific calculations. However, if the locations are within the same 40 km x
16 40 km geographical cell area, this may result in the same system production for different locations, even though it may appear that local weather patterns would dictate that they should be different. Detailed information on PV Watts v2 and how it works may be found at - Overview of NREL s PV Watts calculator. - Discussion of PV Watts parameters. - Paper discussing how PV Watts v2 incorporates NREL's 40 km resolution solar resource data to permit sitespecific calculations. - Discussion of interpreting the results. - Lists the revision history for PV Watts 11. Getting Help & Providing Comments Questions and comments regarding the CSI EPBB Design Factor Calculator or this User Guide should be ed to CSI-EPBB@aesc-inc.com. Questions will be addressed on a first-come first-served basis
17 Appendix A CSI Calculator Modifications for BIPV On September 26, 2007, a compliance filing was made by CCSE on behalf of the CSI Program Administrators setting forth revised EPBB calculation methodology incorporating BIPV system data. This filing included a detailed explanation of the modified calculation methodology
18 - 18 -
19 - 19 -
20 - 20 -
21 - 21 -
22 - 22 -
Home PV System Design
 Home PV System Design Step #1 Evaluate Home Energy Needs (based on 2007 & 2008 PG&E bill) Averaged annual electricity usage is around 4,500kWh Step #2 Determine System Requirements (Grid-tied, Fixed tilt)
FY2017 SREC Registration Program (SRP) Final As-Built Technical Worksheet Instructions Page 1
 Final As-Built Technical Worksheet Instructions Page 1") If the SRP Registration was submitted in paper form, the Final As Built Packet must be submitted in paper. If the SRP Registration was submitted via the online portal, the Final As Built documents must
If the SRP Registration was submitted in paper form, the Final As Built Packet must be submitted in paper. If the SRP Registration was submitted via the online portal, the Final As Built documents must
Power Saver TM Program
 Power Saver TM Program COMMERCIAL SOLAR PHOTOVOLTAIC PERFORMANCE-BASED INCENTIVE PROGRAM GUIDELINES These guidelines govern the procedures and qualifications for incentives under the Austin Energy Commercial
Running the Electric Meter Backwards: Real-Life Experience with a Residential Solar Power System
 Running the Electric Meter Backwards: Real-Life Experience with a Residential Solar Power System Brooks Martner Lafayette, Colorado University of Toledo Spring 2013 PHYS 4400 - Principles and Varieties
APVI Solar Potential Tool Data and Calculations
 APVI Solar Potential Tool Data and Calculations J. K Copper and A. G Bruce (2014), School of Photovoltaic and Renewable Energy Engineering, University of New South Wales. The APVI Solar Potential Tool
Performance Parameters for Grid-Connected PV Systems
 Performance Parameters for Grid-Connected PV Systems B. Marion, 1 J. Adelstein, 1 K. Boyle, 1 H. Hayden, 2 B. Hammond, 2 T. Fletcher, 2 B. Canada, 2 D. Narang, 2 A. Kimber, 3 L. Mitchell, 3 G. Rich, 4
AR No. # - Install Photovoltaic Array
 AR No. # - Install Photovoltaic Array Recommendation Install a photovoltaic array on the building roof. This will provide an alternative energy production source for 2% of the facility's energy consumption
6KW Grid Interactive Photovoltaic System
 6KW Grid Interactive Photovoltaic System System Summary Provided by Ben Nelson Account Project: Nelson Residence Solar Garage Verdiseno, Inc., its subsidiaries, officers, directors, employees and its suppliers
Solar for Homeowners. Discover solar technologies for your home
 Solar for Homeowners Discover solar technologies for your home What We Do Information Resource & Expert Implementation Partner Energy Programs Technical Assistance Training & Education Areas of Expertise
Solar Photovoltaic Volumetric Incentive Program 2015 Report to the Legislative Assembly
 Solar Photovoltaic Volumetric Incentive Program 2015 Report to the Legislative Assembly Prepared by: Oregon Public Utility Commission January 1, 2015 Table of Contents Executive Summary... 2 Background...
Reference: Photovoltaic Systems, p. 229
 Sizing is the basis for PV system designs, and determines the ratings for the PV array and other major components needed to produce and deliver a certain amount of energy. Different principles apply to
Self Generation Incentive Program (SGIP) Jason Legner Sr. Program Manager
 Jason Legner Sr. Program Manager") 1 Self Generation Incentive Program (SGIP) Jason Legner Sr. Program Manager SGIP History Self Generation Incentive Program (SGIP) Statewide - California Public Utilities Commission (CPUC) incentive program
1 Self Generation Incentive Program (SGIP) Jason Legner Sr. Program Manager SGIP History Self Generation Incentive Program (SGIP) Statewide - California Public Utilities Commission (CPUC) incentive program
CALIFORNIA ENERGY COMMISSION NEW SOLAR HOMES PARTNERSHIP THIRD EDITION GUIDEBOOK APRIL 2010 CEC CMF-REV1. Arnold Schwarzenegger, Governor
 CALIFORNIA ENERGY COMMISSION NEW SOLAR HOMES PARTNERSHIP THIRD EDITION GUIDEBOOK APRIL 2010 CEC-300-2010-001-CMF-REV1 Arnold Schwarzenegger, Governor CALIFORNIA ENERGY COMMISSION Karen Douglas Chairman
Colorado Energy Masters: Solar Energy. Kurt M. Jones County Extension Director Chaffee County
 Colorado Energy Masters: Solar Energy Kurt M. Jones County Extension Director Chaffee County Learning Objectives Evaluating the Solar Resource Technical feasibility, permitting & zoning considerations
Compactness ratio : 1.2. Openings ratio : 26% (thermic envelope / inhabitable area) Smaller is better 1.9 = bad < 0.8 = good
 Smaller is better 1.9 = bad < 0.8 = good") ENERGIZED CANOPY Compactness ratio : 1.2 (thermic envelope / inhabitable area) Smaller is better 1.9 = bad < 0.8 = good A good compactness ratio lets to need less material and energy to build the buildings
ENERGIZED CANOPY Compactness ratio : 1.2 (thermic envelope / inhabitable area) Smaller is better 1.9 = bad < 0.8 = good A good compactness ratio lets to need less material and energy to build the buildings
Basic technical information on solar PV. Welcome and introduction.
 Basic technical information on solar PV Welcome and introduction. 1 Agenda 1. Solar Thermal Systems 2. How Does Solar PV Work? 3. What are the Main Components of a PV System? 4. What are the Solar PV Mounting
Solar PV Site Assessment Report Form
 Solar PV Site Assessment Report Form Name of Consultant: Amy Taivalkoski Consultant contact information: ALT Energy W231 N7458 E. Stoneridge Ct. Sussex, WI 53089 262-246-0795 email ataivalkoski@wi.rr.com
ABSTRACT. Introduction
 A Real World Examination of PV System Design and Performance Allan Gregg 1, Terence Parker 1 and Ron Swenson 2, 1. United Solar Ovonic LLC, Auburn Hills, Michigan 48326, and 2. SolarQuest Santa Cruz, CA
solar photovoltaics (PV)
") Home electricity generation fact sheet 1 A guide to solar photovoltaics (PV) SevernWye energy advice Types of solar panels There are two main types of solar panels. Solar PV (photovoltaic) panels produce
Home electricity generation fact sheet 1 A guide to solar photovoltaics (PV) SevernWye energy advice Types of solar panels There are two main types of solar panels. Solar PV (photovoltaic) panels produce
Energy Centre s Auckland solar power online tool documentation
 Energy Centre s Auckland solar power online tool documentation Kiti Suomalainen a, Vincent Wang b, Basil Sharp a a Energy Centre, University of Auckland, Auckland, New Zealand b Department of Geography,
PARTICIPANT HANDBOOK
 2013-2014 PARTICIPANT HANDBOOK POLICIES AND PROCEDURES FOR PARTICIPATION IN THE STATEWIDE SAVINGS BY DESIGN PROGRAM Last Revised: January 15, 2014 www.savingsbydesign.com This program is funded by California
SOLARPVSYSTEM INFORMATIONPACK FIT PROGRAM
 SOLARPVSYSTEM INFORMATIONPACK FIT PROGRAM (Thailand, July 2013) The Thai government has recently introduced a generous subsidy scheme involving Feed in Tariffs. This means that you get paid a premium rate
IX. ADDITION OF SOLYNDRA SOLAR PANELS (ELECTRICAL BREADTH)
") IX. ADDITION OF SOLYNDRA SOLAR PANELS (ELECTRICAL BREADTH) BACKGROUND Carderock Springs Elementary is striving to achieve a LEED Silver rating from the USGBC. The school s design is part of the Montgomery
IX. ADDITION OF SOLYNDRA SOLAR PANELS (ELECTRICAL BREADTH) BACKGROUND Carderock Springs Elementary is striving to achieve a LEED Silver rating from the USGBC. The school s design is part of the Montgomery
2017 PARTICIPANT HANDBOOK
 2017 PARTICIPANT HANDBOOK POLICIES AND PROCEDURES FOR PARTICIPATION IN THE STATEWIDE SAVINGS BY DESIGN PROGRAM Last Revised: January 20, 2017 www.savingsbydesign.com This program is funded by California
Solar Energy 101 What You Need to Know to Go Solar
 Solar Energy 101 What You Need to Know to Go Solar Cathy Redson Sarah Raymer SolPowerPeople, Inc. October 6, 2012 The data, analysis, views, and commentary that follow have been provided by the presenter
Welcome to Speeding Up Your California Solar Initiative Application Form
 10.08.09 Welcome to Speeding Up Your California Solar Initiative Application Form We will be starting the webinar momentarily Thank you for your patience To download today s presentation, please visit
PREPARED DIRECT TESTIMONY OF JAMES P. AVERY CHAPTER 1 ON BEHALF OF SAN DIEGO GAS & ELECTRIC COMPANY
 Application of SAN DIEGO GAS & ELECTRIC COMPANY (U 0 E) For Authority To Implement Optional Pilot Program To Increase Customer Access To Solar Generated Electricity Application 1-01- Exhibit No.: PREPARED
Renewable Energy PV INSTALLER Job Training Guide SCHOOL VERSION
 Renewable Energy PV INSTALLER Job Training Guide SCHOOL VERSION Good science, good engineering, good technology and good business practices delivered by ethical, well-trained, and motivated people will
BURBANK FIRE DEPARTMENT 311 East Orange Grove Avenue, Burbank CA Fax
 BURBANK FIRE DEPARTMENT 311 East Orange Grove Avenue, Burbank CA 91502 818 238 3473 Fax 818 238 3479 SOLAR PHOTOVOLTAIC INSTALLATION GUIDELINES BASED ON THE CSFM PV GUIDELINES (REVISED APRIL 2017) The
WEATHER-ADJUSTED PERFORMANCE GUARANTEES
 WEATHER-ADJUSTED PERFORMANCE GUARANTEES Matt Hollingsworth Clean Power Research Napa, CA 94559 matthol@cleanpower.com Jeff Ressler Clean Power Research Napa, CA 94559 jressler@cleanpower.com Richard Perez
BILLION POWER. Your one stop Supplier for all kinds of Solar Modules and BOS. Scan this quickmark,to visit our website.
 BILLION POWER Your one stop Supplier for all kinds of Solar Modules and BOS. BAODI NG BILLION POWER TECHNOLOGY CO.,LTD Website:www.billionpower.cn Email: info@billionpower.cn Scan this quickmark,to visit
Performance Characterization of Cadmium Telluride Modules Validated by Utility-Scale and Test Systems
 Performance Characterization of Cadmium Telluride Modules Validated by Utility-Scale and Test Systems Lauren Ngan 1, Nicholas Strevel 1, Kendra Passow 1, Alex F. Panchula 1, Dirk Jordan 2 1 First Solar,
SOLAR PV Oier Aranzabal LH Usurbil May 2012
 SOLAR PV Oier Aranzabal LH Usurbil May 2012 Almeria s PSA photos and web page. Solar power can create thousands of jobs! In 2010, the European PV industry directly employed over 150,000 people. 3.5
Conservation of Energy by Installing Solar PV System
 Conservation of Energy by Installing Solar PV System Abhishek R 1, Dilip Kumar M 2, Vivek S 3 1Assistant Professor Department of Civil engineering, JSS Academy of Technical Education, Karnataka, India
SOLAR PHOTOVOLTAIC ASI GLASS E. ASI Glass. Integrated Architecture Powered by the Sun
 SOLAR PHOTOVOLTAIC ASI GLASS E Integrated Architecture Powered by the Sun BIPV Building Integrated Photovoltaics with All the benefits of glass plus integrated solar power Whether a facade or a roof, today
Solar Project Yield Assessment. Workshop on Solar Power Project Development, Sept 20-21, 2012
 Solar Project Yield Assessment Workshop on Solar Power Project Development, Sept 20-21, 2012 Firstgreen Consulting Pvt Ltd. B 1202 Millennium Plaza, Sec 27 Gurgaon 122002 1 Solar Radiation Components 2
Switch Solar. Praveen Raj. [20 KWp Solar Power Plant Technical Proposal] Noble Hospital Chennai, Tamil Nadu.
![Switch Solar. Praveen Raj. [20 KWp Solar Power Plant Technical Proposal] Noble Hospital Chennai, Tamil Nadu.](/thumbs/74/69811773.jpg "Switch Solar. Praveen Raj. [20 KWp Solar Power Plant Technical Proposal] Noble Hospital Chennai, Tamil Nadu.") 2013 Switch Solar Praveen Raj [20 KWp Solar Power Plant Technical Proposal] Noble Hospital Chennai, Tamil Nadu. Contents 20KW Solar Power Plant Technical Proposal Technical Proposal...1 Section A - Bill
2013 Switch Solar Praveen Raj [20 KWp Solar Power Plant Technical Proposal] Noble Hospital Chennai, Tamil Nadu. Contents 20KW Solar Power Plant Technical Proposal Technical Proposal...1 Section A - Bill
SCE Distributed Energy Resource Interconnection Map (DERiM)
") SCE Distributed Energy Resource Interconnection Map (DERiM) s Southern California Edison s Distributed Energy Resource Interconnection Map aims to connect developers with the SCE system data needed to
SCE Distributed Energy Resource Interconnection Map (DERiM) s Southern California Edison s Distributed Energy Resource Interconnection Map aims to connect developers with the SCE system data needed to
Product Portfolio 2016 v2. Trace the sun Capture the benefit
 Product Portfolio 2016 v2 Trace the sun Capture the benefit Renewable Energy Solutions High quality Tracking and Racking systems FTA-120 Utility Scale Racking System PST-1AX6 Single Axis Tracker PST-2AL
June 29, 2012 Version 2.0
 SREC Registration Program (SRP) Guidebook Version 2.0 Table of Contents DEFINITIONS... 5 1) OVERVIEW OF THE SREC REGISTRATION PROGRAM (SRP)... 8 1A) Purpose... 8 1B) Program Description... 8 1C) Eligibility
2012 SGIP Impact Evaluation and Program Outlook
 2012 SGIP Impact Evaluation and Program Outlook Submitted to: PG&E and The SGIP Working Group Prepared by: 330 Madson Pl Davis, CA 95618 Feb 2014 TABLE OF CONTENTS TABLE OF CONTENTS... i LIST OF FIGURES...
AR No. # - Solar Thermal
 AR No. # - Solar Thermal Recommendation We recommend installing a solar thermal array on the building roof. This will provide an alternative source for 10% of the facilities energy consumption and reduce
Architectural Integration of Solar PV into Building Design
 Architectural Integration of Solar PV into Building Design 1 Agenda 1. New Construction is the Best Time for PV 2. Design Considerations to Maximize Solar Potential 3. Lousy Design Decisions 4. Architectural
AR No. # Solar Thermal. Assessment Recommendation Savings Summary Source. Cost Savings Natural Gas. $984 * 1 MMBtu = 1,000,000 Btu
 AR No. # Solar Thermal Recommendation We recommend installing a solar thermal array on the building roof. This will provide an alternative source for 9.8% of the facilities energy consumption and reduce
The Competitive Cost Position of Thin Film Module Technologies In High Temperature and Low Light Conditions
 The Competitive Cost Position of Thin Film Module Technologies In High Temperature and Low Light Conditions IBIS Associates, Inc. is a management consulting company that specializes in assisting clients
Solar Cell Optimization: Cutting Costs and Driving Performance
 Solar Cell Optimization: Cutting Costs and Driving Performance 1 Executive Summary Over the past several years, DC optimizers have become an important technological ingredient in many residential, commercial
UTILITY-SCALE PHOTOVOLTAIC CONCENTRATORS
 1.0 System Description UTILITY-SCALE PHOTOVOLTAIC CONCENTRATORS Figure 1. Grid-connected photovoltaic concentrator system schematic. Photovoltaic concentrator systems use optical concentrators to focus
KANE COUNTY ENERGY AND ENVIRONMENTAL COMMITTEE THURSDAY, SEPTEMBER 11, County Board Room Agenda 9:00 AM
 KANE COUNTY ENERGY AND ENVIRONMENTAL COMMITTEE THURSDAY, SEPTEMBER 11, 2014 County Board Room Agenda 9:00 AM Kane County Government Center, 719 S. Batavia Ave., Bldg. A, Geneva, IL 60134 1. Call to Order
OAKLAND UNIFIED SCHOOL DISTRICT (OUSD) Chapter 5. Solar Photovoltaic Technology Overview
 Chapter 5. Solar Photovoltaic Technology Overview") OAKLAND UNIFIED SCHOOL DISTRICT (OUSD) Chapter 5 Solar Photovoltaic Technology Overview Chapter Five Solar Photovoltaic Technology Overview This chapter provides a basic overview of how a solar photovoltaic
OAKLAND UNIFIED SCHOOL DISTRICT (OUSD) Chapter 5 Solar Photovoltaic Technology Overview Chapter Five Solar Photovoltaic Technology Overview This chapter provides a basic overview of how a solar photovoltaic
ROOFTOP SOLAR PV December 2017
 IRENA COST AND COMPETITIVENESS INDICATORS ROOFTOP SOLAR PV December 07 Copyright IRENA 07 Unless otherwise stated, material in this publication may be freely used, shared, copied, reproduced, printed and/or
future-proof energy with photovoltaic systems
 future-proof energy with photovoltaic systems DESIGN STRATEGIES SOLAR PANELS FOR ON-SITE ENERGY PHOTOVOLTAIC SYSTEMS The direct conversion of sunlight into electricity with solar cells connected in a series
Solar PV design considerations ENERGY USE. How much energy will this building use?
 Solar PV design considerations ENERGY USE How much energy will this building use? Photo credit: Autodesk Most modeling software's now include energy simulation. The software will not only calculate the
Elmwood Golf Course Solar PV Initial Feasibility Study
 Elmwood Golf Course Solar PV Prepared by: SAC Consulting Contact: Email: Fiona Salter fiona.salter@sac.co.uk Phone: 0131 603 7513 Date: 27 th August 2015 1 Contents 1 Contents... 1 2 Introduction... 1
Photovoltaic Energy Systems A Feasibility Study
 Photovoltaic Energy Systems A Feasibility Study William Nichols Georgia Southern University wtn918@gmail.com Dr. Youakim Kalaani Georgia Southern University yalkalaani@georgiasouthern.edu Paper 105, ENG
Net Energy Metering Aggregation (NEM-A) Welcome Guide
 Welcome Guide") Net Metering Aggregation (NEM-A) Welcome Guide Table of Contents Key Definitions...2 Basics...3 How the Generation Credit Allocation Methodology Works...4 NEM Aggregation Customer Billing Spreadsheet...4
Net Metering Aggregation (NEM-A) Welcome Guide Table of Contents Key Definitions...2 Basics...3 How the Generation Credit Allocation Methodology Works...4 NEM Aggregation Customer Billing Spreadsheet...4
ENERGY YIELD MODELLING OF PV SYSTEMS OPERATING IN NAMIBIAN CONDITIONS
 SASEC2015 Third Southern African Solar Energy Conference 11 13 May 2015 Kruger National Park, South Africa ENERGY YIELD MODELLING OF PV SYSTEMS OPERATING IN NAMIBIAN CONDITIONS P. Dobreva* 1,2, E. E. van
Part 1 Introduction and Overview
 Part 1 Introduction and Overview A. Applicability: This Application for Customer Generation Cost Responsibility Surcharge (CRS) Tariff Exemptions (Application) is for the purpose of requesting an exemption
Solar Pathways to Lower Cost
 Solar Pathways to Lower Cost June, 2006 Herb Hayden Pinnacle West Capital Corporation Parent company to Arizona Public Service 1 Carol Spring Mountain Telecom Remote Solar Electric Service Home APS Experience
Measuring Soiling Losses at Utility-scale PV Power Plants
 Measuring Soiling Losses at Utility-scale PV Power Plants Michael Gostein, J. Riley Caron 2, Bodo Littmann 2 Atonometrics, 8900 Shoal Creek Blvd., Suite 6, Austin, TX 78757, USA 2 First Solar, 5 Main St.,
AORC Technical meeting 2014
 http : //www.cigre.org C5-1036 AORC Technical meeting 2014 Solar PV Rooftop System Connection to MEA s Distribution Network: Technic and Economic Aspects Tosak Thasananutariya Metropolitan Electricity
Summary of Net Metered Projects as of June 30, Small Net Metered Projects as of 6/30/2016 Small Group Host Projects as of 6/30/2016
 Page 1 of 6 Summary of Net Metered Projects as of June 30, 2016 Small Net Metered Projects as of 6/30/2016 Small Group Host Projects as of 6/30/2016 Class # of Projects Capacity (kw) Annual Energy (kwh)
Roof mounted solar panels on Bldg L, Verde Valley Campus. 1. One developed Acre can produce approx 100 KW of peak solar power.
 SOLAR OPPORTUNITIES Roof mounted solar panels on Bldg L, Verde Valley Campus There is a growing national commitment to the utilization of sustainable energy sources. Solar, wind, and bio- mass systems
The ESP Handbook. Chapter 15 Obtaining Consumer Usage and Metering Information. Version 7.0 February 1, 2017
 The ESP Handbook Chapter 15 Obtaining Consumer Usage and Metering Information Version 7.0 February 1, 2017 SCE is committed to providing timely and accurate information to its customers or their authorized
PV Module Power Rating: Tolerance
 PV Module Power Rating: Tolerance Alex Mikonowicz, PowerMark Mani G. TamizhMani, Arizona State University Gobind Atmaram, Florida Solar Energy Center Solar ABCs PV Stakeholder Meeting October 15, 2010
Installing a Solar Power System on a Residential House Engineering and Financial Analysis Amal Kabalan, LEED A.P. Consulting Engineer
 MDCSystems Providing Expert Solutions for Projects Worldwide May 2009 Installing a Solar Power System on a Residential House Engineering and Financial Analysis Amal Kabalan, LEED A.P. Consulting Engineer
Impact Evaluation of Upstream HVAC Programs (HVAC1)
") Impact Evaluation of 2013-14 Upstream HVAC Programs (HVAC1) California Public Utilities Commission Date: CALMAC Study ID [Fill In here] LEGAL NOTICE This report was prepared under the auspices of the California
Impact Evaluation of 2013-14 Upstream HVAC Programs (HVAC1) California Public Utilities Commission Date: CALMAC Study ID [Fill In here] LEGAL NOTICE This report was prepared under the auspices of the California
Solar Photovoltaic (PV) Program Testimony
 Program Testimony") Application No: A.0-0-01 Exhibit No. SCE-1, Rev.1, 0/1/0 Witnesses: R. Fisher P. Hunt D. Klun M. Nelson R. Perez G. Rodrigues D. Snow (U -E) Solar Photovoltaic (PV) Program Testimony Before the Public
Application No: A.0-0-01 Exhibit No. SCE-1, Rev.1, 0/1/0 Witnesses: R. Fisher P. Hunt D. Klun M. Nelson R. Perez G. Rodrigues D. Snow (U -E) Solar Photovoltaic (PV) Program Testimony Before the Public
FLORIDA PHOTOVOLTAIC BUILDINGS PROGRAM
 FLORIDA PHOTOVOLTAIC BUILDINGS PROGRAM Mounting Methods for Rooftop Photovoltaic Arrays Shingle, Tile, and Metal Roofing Systems Florida Solar Energy Center 1679 Clearlake Road Cocoa, Florida 32922 February
Solar Power Overview. REROC Off the Grid - 14 November 2013 Edwin Foong GM Business Development, SOLEIR
 Solar Power Overview REROC Off the Grid - 14 November 2013 Edwin Foong GM Business Development, SOLEIR Types of Solar Power Heat Solar Thermal High Temperature Utility scale power plant Low Temperature
HEED Validation Reports
 HEED Validation Reports HEED 4.0, Build 27 and Build 29 October 2012 Prepared for: UCLA Department of Architecture and Urban Design Professor Murray Milne Prepared by: Alicyn Henkhaus, EIT Table of Contents
CPUC Self-Generation Incentive Program Fifth Year Impact Evaluation Final Report
 CPUC Self-Generation Incentive Program Fifth Year Impact Evaluation Final Report Submitted to: PG&E and The Self-Generation Incentive Program Working Group Prepared by: Itron, Inc. 601 Officers Row Vancouver,
City of Santa Monica Building and Safety Division Submittal Requirements Expedited Solar Photovoltaic (10 kw or Less)
") City of Santa Monica Building and Safety Division Submittal Requirements Expedited Solar Photovoltaic (10 kw or Less) Permits for One- and Two-Family Dwellings This following information is to guide applicants
City of Santa Monica Building and Safety Division Submittal Requirements Expedited Solar Photovoltaic (10 kw or Less) Permits for One- and Two-Family Dwellings This following information is to guide applicants
13-PV System Design. ECEGR 452 Renewable Energy Systems
 13-PV System Design ECEGR 452 Renewable Energy Systems Design Example Overview Other PV Considerations Dr. Louie 2 Stand Alone PV System Design Consider a simple design approach Part art, part science
Renewable Energy Update. Sustainability/Energy Committee April 22, 2014
 Renewable Energy Update Sustainability/Energy Committee April 22, 2014 Overview In-conduit hydro projects Photovoltaic projects Next steps Briones In-Conduit Hydro Capture energy from water released from
APPLICATION FOR SOLAR PERMIT
 APPLICATION FOR SOLAR PERMIT Permit Application Application Checklist o New York State Unified Solar Permit Application for Roof Mounted Systems 12kW or less. (Includes Electrical Permit Application) o
SOLAR PV STC ASSIGNMENT FORM
 Company / Agent / Installer Logo SOLAR PV STC ASSIGNMENT FORM MANDATORY FORM FIELDS 1 OWNER S DETAILS First Surname: Postal Address: State Postcode Telephone: (w) (h) Fax: (w) (h) Mobile: Email: 2 INSTALLATION
Digging Deeper SOLAR ENERGY. Forms of Solar Energy
 a) Is the wind speed the same in the morning; the afternoon; the evening? b) Move your anemometer to another location. Is it windier in other places? c) Do trees or buildings block the wind? 7. Back in
Introduction to Skylighting in equest Quick Energy Simulation Tool
 Introduction to Skylighting in equest Quick Energy Simulation Tool an energydesignresources.com Skylighting Design Tutorial Why Consider Skylights? 2 Inexpensive method of bringing daylight into the core
PV REBATE SCHEME 1 Application Form: COMMERCIAL
 GOV-UNDP GEF PV PROJECT PV REBATE SCHEME For Commercial Sector 1. Fill in the applicant information, general information and details of PV System. Incomplete applications and missing documentation will
PG&E Energy Data for Local Governments Training Webinar
 1 PG&E Energy Data for Local Governments Training Webinar December 2015 Safety Message 2 Today s Webinar 3 Welcome (5 Minutes) Part 1: IOU Energy Data Request Program Overview (15 Minutes) Q&A (10 Minutes)
Contents. What is a solar water pump? 3-4. Smart Solar Water 5-6. Small Centrifugal Pump Systems 7. MPPT Diaphragm Pump Systems 8
 Solar Water Systems Contents Pages What is a solar water pump? 3-4 Smart Solar Water 5-6 Small Centrifugal Pump Systems 7 MPPT Diaphragm Pump Systems 8 Large Centrifugal Pump Systems 9 Pump Price List
Installation Best Practices
 February 2012 Installation Best Practices America s largest solar manufacturer since 1975 Table of Contents Purpose 4 Scope 4 Distribution list 4 Terms 5 PV 101 6 Basics of electricity 6 Series and Parallel
EXAMPLE TARIFF MID-SIZE COMMERCIAL
 SOLAR PV EXAMPLE TARIFF MID-SIZE COMMERCIAL CONTENTS 1 Contents 2 Introduction 3 Examples 4 Important 5 How to proceed Approved Installer Telephone 01843 855 019 1 INTRODUCTION A LITTLE ABOUT TARIFFS The
Nishi Gateway Project Zero Net Energy (ZNE) Feasibility Study Task 2D - Technical Memo
 Feasibility Study Task 2D - Technical Memo") Nishi Gateway Project Zero Net Energy (ZNE) Feasibility Study Task 2D - Technical Memo Prepared for: Prepared by: City of Davis & Ascent Environmental Report Issued: June 30, 2015 Davis Energy Group, Inc.
Nishi Gateway Project Zero Net Energy (ZNE) Feasibility Study Task 2D - Technical Memo Prepared for: Prepared by: City of Davis & Ascent Environmental Report Issued: June 30, 2015 Davis Energy Group, Inc.
Advanced Solar Thermal (AST) SOLID Energy, Inc.
 SOLID Energy, Inc.") Advanced Solar Thermal (AST) 1 What is AST AST includes Mechanical Systems that use Solar Thermal Energy for the Following Type of On-Site Customer Loads: 1. Space Cooling 2. Space Heating 3. Process Heating
Advanced Solar Thermal (AST) 1 What is AST AST includes Mechanical Systems that use Solar Thermal Energy for the Following Type of On-Site Customer Loads: 1. Space Cooling 2. Space Heating 3. Process Heating
Solar and Wind Energy
 Jerry Hudgins Solar and Wind Energy Department of Electrical Engineering 1 Average Irradiation Data (Annual) from Solarex. The units on the map are in kwh/m 2 /day and represent the minimum case values
RENEWABLE ENERGY DEVELOPMENT STATE TAX POLICIES AND INCENTIVES IMPACTING
 RENEWABLE ENERGY DEVELOPMENT STATE TAX POLICIES AND INCENTIVES IMPACTING RENEWABLE ENERGY DEVELOPMENT PREPARED BY THE NATIONAL CONFERENCE OF STATE LEGISLATURES MARCH 2012 WASHINGTON Contents State Taxes
Renewables Portfolio Standards in the United States: A Status Update
 Renewables Portfolio Standards in the United States: A Status Update Galen Barbose Lawrence Berkeley National Laboratory Renewable Energy Markets 214 December 4, 214 This analysis was funded by the National
Software tool for evaluation of electrical energy produced by photovoltaic systems
 Software tool for evaluation of electrical energy produced by photovoltaic systems Goran Dobric, Željko Durišic and Zlatan Stojkovic Faculty of Electrical Engineering, University of Belgrade, Belgrade,
The National Academy of Sciences
 The National Academy of Sciences Making Big Solar Work: Achievements, Challenges and Opportunities U.S. State Solar Policy Trends: New State Initiatives Lew Milford, President Clean Energy Group Clean
Town of Wilton Building Department
 Town of Wilton Building Department Permitting hours 7:30-12:00 (unless otherwise posted) Tel: 203-563-0177 REQUIREMENTS FOR A SOLAR PHOTOVOLTAIC PERMIT Completed and signed Minor Solar Permit Application
Code Requirements for Solar Photovoltaic (PV) Systems for One and Two-Family Dwellings
 Systems for One and Two-Family Dwellings") 5 Part RESOURCES AND INFORMATION Understanding the Code Code Requirements for Solar Photovoltaic (PV) Systems for One and Two-Family Dwellings Based on the 2013 California Building Code (CBC), the 2013
5 Part RESOURCES AND INFORMATION Understanding the Code Code Requirements for Solar Photovoltaic (PV) Systems for One and Two-Family Dwellings Based on the 2013 California Building Code (CBC), the 2013
MARKET PRICES FOR SOLAR ELECTRICITY IN ONTARIO
 Montreal, 2-24, 24 MARKET PRICES FOR SOLAR ELECTRICITY IN ONTARIO Ian H. Rowlands Faculty of Environmental Studies University of Waterloo Email: irowland@fes.uwaterloo.ca Tel: (519) 888-4567, ext. 2574
Minimum Technical Requirements for the Renewable Energy Fund. Solar Photovoltaic (PV)
") Minimum Technical Requirements for the Renewable Energy Fund All Rhode Island Renewable Energy Fund projects must demonstrate compliance with the Minimum Technical Requirements set forth in this document.
Minimum Technical Requirements for the Renewable Energy Fund All Rhode Island Renewable Energy Fund projects must demonstrate compliance with the Minimum Technical Requirements set forth in this document.
What is a solar water pump? 3-4. Smart Solar Water 5-6. Small Centrifugal Pump Systems 7. MPPT Diaphragm Pump Systems 8
 Solar Water Systems Contents Pages What is a solar water pump? 3-4 Smart Solar Water 5-6 Small Centrifugal Pump Systems 7 MPPT Diaphragm Pump Systems 8 Large Centrifugal Pump Systems 9 Pump Price List
Demystifying Rooftop Solar
 Demystifying Rooftop Solar Week 4 : Economics OLLI at Illinois Study Group Fall 2017 1:30 pm Tuesdays Blue Room Proposed Session Outline 1. Overview of solar power in general. How PV works with demos.
SCE Background PG&E LADWP SDG&E
 SCE Background PG&E LADWP SDG&E One of the nation s largest electric utilities Nearly 14 million residents in service territory Approximately 5 million customer accounts 50,000 square-mile service area
THERMAL ANALYSIS OF A FACADE-MOUNTED PV ARRAY
 SESCI 23 CONFERENCE Queen's University Kingston, Ontario, Canada August 18 to 2, 23 THERMAL ANALYSIS OF A FACADE-MOUNTED PV ARRAY S. J. Harrison 1, A. Driesse 2, Q. Lin 1 1 Queen's University, Solar Calorimetry
Advanced Energy Community Oak View, Huntington Beach, CA Sustain OC 8 th Annual conference & Expo
 Advanced Energy Community Oak View, Huntington Beach, CA Sustain OC 8 th Annual conference & Expo Advanced Energy Community (AEC) Award Huntington Beach Advanced Energy Community A Scalable, Replicable,