Naughton Power Plant. Chapter 6, Section 2 Construction Permit Application. Submitted to the Wyoming Air Quality Division And Prepared by
|
|
|
- Bathsheba Scott
- 6 years ago
- Views:
Transcription
1 Naughton Power Plant Chapter 6, Section 2 Construction Permit Application Submitted to the Wyoming Air Quality Division And Prepared by 1407 West North Temple Salt Lake City, Utah March 2008
2 1.0 Introduction PacifiCorp Energy proposes to add new air pollution control devices that will significantly lower unit-specific emissions for particulate matter (PM 10 ), sulfur dioxide (SO 2 ) and nitrogen oxides (NO X ) at the Naughton Power Plant located near Kemmerer, in Lincoln County, Wyoming. The installation of this pollution control equipment, along with planned maintenance activities including a Unit 3 turbine upgrade in 2014, requires an analysis of the air quality impacts of the projects and submittal of this construction permit application to the Wyoming Air Quality Division. Through this application, PacifiCorp Energy is seeking to: Obtain a Chapter 6, Section 2 construction permit for proposed Naughton Plant projects including the installation of new pollution control devices. Establish plantwide applicability limits for nitrogen oxides (NO X ) and sulfur dioxide (SO 2 ). The plantwide applicability limits (PALs) will allow the facility to conduct ongoing plant maintenance while ensuring the facility remains in compliance with New Source Review requirements. The requested PALs include: o Establishing a NO X PAL of 15,140 tons/year at issuance of the construction permit. o Establishing a NO X PAL of 11,104.7 tons/year following completion of the Unit 1 and Unit 2 low-no X projects. o Establishing an SO 2 PAL of 8,924.1 tons/year following completion of the Unit 1 and Unit 2 flue gas desulfurization systems (SO 2 scrubbers). Obtain lower particulate matter emission rate limits for Units 1, 2 and 3. The requested PM 10 limits include: o Establishment of a Unit 1 PM 10 limit of 78 lb/hour following installation of the Unit 1 flue gas conditioning system. o Establishment of a Unit 2 PM 10 limit of 130 lb/hour following installation of the Unit 2 flue gas conditioning system. o Establishment of a Unit 3 PM 10 limit of 56 lb/hour following installation of the Unit 3 fabric filter baghouse. 1
3 Obtain lower NO X emission rate limits for Units 1, and 2. The requested NO X limits include: o Establishment of a Unit 1 NO X limit of 0.26 lb/mmbtu on a 12-month rolling average following installation of the Unit 1 low-no X system. o Establishment of a Unit 2 NO X limit of 0.26 lb/mmbtu on a 12-month rolling average following installation of the Unit 2 low-no X system. Obtain lower SO 2 emission rate limits for Units 1 and 2. The requested SO 2 limits include: o Establishment of a Unit 1 SO 2 limit of 0.15 lb/mmbtu on a 12-month rolling average following installation of the Unit 1 scrubber. o Establishment of a Unit 1 SO 2 limit of 833 lb/hour (0.45 lb/mmbtu x 1,850 MM/hour) on a fixed 3-hour average basis following installation of the Unit 1 scrubber. o Establishment of a Unit 2 SO 2 limit of 0.15 lb/mmbtu on a 12-month rolling average following installation of the Unit 2 scrubber. o Establishment of a Unit 2 SO 2 limit of 1,080 lb/hour (0.45 lb/mmbtu x 2,400 MMBtu/hour) on a fixed 3-hour average basis following installation of the Unit 2 scrubber. Because the installation of the Unit 1 and Unit 2 low-no X control systems may increase emissions of carbon monoxide, and because the emissions evaluation indicates that the future potential CO emissions increase is above the PSD significance threshold of 100 tons/year, PacifiCorp requests that CO limits be established for Naughton Units 1 and 2. The requested limits are based on carbon monoxide emission rates utilizing good combustion control methods on Unit 1 and Unit 2 following the low-no X control system installations. The requested carbon monoxide limits include: o Establishment of a Unit 1 CO limit of 0.25 lb/mmbtu, 463 lb/hour, on a 30-day rolling average following completion of the Unit 1 low-no X control project. o Establishment of a Unit 2 CO limit of 0.25 lb/mmbtu, 600 lb/hour, on a 30-day rolling average following completion of the Unit 2 low-no X control project. Because the installation of the Unit 1 and Unit 2 flue gas conditioning systems and corresponding injection of sulfur trioxide (SO 3 ) may increase emissions of sulfuric acid (H 2 SO 4 ), PacifiCorp requests that the following limits be implemented following completion of the flue gas conditioning system installations: o Establishment of a Unit 1 SO 3 injection rate limit of 8 ppm. o Establishment of a Unit 2 SO 3 injection rate limit of 8 ppm. 2
4 The planned Naughton pollution control equipment projects are identified in the following table: Table 1.0: Naughton Pollution Control Equipment Projects Unit 1 Unit 2 Unit 3 Installation of a flue gas desulfurization system (scrubber) Installation of a flue gas conditioning system Installation of a low-no X control system Installation of a flue gas desulfurization system (scrubber) Installation of a flue gas conditioning system Installation of a low-no X control system Installation of a fabric filter baghouse to replace an electrostatic precipitator Retirement of the flue gas conditioning system following construction of the baghouse 1.1 Existing Operations PacifiCorp owns and operates the Naughton Power Plant which consists of one 160 net MW (nominal), one 210 net MW (nominal) and one 330 net MW (nominal) coal-fired electric generating units designated as Units 1, 2, and 3 respectively. Unit 1 went into commercial operation in 1963, Unit 2 in 1968, and Unit 3 in The Naughton Power Plant is an existing major stationary source of air emissions under both the New Source Review and Title V programs. Unit 1 has a maximum boiler heat input rate of 1,850 MMBtu/hour, Unit 2 has a maximum boiler heat input rate of 2,400 MMBtu/hour and Unit 3 has a maximum boiler heat input rate of 3,700 MMBtu/hour. 1.2 Emissions Analysis The emission control projects proposed in this construction permit application include the installation of flue gas conditioning systems on Units 1 and 2; the installation of flue gas desulfurization SO 2 scrubbers on Units 1 and 2; the installation of low-no X control systems on Units 1 and 2; and the replacement of the existing Unit 3 electrostatic precipitator with a new fabric filter baghouse. These projects will result in improved particulate matter removal rates for Units 1, 2 and 3; reduced SO 2 emission rates for Units 1 and 2; and reduced NO X emission rates for Units 1 and 2. To establish a clear baseline for determining when PSD requirements may be triggered in the future, PacifiCorp is proposing to establish plantwide applicability limits for SO 2 and NO X that would limit plantwide emissions of these pollutants at the facility to the past actual baseline emissions as defined by the Environmental Protection Agency s (EPA) past actual to future actual emissions test. The plantwide applicability limits would be in addition to the new, lower unit-specific limits to be established as a result of adding the proposed air pollution control devices. Establishing plantwide limits for SO 2 and NO X will ensure that any proposed project will not cause an associated emissions increase of these specific pollutants. 3
5 1.3 Prevention of Significant Deterioration Review The Naughton Plant is located in an area classified as attainment for all criteria pollutants and is a listed PSD Source Category; therefore, the requirements of the federal PSD program, as administered by the Wyoming Department of Environmental Quality and the Wyoming Division of Air Quality will apply to the projects specified in this Chapter 6, Section 2 construction permit application. As a result of the PSD review described in more detail below, PacifiCorp has concluded that there will not be a significant net emissions increase as defined in 40 CFR Part 52 and WAQSR Chapter 6 Section 4 for SO 2, NO X, PM 10, lead, hydrogen fluoride, sulfuric acid, or VOCs; therefore, a BACT review for these pollutants will not be required. PacifiCorp has included a BACT review for carbon monoxide. 1.4 Compliance with National Ambient Air Quality Standards for Class I and Class II Areas and NSPS After completing the planned projects the Naughton Power Plant will meet all National Ambient Air Quality Standards (NAAQS) and the Class I and Class II PSD increments in the vicinity of the facility. A dispersion modeling analysis will be performed for CO which has the potential of a significant net emissions increase. At the request of the Wyoming Department of Environmental Quality a NAAQS impact analysis for all criteria pollutants will be performed including SO 2, NO X, HF, CO, PM 10 and lead at postpollution control equipment project emission rates. The facility will meet the applicable New Source Performance Standards (NSPS) defined in the federal regulations at 40 CFR 60 Subpart D and Wyoming Air Quality Standard and Regulations Chapter 5, Section Project Description PacifiCorp plans to install pollution control equipment and implement other plant projects between May 2008 and December 2014 as reflected in the project timeline shown in Table 2.1. These projects are listed in Appendices A through C. The projects identified are based on current plans and may be refined as overhaul schedules and equipment status change. Additional information will be provided to the Wyoming Division of Air Quality as PacifiCorp further refines the project schedule and scope. 4
6 The planned Naughton Plant projects are summarized as follows: Naughton Unit 1 Installation of a flue gas conditioning system Installation of a flue gas desulfurization system (SO 2 scrubber) Installation of a boiler low-no X control system Steam turbine overhaul Plant projects listed in Appendix A Naughton Unit 2 Installation of a flue gas conditioning system Installation of a flue gas desulfurization system (SO 2 scrubber) Installation of a boiler low-no X control system Steam turbine overhaul Plant projects listed in Appendix B Naughton Unit 3 Installation of a fabric filter baghouse to replace the existing electrostatic precipitator Retirement of the existing flue gas conditioning system Steam turbine upgrade (high pressure, intermediate pressure and low pressure stages) Plant projects listed in Appendix C Table 2.1 contained on the following page identifies the planned Naughton Power Plant project schedule from 2008 through Table 2.1 includes major plant maintenance projects as well as pollution control equipment installations. 5
7 Table 2.1: Naughton Project Schedule 2012 Naughton Unit 1 Outage: March 24 - May 19 steam turbine overhaul install boiler low-no X system install flue gas desulfurization system (SO 2 scrubber) January 1, 2008 January 1, 2009 January 1, 2010 January 1, 2011 January 1, 2012 January 1, 2013 January 1, 2014 January 1, 2015 April 1 October 1 April 1 October 1 April 1 October 1 April 1 October 1 April 1 October 1 April 1 October 1 April 1 October 1 July 1 July 1 July 1 July 1 July 1 July 1 July Naughton Unit 3 Outage: March 17 - April Naughton Unit 2 Outage: September 17 - November Naughton Unit 3 Outage: March 1 - April 14 steam turbine overhaul steam turbine overhaul install fabric filter baghouse cooling tower repairs install boiler low-no X system retire flue gas conditioning system replace/re-tube low-pressure feedwater heaters install flue gas desulfurization system (SO 2 scrubber) HP/IP/LP steam turbine upgrade Major 2008 Projects Install Unit 1 Flue Gas Conditioning System Install Unit 2 Flue Gas Conditioning System Major 2012 Projects Overhaul Unit 1 Steam Turbine Install Unit 1 Low-NO X System Install Unit 1 Flue Gas Desulfurization System (SO 2 Scrubber) Major 2009 Activities Major 2014 Projects Overhaul Unit 3 Steam Turbine Upgrade Unit 3 HP/IP/LP Steam Turbine Repair Unit 3 Cooling Tower Install Unit 3 Fabric Filter Baghouse (Replace Existing Electrostatic Precipitator) Replace or Re-Tube Low-Pressure Feedwater Heaters Retire Unit 3 Flue Gas Conditioning System Major 2011 Projects Overhaul Unit 2 Steam Turbine Install Unit 2 Low-NO X System Install Unit 2 Flue Gas Desulfurization System (SO 2 Scrubber) 6
8 3.0 List of Potential Air Emission Points and Air Contaminants Emissions Summary The Naughton Power Plant currently operates under Title V operating permit The operating permit has incorporated all applicable requirements contained in the following permits: MD-403, MD-867, MD-247, OP-122 and the April 9, 1998 Chapter 6, Section 2(k) permit waiver. The facility s Title V permit identifies the facility s emission points and potential air contaminants. There may be additional emission sources at the facility following the pollution control equipment installations, including scrubber reagent baghouses, etc. 4.0 Evaluation of Historic and Future Emission Rates 4.1 Project Description This section presents the method for conducting various PSD evaluations, including: A determination of baseline actual emissions for SO 2, NO X, PM 10, CO, ozone (as non-methane VOCs), fluoride (as hydrogen fluoride), lead, and sulfuric acid. A determination of projected actual emissions of SO 2, NO X, PM 10, CO, VOCs, fluorides, lead, and sulfuric acid. A comparison between the CO, PM, VOCs, fluorides, lead, and sulfuric acid past actual baselines and future potential emissions to determine if PSD significance levels are triggered. This section also sets forth the proposed plantwide applicability limits for SO 2 and NO X. The evaluation of historic (baseline) and future potential pollutant emission rates are contained in Appendix D of this permit application. 4.2 Baseline Actual Emissions The pollutants of interest for this review are SO 2, NO X, PM 10, CO, VOCs, fluorides, lead, and sulfuric acid Calculation of Baseline Actual Emissions 40 CFR 52.21(b)(48)(i) describes baseline actual emissions for the Naughton Power Plant as follows: 7
9 Baseline actual emissions means the rate of emissions, in tons per year, of a regulated NSR pollutant, as determined in accordance with paragraphs (b)(48)(i) through (iv) of this section. (i) For any existing electric utility steam generating unit, baseline actual emissions means the average rate, in tons per year, at which the unit actually emitted the pollutant during any consecutive 24-month period selected by the owner or operator within the 5-year period immediately preceding when the owner or operator begins actual construction of the project. The Administrator shall allow the use of a different time period upon a determination that it is more representative of normal source operation. (a) The average rate shall include fugitive emissions to the extent quantifiable, and emissions associated with startups, shutdowns, and malfunctions. (b) The average rate shall be adjusted downward to exclude any noncompliant emissions that occurred while the source was operating above any emission limitation that was legally enforceable during the consecutive 24-month period. (c) For a regulated NSR pollutant, when a project involves multiple emissions units, only one consecutive 24-month period must be used to determine the baseline actual emissions for the emissions units being changed. A different consecutive 24-month period can be used for each regulated NSR pollutant. (d) The average rate shall not be based on any consecutive 24-month period for which there is inadequate information for determining annual emissions, in tons per year, and for adjusting this amount if required by paragraph (b)(48)(i)(b) of this section. To identify and calculate baseline actual emissions, PacifiCorp has used data from the EPA Clean Markets Division s emissions database and annual emissions inventories. In order to comply with the EPA s acid rain program, PacifiCorp utilizes continuous emissions monitors (CEMs) to report hourly SO 2 and NO X emissions for each unit at the Naughton facility. CEMs are also used to obtain and report the hourly heat input rates into each unit s boiler. The hourly emissions and heat input data is submitted to the EPA on a quarterly basis and is readily available on the EPA s website located at For purposes of this review the 5-year evaluation period is from January 2003 through December The baseline actual emissions are summarized in Table
10 SO 2 Emissions Appendix D, Table NAU-1 identifies the monthly SO 2 emissions for the relevant time period. This data was obtained from the Environmental Protection Agency s (EPA) Acid Rain Emissions database for the Units 1-3 stack emissions and from the Naughton Plant s annual emissions inventory for non-stack emissions. The monthly data and emissions inventory data was used to calculate the maximum past actual annual plant SO 2 emission rate of 22,310.3 tons/year. Appendix D, Table NAU-1a identifies the maximum past actual annual Unit 3 emission rate of 6,070.7 tons/year. The Unit 3 maximum past actual SO 2 emission rate of 6,070.7 tons/year does not include any SO 2 emissions in excess of the applicable 2-hour limit of 0.5 lb/mmbtu during the 24-month evaluation period from February 2005 through January NO X Emissions Appendix D, Table NAU-3 identifies the monthly NO X emissions for the relevant time period. This data was obtained from the Environmental Protection Agency s (EPA) Acid Rain Emissions database for the Units 1-3 stack emissions and from the Naughton Plant s annual emissions inventory for non-stack emissions. The monthly data and emissions inventory data was used to calculate the maximum past actual annual plant NO X emission rate of 14,735.7 tons/year and the maximum past actual Unit 3 emission rate of 6,223.0 tons/year. Particulate Matter Emissions Appendix D, Table NAU-7 identifies the monthly PM 10 emissions for the relevant time period. The facility PM 10 emission rates are based on annual stack test data, in units of lb/mmbtu multiplied by the Unit-specific monthly boiler heat input values identified in the EPA s Acid Rain Emissions database to calculate the Units 1-3 stack emission rates. The Naughton Plant s annual emissions inventory database was used to identify the maximum non-stack emission rate. As indicated in Table NAU-7, the Naughton Plant had a maximum past actual 5-year PM 10 emission rate of 1,831.7 tons/year. Carbon Monoxide Carbon monoxide emissions for Units 1-3 have been determined by multiplying the past annual coal consumption (Appendix D, Table NAU-6) by the AP-42 emission factor for carbon monoxide emissions from coal fired boilers. The maximum non-stack carbon monoxide emission rates were obtained from the Naughton Plant s annual emissions inventory database. The maximum past actual total Naughton CO emission rate was tons/year. The result of the past actual CO emissions evaluation is contained in Appendix D, Table NAU-15. 9
11 Volatile Organic Compounds Volatile organic compound emissions for Units 1-3 have been determined by multiplying the past annual coal consumption (Appendix D, Table NAU-6) by the AP-42 emission factor for volatile organic compounds emissions from coal fired boilers. The maximum non-stack VOC emission rates were obtained from the Naughton Plant s annual emissions inventory database. The maximum past actual total Naughton Plant VOC emission rate was 83.3 tons/year. The result of the past actual VOC emissions evaluation is contained in Appendix D, Table NAU- 17. Lead Emissions Lead emissions have been determined from the average past annual lead concentrations in the coal burned, the average past annual coal ash concentrations, the annual particulate matter emission rates, the annual boiler heat input rates (Appendix D, Table NAU-5) and the Method specified in AP-42 for determining lead emissions from coal fired boilers. The maximum past actual total Units 1, 2 and 3 lead emission rate was 0.13 tons/year. The result of the past actual lead emissions evaluation is contained in Appendix D, Table NAU-13. Fluoride Emissions Fluoride emissions, as hydrogen fluoride, have been determined from the 5-year average annual fluorine concentrations contained in coal burned at the Naughton Plant and from the past actual annual coal burn rates as indicated in Table NAU- 6. The Electric Power Research Institute (EPRI) LARK-TRIPP method for the determination of hydrogen fluoride (HF) emissions was used to calculate the maximum past actual annual HF emission rate of 43.4 tons/year as indicted in Table NAU-9. Sulfuric Acid Emissions Sulfuric acid emissions are calculated using past actual annual coal sulfur concentrations, past actual annual heat input rates (NAU-5), a Unit 3 flue gas conditioning system SO 3 injection rate of 8 ppm, and Electric Power Research Institute s Estimating Total Sulfuric Acid Emissions from Stationary Power Plants, Technical Update, April 2007 method for calculating H 2 SO 4 emissions. The maximum past actual total Units 1, 2 and 3 sulfuric acid emission rate was 32.0 tons/year. The result of the past actual sulfuric acid emissions evaluation is contained in Appendix D, Table NAU
12 Table 4.2 indicates the annual past actual baseline emission rates for the Naughton Plant pollutants identified above. Table 4.2: Summary of Naughton Baseline (Past Actual) Emissions Naughton Units 1-3 Stack Emissions SO 2 tons/year NO X tons/year PM 10 tons/year HF tons/year H 2 SO 4 tons/year Lead tons/year CO tons/year VOC tons/year 22, , , Non-Stack Emissions Baseline Actual Emissions Unit 3 Stack Emissions 22, , , , , Projected Actual Emissions for Prevention of Significant Deterioration Pollutants The next step in the emission rate evaluation is to projected actual emission rates for each pollutant. This is accomplished by determining the projected actual emissions based on coal quality, unit utilization, addition of pollution controls and expected emission rates. Projected actual emissions are defined as follows: 40 CFR 52.21(b)(41)(i) Projected actual emissions means the maximum annual rate, in tons per year, at which an existing emissions unit is projected to emit a regulated NSR pollutant in any one of the 5 years (12-month period) following the date the unit resumes regular operation after the project, or in any one of the 10 years following that date, if the project involves increasing the emissions unit s design capacity or its potential to emit that regulated NSR pollutant and full utilization of the unit would result in a significant emissions increase or a significant net emissions increase at the major stationary source. (ii) In determining the projected actual emissions under paragraph (b)(41)(i) of this section (before beginning actual construction), the owner or operator of the major stationary source: (a) Shall consider all relevant information, including but not limited to, historical operational data, the company s own representations, the company s expected business activity and the company s highest projections of business activity, the company s filings with the State or Federal regulatory authorities, and compliance plans under the approved State Implementation Plan; and 1 Maximum past non-stack emissions from emissions inventories 11
13 (b) Shall include fugitive emissions to the extent quantifiable and emissions associated with startups, shutdowns, and malfunctions; and (c) Shall exclude, in calculating any increase in emissions that results from the particular project, that portion of the unit s emissions following the project that an existing unit could have accommodated during the consecutive 24-month period used to establish the baseline actual emissions under paragraph (b)(48) of this section and that are also unrelated to the particular project, including any increased utilization due to product demand growth; or (d) In lieu of using the method set out in paragraphs (a)(41)(ii)(a) through (c) of this section, may elect to use the emissions unit s potential to emit, in tons per year, as defined under paragraph (b)(4) of this section. PacifiCorp has proposed to accept plantwide applicability limits (PALs) for SO 2 and NO X which are based on the Naughton Plant s past actual baseline emission rates and on unitspecific future potential emission rates for Units 1 and 2 based on new, lower SO 2 and NO X emission limitations. With these caps in place there is no potential that future emissions will be greater than past actual emissions, and no additional evaluation of future emissions is required Calculation Projected Annual Emissions Under the provisions of 40 CFR 52.21(b)(41)(ii)(d) PacifiCorp has elected to determine the future emission rates of SO 2, NO X, PM 10, fluoride (as HF), sulfuric acid, lead, CO and VOCs based on the facility s potential to emit these pollutants. The future annual emission rates are based on applicable pollutant emission limitations at existing or requested future emission limits as well as on a maximum annual boiler operating time of 8,760 hours/year, a Unit 1 boiler heat input rate of 1,850 MMBtu/hour, a Unit 2 boiler heat input rate of 2,400 MMBtu/hour, and a Unit 3 boiler heat input rate of 3,700 MMBtu/hour. The facility s average 5-year unit-specific coal heating values, in units of Btu/lb are used to calculate the maximum annual unit-specific coal burn rates based on the unit-specific Units 1-3 boiler heat input rates as indicated above. Finally, where applicable, EPA AP-42 emission factors are used to calculate future potential pollutant emission rates. 12
14 Boiler Heat Input Unit-specific boiler heat input rates are used to calculate future potential emission rates at applicable pollutant emission limitations or, where appropriate, using EPA AP-42 emission factors. Other valid emission calculation methods, such as LARK-TRIPP was used to calculate HF and H 2 SO 4 emission rates. A review of the EPA s Clean Air Markets Acid Rain database was used to identify the Naughton Plant s unit-specific maximum boiler heat input rates for the 5-year evaluation period used for this construction permit application. An evaluation of the Acid Rain database indicates a maximum Unit 1 boiler heat input rate of 1,850 MMBtu/hour; a Unit 2 boiler heat input rate of 2,400 MMBtu/hour; and a Unit 3 boiler heat input rate of 3,700 MMBtu/hour. Coal Burn Boiler coal burn rates are used to calculate some future potential emission rates such as hydrogen fluoride and carbon monoxide using appropriate AP-42 emission factors. Maximum future potential coal burn rates were calculated based on the 5-year average unit-specific coal heating content values and the unitspecific boiler heat input rates identified above. A 5-year review of Naughton s most recent ( ) coal heating content data indicates that Unit 1 had an average coal heating value of 9,936.5 Btu/lb; Unit 2 had an average coal heating value of 9,931.2 Btu/lb; and Unit 3 had an average coal heating value of 9,942.0 Btu/lb. Maximum future annual coal burn rates can then be calculated using the average coal heating content values; the unit-specific boiler heat input rates; and a maximum annual boiler operating time of 8,760 hours/year. Using these data and appropriate conversion factors provides a maximum Unit 1 future annual coal burn rate of 815,476 tons/year; a maximum Unit 2 future annual coal burn rate of 1,058,479 tons/year; and a maximum Unit 3 future annual coal burn rate of 1,630,059 tons/year as indicated in Table NAU-10. Sulfur Dioxide (SO 2 ) Emissions In this construction permit application PacifiCorp is requesting that a PAL be established for SO 2 following construction of the Unit 1 and Unit 2 flue gas desulfurization systems (scrubbers). The future potential SO 2 emission rates for Units 1 and 2 (0.15 lb/mmbtu); the Unit 1 boiler heat input rate of 1,850 MMBtu/hour; the Unit 2 boiler heat input rate of 2,400 MMBtu/hour; the maximum past actual Unit 3 SO 2 emission rate of 6,070.7 tons/year; the maximum past actual non-stack emission rate of 21.1 tons/year; and the PSD significance level of 40 tons/year were used to establish the requested PAL value of 8,924.1 tons/year as indicated in Table NAU-2. 13
15 Nitrogen Oxides (NO X ) Emissions In this application PacifiCorp is requesting that at issuance of the construction permit existing Naughton Plant operating permit condition (F5)(b), which limits annual Units 1, 2 and 3 NO X emissions at 15,140 tons/year be formally implemented as a plantwide applicability limitation (PAL). When implemented, the annual NO X emission limitation will be calculated monthly on a 12-month rolling average basis. Furthermore, PacifiCorp requests that a revised NO X PAL be implemented 12 months following completion of the Units 1 and 2 low-no X control projects. The future potential NO X emission rates for Units 1 and 2 (0.26 lb/mmbtu); the Unit 1 boiler heat input rate of 1,850 MMBtu/hour; the Unit 2 boiler heat input rate of 2,400 MMBtu/hour; the maximum past actual Unit 3 NO X emission rate of 6,223.0 tons/year; the maximum past actual nonstack emission rate of 1.8 tons/year; and the PSD significance level of 40 tons/year were used to establish the requested PAL value of 11,104.7 tons/year as indicated in Table NAU-4. Particulate Matter Emissions Post-pollution control project PM 10 emission limits and boiler heat input values were used to calculate the future potential Units 1, 2 and 2 exhaust stack particulate matter emission rates. Following installation of the requested flue gas conditioning systems Unit 1 will have a PM 10 limit of 78 lb/hour (based on an emission rate of lb/mmbtu at a boiler heat input rate of 1,850 MMBtu/hour) and Unit 2 will have a PM 10 limit of 130 lb/hour (based on an emission rate of lb/mmbtu at a boiler heat input rate of 2,400 MMBtu/hour). Unit 3 will be subject to a PM 10 emission limit of 56 lb/hour (based on an emission rate of lb/mmbtu at a boiler heat input rate of 3,700 MMBtu/hour) following installation of the fabric filter baghouse. Issuance of the requested Units 1-3 PM 10 emission limits, on a lb/hour basis, will ensure that future potential PM 10 emissions are equal-to-or-less-than the maximum past actual emission rates identified in the 5-year emissions evaluation performed for this construction permit application. Following installation of the Units 1 and 2 flue gas conditioning systems and the Unit 3 fabric filter baghouse, Unit 1 will have a future potential PM 10 emission rate of tons/year based on a boiler heat input of 1,850 MMBtu/hour and an emission limit of lb/mmbtu; Unit 2 will have a future potential PM 10 emission rate of tons/year based on a boiler heat input of 2,400 MMBtu/hour and an emission limit of lb/mmbtu; and Unit 3 will have a future potential PM 10 emission rate of tons/year based on a boiler heat input of 3,700 MMBtu/hour and an emission limit of lb/mmbtu. These unitspecific PM 10 emission rates plus the maximum non-stack PM 10 emission rate of tons/year provide a future total particulate matter emission rate of 1,681.4 tons/year as indicated in Table NAU-8. 14
16 Carbon Monoxide Emissions PacifiCorp is requesting that Unit 1 and Unit 2 carbon monoxide (CO) emission limits of 0.25 lb/mmbtu be established following installation of low-no X control systems on the Unit 1 and Unit 2 boilers. A maximum future potential Unit 1 CO emission rate of 2,025.8 tons/year was calculated based on the requested emission limit of 0.25 lb/mmbtu and a boiler heat input rate of 1,850 MMBtu/hour. A maximum future potential Unit 2 CO emission rate of 2,628.0 tons/year was calculated based on the requested emission limit of 0.25 lb/mmbtu and a boiler heat input rate of 2,400 MMBtu/hour. For Unit 3, a maximum future potential coal burn rate of 1,630,059 tons/year was established. The maximum future potential coal burn rate, indicated on Table NAU-10, was calculated based on a 5- year average coal heating content of 9,942.0 Btu/lb and a maximum boiler heat input rate of 3,700 MMBtu/hour. Using the maximum future potential Unit 3 coal burn rate of 1,630,059 tons/year and applicable AP-42 carbon monoxide emission factor of 0.5 lb/ton establishes a maximum future potential Unit 3 CO emission rate of tons/year. Summation of the unit-specific future potential CO emission rates plus the maximum non-stack CO emission rate of 0.4 tons/year establishes a total future potential Naughton Plant carbon monoxide emission rate of 5,061.7 tons/year as indicated in Table NAU-16. Volatile Organic Compound Emissions Maximum future potential volatile organic compound (VOC) emission rates were calculated based on the applicable AP-42 emission factor and on maximum future potential coal burn rates. The applicable VOC emission factor for coal-fired boilers is equivalent to 0.06 lb/ton of coal burned. The maximum future potential Unit 1 coal burn rate is equivalent to 815,476 tons/year; the maximum future potential Unit 2 coal burn rate is equivalent to 1,058,479 tons/year; and the maximum future potential Unit 3 coal burn rate is equivalent to 1,630,059 tons/year. Multiplying the 0.06 lb/ton VOC emission factor by the maximum coal burn rates establishes a maximum future potential Naughton Plant stack-only VOC emission rate of tons/year. Adding the maximum non-stack VOC emission rate of 0.1 tons/year to the tons/year stack emission rate established a total future potential Naughton VOC annual emission rate of tons/year as indicated in Table NAU-18. Lead Emissions Maximum future potential lead emission rates were calculated based on the applicable AP-42 emission factor for coal-fired boilers and on 5-year average unit-specific data including coal lead concentrations, coal ash concentrations, post-pollution control project PM 10 emission rates, and on future potential boiler heat input rates. 15
17 Utilizing the appropriate AP-42 emission factor from EPA Table and an average Unit 1 coal lead concentration of 1.97 ppm; average coal ash content of 4.77%; PM 10 emission rate of lb/mmbtu; and future potential heat input rate of 16,206,000 MMBtu/year establishes a maximum future potential Unit 1 lead emission rate of 85.3 lb/year. Utilizing the appropriate AP-42 emission factor from EPA Table and an average Unit 2 coal lead concentration of 1.97 ppm; average coal ash content of 4.78%; PM 10 emission rate of lb/mmbtu; and future potential heat input rate of 21,024,000 MMBtu/year establishes a maximum future potential Unit 2 lead emission rate of lb/year. Utilizing the appropriate AP-42 emission factor from EPA Table and an average Unit 3 coal lead concentration of 2.03 ppm; average coal ash content of 5.36%; PM 10 emission rate of lb/mmbtu; and future potential heat input rate of 32,412,000 MMBtu/year establishes a maximum future potential Unit 3 lead emission rate of 70.2 lb/year. Summation of the unit-specific lead emission rates establishes a maximum future potential Naughton Plant lead emission rate of lb/year or 0.15 tons/year as indicated in Table NAU-14. Fluoride Emissions Maximum future potential fluoride emission rates, as hydrogen fluoride, have been determined from the Naughton Plant s 5-year average annual coal fluoride concentrations, from the installation of new SO 2 scrubbers on Units 1 and 2, and from the maximum future potential unit-specific annual coal burn rates. The EPRI LARK-TRIPP method was used to calculate the maximum future potential HF emission rate of 11.3 tons/year as indicated in Table NAU-10. Sulfuric Acid Emissions EPRI s Estimating Total Sulfuric Acid Emissions from Stationary Power Plants, Technical Update, April 2007 method was used to calculate the Naughton Plant s maximum future potential H 2 SO 4 emission rate. Unit-specific future potential sulfuric acid emissions were calculated based on 5-year average annual coal sulfur concentrations; future potential boiler heat input values as indicated in Table NAU-10; the installation of SO 2 scrubbers on Units 1 and 2; and the installation of flue gas conditioning systems on Units 1 and 2 with maximum SO 3 injection rates of 8 ppm. (The Unit 3 flue gas conditioning system will be retired from service following installation of the Unit 3 fabric filter baghouse.) Using the EPRI calculation method and unit-specific future potential heat input values, average 5-year coal sulfur concentrations, and Units 1 and 2 SO 3 injection rates of 8 ppm provides a maximum future potential Naughton Plant H 2 SO 4 emission rate of 12.5 tons/year as indicated in Table NAU
18 Table 4.3 indicates the annual future potential emission rates for the Naughton Plant pollutants identified above. Table 4.3: Summary of Naughton Future Potential Emissions Naughton Units 1-3 Stack Emissions SO 2 tons/year NO X tons/year PM 10 tons/year HF tons/year H 2 SO 4 tons/year Lead tons/year CO tons/year VOC tons/year 8, , , , Non-Stack Emissions Future Potential Emissions Unit 3 Stack Emissions 8, , , , , , Future potential non-stack emission rates obtained from maximum past actual emissions from emissions inventories 17
19 4.3.2 Prevention of Significant Deterioration Significance Determination In order to determine if a Prevention of Significant Deterioration (PSD) significance level has been reached the past actual baseline emissions for each pollutant is subtracted from the projected annual emissions. If a significance level has been exceeded for a pollutant then a Prevention of Significant Deterioration review must be performed for that pollutant. PacifiCorp is requesting that the past actual to future potential actual emissions test specified in the December 2002 revisions to the New Source Review rules [40 CFR 52.21(aa) and WAQSR Chapter 6, Section 4] be used to establish Plantwide Applicability Limitations (PALs) for SO 2 and NO X at the Naughton Plant. These plantwide annual emission limits will be imposed to assure, through federal enforceability, that the future Potential to Emit for the facility, as a whole, will be no greater than historical emissions. Therefore, there will be no net emissions increase of sulfur dioxide or nitrogen oxides as defined as significant [40 CFR 52.21(b)(23)] with respect to PSD review of these pollutants under the provisions of a PSD major modification [40 CFR 52.21(b)(2)(i)]. PSD review will apply to the other regulated pollutants for which there is a net increase defined as significant [40 CFR 52.21(b)(23)]. As noted in Section 1.0, at issuance of the construction permit PacifiCorp requests that the existing Naughton Plant annual NO X emission limitation of 15,140 tons/year [Operating Permit condition (F5)(b)] be established as a Plantwide Applicability Limitation (PAL). Furthermore, following completion of the Units 1 and 2 low-no X control projects, PacifiCorp requests that a new NO X PAL of 11,104.7 tons/year be established. PacifiCorp also requests that an SO 2 PAL of 8,924.1 tons/year be established following completion of the Units 1 and 2 flue gas desulfurization (FGD) SO 2 scrubber installations. In order to determine if a Prevention of Significant Deterioration significance level has been reached the past actual baseline emissions for each pollutant is subtracted from the projected annual emissions. If a significance level has been exceeded for a pollutant then a Prevention of Significant Deterioration review must be performed for that pollutant. 18
20 4.3.3 Contemporaneous Period and Pre-Project Actual Emissions Definition of a Major Modification An existing major source is subject to Prevention of Significant Deterioration review only if it undertakes a major modification [40 CFR 52.21(b)(2)(i)] and WAQSR Chapter 6, Section 2]. Major modification is defined as any physical change in or change in the method of operation of a major stationary source that would result in a significant net emissions increase of any pollutant subject to regulation under Clean Air Act [40 CFR 52.21(b)(23) and WAQSR Chapter 6, Section 2]. A major modification does not include: routine maintenance, repair and replacement [40 CFR 52.21(b)(2)(iii)(a) and WAQSR Chapter 6, Section 2] or an increase in the hours of operation or in the production rate [40 CFR 52.21(b)(2)(iii)(f) and WAQSR Chapter 6, Section 2]. To determine if a Prevention of Significant Deterioration significance level has been reached the baseline actual emissions are subtracted from the projected actual emissions. The results of this evaluation for each pollutant are shown in Table
21 Table 4.4: Evaluation of Significance Level by Pollutant Pollutant Past Actual (Baseline) Emissions tons/year Projected Actual (Future Annual) Emissions tons/year Projected Actual minus Past Actual Emissions (Emission Increase) tons/year PSD Review Significance Level tons/year Is Emission Increase greater than PSD Significance Level SO 2 (Unit 3 stack only) SO 2 (Total: Units 1-3 stack and non-stack emissions) NO X (Unit 3 stack only) NO X (Total: Units 1-3 stack and non-stack emissions) PM 10 (Total: Units 1-3 stack and non-stack emissions) Hydrogen Fluoride (Total: Units 1-3 stack and non-stack emissions) (HF) Sulfuric Acid (Total: Units 1-3 stack and non-stack emissions) (H 2 SO 4 ) Lead (Total: Units 1-3 stack and non-stack emissions) Carbon Monoxide (Total: Units 1-3 stack and non-stack emissions) (CO) VOC (Total: Units 1-3 stack and non-stack emissions) 6, , No 22, , , No 6, , No 14, , , No 1, , No No No No , , Yes No 20
22 Determination of Major Modification Although the proposed projects may constitute a physical change at the plant, they will not result in significant net emissions increases of SO 2, NO X, particulate matter, hydrogen fluoride, sulfuric acid, lead or VOCs and therefore are not major modifications for these pollutants. The results of the emissions evaluation indicate that future potential emissions of CO may increase above the PSD significance level. 4.4 Requested Emission Rate Limits This section identifies the requested emission rate limits for Naughton Units 1, 2 and 3 following completion of the proposed pollution control equipment projects. The following emission rate limits are requested for Unit 1: Particulate matter = 10 microns (filterable): 78 lb/hour, annual average (1,850 MMBtu/hr x lb/ MMBtu) This limit will go into effect within 90 days following completion of the installation of the Unit 1 flue gas conditioning system. It is expected that the Unit 1 flue gas conditioning system will be installed in Sulfur dioxide: 0.15 lb/mmbtu, 12-month rolling average 833 lb/hour, fixed 3-hour basis These limits will go into effect within 90 days after the Unit 1 flue gas desulfurization system has been completed and deemed commercial. The expected commercial date is July After successful testing the equipment will be deemed commercial. Nitrogen oxides: 0.26 lb/mmbtu, annual average This limit will go into effect within 90 days after the low-no X burners have been installed, tested and deemed commercial. The expected installation date is July After successful testing the equipment will be deemed commercial. Carbon monoxide: 0.25 lb/mmbtu, 463 lb/hour, 30-day rolling average This limit will go into effect within 90 days after the low-no X burners have been installed, tested and deemed commercial. The expected installation date is July After successful testing the equipment will be deemed commercial. 21
23 Sulfuric Acid: 8 ppm SO 3 injection rate, 30-day rolling average This limit will go into effect within 90 days after the Unit 1 flue gas conditioning system has been installed, tested and deemed commercial. The expected installation date is July After successful testing the equipment will be deemed commercial. The following emission rate limits are requested for Unit 2: Particulate matter = 10 microns (filterable): 130 lb/hour, annual average (2,400 MMBtu/hr x lb/ MMBtu) This limit will go into effect within 90 days following completion of the installation of the Unit 2 flue gas conditioning system. It is expected that the Unit 2 flue gas conditioning system will be installed in Sulfur dioxide: 0.15 lb/mmbtu, 12-month rolling average 1,080 lb/hour, fixed 3-hour basis These limits will go into effect within 90 days after the Unit 2 flue gas desulfurization system has been completed and deemed commercial. The expected commercial date is December After successful testing the equipment will be deemed commercial Nitrogen oxides: 0.26 lb/mmbtu, annual average This limit will go into effect within 90 days after the low-no X burners have been installed, tested and deemed commercial. The expected installation date is December After successful testing the equipment will be deemed commercial. Carbon monoxide: 0.25 lb/mmbtu, 600 lb/hour, 30-day rolling average This limit will go into effect within 90 days after the low-no X burners have been installed, tested and deemed commercial. The expected installation date is December After successful testing the equipment will be deemed commercial. Sulfuric Acid: 8 ppm SO 3 injection rate, 30-day rolling average This limit will go into effect within 90 days after the Unit 2 flue gas conditioning system has been installed, tested and deemed commercial. The expected installation date is July After successful testing the equipment will be deemed commercial. 22
24 The following emission rate limits are requested for Unit 3: Particulate matter = 10 microns (filterable): 56 lb/hour, annual average (3,700 MMBtu/hr x lb/ MMBtu) This limit will go into effect within 90 days after the Unit 3 fabric filter baghouse has been installed, tested and deemed commercial. It is expected that the Unit 3 fabric filter baghouse will be deemed commercial in July Plantwide Applicability Limitations As indicated in Section 1.0 of this application, PacifiCorp Energy is requesting that SO 2 and NO X Plantwide Applicability Limitations (PALs) be established at the Naughton Plant following issuance of the requested construction permit. The following federally enforceable annual plantwide emission limits are requested for SO 2 and NO X. These limits are based on an existing plant cap for NO X ; on the highest 24 consecutive month average Unit 3 NO X and SO 2 emission rate in the previous 60 month period, future potential Unit 1 and Unit 2 NO X and SO 2 emission rates; maximum past actual non-stack NO X and SO 2 emission rates; and NO X and SO 2 PSD significance threshold values of 40 tons/year. At issuance of the construction permit it is requested that existing Title V operating permit condition (F5)(b) that limits total Naughton Plant Units 1, 2 and 3 boiler NO X emissions at 15,140 tons/year, on an annual basis, be formally amended to a Plantwide Applicability Limitation of 15,140 tons/year. At issuance of the requested PAL the 15,140 ton/year NO X limitation will be validated monthly on a 12-month rolling average basis. Following completion and certification of the Units 1 and 2 low-no X projects it is requested that a NO X PAL be established at a rate of 11,104.7 tons/year. Following completion and certification of the Units 1 and 2 flue gas desulfurization systems (SO 2 scrubbers) it is requested that an SO 2 PAL be established at a rate of 8,924.1 tons/year. The following page containing Table 4.5 summarizes the emissions data and PSD significance values used to establish the requested NO X and SO 2 PAL values for the Naughton Power Plant. Table 4.6 contained on page 26 provides a summary of the past actual and future potential stack emission rates for NO X, SO 2, PM 10, HF, H 2 SO 4, lead, CO and VOC at the Naughton Plant. 23
25 Table 4.7 contained on page 27 presents a chronology of the requested emission limits to be implemented at the Naughton Plant. 24
26 Table 4.5: Naughton Plant NO X and SO 2 PAL Evaluation Existing Maximum Past Actual Boiler Heat Input Pollutant Cap Emission Rate MMBtu/hour tons/year tons/year NO X (Plant Total) NO X (Unit 1) NO X (Unit 2) NO X (Unit 3) Emission Limit lb/mmbtu Annual Emissions tons/year PSD Significance Level tons/year Requested PAL tons/year 15,140 14, ,140 1, , , , , , ,104.7 Notes PacifiCorp requests that the existing 15,140 ton/year annual NO X limitation be amended to a PAL at issuance of the construction permit. PacifiCorp requests that the NO X PAL of 15,140 tons/year be lowered to 11,104.7 tons/year following completion of the Units 1 and 2 low-no X projects. The requested 11,104.7 ton/year value was set from future potential Units 1 and 2 emission rates, the maximum past actual Unit 3 rate, the maximum past actual non-stack emission rate, and the PSD significance threshold. NO X (Non-Stack) SO 2 (Unit 1) SO 2 (Unit 2) SO 2 (Unit 3) 1, , , , , , ,924.1 PacifiCorp requests that an 8,924.1 ton/year SO 2 PAL be established following completion of the Units 1 and 2 scrubber projects. The requested 8,924.1 ton/year value was set from future potential Units 1 and 2 emission rates, the maximum past actual Unit 3 rate, the maximum past actual nonstack emission rate, and the PSD significance threshold. SO 2 (Non-Stack)
27 Table 4.6: Naughton Emissions Summary Past Actual vs. Future Potential Maximum Past Actual Emission Rate Pollutant/Parameter Table Reference Maximum Future Potential Rate PSD Significance Level Is PSD Triggered Rate Increase/Decrease SO 2 * Maximum Future Potential Emission Rate Following Unit and Unit 2 FGD projects SO 2 (Unit 3 Only) Tables NAU-1 and NAU-2 22,310.3 tons/year 8,924.1 * tons/year (post-project PAL) Tables NAU-1 and NAU-2 6,070.7 tons/year NO X Tables NAU-3 and NAU-4 14,735.7 tons/year 15,140.0 NA (Setting a PAL) tons/year (pre-project PAL) -13,386.2 tons/year 40 tons/year No NA (Setting a PAL) NA (Setting a PAL) NO X * Maximum Future Potential Emission Rate Following Unit 1 and Unit 2 low-no X projects NO X (Unit 3 Only) Tables NAU-3 and NAU-4 14,735.7 tons/year 11,104.7 * tons/year (post-project PAL) Tables NAU-3 and NAU-4 6,223.0 tons/year NA (Setting a PAL) -3,631.0 tons/year 40 tons/year No NA (Setting a PAL) Heat Input Tables NAU-5 and NAU-10 58,799,851 MMBtu/year 69,642,000 MMBtu/year Coal Burn Tables NAU-6 and NAU-10 2,772,677 tons/year 3,504,014 tons/year Particulate Matter (Stack and Non-Stack Total) Units 1-3 (Unit 1 Future at lb/mmbtu) (Unit 2 Future at lb/mmbtu) (Unit 3 Future at lb/mmbtu) Tables NAU-7 and NAU-8 1,831.7 tons/year 1,681.4 tons/year tons/year 25 tons/year (15 tons/year for PM 10 ) No Hydrogen Fluoride Tables NAU-9 and NAU tons/year 11.3 tons/year tons/year 3 tons/year (fluoride) No Sulfuric Acid Tables NAU-11 and NAU tons/year 12.5 tons/year tons/year 7 tons/year No Lead Tables NAU-13 and NAU tons/year 0.15 tons/year 0.02 tons/year 0.6 tons/year No Carbon Monoxide Tables NAU-15 and NAU tons/year 5,061.7 tons/year 4,368.1 tons/year 100 tons/year Yes VOC Tables NAU-17 and NAU tons/year tons/year 21.9 tons/year 40 tons/year No Note: Carbon monoxide is the only pollutant that has a post-project emission increase above its PSD significance level. 26
28 Table 4.7: Naughton Plant Emission Limit Chronology 2008: Upon Issuance of Construction Permit (a) Upon issuance of the construction permit the existing annual NO X cap of 15,140 tons/year, operating permit condition (F5)(b), becomes a Plantwide Applicability Limitation (PAL) The 15,140 ton/year NO X PAL will be calculated monthly on a 12-month rolling average basis (a) (b) (c) (d) Upon Completion of the Unit 1 and Unit 2 Flue Gas Conditioning System Installations The Unit 1 flue gas conditioning system will be limited to a maximum sulfur trioxide (SO 3 ) injection rate of 8 ppm based on a 30-day rolling average The Unit 2 flue gas conditioning system will be limited to a maximum sulfur trioxide (SO 3 ) injection rate of 8 ppm based on a 30-day rolling average Unit 1 will be subject to a PM 10 limitation of 78 lb/hour (0.042 lb/mmbtu) within 90 days following the completion of the Unit 1 flue gas conditioning system installation Unit 2 will be subject to a PM 10 limitation of 130 lb/hour (0.054 lb/mmbtu) within 90 days following the completion of the Unit 2 flue gas conditioning system installation 2011: Upon Certification of Pollution Control Equipment following the Unit 2 Low-NO X Burner and Flue Gas Desulfurization Projects (a) Unit 2 will be subject to a 12-month rolling average NO X limitation of 0.26 lb/mmbtu (b) Unit 2 will be subject to a 12-month rolling average SO 2 limitation of 0.15 lb/mmbtu (c) Unit 2 will be subject to a 3-hour fixed block average SO 2 limitation of 1,080 lb/hour (d) Unit 2 will be subject to a 30-day rolling average CO limitation of 0.25 lb/mmbtu (600 lb/hour) 2012: Upon Certification of Pollution Control Equipment following Unit 1 Low-NO X Burner and Flue Gas Desulfurization Projects (a) Unit 1 will be subject to a 12-month rolling average NO X limitation of 0.26 lb/mmbtu (b) Unit 1 will be subject to a 12-month rolling average SO 2 limitation of 0.15 lb/mmbtu (c) Unit 1 will be subject to a 3-hour fixed block average SO 2 limitation of 833 lb/hour (d) Unit 1 will be subject to a 30-day rolling average CO limitation of 0.25 lb/mmbtu (463 lb/hour) (e) The Naughton Plant will be subject to a NO X PAL of 11,104.7 tons/year (f) The Naughton Plant will be subject to an SO 2 PAL of 8,924.1 tons/year 2014: Upon Certification of Pollution Control Equipment follwong Unit 3 Fabric Filter Baghouse Project (a) Unit 3 will be subject to a PM 10 limitation of 56 lb/hour (0.015 lb/mmbtu) within 90 days following the completion of the Unit 3 fabric filter baghouse installation 27
29 5.0 Description of Pollution Control Equipment 5.1 Sulfur Dioxide Unit 1 - Flue Gas Desulfurization (FGD) PacifiCorp will install a wet flue gas desulfurization system on Naughton Unit 1 in 2012 which will be used to control sulfur dioxide (SO 2 ) emissions. In this application PacifiCorp requests that a 0.15 lb/mmbtu emission limit, on a 12-month rolling average basis, be implemented following construction of the FGD system. Furthermore, a 3-hour fixed block average limit of 833 lb/hour is requested for Naughton Unit 1 following completion of the FGD installation Unit 2 - Flue Gas Desulfurization (FGD) PacifiCorp will install a wet flue gas desulfurization system on Naughton Unit 2 in 2011 which will be used to control sulfur dioxide (SO 2 ) emissions. In this application PacifiCorp requests that a 0.15 lb/mmbtu emission limit, on a 12-month rolling average basis, be implemented following construction of the FGD system. Furthermore, a 3-hour fixed block average limit of 1,080 lb/hour is requested for Naughton Unit 2 following completion of the FGD installation. 5.2 Nitrogen Oxides Unit 1 Low-NO X Burners PacifiCorp will install a low-no X boiler burner system on Naughton Unit 1 in 2012 which will be used to control nitrogen oxides (NO X ) emissions. In this application PacifiCorp requests that a 0.26 lb/mmbtu emission limit, on a 12-month rolling average basis, be implemented on Unit 1 following construction of the low-no X system Unit 2 Low-NO X Burners PacifiCorp will install a low-no X boiler burner system on Naughton Unit 2 in 2011 which will be used to control nitrogen oxides (NO X ) emissions. In this application PacifiCorp requests that a 0.26 lb/mmbtu emission limit, on a 12-month rolling average basis, be implemented on Unit 2 following construction of the low-no X system. 28
30 5.3 Particulate Matter Unit 1 - Flue Gas Conditioning PacifiCorp requests that a flue gas conditioning system be installed on Unit 1 following issuance of a construction permit and that a PM 10 limit of 78 lb/hour be established. The installation of the Unit 1 flue gas conditioning project will result in improved electrostatic precipitator particulate matter removal efficiencies and will allow the Plant to meet the existing 40 percent opacity standard through the combustion of coal of varying resistivity and other fuelspecific characteristics. The project will include a burner unit that will combust sulfur feedstock to produce sulfur dioxide (SO 2 ) gas. The SO 2 will then be passed through a vanadium-based catalyst which converts the SO 2 to sulfur trioxide (SO 3 ). The SO 3 -containing gas is injected into the Unit 1 air preheater flue gas stream at a temperature of between 620 o F and 700 o F. The flue gas temperature at the point of SO 3 injection is in the range of between 250 o F and 350 o F, with the flue gas at a typical temperature of approximately 300 o F. The SO 3 reacts rapidly with moisture inherently contained in the flue gas stream to form sulfuric acid (H 2 SO 4 ) which heterogeneously nucleates on the surfaces of fly ash particles. The sulfuric acid (and water vapor attracted by the sulfuric acid) conditions the fly ash particles by providing a path for electrical charge dissipation across the particle surfaces. This reduces the resistivity of the precipitated fly ash layer on the surfaces of the electrostatic precipitator collection plates. The quantity of SO 3 injected into the air preheater effluent gas stream is equivalent to a concentration of up to 8 ppm (v/v). This supplements the SO 3 inherently in the air preheater effluent gas stream due to the oxidation of fuel sulfur to SO 3 in the boiler. While the formation rate of SO 3 from fuel sulfur is not known and is highly variable, the total concentration of SO 3 is estimated to be less than 10 ppm due to the combined result of fuel sulfur related SO 3 and FGC system injected SO 3. The large majority of the injected SO 3 is captured on the particle surfaces as H 2 SO 4 and is removed with the fly ash in the Units 1 and 2 electrostatic precipitators. Because the injection of SO 3 will result in the manufacture of sulfuric acid (H 2 SO 4 ), PacifiCorp requests that an SO 3 injection limit of 8 ppm on a 30-day rolling average basis be established following completion of construction of the Unit 1 flue gas conditioning system. 29
31 5.3.2 Unit 2 - Flue Gas Conditioning PacifiCorp requests that a flue gas conditioning system be installed on Unit 2 following issuance of a construction permit and that a PM 10 limit of 130 lb/hour be established. The installation of the Unit 2 flue gas conditioning project will result in improved electrostatic precipitator particulate matter removal efficiencies and will allow the Plant to meet the existing 40 percent opacity standard through the combustion of coal of varying resistivity and other fuelspecific characteristics. The project will include a burner unit that will combust sulfur feedstock to produce sulfur dioxide (SO 2 ) gas. The SO 2 will then be passed through a vanadium-based catalyst which converts the SO 2 to sulfur trioxide (SO 3 ). The SO 3 -containing gas is injected into the Unit 2 air preheater flue gas stream at a temperature of between 620 o F and 700 o F. The flue gas temperature at the point of SO 3 injection is in the range of between 250 o F and 350 o F, with the flue gas at a typical temperature of approximately 300 o F. The SO 3 reacts rapidly with moisture inherently contained in the flue gas stream to form sulfuric acid (H 2 SO 4 ) which heterogeneously nucleates on the surfaces of fly ash particles. The sulfuric acid (and water vapor attracted by the sulfuric acid) conditions the fly ash particles by providing a path for electrical charge dissipation across the particle surfaces. This reduces the resistivity of the precipitated fly ash layer on the surfaces of the electrostatic precipitator collection plates. The quantity of SO 3 injected into the air preheater effluent gas stream is equivalent to a concentration of up to 8 ppm (v/v). This supplements the SO 3 inherently in the air preheater effluent gas stream due to the oxidation of fuel sulfur to SO 3 in the boiler. While the formation rate of SO 3 from fuel sulfur is not known and is highly variable, the total concentration of SO 3 is estimated to be less than 10 ppm due to the combined result of fuel sulfur related SO 3 and FGC system injected SO 3. The large majority of the injected SO 3 is captured on the particle surfaces as H 2 SO 4 and is removed with the fly ash in the Units 1 and 2 electrostatic precipitators. Because the injection of SO 3 will result in the manufacture of sulfuric acid (H 2 SO 4 ), PacifiCorp requests that an SO 3 injection limit of 8 ppm on a 30-day rolling average basis be established following completion of construction of the Unit 2 flue gas conditioning system. 30
32 5.3.3 Unit 3 Fabric Filter Baghouse PacifiCorp requests that a pulse jet fabric filter baghouse be installed on Unit 3 in 2014 to replace the existing electrostatic precipitator. The specification for the pulse jet fabric filter is being finalized at this time. The actual number of bags is currently undefined although the air-tocloth ratio is specified at approximately 4 to 1 at a rated gas flow of 1,652,000 acfm. PacifiCorp requests that a 56 lb/hour PM 10 limit be established on Unit 3 following completion of construction of the pulse jet fabric filter baghouse. 6.0 Best Available Control Technology Determination The Clean Air Act s PSD program provides that a Best Available Control Technology analysis must be conducted if a proposed project will result in a significant increase of a PSD pollutant. Applicability PacifiCorp has determined that the projects proposed for the Naughton Power Plant may result in a significant increase (as determined by the thresholds established in the regulations) of carbon monoxide (CO). Therefore, PacifiCorp has conducted a Best Available Control Technology analysis for CO in this construction permit application. The EPA has developed a process for conducting Best Available Control Technology analyses. This method is referred to as the top-down method. The steps to conducting a top-down analysis are listed in Environmental Protection Agency s New Source Review Workshop Manual Draft, October The steps are: Step 1 Identify All Control Technologies Step 2 Eliminate Technically Infeasible Options Step 3 Rank Remaining Control Technologies by Control Effectiveness Step 4 Evaluate Most Effective Controls and Document Results Step 5 Select Best Available Control Technology 31
33 Carbon Monoxide Best Available Control Technology Analysis Combustion controls designed to reduce NO X emissions may increase carbon monoxide by creating oxygen deficient combustions zones in the boiler. These controls are balanced to provide the maximum NO X reduction while minimizing carbon monoxide emission increases. Step 1 - Identify All Control Technologies Only two control technologies have been identified for control of carbon monoxide. Catalytic oxidation Combustion controls The catalytic oxidation is a post-combustion control device that would be applied to the combustion system exhaust, while combustion controls are part of the combustion system design of the boiler. Step 2 - Eliminate Technically Infeasible Options Catalytic oxidation has been used to obtain the most stringent control of carbon monoxide emissions from combustion turbines firing natural gas. This alternative, however, has never been applied to a coal-fired boiler and has not been demonstrated to be a practical technology in this application. For sulfur-containing fuels such as coal, an oxidation catalyst will convert SO 2 to SO 3, resulting in unacceptable levels of corrosion to the flue gas system as SO 3 is converted to H 2 SO 4. Generally, oxidation catalysts are designed for a maximum particulate loading of 50 milligrams per cubic meter. Naughton units 1, 2 and 3 have particulate matter loadings upstream of their respective particulate matter control devices in excess of 5,000 milligrams per cubic meter. In addition, trace elements present in coal, particularly chlorine, are poisonous to oxidation catalysts. Catalysts have not been developed that have or can be applied to coal-fired boilers due to the high levels of particulate matter and trace elements present in the flue gas. Although the catalyst could be installed downstream of the particulate matter pollution control devices (units 1, 2 and 3 electrostatic precipitators and unit 3 wet scrubber), the flue gas temperature at that point will be less than 300º F, which is well below the minimum temperature required (600ºF) for the operation of the oxidation catalyst. Utilization of a catalyst would require the flue gas to be reheated, resulting in significant negative energy and economic impacts. For these reasons, as well as the low levels of CO in coal-fired units, no pulverized-coal-fired boilers have been equipped with oxidation catalysts. Use of an oxidation catalyst system is thus considered technically infeasible and this system cannot be considered to represent Best Available Control Technology for control of carbon monoxide. 32
34 Step 3 - Rank Remaining Control Technologies by Control Effectiveness Based on the Step 2 analysis, combustion control is the only remaining technology for this application. Step 4 - Evaluate Most Effective Controls and Document Results There are no environmental or energy costs associated with combustion controls. Step 5 - Select Best Available Control Technology The EPA New Source Review, RACT, BACT, LAER Clearinghouse database for comparable sources related to CO is shown in Table 6.1. The final step in the top-down Best Available Control Technology analysis process is to select Best Available Control Technology. Based on the above analysis, good combustion control for CO is chosen as Best Available Control Technology for these projects. Because there is a balance between reducing NO X emissions with advanced combustion controls and increasing CO emissions, i.e., the lower the NO X emissions the greater the potential for an increase in CO emissions, a 30-day rolling average emission limit of 0.25 lb/mmbtu for CO is recommended for Naughton Units 1 and 2. References U.S. Environmental Protection Agency, 2007, RACT/BACT/LAER Clearinghouse Database Wyoming Department of Environmental Quality, Air Quality Division Standards and Regulations, Chapter 6 Permitting Requirements 33
35 Table 6.1: Review of EPA RACT/BACT/LAER Clearinghouse (RBLC) for Carbon Monoxide Emission Limits Company Plant Heat Input CO Emission Limit Averaging Time Boiler Construction Date/Permit Date Emission Control Description RBLC ID 1MidAmerican Energy Co., Iowa George Neal North-Neal 1 Boiler 1,363 MMBtu/hr 1.26 lb/mmbtu 3-hour average /17/2006 Good Combustion Practices IA MidAmerican Energy Co., Iowa Neal Energy Center South- Unit 4 Boiler 6,900 MMBtu/hr 0.42 lb/mmbtu 1 calendar day 1977/ /2006 Good Combustion Practices IA Reliant Energy, Texas Washington Parish Electric Generating Station Unit 7 6,700 MMBtu/hr 0.33 lb/mmbtu Unknown Unknown 01/04/2005 Combustion Control TX CO was the only pollutant with a projected increase in emissions in the change to add an over fire air system, date of determination BACT-PSD 01/17/ CO was the only pollutant with a projected increase in emissions in the change for installation of a new low NOx burner and the addition of over fire air system, date of determination BACT-PSD 01/26/ Case-by-case BACT PSD 34
36 7.0 Regulatory Review The Clean Air Act s PSD program provides that a Best Available Control Technology analysis must be conducted if a proposed project will result in a significant increase This section provides a regulatory review of the applicability of state and federal air quality permitting requirements for the addition of the emission controls and other plant projects. State of Wyoming Air Permitting Requirements The State of Wyoming has been granted authority to implement and enforce the federal Clean Air Act (CAA) [pursuant to the State Implementation Plan review and approval process] and federal air permitting requirements which are embodied within the state rules. The Plant is a major stationary source of air emissions, as defined within Wyoming Air Quality Standards and Regulations (WAQSR), 40 CFR 70 (Title V Operating Permits) and 40 CFR Part (PSD Program Requirements). The Wyoming Department of Environmental Quality, Air Quality Division, has previously issued permits and permit revisions as appropriate for existing Plant facilities. The general requirements for permits and permit revisions are codified under Chapter 6 of Wyoming Air Quality Standards and Regulations. Construction Permit Requirements (WAQSR Chapter 6) The replacement, addition or upgrade of existing emissions controls, including the Unit 1 and Unit 2 flue gas conditioning systems and low-no X burners will result in an increase of some air pollutant emissions, necessitating the issuance of a construction permit pursuant to WAQSR Chapter 6, Section 2; Permit Requirements for construction, modification and operation. PacifiCorp is required by WAQSR Chapter 6, Section 2 to obtain a construction permit from the State of Wyoming, Department of Environmental Quality, prior to any work at the facility. Appendices contained in this construction permit application include appropriate construction permit forms as required by WAQSR Chapter 6, Section 2. Operating Permit Requirements (WAQSR Chapter 6) The federal operating permit program (Title V) is implemented by regulations codified at 40 CFR Part 70 and 71. The State of Wyoming has been granted authority to implement and enforce the federal Title V program through state regulations outlined under WAQSR Chapter 6, Section 3. PacifiCorp currently has a Department of Environmental Quality issued Title V Operating Permit (Permit No ) for the Naughton Power Plant. The replacement, addition of, or upgrade to existing air emissions controls and other plant projects constitute a significant modification to the Plant and will therefore require a modification of the existing Title V permit. 35
37 Prevention of Significant Deterioration (WAQSR Chapter 6, Section 2) Within the federal NSR regulations, a subset of rules, which apply to major sources and major modifications within attainment areas, is referred to as the PSD program. Since the planned projects are at a current PSD source, located in an area classified as attainment for all criteria pollutants, the PSD program will apply to the permitting of these projects. Wyoming Department of Environmental Quality has been delegated full authority from EPA for administering the federal PSD rules; consequently, these requirements are codified within the state s permitting rules at WAQSR Chapter 6, Section 4. The PSD program defines a major stationary source as: 1. Any source type belonging to one of the 28 listed source categories that has a potential-to-emit (PTE) of 100 tons per year or more of any criteria pollutant regulated under the CAA, or 2. Any other (non-categorical) source type with a PTE of 250 tpy of any pollutant regulated under the CAA. The Naughton Power Plant facility belongs to one of the 28 listed source categories (fossil fuel-fired steam electric plants of more than 250 million Btu/hour heat input) and is considered an existing major stationary source because the PTE for CO and sulfuric acid mist all exceed the limits listed in this section. Modifications to an existing major source are considered major and subject to PSD review if the resulting net emissions increase is equal to or greater than the corresponding significant emissions increase threshold for each respective pollutant. A net emissions increase includes both of the following: The potential increase in emissions due to the modifications itself; and Contemporaneous net emissions increases and decreases of regulated air pollutants, under the PSD program An emissions increase is considered significant if emissions meet or exceed any of the following rates: CO, 100 tpy NO X, 40 tpy SO 2, 40 tpy PM 10, 15 tpy Particulate matter, 25 tpy Ozone, 40 tpy of VOCs Lead, 0.6 tpy Fluorides, 3 tpy 36
38 Hydrogen sulfide, 10 tpy The basic PSD permitting requirements and conditions for issuing a construction permit that must be met for a major modification include: The degree of pollution control for emissions, to include fugitive emissions and fugitive dust, is at least BACT, except as otherwise provided in Chapter 6, Section 2 [WAQSR Chapter 6, Section 2(c)(v)] Performing ambient air quality impacts analysis air dispersion modeling [WAQSR Chapter 6, Section 4(b)(i)(A)(I)] Analysis of impact to soils, vegetation, and visibility Analysis of Class I area impacts New and Modified Sources in Non-attainment Areas and Maintenance Areas The plant is not located in a non-attainment or maintenance area. Therefore, a nonattainment New Source Review analysis is not required. Emissions Impact Analysis (WAQSR Chapter 6, Section 2) Because the addition of the Flue Gas Conditioning (FGC) systems and low-no X burners on Units 1 and Unit 2 may result in an increase in some emissions, PacifiCorp will conduct a comprehensive air quality modeling analysis for all criteria pollutants including SO 2, NO X, PM 10, lead, hydrogen fluoride, CO and H 2 SO 4. Monitoring and Reporting After a construction permit is received, PacifiCorp will be required to conduct monitoring, submit emission reports, ensure that equipment meets certain specifications, and conduct other activities as the Wyoming Department of Environmental Quality requests. Some of these requirements are enumerated below: Meet the reporting requirements specified in WAQSR Chapter 7 in the event of an unavoidable breakdown. Submit and retain air emission inventory and perform testing and monitoring as required in WAQSR Chapter 7. 37
39 Appendix A: Naughton Unit 1 Projects Year Unit Project Major steam turbine overhaul Install low-no X control system Upgrade boiler draft system Install flue gas desulfurization system (SO 2 scrubber) Replace the boiler deflection arch Re-tube the steam condenser Replace bottom ash hopper refractory Install cooling tower motor variable frequency drives Replace the economizer hopper insulation Install forced draft fan variable frequency drive Replace a high pressure feedwater heater Rewind the generator field Replace the generator hydrogen coolers Rewind the electric generator stator Replace hot reheat steam lead piping Replace boiler superheater tubes Install intelligent sootblower control system Install mercury control system Install flue gas conditioning system Install boiler penthouse tube support clips Replace the boiler reheater Replace steam safety valves Rebuild steam control valves Replace boiler water wall tubes Replace air preheater baskets Upgrade the ash handling control system Rebuild coal mills (2) Rebuild coal mill Rebuild coal mill Rebuild coal mill Rebuild coal mill Replace 4160-volt relays 38
40 Appendix B: Naughton Unit 2 Projects Year Unit Project Major steam turbine overhaul Install flue gas desulfurization system (SO 2 scrubber) Install low-no X control system Upgrade boiler draft system Replace/rebuild the high pressure turbine nozzle block Rebuild steam control valves Install mercury control system Replace the boiler reheater Replace boiler superheater tubes Rewind the generator field Rewind the electric generator stator Replace boiler water wall tubes Replace generator exciter Rebuild/replace auxiliary transformer Upgrade the ash handling control system Rebuild coal mill Rebuild coal mills (2) Replace 4160-volt relays Replace coal piping Replace cooling tower Install flue gas conditioning system 39
41 Appendix C: Naughton Unit 3 Projects Year Unit Project Install fabric filter baghouse to replace electrostatic precipitator Upgrade the HP, IP and LP sections of the steam turbine Repair cooling tower Major steam turbine overhaul Upgrade steam turbine control system Rebuild steam control valves Boiler economizer replacement Install mercury control system Replace or re-tube 3 low-pressure feedwater heaters Replace bottom ash hopper refractory NO X burner maintenance Replace boiler superheater tubes Replace boiler superheater tubes Replace or rewind the generator exciter Replace boiler superheater tubes Rewind the generator rotor Replace/rebuild cooling tower fire protection system Boiler burner replacement Boiler burner replacement Boiler burner replacement Replace boiler water wall tubes Replace boiler water wall tubes Replace boiler water wall tubes Install scrubber intelligent control system Replace air preheater baskets Rebuild/replace the startup boiler feed pump Upgrade boiler circulating pump mechanical seals Replace the 3-1 condensate pump Rebuild coal mill Rebuild coal mill Rebuild coal mill Rebuild coal mill Rebuild coal mill Replace coal piping Install forced draft fan variable frequency drives Replace coal piping Replace coal piping Replace 4160-volt relays 40
42 Appendix D: Emissions Calculations This appendix contains maximum past actual and future potential annual emission rates for SO 2, NO X, PM 10, HF, H 2 SO 4, lead, CO and VOCs. Appendix D also contains maximum past actual and future potential boiler heat input rates and coal burn rates for the Naughton boilers for use in applicable pollutant emission rate calculations. 41
43 Naughton Emissions Summary Past Actual vs. Future Potential Emissions Evaluation Maximum Past Actual Emission Rate Pollutant/Parameter Table Reference Maximum Future Potential Rate PSD Significance Level Is PSD Triggered Rate Increase/Decrease SO 2 * Maximum Future Potential Emission Rate Following Unit and Unit 2 FGD projects SO 2 (Unit 3 Only) Tables NAU-1 and NAU-2 22,310.3 tons/year 8,924.1 * tons/year (post-project PAL) Tables NAU-1 and NAU-2 6,070.7 tons/year NO X Tables NAU-3 and NAU-4 14,735.7 tons/year 15,140.0 NA (Setting a PAL) tons/year (pre-project PAL) -13,386.2 tons/year 40 tons/year No NA (Setting a PAL) NA (Setting a PAL) NO X * Maximum Future Potential Emission Rate Following Unit 1 and Unit 2 low-no X projects NO X (Unit 3 Only) Tables NAU-3 and NAU-4 14,735.7 tons/year 11,104.7 * tons/year (post-project PAL) Tables NAU-3 and NAU-4 6,223.0 tons/year NA (Setting a PAL) -3,631.0 tons/year 40 tons/year No NA (Setting a PAL) Heat Input Tables NAU-5 and NAU-10 58,799,851 MMBtu/year 69,642,000 MMBtu/year Coal Burn Tables NAU-6 and NAU-10 2,772,677 tons/year 3,504,014 tons/year Particulate Matter (Stack and Non-Stack Total) Units 1-3 (Unit 1 Future at lb/mmbtu) (Unit 2 Future at lb/mmbtu) (Unit 3 Future at lb/mmbtu) Tables NAU-7 and NAU-8 1,831.7 tons/year 1,681.4 tons/year tons/year 25 tons/year (15 tons/year for PM 10 ) No Hydrogen Fluoride Tables NAU-9 and NAU tons/year 11.3 tons/year tons/year 3 tons/year (fluoride) No Sulfuric Acid Tables NAU-11 and NAU tons/year 12.5 tons/year tons/year 7 tons/year No Lead Tables NAU-13 and NAU tons/year 0.15 tons/year 0.02 tons/year 0.6 tons/year No Carbon Monoxide Tables NAU-15 and NAU tons/year 5,061.7 tons/year 4,368.1 tons/year 100 tons/year Yes VOC Tables NAU-17 and NAU tons/year tons/year 21.9 tons/year 40 tons/year No Note: Carbon monoxide is the only pollutant that has a post-project emission increase above its PSD significance level. 42
44 Permit Assumption Timeline: 2008: Upon Issuance of Construction Permit (a) Upon issuance of the construction permit the existing annual NO X cap of 15,140 tons/year, operating permit condition (F5)(b), becomes a Plantwide Applicability Limitation (PAL) The 15,140 ton/year NO X PAL will be calculated monthly on a 12-month rolling average basis (a) (b) (c) (d) Upon Completion of the Unit 1 and Unit 2 Flue Gas Conditioning System Installations The Unit 1 flue gas conditioning system will be limited to a maximum sulfur trioxide (SO 3 ) injection rate of 8 ppm based on a 30-day rolling average The Unit 2 flue gas conditioning system will be limited to a maximum sulfur trioxide (SO 3 ) injection rate of 8 ppm based on a 30-day rolling average Unit 1 will be subject to a PM 10 limitation of 78 lb/hour (0.042 lb/mmbtu) within 90 days following the completion of the Unit 1 flue gas conditioning system installation Unit 2 will be subject to a PM 10 limitation of 130 lb/hour (0.054 lb/mmbtu) within 90 days following the completion of the Unit 2 flue gas conditioning system installation 2011: Upon Certification of Pollution Control Equipment following the Unit 2 Low-NO X Burner and Flue Gas Desulfurization Projects (a) Unit 2 will be subject to a 12-month rolling average NO X limitation of 0.26 lb/mmbtu (b) Unit 2 will be subject to a 12-month rolling average SO 2 limitation of 0.15 lb/mmbtu (c) Unit 2 will be subject to a 3-hour fixed block average SO 2 limitation of 1,080 lb/hour (d) Unit 2 will be subject to a 30-day rolling average CO limitation of 0.25 lb/mmbtu (600 lb/hour) 2012: Upon Certification of Pollution Control Equipment following Unit 1 Low-NO X Burner and Flue Gas Desulfurization Projects (a) Unit 1 will be subject to a 12-month rolling average NO X limitation of 0.26 lb/mmbtu (b) Unit 1 will be subject to a 12-month rolling average SO 2 limitation of 0.15 lb/mmbtu (c) Unit 1 will be subject to a 3-hour fixed block average SO 2 limitation of 833 lb/hour (d) Unit 1 will be subject to a 30-day rolling average CO limitation of 0.25 lb/mmbtu (463 lb/hour) (e) The Naughton Plant will be subject to a NO X PAL of 11,104.7 tons/year (f) The Naughton Plant will be subject to an SO 2 PAL of 8,924.1 tons/year 2014: Upon Certification of Pollution Control Equipment follwong Unit 3 Fabric Filter Baghouse Project (a) Unit 3 will be subject to a PM 10 limitation of 56 lb/hour (0.015 lb/mmbtu) within 90 days following the completion of the Unit 3 fabric filter baghouse installation 43
45 Table NAU - 0 Naughton Past Actual Non-Stack Emissions Evaluation PM (TSP) Emissions (tons/year) Source ID N/A (1) N/A (2) N/A (3) N/A (4) N/A (5) N/A (6) N/A (7) Total Annual Non-Stack PM Emissions (tons/year) Year Year Maximum Past Actual Non-Stack PM Emissions (tons/year) PM 10 Emissions (tons/year) Source ID N/A (1) N/A (2) N/A (3) N/A (4) N/A (5) N/A (6) N/A (7) Total Annual Non-Stack PM 10 Emissions (tons/year) Year Year Maximum Past Actual Non-Stack PM 10 Emissions (tons/year) SO 2 Emissions (tons/year) Source ID N/A (1) N/A (2) N/A (3) N/A (4) N/A (5) N/A (6) N/A (7) Total Annual Non-Stack SO 2 Emissions (tons/year) Year Year Maximum Past Actual Non-Stack SO 2 Emissions (tons/year) NO X Emissions (tons/year) Source ID N/A (1) N/A (2) N/A (3) N/A (4) N/A (5) N/A (6) N/A (7) Total Annual Non-Stack NO X Emissions (tons/year) Year Year Maximum Past Actual Non-Stack NO X Emissions (tons/year) VOC Emissions (tons/year) Source ID N/A (1) N/A (2) N/A (3) N/A (4) N/A (5) N/A (6) N/A (7) Total Annual Non-Stack VOC Emissions (tons/year) Year Year Maximum Past Actual Non-Stack VOC Emissions (tons/year) 44
46 Table NAU - 0 (continued) Naughton Past Actual Non-Stack Emissions Evaluation CO Emissions (tons/year) Source ID N/A (1) N/A (2) N/A (3) N/A (4) N/A (5) N/A (6) N/A (7) Total Annual Non-Stack CO Emissions (tons/year) Year Year Maximum Past Actual Non-Stack CO Emissions (tons/year) Source ID Description 4 Coal Stockpile Reclaim Tunnel (Baghouse) 5 Unit #2 Coal Bunker Exhauster and Conveyor Gallery Area (Baghouse) 6 Unit #3 Coal Bunker Exhauster and Conveyor Gallery Area (Baghouse) 7 Unit #1 Coal Bunker Exhauster (Baghouse) 8 Fly Ash Loadout Silo (Baghouse) 10 Unit #1 Cooling Tower 11 Unit #2 Cooling Tower 12 Unit #3 Cooling Tower 13 Coal Pile Stacker (Drop Operation) 14 Coal Pile Maintenance and Wind Erosion 15 Scrubber Pond SO 2 Emissions 16 Fly Ash Truck Loading (Fugitives) 17 Fly Ash Haul Road 18 Ash Ponds 19 Mine Conveyor Baghouse N/A (1) Diesel-Fired Emergency Generator Engine - Unit 1 N/A (2) Diesel-Fired Emergency Generator Engine - Unit 2 N/A (3) Diesel-Fired Emergency Generator Engine - Unit 3 N/A (4) Diesel-Fired Emergency Generator Engine - FGD N/A (5) Diesel-Fired Emergency Fire Pump Engine N/A (6) Used Oil-Fired Space Heater (350,000 Btu/hour) N/A (7) Used Oil-Fired Space Heater (235,000 Btu/hour) Note: Non-stack emission rates were obtained from 2002 through 2006 annual emission inventories. 45
47 Table NAU - 1 Naughton Past Actual SO 2 Emissions Evaluation Past Actual Monthly SO 2 Emissions from CEMs/Clean Air Markets (tons/month) UNIT NAME Jan-03 Feb-03 Mar-03 Apr-03 May-03 Jun-03 Jul-03 Aug-03 Sep-03 Oct-03 Nov-03 Dec-03 Jan-04 Feb-04 Mar-04 Apr-04 May-04 Jun-04 Jul-04 Aug-04 Sep-04 Oct-04 Naughton Naughton Naughton Naughton Totals 1, , , , , , , , , , , , , , , , , , , , ,936.7 Past Actual Annual SO 2 Emission Rate Based on Rolling 24-Month Period (tons/year) UNIT NAME Jan-03 Feb-03 Mar-03 Apr-03 May-03 Jun-03 Jul-03 Aug-03 Sep-03 Oct-03 Nov-03 Dec-03 Jan-04 Feb-04 Mar-04 Apr-04 May-04 Jun-04 Jul-04 Aug-04 Sep-04 Oct-04 Naughton 1 This is based on a 24-month rolling average so there are no valid averages until December 2004 Naughton 2 This is based on a 24-month rolling average so there are no valid averages until December 2004 Naughton 3 This is based on a 24-month rolling average so there are no valid averages until December 2004 Naughton Totals Table NAU - 1 (continued) Naughton Past Actual SO 2 Emissions Evaluation Past Actual Monthly SO 2 Emissions from CEMs/Clean Air Markets (tons/month) Nov-04 Dec-04 Jan-05 Feb-05 Mar-05 Apr-05 May-05 Jun-05 Jul-05 Aug-05 Sep-05 Oct-05 Nov-05 Dec-05 Jan-06 Feb-06 Mar-06 Apr-06 May-06 Jun-06 Jul-06 Aug-06 Sep , , , , , , , , , , , , , , , , , , , , , , ,714.4 Past Actual Annual SO 2 Emission Rate Based on Rolling 24-Month Period (tons/year) Nov-04 Dec-04 Jan-05 Feb-05 Mar-05 Apr-05 May-05 Jun-05 Jul-05 Aug-05 Sep-05 Oct-05 Nov-05 Dec-05 Jan-06 Feb-06 Mar-06 Apr-06 May-06 Jun-06 Jul-06 Aug-06 Sep-06 6,886 6,912 6, , , , , , , , , , , , , , , , , , , , ,546 8,628 8, , , , , , , , , , , , , , , , , , , , ,204 5,154 5, , , , , , , , , , , , , , , , , , , , ,636 20,695 20, , , , , , , , , , , , , , , , , , , ,
48 Table NAU - 1 (continued) Naughton Past Actual SO 2 Emissions Evaluation Past Actual Monthly SO 2 Emissions from CEMs/Clean Air Markets (tons/month) Oct-06 Nov-06 Dec-06 Jan-07 Feb-07 Mar-07 Apr-07 May-07 Jun-07 Jul-07 Aug-07 Sep-07 Oct-07 Nov-07 Dec , , , , , , , , , , , , , , ,961.8 Past Actual Annual SO 2 Emission Rate Based on Rolling 24-Month Period (tons/year) Oct-06 Nov-06 Dec-06 Jan-07 Feb-07 Mar-07 Apr-07 May-07 Jun-07 Jul-07 Aug-07 Sep-07 Oct-07 Nov-07 Dec-07 7, , , , , , , , , , , , , , , , , , , , , , , , , , , , , , , , , , , , , , , , , , , , , ,126.6 tons/year Maximum Past Actual Unit 3 SO 2 Emission Rate* 21, , , , , , , , , , , , , , , ,289.2 tons/year Maximum Past Actual Stack SO 2 Emission Rate Total Unit 3 SO 2 Emissions from February 2005 through January 2007: 12,253.2 tons Maximum Past Actual Non-Stack SO 2 Emissions Emissions Source Scrubber Pond SO 2 Emissions Diesel-Fired Emergency Generator Engine - Unit 1 Diesel-Fired Emergency Generator Engine - Unit 2 Diesel-Fired Emergency Generator Engine - Unit 3 Diesel-Fired Emergency Generator Engine - FGD Diesel-Fired Emergency Fire Pump Engine Used Oil-Fired Space Heater (350,000 Btu/hour) Used Oil-Fired Space Heater (235,000 Btu/hour) Total Maximum Non-Stack SO 2 Emission Rate (tons/year) Maximum Past Actual Non-Stack Emission Rate (tons/year) Total Maximum Past Actual SO 2 Emission Rate Stack and Non-Stack Emissions (tons/year) 22,310.3 * Note that maximum past actual Unit 3 SO 2 emission rate of 6,126.6 tons/year includes SO 2 emissions in excess of 2-hour SO 2 limit of 0.5 lb/mmbtu. See Table NAU-1a for the calculation of the Unit 3 SO 2 emissions in excess of the 0.5 lb/mmbtu emission limit and calculation of the applicable maximum past actual Unit 3 SO 2 emission rate of 6,070.7 tons/year 47
49 Table NAU - 1a Naughton Past Actual Sulfur Dioxide Emissions in Excess of Allowable Unit 3 Limit Unit 3 SO 2 Emissions in Excess of 2-hour Average 0.5 lb/mmbtu Limit during 24-Month Evaluation Period from February 2005 through January 2007: Date and Time Duration of Excess Emissions (hours) Excess Emission Rate (lb/mmbtu) Heat Input (MMBtu/hour) Excess Emissions Above 0.5 lb/mmbtu Limit (lbs) 2/12/05 2: , /13/05 4: /13/05 6: , /13/05 10: /13/05 12: , /13/05 14: , /13/05 16: , /20/05 8: /20/05 10: , /20/05 12: , /20/05 14: , /22/05 20: , /3/05 22: , /6/05 4: /7/05 16: , /7/05 18: , /28/05 6: , /28/05 8: , /14/05 16: , /14/05 18: ,
50 Table NAU - 1a (continued) Naughton Past Actual Sulfur Dioxide Emissions in Excess of Allowable Unit 3 Limit Date and Time Duration of Excess Emissions (hours) Excess Emission Rate (lb/mmbtu) Heat Input (MMBtu/hour) Excess Emissions Above 0.5 lb/mmbtu Limit (lbs) 6/29/05 0: /29/05 20: , /29/05 22: , /3/05 10: , /5/05 14: /13/05 16: /14/05 20: , /10/05 10: , /10/05 12: /17/05 0: , /27/05 18: /27/05 20: , /1/05 0: /2/05 8: /2/05 10: , /19/05 10: /12/05 14: , /18/05 20: /18/05 22: /21/05 2: /5/05 14: /10/05 0: , /10/05 4:
51 Table NAU - 1a (continued) Naughton Past Actual Sulfur Dioxide Emissions in Excess of Allowable Unit 3 Limit Date and Time Duration of Excess Emissions (hours) Excess Emission Rate (lb/mmbtu) Heat Input (MMBtu/hour) Excess Emissions Above 0.5 lb/mmbtu Limit (lbs) 12/11/05 4: , /11/05 6: , /17/05 0: /20/05 8: , /22/05 12: /22/05 14: , /27/05 22: , /18/06 8: /26/06 14: /9/06 18: /10/06 14: , /10/06 16: , /10/06 18: /12/06 2: , /14/06 10: , /15/06 14: /15/06 16: /8/06 6: /21/06 10: /21/06 12: /29/06 14: , /30/06 8: /17/06 18: ,
52 Table NAU - 1a (continued) Naughton Past Actual Sulfur Dioxide Emissions in Excess of Allowable Unit 3 Limit Date and Time Duration of Excess Emissions (hours) Excess Emission Rate (lb/mmbtu) Heat Input (MMBtu/hour) Excess Emissions Above 0.5 lb/mmbtu Limit (lbs) 3/17/06 20: , /18/06 16: /18/06 18: /18/06 20: , /18/06 22: , /19/06 0: , /19/06 2: /19/06 4: /19/06 6: /19/06 8: /19/06 10: /19/06 12: /19/06 14: /19/06 16: /19/06 18: /19/06 20: /19/06 22: , /20/06 0: /20/06 2: , /20/06 4: , /20/06 6: , /20/06 8: , /9/06 2:
53 Table NAU - 1a (continued) Naughton Past Actual Sulfur Dioxide Emissions in Excess of Allowable Unit 3 Limit Date and Time Duration of Excess Emissions (hours) Excess Emission Rate (lb/mmbtu) Heat Input (MMBtu/hour) Excess Emissions Above 0.5 lb/mmbtu Limit (lbs) 4/9/06 4: , /9/06 6: , /9/06 10: , /9/06 2: /10/06 0: /26/06 18: /28/06 6: /28/06 8: , /31/06 16: , /31/06 20: , /2/06 16: /3/06 12: /3/06 14: , /4/06 0: /27/06 12: /27/06 22: , /29/06 14: , /2/06 22: , /5/06 20: , /14/06 8: , /3/06 0: Total Unit 3 SO 2 Emissions in Excess of Applicable Limit: 223,547.7 lbs 52
54 Table NAU - 1a (continued) Naughton Past Actual Sulfur Dioxide Emissions in Excess of Allowable Unit 3 Limit Total Unit 3 SO 2 Emissions in Excess of Applicable Limit: tons Total Unit 3 SO 2 Emissions During 24-Month Evaluation Period: 12,253.2 tons (Ref. Table NAU-1) Total Unit 3 SO 2 Emissions in Excess of Applicable Limit During 24-Month Evaluation Period: tons Applicable Maximum Unit 3 SO 2 Emissions During 24-Month Evaluation Period: 12,141.4 tons Maximum Unit 3 SO 2 Annual Emission Rate: 6,070.7 tons/year Note: The maximum Naughton Unit 3 past actual SO 2 emission rate (12,253.2 tons during the 24-month evaluation period), future potential Unit 1 emission rate, future potential Unit 2 emission rate, maximum non-stack SO 2 emission rate (21.1 tons/year), Unit 3 SO 2 excess emission rate (111.8 tons during the 24-month evaluation period) and PSD SO 2 significance level of 40 tons/year will be used to set the requested SO 2 PAL value. The maximum Unit 3 SO 2 emission rate of 12,253.2 tons was established during the 24-month evaluation period from February 2005 through January (Reference Table NAU-1) The Unit 3 SO 2 emissions in excess of the applicable 2-hour limit of 0.5 lb/mmbtu during the 24-month evaluation period (111.8 tons) was subtracted from the 12,253.2 tons Unit 3 emission rate during the same time period to establish the maximum past actual Unit 3 annual SO 2 emission rate of 6,070.7 tons/year which will be used in establishing the requested PAL value. 53
55 Table NAU - 2 Naughton Future Potential Sulfur Dioxide Emission Evaluation Step 1: Calculate future potential Unit 1 and Unit 2 SO 2 emissions based on post-scrubber project emission limits Maximum Boiler Heat Input (MMBtu/hour) Post-Project Sulfur Dioxide Emission Limit (lb/mmbtu) Maximum Annual Boiler Operational Time (hours/year) Post-Project Annual Sulfur Dioxide Emission Rate (tons/year) Naughton Unit 1 1, ,760 1,215.5 Naughton Unit 2 2, ,760 1,576.8 Naughton Total (post-project Units 1 and 2 SO 2 emission rate): 2,792.3 Step 2: Identify maximum past actual Unit 3 SO 2 emission rate Maximum Past Actual SO 2 Emission Rate Reference (tons/year) Naughton Unit 3 6,070.7 Table NAU-1a Step 3: Calculate total future potential Units 1, 2 and 3 SO 2 emission rate Post-Project Annual Sulfur Dioxide Emission Rate (tons/year) Naughton Unit 1 1,215.5 Naughton Unit 2 1,576.8 Naughton Unit 3 6,070.7 Total 8,
56 Table NAU - 2 (continued) Naughton Future Potential Sulfur Dioxide Emission Evaluation Step 4: Identify the maximum past actual non-stack SO 2 emission rate Maximum non-stack SO 2 emission rate = 21.1 tons/year Step 5: Establish Plantwide Applicability Limit (PAL) PAL is equivalent to future potential stack and non-stack SO 2 emission rate plus PSD significance threshold Future Potential Sulfur Dioxide Emission Rate (tons/year) Naughton Unit 1 1,215.5 Naughton Unit 2 1,576.8 Naughton Unit 3 6,070.7 Non-Stack 21.1 Total 8,884.1 PSD Significance Threshold for SO 2 = Future Potential SO 2 Emission Rate = 40.0 tons/year 8,884.1 tons/year SO 2 PAL = 8,924.1 tons/year 55
57 Table NAU - 3 Naughton Past Actual NO X Emissions Evaluation Past Actual Monthly NO X Emissions from CEMs/Clean Air Markets (tons/month) UNIT NAME Jan-03 Feb-03 Mar-03 Apr-03 May-03 Jun-03 Jul-03 Aug-03 Sep-03 Oct-03 Nov-03 Dec-03 Jan-04 Feb-04 Mar-04 Apr-04 May-04 Jun-04 Jul-04 Aug-04 Sep-04 Oct-04 Naughton Naughton Naughton Naughton Totals 1, , , , , , , , , , , , , , , , , ,389.3 Past Actual Annual NO X Emission Rate Based on Rolling 24-Month Period (tons/year) UNIT NAME Jan-03 Feb-03 Mar-03 Apr-03 May-03 Jun-03 Jul-03 Aug-03 Sep-03 Oct-03 Nov-03 Dec-03 Jan-04 Feb-04 Mar-04 Apr-04 May-04 Jun-04 Jul-04 Aug-04 Sep-04 Oct-04 Naughton 1 This is based on a 24-month rolling average so there are no valid averages until December 2004 Naughton 2 This is based on a 24-month rolling average so there are no valid averages until December 2004 Naughton 3 This is based on a 24-month rolling average so there are no valid averages until December 2004 Naughton Totals Table NAU - 3 (continued) Naughton Past Actual NO X Emissions Evaluation Past Actual Monthly NO X Emissions from CEMs/Clean Air Markets (tons/month) Nov-04 Dec-04 Jan-05 Feb-05 Mar-05 Apr-05 May-05 Jun-05 Jul-05 Aug-05 Sep-05 Oct-05 Nov-05 Dec-05 Jan-06 Feb-06 Mar-06 Apr-06 May-06 Jun-06 Jul-06 Aug-06 Sep , , , , , , , , , , , , , , , , , , , , ,212.2 Past Actual Annual NO X Emission Rate Based on Rolling 24-Month Period (tons/year) Nov-04 Dec-04 Jan-05 Feb-05 Mar-05 Apr-05 May-05 Jun-05 Jul-05 Aug-05 Sep-05 Oct-05 Nov-05 Dec-05 Jan-06 Feb-06 Mar-06 Apr-06 May-06 Jun-06 Jul-06 Aug-06 Sep-06 3,791 3,793 3, , , , , , , , , , , , , , , , , , , , ,623 4,619 4, , , , , , , , , , , , , , , , , , , , ,818 4,810 4, , , , , , , , , , , , , , , , , , , , ,232 13,222 13, , , , , , , , , , , , , , , , , , , ,
58 Table NAU - 3 (continued) Naughton Past Actual NO X Emissions Evaluation Past Actual Monthly NO X Emissions from CEMs/Clean Air Markets (tons/month) Oct-06 Nov-06 Dec-06 Jan-07 Feb-07 Mar-07 Apr-07 May-07 Jun-07 Jul-07 Aug-07 Sep-07 Oct-07 Nov-07 Dec , , , , , , , , , , , , , ,243.8 Past Actual Annual NO X Emission Rate Based on Rolling 24-Month Period (tons/year) Oct-06 Nov-06 Dec-06 Jan-07 Feb-07 Mar-07 Apr-07 May-07 Jun-07 Jul-07 Aug-07 Sep-07 Oct-07 Nov-07 Dec-07 3, , , , , , , , , , , , , , , , , , , , , , , , , , , , , , , , , , , , , , , , , , , , , ,223.0 tons/year Maximum Past Actual Unit 3 NO X Emission Rate* 14, , , , , , , , , , , , , , , ,733.9 tons/year Maximum Past Actual Stack NO X Emission Rate Maximum Past Actual Non-Stack NO X Emissions Emissions Source Maximum Past Actual Non-Stack Emission Rate (tons/year) Diesel-Fired Emergency Generator Engine - Unit Diesel-Fired Emergency Generator Engine - Unit Diesel-Fired Emergency Generator Engine - Unit Diesel-Fired Emergency Generator Engine - FGD 0.1 Diesel-Fired Emergency Fire Pump Engine 1.2 Used Oil-Fired Space Heater (350,000 Btu/hour) 0.0 Used Oil-Fired Space Heater (235,000 Btu/hour) 0.0 Total Maximum Non-Stack NO X Emission Rate (tons/year) 1.8 Total Maximum Past Actual NO X Emission Rate 14,735.7 * Note that Unit 3 had no NO X emissions in excess of the applicable 3-hour limit of 0.75 lb/mmbtu during the 24-month evaluation period from June 2005 through May
59 Table NAU - 4 Naughton Future Potential Nitrogen Oxides Emission Evaluation Step 1: Calculate future potential Unit 1 and Unit 2 NO X emissions based on post-low-no X project emission limits Maximum Boiler Heat Input (MMBtu/hour) Post-Project Nitrogen Oxides Emission Limit (lb/mmbtu) Maximum Annual Boiler Operational Time (hours/year) Post-Project Annual Nitrogen Oxides Emission Rate (tons/year) Naughton Unit 1 1, ,760 2,106.8 Naughton Unit 2 2, ,760 2,733.1 Naughton Total (post-project Units 1 and 2 NO X emission rate): 4,839.9 Step 2: Identify maximum past actual Unit 3 NO X emission rate Maximum Past Actual NO X Emission Rate Reference (tons/year) Naughton Unit 3 6,223.0 Table NAU-3; May 2007 Step 3: Calculate future potential Units 1, 2 and 3 NO X emission rate Post-Project Annual Nitrogen Oxides Emission Rate (tons/year) Naughton Unit 1 2,106.8 Naughton Unit 2 2,733.1 Naughton Unit 3 6,223.0 Total 11,
60 Table NAU - 4 (continued) Naughton Future Potential Nitrogen Oxides Emission Evaluation Step 4: Identify the maximum past actual non-stack NO X emission rate Maximum non-stack NO X emission rate = 1.8 tons/year Step 5: Establish Plantwide Applicability Limit (PAL) PAL is equivalent to future potential stack and non-stack NO X emission rate plus PSD significance threshold Future Potential NO X Emission Rate (tons/year) Naughton Unit 1 2,106.8 Naughton Unit 2 2,733.1 Naughton Unit 3 6,223.0 Non-Stack 1.8 Total 11,064.7 PSD Significance Threshold for NO X = Future Potential NO X Emission Rate = 40.0 tons/year 11,064.7 tons/year NO X PAL = 11,104.7 tons/year Notes: The Naughton Plant currently has an annual NO X limitation of 15,140 tons/year (Operation Permit condition (F5)(b)) It is requested at issuance of the construction permit that the 15,140 ton/year limit be formally implemented as a PAL on a monthly rolling average basis It is requested that a PAL equivalent to 11,104.7 tons/year be implemented following completion of the Units 1 and 2 low-no X projects 59
61 Table NAU - 5 Naughton Past Actual Heat Input Evaluation Past Actual Monthly Heat Input from CEMs/Clean Air Markets (MMBtu/month) UNIT NAME Jan-03 Feb-03 Mar-03 Apr-03 May-03 Jun-03 Jul-03 Aug-03 Sep-03 Oct-03 Nov-03 Dec-03 Jan-04 Feb-04 Mar-04 Apr-04 May-04 Jun-04 Jul-04 Aug-04 Sep-04 Naughton 1 1,294,944 1,003,584 1,273,102 1,230,672 1,277,089 1,207,853 1,209,574 1,191,120 1,178,838 1,254,367 1,242,887 1,041,059 1,160,593 1,176,046 1,226, , ,938 1,075,053 1,147,567 1,174,991 1,168,374 Naughton 2 1,597,810 1,478,366 1,677,476 1,435,452 1,489,351 1,525,335 1,607,850 1,495, , , ,448 1,374,396 1,439,023 1,494,048 1,476,692 1,360,533 1,145,184 1,493,725 1,485,937 1,526,302 1,384,534 Naughton 3 2,635,252 1,846,594 2,183,646 2,260,171 2,145,359 1,974,465 2,074,575 2,145, ,587 85, ,882 2,106,129 2,345,306 2,020,169 2,169,526 2,323,089 2,230,939 2,316,064 1,905,625 2,353,271 2,268,220 Naughton Totals 5,528,006 4,328,544 5,134,224 4,926,295 4,911,799 4,707,653 4,891,999 4,831,834 2,817,525 2,049,424 3,125,217 4,521,584 4,944,922 4,690,263 4,873,159 4,045,084 4,180,061 4,884,842 4,539,129 5,054,564 4,821,128 Past Actual Annual Heat Input Rate Based on Rolling 24-Month Period (tons/year) UNIT NAME Jan-03 Feb-03 Mar-03 Apr-03 May-03 Jun-03 Jul-03 Aug-03 Sep-03 Oct-03 Nov-03 Dec-03 Jan-04 Feb-04 Mar-04 Apr-04 May-04 Jun-04 Jul-04 Aug-04 Sep-04 Naughton 1 This is based on a 24-month rolling average so there are no valid averages until December 2004 Naughton 2 This is based on a 24-month rolling average so there are no valid averages until December 2004 Naughton 3 This is based on a 24-month rolling average so there are no valid averages until December 2004 Naughton Totals Table NAU - 5 (continued) Naughton Past Actual Heat Input Evaluation Past Actual Monthly Heat Input from CEMs/Clean Air Markets (MMBtu/month) Oct-04 Nov-04 Dec-04 Jan-05 Feb-05 Mar-05 Apr-05 May-05 Jun-05 Jul-05 Aug-05 Sep-05 Oct-05 Nov-05 Dec-05 Jan-06 Feb-06 Mar-06 Apr-06 May-06 Jun-06 Jul-06 Aug-06 1,244,155 1,188,997 1,264,996 1,280,663 1,142,563 1,195,781 1,280,757 1,301,677 1,241, ,782 1,314,432 1,200,479 1,087,738 1,295,847 1,301,000 1,176,042 1,226,501 1,245, ,716 1,083, , ,786 1,115,562 1,599,692 1,264,876 1,341,274 1,719,047 1,380,366 1,520,184 1,448,550 1,503,076 1,420,464 1,464,974 1,370,327 1,414,879 1,596,210 1,380,097 1,568,770 1,550,247 1,313,041 1,531, ,638 1,152,580 1,254,694 1,571,268 2,582,552 2,351,186 2,336,824 2,340,641 2,206,210 2,220,881 2,573,705 2,037,622 2,522,629 2,734,986 2,564,277 1,450,196 2,517,163 1,831,574 1,994,181 2,536,488 2,334,746 2,672,206 2,254,707 2,335,676 2,415,910 2,481,054 2,623,109 5,426,399 4,805,059 4,943,094 5,340,351 4,729,139 4,936,846 5,303,012 4,842,375 5,184,459 5,090,742 5,249,036 4,065,554 5,201,111 4,507,518 4,863,951 5,262,777 4,874,288 5,449,183 3,566,061 3,418,792 4,553,248 4,705,534 5,309,939 Past Actual Annual Heat Input Rate Based on Rolling 24-Month Period (tons/year) Oct-04 Nov-04 Dec-04 Jan-05 Feb-05 Mar-05 Apr-05 May-05 Jun-05 Jul-05 Aug-05 Sep-05 Oct-05 Nov-05 Dec-05 Jan-06 Feb-06 Mar-06 Apr-06 May-06 Jun-06 Jul-06 Aug-06 13,699,101 13,691,961 13,761,450 13,722,790 13,747,832 13,760,126 13,776,883 13,617,487 13,679,143 13,689,963 13,606,649 13,633,129 13,763,099 13,770,824 13,796,051 13,805,514 14,114,641 14,254,230 14,209,083 14,120,192 14,090,478 16,613,181 16,673,799 16,624,799 16,546,153 16,552,702 16,559,565 16,507,129 16,435,691 16,373,105 16,626,495 17,069,871 17,302,195 17,399,382 17,454,994 17,364,491 17,391,700 16,877,252 16,304,660 16,134,088 16,018,466 16,040,949 24,178,623 24,031,317 24,211,125 24,229,743 24,386,510 24,332,641 24,606,723 24,936,929 25,146,460 25,506,264 26,722,046 27,154,392 27,098,418 27,194,009 27,351,298 27,602,638 27,568,447 27,620,815 27,670,738 27,958,453 28,093,372 54,490,904 54,397,077 54,597,374 54,498,685 54,687,044 54,652,332 54,890,735 54,990,106 55,198,707 55,822,722 57,398,565 58,089,716 58,260,899 58,419,827 58,511,839 58,799,851 58,560,340 58,179,705 58,013,908 58,097,111 58,224,798 Table NAU - 5 (continued) Naughton Past Actual Heat Input Evaluation Past Actual Monthly Heat Input from CEMs/Clean Air Markets (MMBtu/month) Sep-06 Oct-06 Nov-06 Dec-06 Jan-07 Feb-07 Mar-07 Apr-07 May-07 Jun-07 Jul-07 Aug-07 Sep-07 Oct-07 Nov-07 Dec , ,309 1,022,240 1,031,650 1,179,272 1,053,101 88, ,055 1,262, ,238 1,279,550 1,222,662 1,119,029 1,247,237 1,168,470 1,236,937 1,561,862 1,421,013 1,571,711 1,622,385 1,496,528 1,567,524 1,632,879 1,413,787 1,496,735 1,436,939 1,585,002 1,303,218 1,249,838 1,426,226 1,416,288 1,576,050 2,384,202 2,350,146 2,368,781 2,732,835 2,705,513 2,006,625 2,428,674 2,056,551 2,728,582 2,630,559 2,467,283 2,602,624 2,652,347 2,443,353 2,172,911 2,304,276 4,920,595 4,744,468 4,962,732 5,386,870 5,381,313 4,627,250 4,150,484 4,328,393 5,487,552 5,029,736 5,331,835 5,128,504 5,021,214 5,116,815 4,757,669 5,117,264 Past Actual Annual Heat Input Rate Based on Rolling 24-Month Period (tons/year) Sep-06 Oct-06 Nov-06 Dec-06 Jan-07 Feb-07 Mar-07 Apr-07 May-07 Jun-07 Jul-07 Aug-07 Sep-07 Oct-07 Nov-07 Dec-07 13,993,556 13,858,133 13,774,755 13,658,082 13,607,386 13,562,655 13,009,230 12,797,879 12,778,158 12,638,594 12,832,978 12,787,093 12,746,368 12,826,118 12,762,429 12,730,398 14,254,230 MMBtu/year Maximum Past Actual Unit 1 Heat Input 16,129,613 16,040,274 16,193,691 16,334,247 16,222,987 16,316,566 16,372,914 16,355,532 16,352,362 16,360,599 16,420,613 16,387,059 16,304,538 16,219,546 16,237,641 16,241,282 17,454,994 MMBtu/year Maximum Past Actual Unit 2 Heat Input 28,151,363 28,035,160 28,043,957 28,241,963 28,424,399 28,324,606 28,428,503 28,169,926 28,515,406 28,569,371 28,435,519 28,454,693 29,055,768 29,018,863 29,189,531 29,344,579 29,344,579 MMBtu/year Maximum Past Actual Unit 3 Heat Input 58,274,532 57,933,566 58,012,403 58,234,291 58,254,772 58,203,827 57,810,646 57,323,337 57,645,925 57,568,564 57,689,110 57,628,844 58,106,674 58,064,526 58,189,602 58,316,258 Maximum 12 month ave based on 24-month period 58,799,851 MMBtu/year Past Actual Heat Input 60
62 Table NAU - 6 Past Actual Coal Burn Evaluation Past Actual Monthly Coal Burn (tons/month) UNIT NAME Jan-03 Feb-03 Mar-03 Apr-03 May-03 Jun-03 Jul-03 Aug-03 Sep-03 Oct-03 Nov-03 Dec-03 Jan-04 Feb-04 Mar-04 Apr-04 May-04 Jun-04 Jul-04 Aug-04 Sep-04 Naughton 1 63,339 46,772 61,366 58,893 60,016 58,437 58,184 57,589 57,091 59,303 55,476 47,016 56,738 56,245 63,211 14,794 39,219 53,336 55,623 57,467 57,387 Naughton 2 78,922 69,404 76,731 70,146 71,227 75,568 81,111 74,311 42,996 34,066 41,751 68,921 73,651 70,244 75,083 57,676 55,278 74,815 72,755 74,805 66,564 Naughton 3 123,121 82, , , , , , ,919 37, , , ,298 99, ,518 98, , ,295 98, , ,006 Naughton Totals 265, , , , , , , , ,435 94, , , , , , , , , , , ,957 Past Actual Annual Coal Burn Rate Based on Rolling 24-Month Period (tons/year) UNIT NAME Jan-03 Feb-03 Mar-03 Apr-03 May-03 Jun-03 Jul-03 Aug-03 Sep-03 Oct-03 Nov-03 Dec-03 Jan-04 Feb-04 Mar-04 Apr-04 May-04 Jun-04 Jul-04 Aug-04 Sep-04 Naughton 1 This is based on a 24-month rolling average so there are no valid averages until December 2004 Naughton 2 This is based on a 24-month rolling average so there are no valid averages until December 2004 Naughton 3 This is based on a 24-month rolling average so there are no valid averages until December 2004 Naughton Totals Table NAU - 6 (continued) Past Actual Coal Burn Evaluation Past Actual Monthly Coal Burn (tons/month) Oct-04 Nov-04 Dec-04 Jan-05 Feb-05 Mar-05 Apr-05 May-05 Jun-05 Jul-05 Aug-05 Sep-05 Oct-05 Nov-05 Dec-05 Jan-06 Feb-06 Mar-06 Apr-06 May-06 Jun-06 Jul-06 Aug-06 61,320 58,160 62,015 61,182 56,737 55,750 55,781 58,953 56,399 38,798 59,290 53,622 46,449 55,402 55,372 53,990 55,004 60,394 48,704 53,458 48,193 45,837 54,521 77,800 70,649 61,798 73,999 62,924 71,486 68,268 75,328 71,747 73,523 71,696 67,334 70,756 58,620 67,708 77,785 61,615 71,407 15, ,695 70,328 81, , , , , , , ,998 89, , , ,091 73, ,593 72,846 80, , , ,164 96,749 99, , , , , , , , , , , , , , , , , , , , , , , , , , ,677 Past Actual Annual Coal Burn Rate Based on Rolling 24-Month Period (tons/year) Oct-04 Nov-04 Dec-04 Jan-05 Feb-05 Mar-05 Apr-05 May-05 Jun-05 Jul-05 Aug-05 Sep-05 Oct-05 Nov-05 Dec-05 Jan-06 Feb-06 Mar-06 Apr-06 May-06 Jun-06 Jul-06 Aug , , , , , , , , , , , , , , , , , , , , , , , , , , , , , , , , , , , , , , , , , ,683 1,219,685 1,212,398 1,223,533 1,217,846 1,217,038 1,203,294 1,205,219 1,212,558 1,218,144 1,236,086 1,291,516 1,299,371 1,284,946 1,286,131 1,288,002 1,286,325 1,285,455 1,279,648 1,270,350 1,273,204 1,266,812 2,687,319 2,676,492 2,689,370 2,678,252 2,674,949 2,662,724 2,661,720 2,655,571 2,660,700 2,689,077 2,756,425 2,772,677 2,761,824 2,763,701 2,760,638 2,755,714 2,750,762 2,724,435 2,705,505 2,702,253 2,697,854 Table NAU - 6 (continued) Past Actual Coal Burn Evaluation Past Actual Monthly Coal Burn (tons/month) Sep-06 Oct-06 Nov-06 Dec-06 Jan-07 Feb-07 Mar-07 Apr-07 May-07 Jun-07 Jul-07 Aug-07 Sep-07 Oct-07 Nov-07 Dec-07 44,961 45,289 49,289 47,969 54,109 48,082 3,830 37,925 55,935 42,189 55,852 55,140 49,639 57,109 54,251 57,396 78,379 71,338 77,708 79,175 68,855 77,016 84,245 73,828 74,167 70,361 78,670 73,988 66,568 74,332 72,572 77, , , , , ,294 77,803 96,676 89, , , , , , , , , , , , , , , , , , , , , , , , ,982 Past Actual Annual Coal Burn Rate Based on Rolling 24-Month Period (tons/year) Sep-06 Oct-06 Nov-06 Dec-06 Jan-07 Feb-07 Mar-07 Apr-07 May-07 Jun-07 Jul-07 Aug-07 Sep-07 Oct-07 Nov-07 Dec , , , , , , , , , , , , , , , , , , , , , , , , , , , , , , , ,182 1,260,145 1,249,601 1,247,189 1,256,199 1,259,573 1,245,878 1,243,396 1,229,038 1,246,658 1,251,223 1,241,313 1,233,928 1,255,319 1,257,260 1,271,455 1,288,149 2,690,882 2,669,091 2,665,772 2,676,449 2,673,714 2,662,739 2,640,676 2,620,169 2,635,700 2,632,467 2,633,657 2,625,343 2,644,360 2,653,419 2,674,014 2,696,864 Maximum 12 month ave based on 24-month period 2,772,677 tons/year Past Actual Coal Burn 61
63 Table NAU - 7 Naughton Past Actual Particulate Matter Emission Evaluation Past Actual Monthly Heat Input from CEMs/Clean Air Markets (MMBtu/month) UNIT NAME Jan-03 Feb-03 Mar-03 Apr-03 May-03 Jun-03 Jul-03 Aug-03 Sep-03 Oct-03 Nov-03 Dec-03 Jan-04 Feb-04 Mar-04 Apr-04 May-04 Jun-04 Jul-04 Aug-04 Sep-04 Oct-04 Nov-04 Dec-04 Jan-05 Feb-05 Naughton 1 1,294,944 1,003,584 1,273,102 1,230,672 1,277,089 1,207,853 1,209,574 1,191,120 1,178,838 1,254,367 1,242,887 1,041,059 1,160,593 1,176,046 1,226, , ,938 1,075,053 1,147,567 1,174,991 1,168,374 1,244,155 1,188,997 1,264,996 1,280,663 1,142,563 Naughton 2 1,597,810 1,478,366 1,677,476 1,435,452 1,489,351 1,525,335 1,607,850 1,495, , , ,448 1,374,396 1,439,023 1,494,048 1,476,692 1,360,533 1,145,184 1,493,725 1,485,937 1,526,302 1,384,534 1,599,692 1,264,876 1,341,274 1,719,047 1,380,366 Naughton 3 2,635,252 1,846,594 2,183,646 2,260,171 2,145,359 1,974,465 2,074,575 2,145, ,587 85, ,882 2,106,129 2,345,306 2,020,169 2,169,526 2,323,089 2,230,939 2,316,064 1,905,625 2,353,271 2,268,220 2,582,552 2,351,186 2,336,824 2,340,641 2,206,210 Naughton Totals 5,528,006 4,328,544 5,134,224 4,926,295 4,911,799 4,707,653 4,891,999 4,831,834 2,817,525 2,049,424 3,125,217 4,521,584 4,944,922 4,690,263 4,873,159 4,045,084 4,180,061 4,884,842 4,539,129 5,054,564 4,821,128 5,426,399 4,805,059 4,943,094 5,340,351 4,729,139 Past Actual Monthly Particulate Matter Emission Rate from Annual Stack Testing (lb/mmbtu) UNIT NAME Jan-03 Feb-03 Mar-03 Apr-03 May-03 Jun-03 Jul-03 Aug-03 Sep-03 Oct-03 Nov-03 Dec-03 Jan-04 Feb-04 Mar-04 Apr-04 May-04 Jun-04 Jul-04 Aug-04 Sep-04 Oct-04 Nov-04 Dec-04 Jan-05 Feb-05 Naughton Naughton Naughton Monthly Particulate Matter Emission Rate (obtained by multiplying monthly heat input times particulate matter emission rate) tons/month UNIT NAME Jan-03 Feb-03 Mar-03 Apr-03 May-03 Jun-03 Jul-03 Aug-03 Sep-03 Oct-03 Nov-03 Dec-03 Jan-04 Feb-04 Mar-04 Apr-04 May-04 Jun-04 Jul-04 Aug-04 Sep-04 Oct-04 Nov-04 Dec-04 Jan-05 Feb-05 Naughton Naughton Naughton Naughton Totals Past Actual Annual Particulate Matter Emission Rate Based on Rolling 24-Month Period (tons/year) UNIT NAME Jan-03 Feb-03 Mar-03 Apr-03 May-03 Jun-03 Jul-03 Aug-03 Sep-03 Oct-03 Nov-03 Dec-03 Jan-04 Feb-04 Mar-04 Apr-04 May-04 Jun-04 Jul-04 Aug-04 Sep-04 Oct-04 Nov-04 Dec-04 Jan-05 Feb-05 Naughton 1 This is based on a 24-month rolling average so there are no valid averages until December Naughton 2 This is based on a 24-month rolling average so there are no valid averages until December Naughton 3 This is based on a 24-month rolling average so there are no valid averages until December Naughton Totals Table NAU - 7 (continued) Naughton Past Actual Particulate Matter Emission Evaluation Past Actual Monthly Heat Input from CEMs/Clean Air Markets (MMBtu/month) Mar-05 Apr-05 May-05 Jun-05 Jul-05 Aug-05 Sep-05 Oct-05 Nov-05 Dec-05 Jan-06 Feb-06 Mar-06 Apr-06 May-06 Jun-06 Jul-06 Aug-06 Sep-06 Oct-06 Nov-06 Dec-06 Jan-07 Feb-07 Mar-07 Apr-07 May-07 Jun-07 1,195,781 1,280,757 1,301,677 1,241, ,782 1,314,432 1,200,479 1,087,738 1,295,847 1,301,000 1,176,042 1,226,501 1,245, ,716 1,083, , ,786 1,115, , ,309 1,022,240 1,031,650 1,179,272 1,053,101 88, ,055 1,262, ,238 1,520,184 1,448,550 1,503,076 1,420,464 1,464,974 1,370,327 1,414,879 1,596,210 1,380,097 1,568,770 1,550,247 1,313,041 1,531, ,638 1,152,580 1,254,694 1,571,268 1,561,862 1,421,013 1,571,711 1,622,385 1,496,528 1,567,524 1,632,879 1,413,787 1,496,735 1,436,939 2,220,881 2,573,705 2,037,622 2,522,629 2,734,986 2,564,277 1,450,196 2,517,163 1,831,574 1,994,181 2,536,488 2,334,746 2,672,206 2,254,707 2,335,676 2,415,910 2,481,054 2,623,109 2,384,202 2,350,146 2,368,781 2,732,835 2,705,513 2,006,625 2,428,674 2,056,551 2,728,582 2,630,559 4,936,846 5,303,012 4,842,375 5,184,459 5,090,742 5,249,036 4,065,554 5,201,111 4,507,518 4,863,951 5,262,777 4,874,288 5,449,183 3,566,061 3,418,792 4,553,248 4,705,534 5,309,939 4,920,595 4,744,468 4,962,732 5,386,870 5,381,313 4,627,250 4,150,484 4,328,393 5,487,552 5,029,736 Past Actual Monthly Particulate Matter Emission Rate from Annual Stack Testing (lb/mmbtu) Mar-05 Apr-05 May-05 Jun-05 Jul-05 Aug-05 Sep-05 Oct-05 Nov-05 Dec-05 Jan-06 Feb-06 Mar-06 Apr-06 May-06 Jun-06 Jul-06 Aug-06 Sep-06 Oct-06 Nov-06 Dec-06 Jan-07 Feb-07 Mar-07 Apr-07 May-07 Jun Monthly Particulate Matter Emission Rate (obtained by multiplying monthly heat input times particulate matter emission rate) tons/month Mar-05 Apr-05 May-05 Jun-05 Jul-05 Aug-05 Sep-05 Oct-05 Nov-05 Dec-05 Jan-06 Feb-06 Mar-06 Apr-06 May-06 Jun-06 Jul-06 Aug-06 Sep-06 Oct-06 Nov-06 Dec-06 Jan-07 Feb-07 Mar-07 Apr-07 May-07 Jun Past Actual Annual Particulate Matter Emission Rate Based on Rolling 24-Month Period (tons/year) Mar-05 Apr-05 May-05 Jun-05 Jul-05 Aug-05 Sep-05 Oct-05 Nov-05 Dec-05 Jan-06 Feb-06 Mar-06 Apr-06 May-06 Jun-06 Jul-06 Aug-06 Sep-06 Oct-06 Nov-06 Dec-06 Jan-07 Feb-07 Mar-07 Apr-07 May-07 Jun ,
64 Table NAU - 7 (continued) Naughton Past Actual Particulate Matter Emission Evaluation Past Actual Monthly Heat Input from CEMs/Clean Air Markets (MMBtu/month) Jul-07 Aug-07 Sep-07 Oct-07 Nov-07 Dec-07 1,279,550 1,222,662 1,119,029 1,247,237 1,168,470 1,236,937 1,585,002 1,303,218 1,249,838 1,426,226 1,416,288 1,576,050 2,467,283 2,602,624 2,652,347 2,443,353 2,172,911 2,304,276 5,331,835 5,128,504 5,021,214 5,116,815 4,757,669 5,117,264 Past Actual Monthly Particulate Matter Emission Rate from Annual Stack Testing (lb/mmbtu) Jul-07 Aug-07 Sep-07 Oct-07 Nov-07 Dec Monthly Particulate Matter Emission Rate (obtained by multiplying monthly heat input times particulate matter emission rate) tons/month Jul-07 Aug-07 Sep-07 Oct-07 Nov-07 Dec Past Actual Annual Particulate Matter Emission Rate Based on Rolling 24-Month Period (tons/year) Jul-07 Aug-07 Sep-07 Oct-07 Nov-07 Dec tons/year Past Actual Unit 1 Particulate Matter Emission Rate tons/year Past Actual Unit 2 Particulate Matter Emission Rate tons/year Past Actual Unit 3 Particulate Matter Emission Rate 1, , , , , ,301.4 Maximum 12 month ave based on 24-month period 1,301.4 tons/year Past Actual Stack PM 10 Emission Rate Maximum Past Actual Non-Stack PM 10 Emissions Maximum Past Actual Emissions Source Non-Stack PM 10 Emission Rate (tons/year) Coal Stockpile Reclaim Tunnel (Baghouse) 9.3 Unit #2 Coal Bunker Exhauster and Conveyor (Baghouse) 5.6 Unit #3 Coal Bunker Exhauster and Conveyor (Baghouse) 3.8 Unit #1 Coal Bunker Exhauster (Baghouse) 0.7 Fly Ash Loadout Silo (Baghouse) 0.0 Unit #1 Cooling Tower 52.1 Unit #2 Cooling Tower 72.8 Unit #3 Cooling Tower 94.1 Coal Pile Stacker (Drop Operation) 0.2 Coal Pile Maintenance and Wind Erosion 66.8 Fly Ash Truck Loading (Fugitives) 0.1 Fly Ash Haul Road 0.4 Ash Ponds Mine Conveyor Baghouse 1.5 Diesel-Fired Emergency Generator Engine - Unit Diesel-Fired Emergency Generator Engine - Unit Diesel-Fired Emergency Generator Engine - Unit Diesel-Fired Emergency Generator Engine - FGD 0.0 Diesel-Fired Emergency Fire Pump Engine 0.1 Used Oil-Fired Space Heater (350,000 Btu/hour) 0.0 Used Oil-Fired Space Heater (235,000 Btu/hour) 0.0 Total Maximum Non-Stack PM 10 Emission Rate (tons/year) Total Maximum Past Actual PM 10 Emission Rate Stack and Non-Stack Emissions (tons/year) 1,831.7 (Past actual stack emission rate of 1,301.4 tons/year plus non-stack emission rate of tons/year) 63
65 Table NAU - 8 Naughton Future Potential Particulate Matter Emission Evaluation Maximum Potential Pre-Project Particulate Matter Emission Rates (based on maximum boiler heat input rates and pre-project particulate matter emission limits) Maximum Boiler Heat Input (I) (MMBtu/hour) Pre-Project Particulate Matter Emission Limit* (lb/mmbtu) Maximum Annual Boiler Operational Time (hours/year) Pre-Project Maximum Annual Particulate Matter Emission Rate (tons/year) Naughton Unit 1 1, ,760 1,957.2 Naughton Unit 2 2, ,760 2,426.4 Naughton Unit 3 3, ,760 3,468.9 Non-Stack NA NA NA Naughton Total Potential Stack PM 10 Emission Rate (pre-project PM 10 rate): 8,382.8 * Particulate Matter Emission Limit = /I Requested Post-Project Particulate Matter Emission Rates (following installation of Unit 1 and Unit 2 flue gas conditioning systems and Unit 3 fabric filter baghouse) Maximum Boiler Heat Input (MMBtu/hour) Post-Project Particulate Matter Emission Limit (lb/mmbtu) Maximum Annual Boiler Operational Time (hours/year) Post-Project Annual Particulate Matter Emission Rate (tons/year) Naughton Unit 1 1, , Naughton Unit 2 2, , Naughton Unit 3 3, , Non-Stack NA NA NA Naughton Total (post-project PM 10 rate): 1,681.4 Note: The future potential Unit 1, Unit 2 and Unit 3 PM 10 annual emission rates (tons/year) are based on the requested annual PM 10 emission limits (lb/mmbtu) and maximum boiler heat input rates (MMBtu/hour). The requested Unit 1 PM 10 emission limit of lb/mmbtu and Unit 2 limit of lb/mmbtu are based on the maximum past actual PM 10 emission rates and boiler heat input rates. Requested PM 10 Emission Rate Summary: A lb/mmbtu Unit 1 PM 10 limit is established following installation of Unit 1 flue gas conditioning system in 2008 A lb/mmbtu Unit 2 PM 10 limit is established following installation of Unit 2 flue gas conditioning system in 2008 A lb/mmbtu Unit 3 PM 10 limit is established following installation of Unit 3 baghouse in
66 Table NAU - 9 Naughton Past Actual Hydrogen Fluoride Emission Evaluation M HF = F comb x 2000 lb/ton x C HF x 1/10 6 x F acid Where: Mfg HF = Manufacture of Hydrogen Fluoride, lb/year F comb = Coal combustion, tons/year F comb = 640,447 tons/year (Unit 1) Note: Maximum annual coal burn rates from November 2005; F comb = 832,859 tons/year (Unit 2) Table NAU - 6 F comb = 1,299,371 tons/year (Unit 3) C HF = Average Unit 1 fluoride concentration in coal, ppm (no scrubber, no bypass) C HF = Average Unit 2 fluoride concentration in coal, ppm (no scrubber, no bypass) C HF = Average Unit 3 fluoride concentration in coal, ppm (FGD scrubber, no bypass) F Bypass = 0.00 Unit 1 F Bypass = 0.00 Unit 2 F Bypass = 0.00 Unit 3 F acid = M HF /M F Acid conversion factor: ratio of molecular weights, compound/parent chemical M F = Molecular weight of fluorine M HF = Molecular weight of hydrogen fluoride F acid = AR = Annual release of hydrogen fluoride, lb/year EF FGD = 6% HF emission factor for FGD systems EF No FGD = 50% HF emission factor without FGD AR = Mfg * (EF/100) AR FGD Removal = (1.0 - F Bypass ) x E FGD x M HF AR Bypass = F Bypass x EF NoFGD x M HF AR Total = AR FGD Removal + AR Bypass 65
67 Table NAU - 9 (continued) Naughton Past Actual Hydrogen Fluoride Emission Evaluation Historical Coal Fluoride Concentrations (Parts Per Million) Average Fluoride Concentration ppm Naughton Naughton Naughton Mfg HF = (Coal, tons/year)*(2000 lb/ton)*(c HF ppm)*(1/10 6 ) F acid Mfg HF Unit 1 = Mfg HF Unit 2 = Mfg HF Unit 3 = 68,081.9 lbs/year 88,535.9 lbs/year 141,729.3 lbs/year AR = Mfg HF Unit 1 * (EF/100) AR = 34,041.0 Unit 1 lbs/year AR = Mfg HF Unit 2 * (EF/100) AR = 44,268.0 Unit 2 lbs/year AR FGD Removal = (1.0 - F Bypass ) x EF FGD x Mfg HF AR FGD Removal = ( ) x (0.06) x (141,729) AR FGD Removal = AR Bypass = 8,503.8 lbs/year 0.0 lbs/year AR Total = AR FGD Removal + AR Bypass AR Total = 8,503.8 Unit 3 lbs/year 66
68 Table NAU - 9 (continued) Naughton Past Actual Hydrogen Fluoride Emission Evaluation Maximum Past Actual Hydrogen Fluoride Emissions Naughton Unit 1 Naughton Unit 2 Naughton Unit 3 Total Past HF Rate: 34,041.0 lbs/year 44,268.0 lbs/year 8,503.8 lbs/year 86,812.7 lbs/year 43.4 tons/year Calculation Method: EPRI LARK-TRIPP Calculation and Methods for Threshold Determination and Release Estimates HF Emission Factor with FGD System: 6% Subbituminous Coal Emission Factor: 50% (Table 5-1 Emission Factors for HCL and HF) 67
69 Table NAU - 10 Naughton Future Potential Coal Burn and Hydrogen Fluoride Emission Evaluation Annual Average Coal Heating Value (Btu/lb) Average Coal Heating Value (Btu/lb) Naughton Unit 1 10, , , , , ,936.5 Naughton Unit 2 10, , , , , ,931.2 Naughton Unit 3 10, , , , , ,942.0 Maximum Potential Annual Coal Burn Rate Maximum Boiler Heat Input (MMBtu/hour) Naughton Unit 1 1,850 Naughton Unit 2 2,400 Naughton Unit 3 3,700 Totals Maximum Annual Heat Input at 8760 hours/year* (MMBtu/year) Average Coal Heating Value (Btu/lb) Maximum Potential Annual Coal Burn* (tons/year) 16,206,000 21,024,000 9, , ,476 1,058,479 32,412,000 9, ,630,059 69,642,000 3,504,014 * Maximum potential annual heat input and coal burn rates used in future potential H 2 SO 4, lead and HF emission calculations 68
70 Table NAU - 10 (continued) Naughton Future Potential Coal Burn and Hydrogen Fluoride Emission Evaluation M HF = F comb x 2000 lb/ton x C HF x 1/10 6 x F acid Where: Mfg HF = Manufacture of Hydrogen Fluoride, lb/year F comb = Coal combustion, tons/year F comb = 815,476 tons/year (Unit 1 future potential coal burn rate) F comb = 1,058,479 tons/year (Unit 2 future potential coal burn rate) F comb = 1,630,059 tons/year (Unit 3 future potential coal burn rate) C HF = Average Unit 1 fluoride concentration in coal, ppm (FGD scrubber, no bypass) C HF = Average Unit 2 fluoride concentration in coal, ppm (FGD scrubber, no bypass) C HF = Average Unit 3 fluoride concentration in coal, ppm (FGD scrubber, no bypass) F Bypass = 0.00 Unit 1 F Bypass = 0.00 Unit 2 F Bypass = 0.00 Unit 3 F acid = M HF /M F Acid conversion factor: ratio of molecular weights, compound/parent chemical M F = Molecular weight of fluorine M HF = Molecular weight of hydrogen fluoride F acid = AR = Annual release of hydrogen fluoride, lb/year EF FGD = 6% HF emission factor for FGD systems EF No FGD = 50% HF emission factor without FGD AR = Mfg * (EF/100) AR FGD Removal = (1.0 - F Bypass ) x E FGD x M HF AR Bypass = F Bypass x EF NoFGD x M HF AR Total = AR FGD Removal + AR Bypass 69
71 Table NAU - 10 (continued) Naughton Future Potential Coal Burn and Hydrogen Fluoride Emission Evaluation Historical Coal Fluoride Concentrations (Parts Per Million) Average Fluoride Concentration ppm Naughton Naughton Naughton Mfg HF = (Coal, tons/year)*(2000 lb/ton)*(c HF ppm)*(1/10 6 ) F acid Mfg HF Unit 1 = Mfg HF Unit 2 = Mfg HF Unit 3 = 86,688.1 lbs/year 112,520.3 lbs/year 177,799.2 lbs/year AR FGD Removal = (1.0 - F Bypass ) x EF FGD x Mfg HF AR FGD Removal Unit 1 = ( ) x (0.06) x (86,688) AR FGD Removal = 5,201.3 lbs/year AR Bypass = 0.0 lbs/year AR Total = AR FGD Removal + AR Bypass AR Total = 5,201.3 Unit 1 lbs/year AR FGD Removal Unit 2 = ( ) x (0.06) x (112,520) AR FGD Removal = AR Bypass = AR Total = AR FGD Removal + AR Bypass AR Total = 6,751.2 lbs/year 6,751.2 Unit 2 lbs/year 0.0 lbs/year 70
72 Table NAU - 10 (continued) Naughton Future Potential Coal Burn and Hydrogen Fluoride Emission Evaluation AR FGD Removal Unit 3 = ( ) x (0.06) x (177,799) AR FGD Removal = 10,668.0 lbs/year AR Bypass = 0.0 lbs/year AR Total = AR FGD Removal + AR Bypass AR Total = 10,668.0 Unit 3 lbs/year Maximum Future Potential Hydrogen Fluoride Emissions Naughton Unit 1 5,201.3 lbs/year Naughton Unit 2 6,751.2 lbs/year Naughton Unit 3 10,668.0 lbs/year Total Future Potential HF Rate: 22,620.5 lbs/year 11.3 tons/year Calculation Method: EPRI LARK-TRIPP Calculation and Methods for Threshold Determination and Release Estimates HF Emission Factor with FGD System: 6% Subbituminous Coal Emission Factor: 50% (Table 5-1 Emission Factors for HCL and HF) 71
73 Table NAU - 11 Naughton Past Actual Sulfuric Acid Emission Evaluation Sulfuric Acid Mist Manufactured from Combustion (EPRI LARK-TRIPP method used to calculate sulfuric acid emission rate) EM Comb = K*F1*E2 Where: EM Comb = total H 2 SO 4 manufactured from combustion, lbs/year K = molecular weight and units conversion constant = (98.07)/(64.04) * = Molecular weight of H 2 SO 4 E2 = K1 * K2 * C1 * S = Molecular weight of SO 2 K = 3,063 F1 = Fuel Impact Factor F1 = (Subbituminous/PRB coal) E2 = SO 2 mass rate, tons/year Where: K1 = molecular weight and units conversion constant = (64.04)/(100*32.06) = Molecular weight of SO = Molecular weight of S 100 = conversion of % S to fraction K1 = 0.02 K2 = Sulfur conversion to SO 2 ; implicit from EPA AP-42 K2 = (Subbituminous coal) C1 = Coal burn, tons/year C1 = 640,447 tons/year (Unit 1 max from NAU-6; November 2005) C1 = 832,859 tons/year (Unit 2 max from NAU-6; November 2005) C1 = 1,299,371 tons/year (Unit 3 max from NAU-6; November 2005) S1 = Coal sulfur weighted, % 72
74 Table NAU - 11 (continued) Naughton Past Actual Sulfuric Acid Emission Evaluation Annual Average Coal Sulfur Concentration (percent) Naughton Unit Naughton Unit Naughton Unit S1 = 0.58 % (Unit 1) S1 = 0.59 % (Unit 2) S1 = 1.36 % (Unit 3) E2 = 6,543 tons/year (Unit 1) E2 = 8,528 tons/year (Unit 2) E2 = 30,949 tons/year (Unit 3) EM Comb = 36,074 lbs/year (Unit 1) EM Comb = 47,017 lbs/year (Unit 2) EM Comb = 170,636 lbs/year (Unit 3) Average Coal Sulfur Concentration (percent) 73
75 Table NAU - 11 (continued) Naughton Past Actual Sulfuric Acid Emission Evaluation EM FGC = K e * B * f e * I s Total H 2 SO 4 manufactured from flue gas conditioning system, lbs/year Where: EM FGC = Total H 2 SO 4 manufactured from flue gas conditioning system, lbs/year K e = 3,799 conversion factor B = Coal burn in TBtu/year B = 13.8 TBtu/year Naughton Unit 1 (From NAU-5; March 2006) B = 17.4 TBtu/year Naughton Unit 2 (From NAU-5; March 2006) B = 27.6 TBtu/year Naughton Unit 3 (From NAU-5; March 2006) f e = Operating factor of flue gas conditioning system (generally = 0.8) f e = 0.8 (Assume that FGC system operates 80% of boiler operating time) I s = SO 3 injection rate in ppmv at 6% O 2, wet; I s = 0 ppmv (Naughton Unit 1) I s = 0 ppmv (Naughton Unit 2) I s = 8 ppmv (Naughton Unit 3) EM FGC = EM FGC = EM FGC = 0 lbs/year (Unit 1: Sulfuric Acid Manufactured from Flue Gas Conditioning) 0 lbs/year (Unit 2: Sulfuric Acid Manufactured from Flue Gas Conditioning) 671,119 lbs/year (Unit 3: Sulfuric Acid Manufactured from Flue Gas Conditioning) ER Comb = EM Comb * F2 (all that apply) ER Comb = Sulfuric acid released from combustion F2 = Technology Impact Factors F2 = 0.56 (Air Heater Removal of Sulfuric Acid - PRB Coal; Applicable to Naughton Boilers) F2 = 0.73 (Cold-side ESP - Subbituminous (PRB) Coal; Applicable to Naughton Boilers) F2 = 0.40 (Wet FGD - PRB Coal; Applicable to Naughton Unit 3) 74
76 Table NAU - 11 (continued) Naughton Past Actual Sulfuric Acid Emission Evaluation ER Comb = ER Comb = ER Comb = 14,747 lbs/year (Unit 1 Sulfuric Acid Released from Combustion) 19,221 lbs/year (Unit 2 Sulfuric Acid Released from Combustion) 27,902 lbs/year (Unit 3 Sulfuric Acid Released from Combustion) ER FGC = [EM FGC - (K e * B * f e * I NH3 )] * F3 FGC * F 2 Total H2SO4 released from flue gas conditioning Where: ER FGC = Sulfuric Acid Released from Flue Gas Conditioning EM FGC = Sulfuric acid manufactured from flue gas conditioning EM FGC = 0 lbs/year (Unit 1) EM FGC = 0 lbs/year (Unit 2) EM FGC = 671,119 lbs/year (Unit 3) K e = 3,799 conversion factor B = Coal burn in TBtu/year B = 13.8 TBtu/year Naughton Unit 1 (From NAU-5; March 2006) B = 17.4 TBtu/year Naughton Unit 2 (From NAU-5; March 2006) B = 27.6 TBtu/year Naughton Unit 3 (From NAU-5; March 2006) f e = 0.8 (Assume that FGC system operates 80% of boiler operating time) I NH3 = NH 3 injection for dual flue gas conditioning, ppmv at 6% O 2, wet; I NH3 = 0 ppmv Naughton Unit 1 I NH3 = 0 ppmv Naughton Unit 2 I NH3 = 0 ppmv Naughton Unit 3 F3 FGC = F3 FGC = Technology Impact Factors for FGC 0.02 (Subbituminous coal with FGC injection downstream of APH) 75
77 Table NAU - 11 (continued) Naughton Past Actual Sulfuric Acid Emission Evaluation F2 = Technology Impact Factors F2 = 0.56 (Air Heater Removal of Sulfuric Acid - PRB Coal; Applicable to Naughton Units) F2 = 0.73 (Cold-side ESP - Subbituminous (PRB) Coal; Applicable to Naughton Units) F2 = 0.40 (Wet FGD - PRB Coal; Applicable to Naughton Unit 3) ER FGC = 0 lbs/year (Unit 1 Sulfuric Acid Released from Flue Gas Conditioning) 0 lbs/year (Unit 2 Sulfuric Acid Released from Flue Gas Conditioning) 2,195 lbs/year (Unit 3 Sulfuric Acid Released from Flue Gas Conditioning) ER Total = ER Comb + ER FGC ER Total = 14,747 lbs/year (Unit 1) ER Total = 19,221 lbs/year (Unit 2) ER Total = 30,097 lbs/year (Unit 3) Total sulfuric acid released from combustion and from flue gas conditioning Total Past Actual Sulfuric Acid Emission Rate = 64,065 lbs/year 32.0 tons/year Naughton Unit 1 Naughton Unit 2 Naughton Unit 3 Pre-Project FGD (SO 2 scrubber) No No Yes Post-Project FGD (SO 2 scrubber) Yes Yes Yes Pre-Project FGC (flue gas conditioning) No No Yes at 8 ppm Post-Project FGC (flue gas conditioning) Yes at 8 ppm Yes at 8 ppm No 76
78 Table NAU - 12 Naughton Future Potential Sulfuric Acid Emission Evaluation Sulfuric Acid Mist Manufactured from Combustion (EPRI LARK-TRIPP method used to calculate sulfuric acid emission rate) EM Comb = K*F1*E2 Where: EM Comb = total H 2 SO 4 manufactured from combustion, lbs/year K = molecular weight and units conversion constant = (98.07)/(64.04) * = Molecular weight of H 2 SO 4 E2 = K1 * K2 * C1 * S = Molecular weight of SO 2 K = 3,063 F1 = Fuel Impact Factor F1 = (Subbituminous/PRB coal) E2 = SO 2 mass rate, tons/year Where: K1 = molecular weight and units conversion constant = (64.04)/(100*32.06) = Molecular weight of SO = Molecular weight of S 100 = conversion of % S to fraction K1 = 0.02 K2 = Sulfur conversion to SO 2 ; implicit from EPA AP-42 K2 = (Subbituminous coal) C1 = Future Potential Coal burn, tons/year C1 = 815,476 tons/year (Unit 1 future max from page 1 of NAU-10) C1 = 1,058,479 tons/year (Unit 2 future max from page 1 of NAU-10) C1 = 1,630,059 tons/year (Unit 3 future max from page 1 of NAU-10) S1 = Coal sulfur weighted, % 77
79 Table NAU - 12 (continued) Naughton Future Potential Sulfuric Acid Emission Evaluation Annual Average Coal Sulfur Concentration (percent) Naughton Unit Naughton Unit Naughton Unit S1 = 0.58 % (Unit 1) S1 = 0.59 % (Unit 2) S1 = 1.36 % (Unit 3) E2 = 8,331 tons/year (Unit 1) E2 = 10,838 tons/year (Unit 2) E2 = 38,826 tons/year (Unit 3) EM Comb = 45,933 lbs/year (Unit 1) EM Comb = 59,754 lbs/year (Unit 2) EM Comb = 214,062 lbs/year (Unit 3) Average Coal Sulfur Concentration (percent) 78
80 Table NAU - 12 (continued) Naughton Future Potential Sulfuric Acid Emission Evaluation EM FGC = K e * B * f e * I s Total H 2 SO 4 manufactured from flue gas conditioning system, lbs/year Where: EM FGC = Total H 2 SO 4 manufactured from flue gas conditioning system, lbs/year K e = 3,799 conversion factor B = Future Potential Coal burn in TBtu/year B = 16.2 TBtu/year (Naughton Unit 1 future maximum from NAU-10) B = 21.0 TBtu/year (Naughton Unit 2 future maximum from NAU-10) B = 32.4 TBtu/year (Naughton Unit 3 future maximum from NAU-10) f e = Operating factor of flue gas conditioning system (generally = 0.8) f e = 0.8 (Assume that FGC system operates 80% of boiler operating time) I s = SO 3 injection rate in ppmv at 6% O 2, wet; I s = 8 ppmv (Naughton Unit 1) I s = 8 ppmv (Naughton Unit 2) I s = 0 ppmv (Naughton Unit 3) EM FGC = EM FGC = EM FGC = 394,026 lbs/year (Unit 1: Sulfuric Acid Manufactured from Flue Gas Conditioning) 511,169 lbs/year (Unit 2: Sulfuric Acid Manufactured from Flue Gas Conditioning) 0 lbs/year (Unit 3: Sulfuric Acid Manufactured from Flue Gas Conditioning) ER Comb = EM Comb * F2 (all that apply) ER Comb = Sulfuric acid released from combustion F2 = Technology Impact Factors F2 = 0.56 (Air Heater Removal of Sulfuric Acid - PRB Coal; Applicable to Naughton Boilers) F2 = 0.73 (Cold-side ESP - Subbituminous (PRB) Coal; Applicable to Unit 1 and Unit 2 Boilers) F2 = 0.10 (Baghouse - Subbituminous Coal; Applicable to Unit 3 Boiler) F2 = 0.40 (Wet FGD - PRB Coal; Applicable to Unit 1, Unit 2 and Unit 3 Boilers) 79
81 Table NAU - 12 (continued) Naughton Future Potential Sulfuric Acid Emission Evaluation ER Comb = ER Comb = ER Comb = 7,511 lbs/year (Unit 1 Sulfuric Acid Released from Combustion) 9,771 lbs/year (Unit 2 Sulfuric Acid Released from Combustion) 4,795 lbs/year (Unit 3 Sulfuric Acid Released from Combustion) ER FGC = [EM FGC - (K e * B * f e * I NH3 )] * F3 FGC * F 2 Total H2SO4 released from flue gas conditioning Where: ER FGC = Sulfuric Acid Released from Flue Gas Conditioning EM FGC = Sulfuric acid manufactured from flue gas conditioning EM FGC = EM FGC = 394,026 lbs/year (Unit 1: Sulfuric Acid Manufactured from Flue Gas Conditioning) 511,169 lbs/year (Unit 2: Sulfuric Acid Manufactured from Flue Gas Conditioning) EM FGC = 0 lbs/year (Unit 3: Sulfuric Acid Manufactured from Flue Gas Conditioning) K e = 3,799 conversion factor B = Coal burn in TBtu/year B = 16.2 TBtu/year (Naughton Unit 1 future maximum from NAU-10) B = 21.0 TBtu/year (Naughton Unit 2 future maximum from NAU-10) B = 32.4 TBtu/year (Naughton Unit 3 future maximum from NAU-10) f e = 0.8 (Assume that FGC system operates 80% of boiler operating time) I NH3 = NH 3 injection for dual flue gas conditioning, ppmv at 6% O 2, wet; I NH3 = 0 ppmv Naughton Unit 1 I NH3 = 0 ppmv Naughton Unit 2 I NH3 = 0 ppmv Naughton Unit 3 F3 FGC = F3 FGC = Technology Impact Factors for FGC 0.02 (Subbituminous coal with FGC injection downstream of APH) 80
82 Table NAU - 12 (continued) Naughton Future Potential Sulfuric Acid Emission Evaluation F2 = Technology Impact Factors F2 = 0.56 (Air Heater Removal of Sulfuric Acid - PRB Coal; Applicable to Naughton Boilers) F2 = 0.73 (Cold-side ESP - Subbituminous (PRB) Coal; Applicable to Unit 1 and Unit 2 Boilers) F2 = 0.10 (Baghouse - Subbituminous Coal; Applicable to Unit 3 Boiler) F2 = 0.40 (Wet FGD - PRB Coal; Applicable to Unit 1, Unit 2 and Unit 3 Boilers) ER FGC = 1,289 lbs/year (Unit 1 Sulfuric Acid Released from Flue Gas Conditioning) 1,672 lbs/year (Unit 2 Sulfuric Acid Released from Flue Gas Conditioning) 0 lbs/year (Unit 3 Sulfuric Acid Released from Flue Gas Conditioning) ER Total = ER Comb + ER FGC ER Total = 8,800 lbs/year (Unit 1) ER Total = 11,443 lbs/year (Unit 2) ER Total = 4,795 lbs/year (Unit 3) Total sulfuric acid released from combustion and from flue gas conditioning Total Future Potential Sulfuric Acid Emission Rate = 25,037 lbs/year 12.5 tons/year Naughton Unit 1 Naughton Unit 2 Naughton Unit 3 Pre-Project FGD (SO 2 scrubber) Post-Project FGD (SO 2 scrubber) Pre-Project FGC (flue gas conditioning) Post Project FGC (flue gas cond.) No Yes No Yes at 8 ppm No Yes No Yes at 8 ppm Yes Yes Yes at 8 ppm No 81
83 Table NAU - 13 Naughton Past Actual Lead Emission Evaluation Lead emissions calculated using AP-42 Table /98 Lead emissions (lb/10 12 Btu) = 3.4 * (C/A * PM) 0.80 C = milligrams/kilogram (lead cncentration in coal) A= percent ash in coal PM = average particulate matter emission rate lb/mmbtu Annual Average Coal Lead Concentration (C) (ppm) Average Coal Lead Concentration (C) (ppm) Naughton Unit Naughton Unit Naughton Unit Annual Average Coal Ash Concentration (A) (percent) Average Coal Ash Concentration (A) (percent) Naughton Unit % 5.02% 5.20% 4.32% 4.97% 4.77% Naughton Unit % 5.01% 5.22% 4.27% 5.01% 4.78% Naughton Unit % 5.19% 5.62% 5.60% 5.53% 5.36% 82
84 Table NAU - 13 (continued) Naughton Past Actual Lead Emission Evaluation Annual Average Particulate Matter Emission Rate (PM) (lb/mmbtu) Average PM Emission Rate (PM) (lb/mmbtu) Naughton Unit Naughton Unit Naughton Unit Maximum Past Annual Heat Input (MMBtu/year) Reference Naughton Unit 1 13,805,514 NAU-5; March 2006 Naughton Unit 2 17,391,700 NAU-5; March 2006 Naughton Unit 3 27,602,638 NAU-5; March 2006 Average Lead Concentration (C) (ppm) Average Coal Ash Concentration (A) (weight fraction) Average Particulate Matter Emission Rate (PM) (lb/mmbtu) Annual Lead Emission Rate (lb/10 12 Btu) Naughton Unit Naughton Unit Naughton Unit
85 Table NAU - 13 (continued) Naughton Past Actual Lead Emission Evaluation Annual Lead Emission Rate (lb/10 12 Btu) Annual Heat Input (10 12 Btu/year) Annual Lead Emission Rate (lb/year) Annual Lead Emission Rate (tons/year) Naughton Unit Naughton Unit Naughton Unit Total Maximum Past Actual Lead Emission Rate: 0.13 tons/year 84
86 Table NAU - 14 Naughton Future Potential Lead Emission Evaluation Lead emissions calculated using AP-42 Table /98 Lead emissions (lb/10 12 Btu) = 3.4 * (C/A * PM) 0.80 C = milligrams/kilogram (lead cncentration in coal) A= percent ash in coal PM = average particulate matter emission rate lb/mmbtu Annual Average Coal Lead Concentration (C) (ppm) Average Coal Lead Concentration (C) (ppm) Naughton Unit Naughton Unit Naughton Unit Annual Average Coal Ash Concentration (A) (percent) Average Coal Ash Concentration (A) (percent) Naughton Unit % 5.02% 5.20% 4.32% 4.97% 4.77% Naughton Unit % 5.01% 5.22% 4.27% 5.01% 4.78% Naughton Unit % 5.19% 5.62% 5.60% 5.53% 5.36% 85
87 Table NAU - 14 (continued) Naughton Future Potential Lead Emission Evaluation Naughton Unit 1 Naughton Unit 2 Naughton Unit 3 Future Post-Project Particulate Matter Emission Rate (PM) (lb/mmbtu) Naughton Unit 1 Naughton Unit 2 Naughton Unit 3 Future Potential Annual Heat Input (MMBtu/year) 16,206,000 21,024,000 32,412,000 Reference Table NAU-10 Table NAU-10 Table NAU-10 Average Lead Concentration (C) (ppm) Average Coal Ash Concentration (A) (weight fraction) Post-Project Particulate Matter Emission Rate (PM) (lb/mmbtu) Annual Lead Emission Rate (lb/10 12 Btu) Naughton Unit Naughton Unit Naughton Unit
88 Table NAU - 14 (continued) Naughton Future Potential Lead Emission Evaluation Annual Lead Emission Rate (lb/10 12 Btu) Annual Heat Input (10 12 Btu/year) Annual Lead Emission Rate (lb/year) Annual Lead Emission Rate (tons/year) Naughton Unit Naughton Unit Naughton Unit Total Maximum Future Potential Lead Emission Rate: 0.15 tons/year 87
89 Table NAU - 15 Naughton Past Actual Carbon Monoxide Emission Evaluation Carbon monoxide emissions calculated using AP-42 Table /98 Carbon monoxide AP-42 emission factor = 0.5 lb/ton (0.5 lb of CO emitted per ton of coal burned) Maximum Past Actual Annual Coal Burn Rate (tons/year) Reference Carbon Monoxide Emission Factor lb/ton Annual CO Emission Rate lb/year Annual CO Emission Rate tons/year Naughton Unit 1 640,447 NAU-6; November , Naughton Unit 2 832,859 NAU-6; November , Naughton Unit 3 1,299,371 NAU-6; November , Total 1,386, Maximum Past Actual Units 1-3 Stack Carbon Monoxide Emission R tons/year Maximum Past Actual Non-Stack CO Emissions Emissions Source Diesel-Fired Emergency Generator Engine - Unit 1 Diesel-Fired Emergency Generator Engine - Unit 2 Diesel-Fired Emergency Generator Engine - Unit 3 Diesel-Fired Emergency Generator Engine - FGD Diesel-Fired Emergency Fire Pump Engine Used Oil-Fired Space Heater (350,000 Btu/hour) Used Oil-Fired Space Heater (235,000 Btu/hour) Total Maximum Non-Stack CO Emission Rate (tons/year) Maximum Past Actual Non-Stack CO Emission Rate (tons/year) Total Maximum Past Actual CO Emission Rate Stack and Non-Stack Emissions (tons/year)
90 Table NAU - 16 Naughton Future Potential Carbon Monoxide Emission Evaluation Step 1: Calculate future potential Unit 1 and Unit 2 CO emissions based on post-low-no X project emission limits Maximum Boiler Heat Input Rate (MMBtu/hour) Post-Project Carbon Monoxide Emission Limit (lb/mmbtu) Maximum Annual Boiler Operational Time (hours/year) Post-Project Annual Carbon Monoxide Emission Rate (tons/year) Naughton Unit 1 1, ,760 2,025.8 Naughton Unit 2 2, ,760 2,628.0 Step 2: Identify maximum future potential Unit 3 CO emission rate Maximum Future Potential Coal Burn Rate (from NAU-10) (tons/year) Carbon Monoxide AP-42 Emission Factor (lb/ton) Post-Project Annual Carbon Monoxide Emission Rate (tons/year) Naughton Unit 3 1,630, Step 3: Identify total annual post-low-no X control project annual carbon monoxide emission rate Post-Project Annual Carbon Monoxide Emission Rate (tons/year) Naughton Unit 1 2,025.8 Naughton Unit 2 2,628.0 Naughton Unit Non-Stack 0.4 Total 5,
91 Table NAU - 17 Naughton Past Actual VOC Emission Evaluation Volatile Organic Compound emissions calculated using AP-42 Table /98 VOC AP-42 emission factor = 0.06 lb/ton (0.06 lb of VOC emitted per ton of coal burned) Maximum Past Actual Annual Coal Burn Rate (tons/year) Reference VOC Emission Factor lb/ton Annual VOC Emission Rate lb/year Annual VOC Emission Rate tons/year Naughton Unit 1 640,447 NAU-6; November , Naughton Unit 2 832,859 NAU-6; November , Naughton Unit 3 1,299,371 NAU-6; November , Total 166, Maximum Past Actual Units 1-3 Stack VOC Emission Rate: 83.2 tons/year Maximum Past Actual Non-Stack VOC Emissions Emissions Source Maximum Past Actual Non-Stack CO Emission Rate (tons/year) Diesel-Fired Emergency Generator Engine - Unit Diesel-Fired Emergency Generator Engine - Unit Diesel-Fired Emergency Generator Engine - Unit Diesel-Fired Emergency Generator Engine - FGD 0.0 Diesel-Fired Emergency Fire Pump Engine 0.1 Used Oil-Fired Space Heater (350,000 Btu/hour) 0.0 Used Oil-Fired Space Heater (235,000 Btu/hour) 0.0 Total Maximum Non-Stack VOC Emission Rate (tons/year) 0.1 Total Maximum Past Actual VOC Emission Rate Stack and Non-Stack Emissions (tons/year)
92 Table NAU - 18 Naughton Future Potential VOC Emission Evaluation Volatile Organic Compound emissions calculated using AP-42 Table /98 VOC AP-42 emission factor = 0.06 lb/ton (0.06 lb of VOC emitted per ton of coal burned) Maximum Future Potential Annual Coal Burn Rate (tons/year) Reference VOC Emission Factor lb/ton Annual VOC Emission Rate lb/year Annual VOC Emission Rate tons/year Naughton Unit 1 815,476 from NAU , Naughton Unit 2 1,058,479 from NAU , Naughton Unit 3 1,630,059 from NAU , Non-Stack NA NA NA Total 210, Maximum Future Potential VOC Emission Rate: tons/year 91
93 Appendix E: Permit Application Form This appendix includes a completed Wyoming Department of Environmental Quality Air Quality Division permit application form. 92
 828-4211 County Zip Telephone 3.")
94 DEPARTMENT OF ENVIRONMENTAL QUALITY AIR QUALITY DIVISION PERMIT APPLICATION FORM Date of Application: March 7, Name of Firm or Institution: PacifiCorp Energy - Naughton Power Plant 2. Mailing Address P.O. Box 191 Kemmerer Wyoming Number Street City State Lincoln (307) County Zip Telephone 3. Plant Location 6 Miles Southwest of Kemmerer Kemmerer Wyoming Number Street City State Lincoln (307) County Zip Telephone 4. Name of owner or company official to contact regarding air pollution matters Bill Lawson Director- Engineering and Environmental (801) Name Title Telephone 1407 West North Temple Salt Lake City Utah Number Street City State Zip 5. General nature of business The Naughton facility is a coal-fired plant used to generate electricity 6. Permit application is made for: New Construction X Modification Relocation Operation 93
95 7. Type of equipment to be constructed, modified, or relocated. (List each major piece of equipment separately.) PacifiCorp plans to install flue gas conditioning systems (FGC) on Unit 1 and Unit 2, replace the existing Unit 3 electrostatic precipitator (ESP) with a new pulse jet fabric filter baghouse, rebuild and upgrade the Unit 3 steam turbine, install flue gas desulfurization systems (FGD) on Unit 1 and Unit 2, and install low- NO X burner systems on the Unit 1 and Unit 2 boilers. The purpose of the Unit 1 and Unit 2 flue gas conditioning systems is to lower fly ash resistivity and enhance ESP efficiency and particulate matter collection; the replacement of the Unit 3 electrostatic precipitator with a fabric filter baghouse will significantly reduce the particulate matter emission rate of Unit 3; the Unit 3 turbine upgrade project will improve the thermodynamic efficiency of the Unit 3 steam turbine without an increase of steam flow or boiler heat input (coal combustion); the Unit 1 and Unit 2 FGD systems will result in lower sulfur dioxide emission rates; and the Unit 1 and Unit 2 low-no X burner projects will result in lower NO X emission rates. 8. If application is being made for operation of an existing source in a new location, list previous location and new location: Previous Location: Not Applicable New Location: 9. If application is being made for a crushing unit, is there: (mark all appropriate boxes) Not applicable. Identified projects are being constructed to: Enhance Unit 1 electrostatic precipitator particulate matter collection efficiency (Unit 1 flue gas conditioning system) Enhance Unit 2 electrostatic precipitator particulate matter collection efficiency (Unit 2 flue gas conditioning system) Reduce Unit 3 particulate matter emission rate (Unit 3 pulse jet fabric filter baghouse) Improve thermodynamic efficiency of the Unit 3 turbine-generator (Unit 3 turbine upgrade) Reduce Unit 1 SO 2 emission rate (Unit 1 FGD scrubber) Reduce Unit 2 SO 2 emission rate (Unit 2 FGD scrubber) Reduce Unit 1 NO X emission rate (Unit 1 low-no X burners) Reduce Unit 2 NO X emission rate (Unit 2 low-no X burners) No material crushing equipment is associated with the listed projects. 94
96 10. Materials used in unit or process (include solid fuels): Not applicable. The listed projects are being installed to enhance the performance of the Unit 1 and Unit 2 electrostatic precipitators to facilitate continuous compliance with the applicable 40 percent opacity standard; to reduce the particulate matter emission rate from Unit 3; to increase the Unit 3 electro-generator output through thermodynamic efficiencies gained from the turbine upgrade; and to reduce the Unit 1 and Unit 2 SO 2 and NO X emission rates. The listed projects will not alter the coal throughput or heat input capacities of the boiler units. Type of Material Coal (Unit 1) Coal (Unit 2) Coal (Unit 3) Process Weight Average (lb/hr) Process Weight Maximum (lb/hr) Quantity/Year 815,476 tons (maximum) 1,058,479 tons (maximum) 1,630,059 tons (maximum) 11. Air contaminants emitted: The flue gas conditioning projects have the potential to change the characteristics of the air pollutants being discharged from the Naughton Unit 1 and Unit 2 stacks, including a potential increase in H 2 SO 4 emissions. The replacement of the Unit 3 ESP with a pulse jet fabric filter will not change the characteristics of the pollutants being discharged from the Unit 3 stack; however, the project will result in a reduction of the particulate matter emission rate from the source. The Unit 3 turbine upgrade will have no effect on the characteristics of the pollutants being discharged from the Unit 3 stack. The Units 1 and 2 flue gas desulfurization systems will reduce SO 2 pollutants being emitted from the Units 1 and 2 stacks. The Units 1 and 2 low-no X burners will reduce NO X pollutants being emitted from the Units 1 and 2 stacks and may result in an increase in CO emissions. The Unit 1 and Unit 2 flue gas conditioning system installations will assist each emission source in meeting its applicable 40 percent opacity standard. Each FGC system includes a combustion unit that will incinerate elemental sulfur to produce sulfur dioxide gas (SO 2 ). After formation, the SO 2 flows through a vanadiumbased catalyst with converts the SO 2 to sulfur trioxide (SO 3 ). The SO 3 gas is emitted into the boiler coal combustion flue gas stream and reacts with the water vapor inherent in the flue gas to form sulfuric acid (H 2 SO 4 ). The sulfuric acid nucleates on the particulate matter (fly ash) entrained in the flue gas stream and lowers its resistivity, enhancing collection in the electrostatic precipitators. Although the majoring of the sulfuric acid formed from the combustion of elemental sulfur in the flue gas conditioning systems is cocollected with fly ash in the electrostatic precipitators, a fraction of the H 2 SO 4 slips by the ESP and is emitted to atmosphere. Unit 1 currently has a particulate matter emission rate equivalent to 0.24 lb/mmbtu heat input and Unit 2 has a particulate matter emission rate equivalent to 0.23 lb/mmbtu heat input. Following installation of the Units 1 and 2 flue gas conditioning systems the emission rate from Unit 1 will be equivalent to lb/mmbtu heat input (78 lb/hour) and the emission rate from Unit 2 will be equivalent to lb/mmbtu (130 lb/hour). 95
97 Unit 3, which currently utilizes an electrostatic precipitator as pollution control for particulate matter, has a particulate matter emission rate equivalent to 0.21 lb/mmbtu heat input. Following the installation of the fabric filter baghouse the emission rate from Unit 3 will be equivalent to an annual limit of lb/mmbtu (56 lb/hour). Following completion of the low-no X burner projects Unit 1 and Unit 2 will each have an annual NO X emission rate of 0.26 lb/mmbtu. Furthermore, PacifiCorp requests that existing Naughton Title V operating permit condition (F5)(b) that caps annual Units 1, 2 and 3 NO X emissions at 15,140 tons/year be amended to a plantwide applicability limitation (PAL) at issuance of the requested construction permit. The 15,140 ton/year PAL will be reduced to 11,104.7 tons/year following completion of the Unit 1 and Unit 2 low- NO X control projects. Because the installation of the Units 1 and 2 low-no X control projects may increase emissions of carbon monoxide, a 30-day rolling average CO limit of 0.25 lb/mmbtu (463 lb/hour) is requested for Unit 1 and a 30- day rolling average CO limit of 0.25 lb/mmbtu (600 lb/hour) is requested for Unit 2 following completion of the respective boiler low-no X projects. Following completion of the Unit 1 and Unit 2 FGD installations it is requested that a 12-month rolling average SO 2 limit of 0.15 lb/mmbtu be applied to each unit. Furthermore, it is requested that a 3-hour fixed block average SO 2 limit of 833 lb/hour be applied to Unit 1 and a 1,080 lb/hour 3-hour fixed block average SO 2 limit be applied to Unit 2 following completion of the Unit 1 and Unit 2 FGD scrubber installations. Following completion of the Unit 1 and Unit 2 FGD installations it is requested that an SO 2 PAL be established at a 12-month rolling average limit of 8,924.1 tons/year. Because the installation of the Unit 1 and Unit 2 flue gas conditioning systems may increase the emission rate of sulfuric acid (H 2 SO 4 ), it is requested that an SO 3 injection rate limit of 8 ppm on a 30-day rolling average basis be applied to Units 1 and 2 following installation of the flue gas conditioning systems. The existing Unit 3 flue gas conditioning system will be retired from service following completion of the fabric filter baghouse installation scheduled to occur in
98 Calculations of the Emission Estimates Summary of Past Actual Annual Emissions Naughton Stack Emissions Units 1-3 Non-Stack Emissions Total Past Actual Emissions Stack Emissions Unit 3 Only SO 2 tons/yr NO x tons/yr PM 10 tons/yr VOC tons/yr CO tons/yr H 2 SO 4 tons/yr Lead tons/yr Fluorides tons/yr 22, , , , , , , , Summary of Projected Annual Emissions SO 2 tons/yr NO x tons/yr PM 10 tons/yr VOC tons/yr CO tons/yr H 2 SO 4 tons/yr Lead tons/yr Fluorides tons/yr Stack Emissions Units 1-3 8,903.0 c 11,102.9 c 1, , Non-Stack Emissions Total Future Potential Emissions 8, , , , Stack Emission Unit 3 Only 6, , c NO X and SO 2 stack emission rates include 40 ton/year PSD significance threshold values used in setting requested PALs 97
99 Evaluation of significance levels by pollutant To determine if a Prevention of Significant Deterioration significance level has been reached the past actual annual emissions are subtracted from the Projected Annual Emissions Units 1-3 Naughton Permitted Projects: Units 1 and 2 flue gas conditioning systems Units 1 and 2 flue gas desulfurization systems Unit 3 fabric filter baghouse Units 1 and 2 low-nox burners Unit 3 turbine upgrade Other plant projects Past Actual tons/year Future Potential tons/year Future Potential minus Past Actual tons/year PSD Review Significance Level tons/year Is Emission Increase greater than Significance Level SO 2 22, , , No NO X 14, , , No PM 10 1, , No CO , , Yes Ozone (as VOC) No Fluoride (as HF) No Lead No H 2 SO No 98
100 12. Air contaminant control equipment: Emission Point Type Pollutant Removed Efficiency Unit 1 Stack Electrostatic Precipitator Flue Gas Conditioning System Low-NO X Burners FGD System Particulate Matter NO X SO 2 This equipment is expected to reduce particulate matter emissions from 0.24 lb/mmbtu heat input (pre-project emission rate) to lb/mmbtu heat input (post-unit 1 flue gas conditioning project emission rate); reduce NO X emissions to 0.26 lb/mmbtu and reduce SO 2 emissions to 0.15 lb/mmbtu on an annual average basis Unit 2 Stack Electrostatic Precipitator Flue Gas Conditioning System Low-NO X Burners FGD System Particulate Matter This equipment is expected to reduce particulate matter emissions from 0.23 lb/mmbtu heat input (pre-project emission rate) to lb/mmbtu heat input (post-unit 2 flue gas conditioning project emission rate); reduce NO X emissions to 0.26 lb/mmbtu and reduce SO 2 emissions to 0.15 lb/mmbtu on an annual average basis Unit 3 Stack Pulse Jet Fabric Filter Baghouse Particulate Matter This equipment is expected to reduce particulate matter emissions from 0.21 lb/mmbtu heat input (pre-project emission rate) to lb/mmbtu heat input (post-project emission rate) on an annual average basis 99
101 13. Type of combustion unit: (check if applicable): A. Coal 1. Pulverized X : General ; Dry Bottom X; Wet Bottom ; With Flyash Reinjection ; Without Flyash Reinjection ; Other Tangentially-Fired 2. Spreader Stoker : With Flyash Reinjection ; Without Flyash Reinjection ; Cyclone ; Hand-Fired ; Other B. Fuel Oil Horizontally Fired Tangentially Fired Type of combustion unit: (check if applicable): C. Natural Gas D. If other, please specify Hourly fuel consumption (estimate for new equipment) Not Applicable Size of combustion unit 1,850 MMBtu/hour (Naughton Unit 1) 2,400 MMBtu/hour (Naughton Unit 2) 3,700 MMBtu/hour (Naughton Unit 3) 14. Operating Schedule: 24 hours/day; 7 days/week; 52 weeks/year. Peak production season (if any) : 100
102 15. Fuel analysis: Not applicable. The planned projects include the installation of pollution control equipment (Units 1 and 2 flue gas conditioning systems; low-no X burners and flue gas desulfurization systems; and Unit 3 fabric filter baghouse) to control particulate matter emissions, SO 2 emissions and NO X emissions. The requested projects will not change the amount of fuel burned or the capacity of the generating units. COAL FUEL OIL NATURAL GAS % Sulfur % Ash BTU Value 101
103 16. Not applicable. The planned projects include the installation of pollution control equipment (Units 1 and 2 flue gas conditioning systems; low-no X burners and flue gas desulfurization systems; and Unit 3 fabric filter baghouse) to control particulate matter emissions, SO 2 emissions and NO X emissions. The requested projects will not change the amount of fuel burned or the capacity of the generating units. Products Quantity/Year 17. Emissions to the atmosphere (each point of emission should be listed separately and numbered so that it can be located on the flow sheet): Emission Point Stack Height (ft) Stack Diameter (ft) Gas Discharge SCFM Exit Temp ( O F) Gas Velocity (ft/s) Unit 1 Stack (exit I.D.) 780, Unit 2 Stack (exit I.D.) 840, Unit 3 Stack (exit I.D.) 1,500, Does the input material or product from this process or unit contain finely divided materials which could become airborne? X Yes No Is this material stored in piles or in some other way as to make possible the creation of dust problems? X Yes No Not applicable. The planned projects include the installation of pollution control equipment (Units 1 and 2 flue gas conditioning systems; low-no X burners and flue gas desulfurization systems; and Unit 3 fabric filter baghouse) to control particulate matter emissions, SO 2 emissions and NO X emissions. The requested projects will not change the amount of fuel burned or the capacity of the generating units. 102
104 18. Continued: List storage pile (if any) : Type of Material Particle Size (Diameter or Screen Size) Pile Size (Average Tons on Pile) Pile Wetted (Yes or No) Pile Covered (Yes or No) 19. Using a flow diagram: (1) Illustrate input of raw materials. (2) Label production processes, process fuel combustion, process equipment, and air pollution control equipment. (3) Illustrate locations of air contaminant release so that emission points under items 11, 12 and 17 can be identified. For refineries show normal pressure relief and venting systems. Attach extra pages as needed. 20. A site map should be included indicating the layout of facility at the site. All buildings, pieces of equipment, roads, pits, rivers and other such items should be shown on the layout. 21. A location drawing should be included indicating location of the facility with respect to prominent highways, cities, towns, or other facilities (include UTM coordinates). 103

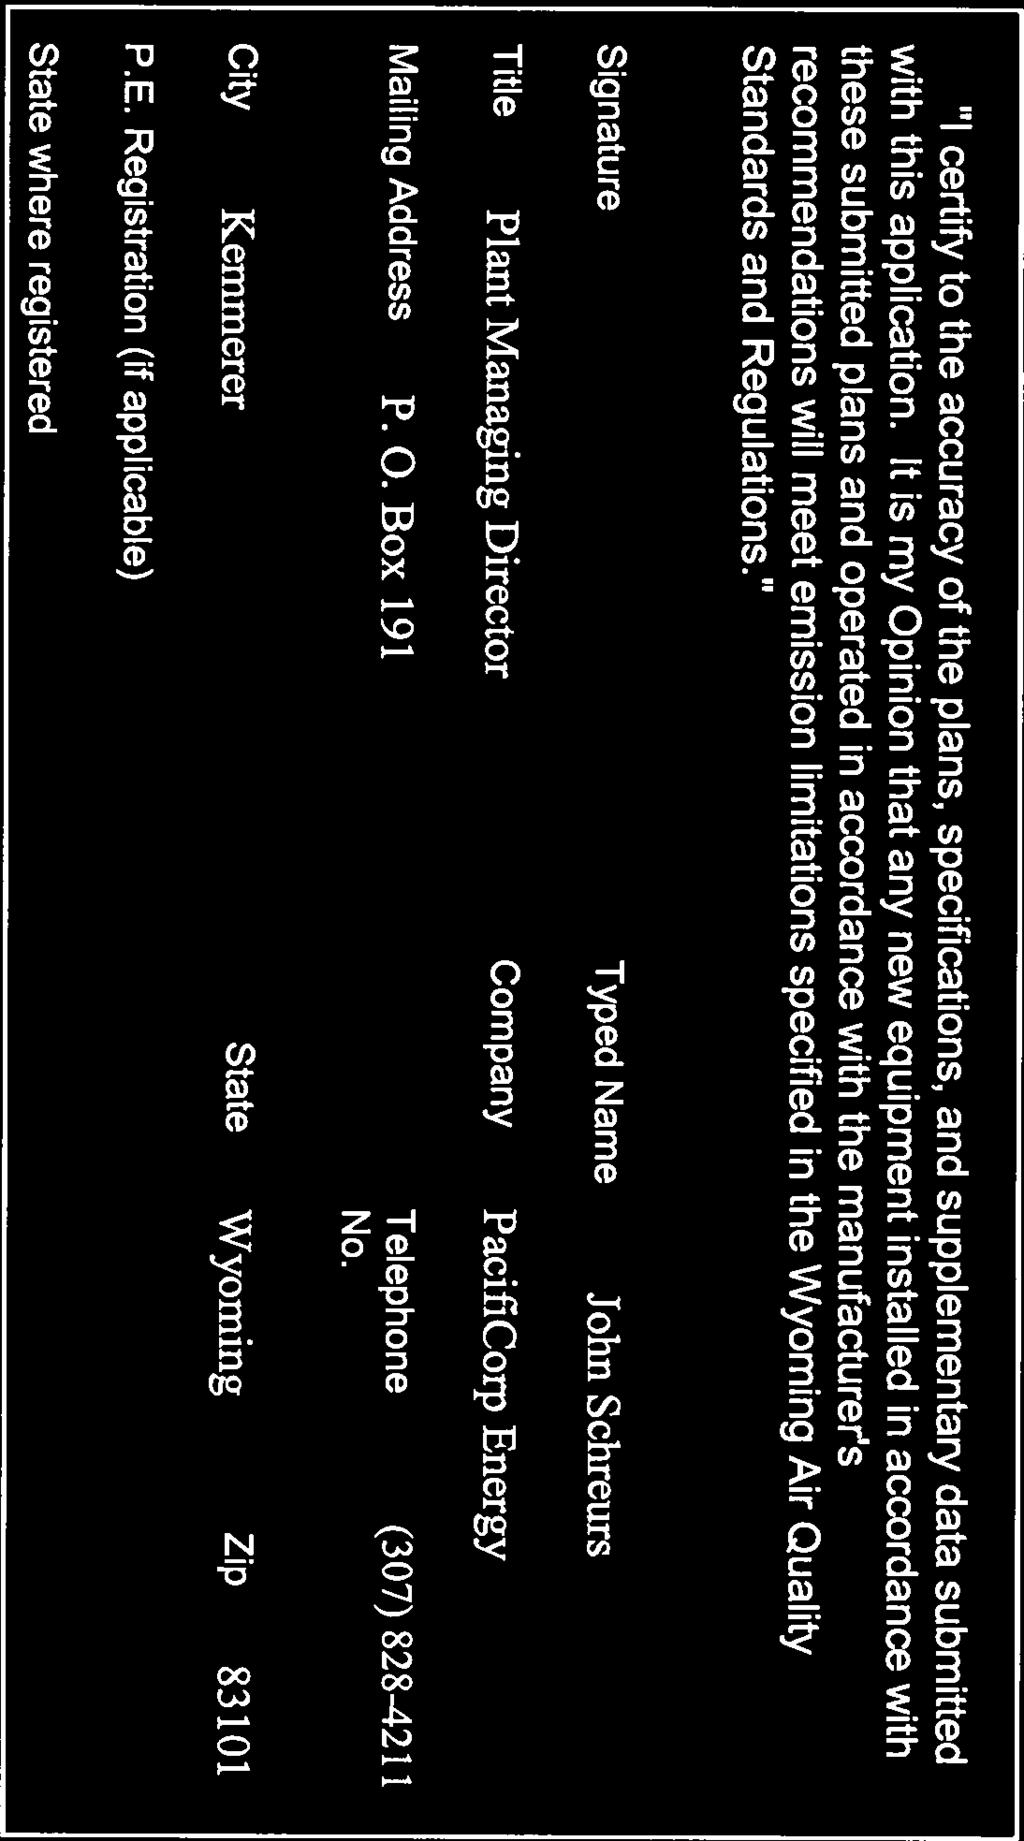

105
PSD Background Presentation
 PSD Background Presentation May 3 rd 2011 John Holmes 1 Prevention of Significant Deterioration (PSD): Overview Federal preconstruction permitting applies to new major stationary sources and major modifications
Air Emissions Permitting Considerations for an Integrated Gasification Combined Cycle (IGCC) Unit Potentially Located in the State of Delaware
 Unit Potentially Located in the State of Delaware") Air Emissions Permitting Considerations for an Integrated Gasification Combined Cycle (IGCC) Unit Potentially Located in the State of Delaware Center for the Inland Bays Scientific & Technical Advisory
Air Emissions Permitting Considerations for an Integrated Gasification Combined Cycle (IGCC) Unit Potentially Located in the State of Delaware Center for the Inland Bays Scientific & Technical Advisory
502(b)(10) Permit for Part 70 Source
(10) Permit for Part 70 Source") 502(b)(10) Permit for Part 70 Source Permit Attachment No.: 2075-139-0002-V-03-1 Effective Date: November 9, 2015 Facility Name: Mailing Address: Parent/Holding Company: 862 West Ridge Road Gainesville,
502(b)(10) Permit for Part 70 Source Permit Attachment No.: 2075-139-0002-V-03-1 Effective Date: November 9, 2015 Facility Name: Mailing Address: Parent/Holding Company: 862 West Ridge Road Gainesville,
COMAR Amendments and Regulation.12 Standards for Biomass Fuel-Burning Equipment Equal to or Greater Than 350,000 Btu/hr
 Department of the Environment COMAR 26.11.09 Amendments and Regulation.12 Standards for Biomass Fuel-Burning Equipment Equal to or Greater Than 350,000 Btu/hr October 30, 2013 Topics Covered Standards,
AIR EMISSION PERMIT NO IS ISSUED TO. Van Hoven Company, Inc.
 AIR EMISSION PERMIT NO. 03700070-001 IS ISSUED TO Van Hoven Company, Inc. VAN HOVEN COMPANY, INC. 505 Hardman Avenue South South Saint Paul, Dakota County, Minnesota 55075-2413 The emission units, control
New Source Review Reform: What Lies Ahead
 New Source Review Reform: What Lies Ahead Presented at: Flexible Packaging Association 2004 Environmental Summit January 23, 2004 Ken Weiss, P.E. DEE, Director, Air Quality Services ERM ken.weiss@erm.com
AIR REGULATION IN SOUTH CAROLINA 3 JUNE 2016
 AIR REGULATION IN SOUTH CAROLINA Presented by Phil Conner 3 JUNE 2016 pconner@nexsenpruet.com SCDHEC s Authority for Administering Air Quality Regulations South Carolina Pollution Control Act (The PCA
TITLE V OPERATING PERMIT STATEMENT OF BASIS
 TITLE V OPERATING PERMIT STATEMENT OF BASIS Facility Name: El Cajon Energy, LLC Title V Application Number: APCD2011-APP-001657 Facility ID: Equipment Address: APCD2009-SITE-06554 222 N. Johnson Ave. Facility
AIR EMISSION PERMIT NO [AMENDMENT TO AIR EMISSION PERMIT NO ] IS ISSUED TO
![AIR EMISSION PERMIT NO [AMENDMENT TO AIR EMISSION PERMIT NO ] IS ISSUED TO](/thumbs/78/77257507.jpg "AIR EMISSION PERMIT NO [AMENDMENT TO AIR EMISSION PERMIT NO ] IS ISSUED TO") AIR EMISSION PERMIT NO. 05301050-021 [AMENDMENT TO AIR EMISSION PERMIT NO. 05301050-011] IS ISSUED TO THE UNIVERSITY OF MINNESOTA AND FOSTER WHEELER TWIN CITIES, INC. FOR THE UNIVERSITY OF MINNESOTA TWIN
AIR EMISSION PERMIT NO. 05301050-021 [AMENDMENT TO AIR EMISSION PERMIT NO. 05301050-011] IS ISSUED TO THE UNIVERSITY OF MINNESOTA AND FOSTER WHEELER TWIN CITIES, INC. FOR THE UNIVERSITY OF MINNESOTA TWIN
STATEMENT OF BASIS. For the issuance of Draft Air Permit # 1987-AOP-R4 AFIN:
 STATEMENT OF BASIS For the issuance of Draft Air Permit # 1987-AOP-R4 1. PERMITTING AUTHORITY: Arkansas Department of Environmental Quality 5301 Northshore Drive North Little Rock, Arkansas 72118-5317
Tennessee Gas Pipeline Company, LLC Compressor Station Whites Creek Pike Page 1
 Tennessee Gas Pipeline Company, LLC Compressor Station 563 7650 Whites Creek Pike Page 1 Joelton, Tennessee Reviewed by: Blake McClain RE: Installation of two Solar Titan 250-30000S natural gas-fired turbines
TITLE V OPERATING PERMIT STATEMENT OF BASIS
 Facility Name: Title V Permit No.: Permit Application Nos.: Site ID: Equipment Address: Goal Line, L.P. APCD2016-TVP-00043 APCD2016-APP-004597 APCD1992-SITE-08447 555 North Tulip Street Escondido, CA 92025
CONSTRUCTION PERMIT. DATE ISSUED: January 7, 2015 ISSUED TO: Martin Marietta Materials, Inc.
 COLORADO DEPARTMENT OF PUBLIC HEALTH AND ENVIRONMENT AIR POLLUTION CONTROL DIVISION TELEPHONE: (303) 692-3150 PERMIT NO: CONSTRUCTION PERMIT DATE ISSUED: January 7, 2015 ISSUED TO: 13LR2446 Issuance 1
ENGINEERING CALCULATION SHEET AIR RESOURCES DIVISION
 SIC Code: 4911 (Energy Production) DATE: 02/06/2008 Page 1 of 5 DATE APPLICATION RECEIVED: December 14, 2007 (Application # FY07-0259) FACILITY DESCRIPTION Pinetree Power-Tamworth, Inc. (the Permittee)
DRAFT AIR EMISSION PERMIT NO Major Amendment IS ISSUED TO. Miller Milling Co LLC
 DRAFT AIR EMISSION PERMIT NO. 07900006 004 Major Amendment IS ISSUED TO Miller Milling Co LLC Miller Milling Co LLC 100 2nd Avenue Southwest New Prague, Le Sueur County, MN 56071 The emission units, control
PART 70 PERMIT TO OPERATE
 G =Missouri Department of Natural Resources ~ Air Pollution Control Program PART 70 PERMIT TO OPERATE Under the authority of RSMo 643 and the Federal Clean Air Act the applicant is authorized to operate
POTENTIAL TO EMIT LIMITATIONS FOR PART 70 SOURCES. (Adopted 6/15/1995, revised 1/18/2001 and 1/20/2011)
") RULE 370. POTENTIAL TO EMIT LIMITATIONS FOR PART 70 SOURCES. (Adopted 6/15/1995, revised 1/18/2001 and 1/20/2011) A. Applicability 1. General Applicability: This Rule shall apply to any stationary source
RULE 370. POTENTIAL TO EMIT LIMITATIONS FOR PART 70 SOURCES. (Adopted 6/15/1995, revised 1/18/2001 and 1/20/2011) A. Applicability 1. General Applicability: This Rule shall apply to any stationary source
STATEMENT OF BASIS. NAICS Description: All Other Miscellaneous Chemical Product and Preparation Manufacturing NAICS Code:
 STATEMENT OF BASIS For the issuance of Draft Air Permit # 0196-AR-9 1. PERMITTING AUTHORITY: Arkansas Department of Environmental Quality 5301 Northshore Drive North Little Rock, Arkansas 72118-5317 2.
Review of Xcel Energy's Metropolitan Emission Reduction Alternative Project
 Review of Xcel Energy's Metropolitan Emission Reduction Alternative Project April 28, 2003 1.0 Introduction The Minnesota Public Utilities Commission (PUC) has begun its consideration of Xcel Energy s
New Source Review (NSR) Reform. Modeling Guidance: Policies and Procedures
 Reform. Modeling Guidance: Policies and Procedures") New Source Review (NSR) Reform Modeling Guidance: Policies and Procedures Prepared by: Dennis Becker Craig Thorstenson January 28, 2004 Minnesota Pollution Control Agency 520 Lafayette Road North St. Paul,
New Source Review (NSR) Reform Modeling Guidance: Policies and Procedures Prepared by: Dennis Becker Craig Thorstenson January 28, 2004 Minnesota Pollution Control Agency 520 Lafayette Road North St. Paul,
PUBLIC PARTICIPATION DOCUMENTS For Holland Board of Public Works Holland, Michigan
 STATE OF MICHIGAN Rick Snyder, Governor DEPARTMENT OF ENVIRONMENTAL QUALITY AIR QUALITY DIVISION CONSTITUTION HALL 525 WEST ALLEGAN STREET P.O. BOX 30260 LANSING, MICHIGAN 48909-7760 www.michigan.gov/air
Michigan Department of Environmental Quality Air Quality Division RENEWABLE OPERATING PERMIT STAFF REPORT
 State Registration Number Michigan Department of Environmental Quality Air Quality Division RENEWABLE OPERATING PERMIT ROP Number B8337 STAFF REPORT MI-ROP-B8337-2015 ANR PIPELINE COMPANY - MUTTONVILLE
Greenhouse Gas Regulation (new Federal)
") Mercury & Air Toxics (MATS) Interstate Transport (CAIR/CSAPR) Regional Haze/Visibility Portland Cement NESHAP Greenhouse Gas Regulation (new Federal) Mercury & Air Toxics (MATS) Finalized December 2011
Mercury & Air Toxics (MATS) Interstate Transport (CAIR/CSAPR) Regional Haze/Visibility Portland Cement NESHAP Greenhouse Gas Regulation (new Federal) Mercury & Air Toxics (MATS) Finalized December 2011
BACKGROUND DOCUMENT PROPOSED REVISION TO AP-42 EMISSION FACTORS FOR ESTIMATING PM 2.5 EMISSIONS FROM GAS-FIRED COMBUSTION UNITS
 BACKGROUND DOCUMENT PROPOSED REVISION TO AP-42 EMISSION FACTORS FOR ESTIMATING PM 2.5 EMISSIONS FROM GAS-FIRED COMBUSTION UNITS Submitted by: Karin Ritter American Petroleum Institute 1220 L Street NW
State of Utah. Department of Environmental Quality DAQE-AN October 26, 2009
 Department of Environmental Quality State of Utah GARY R. HERBERT Governor Amanda Smith Executive Director DIVISION OF AIR QUALITY Cheryl Heying Director GREG BELL Lieutenant Governor DAQE-AN0141510002-09
RELEASE POINT TYPE Enter or select one of the following stack/emission point release orientation: downward
 EMISSION SOURCE (Internal Combustion Engines) Instructions for Form B2-G Form B2-G should be completed for all generators. Make as many copies of the form as necessary. Attach all calculations and assumptions
Citations from CRF as required in WV DEP's 45CSR24
 Citations from CRF 40.60 as required in WV DEP's 45CSR24 NOTE: Unoffical Document meant to summarize WV regulations, using 40-CFR-60 passed July, 2002 TITLE 40--PROTECTION OF ENVIRONMENT CHAPTER I--ENVIRONMENTAL
Update on ICI Boiler MACT
 Update on ICI Boiler MACT Bruce Hedman March 5, 2013 Clean Air Acts Standards for Boilers and Incinerators On December 20, 2012, EPA finalized a specific set of adjustments to March 2011 Clean Air Act
Huber Engineered Woods, LLC, TV Page 1 of 7
 Facility Name: Huber Engineered Woods, LLC City: Commerce County: Jackson AIRS #: 04-13-157-00014 Application #: 23530 Date SIP Application Received: Date Title V Application Received: Permit No: 2493-157-0014-V-03-2
CAM does have exemptions for certain emission units as follows: Page 1 of 8
 Title: Authors: PM CEMS: The Current Reality of Monitoring Particulate Matter Ms. Robynn Andracsek, Burns & McDonnell Ms. Mary Hauner, Burns & McDonnell Mr. Craig Clapsaddle, MSI/Mechanical Systems, Inc.
PUBLIC PARTICIPATION DOCUMENTS For DCP Midstream, LP Hamilton Township, Michigan
 STATE OF MICHIGAN Rick Snyder, Governor DEPARTMENT OF ENVIRONMENTAL QUALITY AIR QUALITY DIVISION CONSTITUTION HALL 525 WEST ALLEGAN STREET P.O. BOX 30260 LANSING, MICHIGAN 48909-7760 www.michigan.gov/air
RULE Federally Enforceable Limits on Potential to Emit - Adopted 1/25/96
 RULE 201.3 Federally Enforceable Limits on Potential to Emit - Adopted 1/25/96 I. Purpose The purpose of this Rule is to allow relatively small sources of air pollution to avoid requirements of Rule 201.1
Boiler MACT & Related Rules. Western Regional Boiler Association 45 th Annual Meeting Portland, Oregon March 14, 2013
 Boiler MACT & Related Rules Western Regional Boiler Association 45 th Annual Meeting Portland, Oregon March 14, 2013 Clean Air Act Rules Recently Finalized National Emissions Standard for Hazardous Air
Introduction. Federal Regulatory Background
 Introduction Federal Regulatory Background On December 31, 2002, the U.S. Environmental Protection Agency (EPA) revised its regulations governing the New Source Review (NSR) programs required by parts
Air Permitting for Major Sources/Title V (Part 2)
") Air Permitting for Major Sources/Title V (Part 2) Bob Hodanbosi Bob.hodanbosi@epa.state.oh.us Mike Hopkins Mike.hopkins@epa.state.oh.us Introduction Who, what, where, why of Title V permitting How can
Air Permitting for Major Sources/Title V (Part 2) Bob Hodanbosi Bob.hodanbosi@epa.state.oh.us Mike Hopkins Mike.hopkins@epa.state.oh.us Introduction Who, what, where, why of Title V permitting How can
Oklahoma Department of Environmental Quality Air Quality Division
 Oklahoma Department of Environmental Quality Air Quality Division BART Application Analysis January 19, 2010 COMPANY: FACILITY: FACILITY LOCATION: TYPE OF OPERATION: Units REVIEWER: AEP- Public Service
Excerpt of Thermal Power Guidelines for New Plants
 Excerpt of Thermal Power Guidelines for New Plants The following is an excerpt of the Thermal Power guidelines for New Plants, a complete version of which is found in the Pollution Prevention and Abatement
Limiting Potential to Emit (PTE) in New Source Review (NSR) Permitting
 in New Source Review (NSR) Permitting") EPA Mid-Atlantic Air Protection, available at http://www.epa.gov/reg3artd/permitting/limitptemmo.htm (last visited April 8, 2014) Limiting Potential to Emit (PTE) in New Source Review (NSR) Permitting
EPA Mid-Atlantic Air Protection, available at http://www.epa.gov/reg3artd/permitting/limitptemmo.htm (last visited April 8, 2014) Limiting Potential to Emit (PTE) in New Source Review (NSR) Permitting
AIR EMISSION PERMIT NO IS ISSUED TO. PowerMinn 9090, LLC 2295 Corporate Boulevard, Suite 222 Boca Raton, FL
 AIR EMISSION PERMIT NO. 15100038-004 IS ISSUED TO PowerMinn 9090, LLC 2295 Corporate Boulevard, Suite 222 Boca Raton, FL 33431 And Fibrominn LLC 301 Oxford Valley Road, Suite 704A Makefield Executive Quarters
2. How can the University have an expansion of the Cogeneration Facility without an increase in the amount of coal used?
 Responses to Questions Raised at the November 9, 2005 Public Hearing on the University of North Carolina at Chapel Hill s Special Use Permit Modification Request 1. What is the nature of the surveying
Statement of Basis for Frederickson Power LP (Frederickson)
") Frederickson Power LP (Frederickson) I. PURPOSE OF THIS STATEMENT OF BASIS This document summarizes the legal and factual bases for the air operating permit conditions for Frederickson Power LP at Frederickson
Frederickson Power LP (Frederickson) I. PURPOSE OF THIS STATEMENT OF BASIS This document summarizes the legal and factual bases for the air operating permit conditions for Frederickson Power LP at Frederickson
42 USC 7511a. NB: This unofficial compilation of the U.S. Code is current as of Jan. 4, 2012 (see
 TITLE 42 - THE PUBLIC HEALTH AND WELFARE CHAPTER 85 - AIR POLLUTION PREVENTION AND CONTROL SUBCHAPTER I - PROGRAMS AND ACTIVITIES Part D - Plan Requirements for Nonattainment Areas subpart 2 - additional
A.6 Boilers. A.6.1 New and Existing Boilers located within AQCR 131
 A.6 Boilers The following are Minnesota Standards of Performance for Indirect Heating Equipment (Minn. R. 7011.0500-7011.0553) New boilers: construction, modification, or reconstruction commenced after
Customized Solutions for Environmental Compliance. Combining proven experience, technology and reliable performance for our customers
 Customized Solutions for Environmental Compliance Combining proven experience, technology and reliable performance for our customers Recognize these acronyms? MATS CSAPR CAIR CAVR NSPS NAAQS CAA UMACT
Air Quality Permit File: TVOP & AR Cambria CoGen Company / Cambria Generation Facility
 PA DEP SOUTHWEST REGIONAL OFFICE MEMO TO FROM Air Quality Permit File: TVOP-11-00332 & AR-11-00332 Cambria CoGen Company / Martin L. Hochhauser, P.E. Air Quality Eng. Specialist Air Quality Program THROUGH
PRIMARY OR ALTERNATIVE OPERATING SCENARIO
 EMISSION SOURCE (Fuel Combustion Source) Instructions for Form B2 Form B2 should be completed for all fuel combustion emission sources (e.g., generators, boilers, burn-off ovens, bakeon ovens, bakery ovens,
47.0 GOOD ENGINEERING PRACTICE STACK HEIGHT
 47.0 GOOD ENGINEERING PRACTICE STACK HEIGHT 47.1 General Provisions A. This section provides that the degree of emission limitation required of any source for control of any air pollutant must not be affected
State of New Hampshire Department of Environmental Services Air Resources Division. Temporary Permit
 State of New Hampshire Department of Environmental Services Air Resources Division Temporary Permit Permit No: FP-T-0152 Date Issued: July 18, 2007 Administrative Permit Amendment: June 11, 2008 This certifies
IN THE UNITED STATES DISTRICT COURT FOR THE SOUTHERN DISTRICT OF TEXAS HOUSTON DIVISION
 IN THE UNITED STATES DISTRICT COURT FOR THE SOUTHERN DISTRICT OF TEXAS HOUSTON DIVISION ENVIRONMENTAL INTEGRITY PROJECT, TEXAS CAMPAIGN FOR THE ENVIRONMENT and ENVIRONMENT TEXAS, vs. Plaintiffs, LOWER
Update on Michigan Air Pollution Control Rules and Policies. MMEA Fall Conference October 4, 2017
 Update on Michigan Air Pollution Control Rules and Policies MMEA Fall Conference October 4, 2017 Rhiana C. Dornbos, PE Project Engineer Air Quality Permitting and Compliance 517-702-2953 616-265-5755 rdornbos@nthconsultants.com
NJDEP Comments on STAPPA/ALAPCO/WESTAR List of Issues to be Addressed in the PSD Reform Initiative
 Alan Dresser New Jersey DEP, Bureau of Air Quality Evaluation 12/9/04 NJDEP Comments on STAPPA/ALAPCO/WESTAR List of Issues to be Addressed in the PSD Reform Initiative Emission Inventory Issues General
11/10/2014 Oklahoma s SIP Submittal Infrastructure Checklist 2010 Primary Sulfur Dioxide (SO 2 ) NAAQS Update 1
 NAAQS Update 1") Oklahoma s State Implementation Plan (SIP) Submittal Infrastructure Checklist CAA 110(a)(2)(A)-(M) Requirements in the Current SIP or Pending SIP Revisions Updated for the 2010 Primary Sulfur Dioxide (SO
Oklahoma s State Implementation Plan (SIP) Submittal Infrastructure Checklist CAA 110(a)(2)(A)-(M) Requirements in the Current SIP or Pending SIP Revisions Updated for the 2010 Primary Sulfur Dioxide (SO
Air Pollution Control Program Permits Section
 Air Pollution Control Program Permits Section July 11, 2013 Air Permitting Two types of air permits: New Source Review (NSR)/Construction Permit Permit required prior to commencing construction Allows
STATE OF MINNESOTA MINNESOTA POLLUTION CONTROL AGENCY
 p-ear2-80b STATE OF MINNESOTA MINNESOTA POLLUTION CONTROL AGENCY IN THE MATTER OF THE DECISION ON THE NEED FOR AN ENVIRONMENTAL IMPACT STATEMENT FOR THE PROPOSED REG ALBERT LEA, LLC PROJECT FREEBORN COUNTY
CEC Carlson Environmental Consultants, pc
 CEC Carlson Environmental Consultants, pc June 10, 2014 Landfill Gas and Solid Waste Specialists Mr. Syed Arif Office of Permitting and Compliance Division of Air Resource Management Florida Department
Emissions Calculations - Stack
 Emissions Calculations - Composition of Gas Exiting (lb/hr) Fuel Type: PRB - 1 PRB - 2 90/10 Blend - 1 90/10 Blend - 2 Case: Worst Case (Ref. #1) Typical Annual (Ref. #2) Worst Case (Ref. #3) Typical Annual
Draft 10/28/13. Guidance for 1-Hour SO 2 Nonattainment Area SIP Submissions October 2013
 Guidance for 1-Hour SO 2 Nonattainment Area SIP Submissions October 2013 i TABLE OF CONTENTS Preface... Page iii I. Purpose... Page 1 II. Background.... Page 1 A. Roles of the EPA and Air Agencies B. How
FACILITY PROFILE. New Brunswick Power Corporation for the Belledune Thermal Generating Station
 FACILITY PROFILE New Brunswick Power Corporation for the Belledune Thermal Generating Station Prepared by: Industrial Processes Section, Impact Management Branch Department of Environment and Local Government
NEW JERSEY STATE DEPARTMENT OF ENVIRONMENTAL PROTECTION NEW JERSEY ADMINISTRATIVE CODE TITLE 7 CHAPTER 27 SUBCHAPTER 10. Sulfur in Solid Fuels
 NEW JERSEY STATE DEPARTMENT OF ENVIRONMENTAL PROTECTION NEW JERSEY ADMINISTRATIVE CODE TITLE 7 CHAPTER 27 SUBCHAPTER 10 Sulfur in Solid Fuels TABLE OF CONTENTS Section Page REGULATORY HISTORY... 2 7:27-10.1
PUBLIC PARTICIPATION DOCUMENTS For Flakeboard America Limited, dba ARAUCO North America Grayling, Michigan
 STATE OF MICHIGAN Rick Snyder, Governor DEPARTMENT OF ENVIRONMENTAL QUALITY AIR QUALITY DIVISION CONSTITUTION HALL 525 WEST ALLEGAN STREET P.O. BOX 30260 LANSING, MICHIGAN 48909-7760 www.michigan.gov/air
DRAFT PROPOSED PERMIT. San Diego County Air Pollution Control District Old Grove Rd San Diego, CA (858)
") DRAFT PROPOSED PERMIT San Diego County Air Pollution Control District 10124 Old Grove Rd San Diego, CA 92131-1649 (858) 586-2600 TITLE V OPERATING PERMIT 960392 Issued To: Applied Energy North Island,
DRAFT PROPOSED PERMIT San Diego County Air Pollution Control District 10124 Old Grove Rd San Diego, CA 92131-1649 (858) 586-2600 TITLE V OPERATING PERMIT 960392 Issued To: Applied Energy North Island,
Policy for PSD Modeling District Rule 2410 Guidance for Identifying Sources to be Evaluated for Inclusion in an Increment Assessment
 San Joaquin Valley Air Pollution Control District Policy for PSD Modeling District Rule 2410 Guidance for Identifying Sources to be Evaluated for Inclusion in an Increment Assessment Approved By: Date:
ALLEGHENY COUNTY HEALTH DEPARTMENT AIR QUALITY PROGRAM
 Universal Stainless TVOP Technical Support Document Page 1 Appendix ALLEGHENY COUNTY HEALTH DEPARTMENT AIR QUALITY PROGRAM May 26, 2017 SUBJECT: Review of Application Title V Operating Permit Renewal Universal
AIR EMISSION PERMIT NO IS ISSUED TO. Waldorf Corporation
 AIR EMISSION PERMIT NO. 12300410-001 IS ISSUED TO Waldorf Corporation Waldorf Corporation - A Rock-Tenn Company 2250 Wabash Avenue St. Paul, Ramsey County, MN 55114 The emission units, control equipment
PERMIT APPLICATION REVIEW SUMMARY
 PERMIT APPLICATION REVIEW SUMMARY New Hampshire Department of Environmental Services Air Resources Division P.O. Box 95, 29 Hazen Drive Concord, NH 03302-0095 Phone: 603-271-1370 Fax: 603-271-7053 Phone
Integrating ADAir Mixer Technology to Optimize System Performance with DSI Applications
 An ADA-ES, Inc. White Paper Integrating ADAir Mixer Technology to Optimize System Performance with DSI Applications By Constance Senior, Vice President Technology Cody Wilson, Product Manager May 10, 2016
Title V. Model General Permit Template SERIES 1 FLARES. Template # SJV-FL-1-1
 Title V Model General Permit Template SERIES 1 FLARES Template # SJV-FL-1-1 nonassisted, air-assisted, or steam-assisted elevated open flares actual emissions less than 20 tons VOC per year used to comply
PERMIT TO INSTALL. Table of Contents
 Permit No. 77-17 Page 1 of 7 PERMIT TO INSTALL Table of Contents Section Page Alphabetical Listing of Common Abbreviations / Acronyms... 2 General Conditions... 3 Special Conditions... 5 Emission Unit
AIR EMISSION PERMIT NO IS ISSUED TO
 AIR EMISSION PERMIT NO. 06100001-011 IS ISSUED TO Blandin Paper Company/Minnesota Power Rapids Energy Center/Minnesota Power 115 1st Street Southwest Grand Rapids, Itasca County, MN 55744 The emission
YOLO-SOLANO AIR QUALITY MANAGEMENT DISTRICT 1947 Galileo Court, Suite 103; Davis, CA Phone (530) ; Fax (530)
 ; Fax (530)") YOLO-SOLANO AIR QUALITY MANAGEMENT DISTRICT 1947 Galileo Court, Suite 103; Davis, CA 95618 Phone (530)757-3650; Fax (530)757-3670 AUTHORITY TO CONSTRUCT (ATC) APPLICATION A separate application must be
YOLO-SOLANO AIR QUALITY MANAGEMENT DISTRICT 1947 Galileo Court, Suite 103; Davis, CA 95618 Phone (530)757-3650; Fax (530)757-3670 AUTHORITY TO CONSTRUCT (ATC) APPLICATION A separate application must be
Michigan Guide to Air Use Permits to Install
 Michigan Guide to Air Use Permits to Install Forward...3 1. How do I determine if an air permit is needed?...4 2. Are there exemptions from permits to install?...7 3. What happens if a required permit
TECHNICAL EVALUATION AND PRELIMINARY DETERMINATION. Oleander Power Project, L.P. 190 MW Simple Cycle Gas Turbine
 TECHNICAL EVALUATION AND PRELIMINARY DETERMINATION, L.P. 190 MW Simple Cycle Gas Turbine Cocoa, Brevard County DEP File No. 0090180-003-AC () Florida Department of Environmental Protection Division of
FACT SHEET. Whelan Energy Center 4520 East South Street Hastings, Nebraska March 26, 2004
 FACT SHEET Whelan Energy Center 4520 East South Street Hastings, Nebraska 68901 March 26, 2004 DESCRIPTION OF THE FACILITY OR ACTIVITY: Hastings Utilities (HU) currently operates the Whelan Energy Center
Potential to Emit. Calculating your PTE Jenifer Dixon Public Affairs and Outreach
 Potential to Emit Calculating your PTE Jenifer Dixon dixonj2@michigan.gov Public Affairs and Outreach Topics of Discussion Introduction to Potential to Emit When to Calculate Potential to Emit How to Calculate
AIR EMISSION PERMIT NO IS ISSUED TO GERDAU AMERISTEEL US INC
 AIR EMISSION PERMIT NO. 12300055-002 IS ISSUED TO GERDAU AMERISTEEL US INC 1678 Red Rock Road St. Paul, Ramsey County, MN 55119 The emission units, control equipment and emission stacks at the stationary
BART DETERMINATION REPORT AMERICAN ELECTRIC POWER COMANCHE POWER STATION UNITS 1 AND 2
 BART DETERMINATION REPORT AMERICAN ELECTRIC POWER COMANCHE POWER STATION UNITS 1 AND 2 Prepared by: N.N. Dharmarajan Vern Choquette Principal Consultant Eugene Chen, PE Senior Consultant Jeremy Townley
STATEMENT OF BASIS Dudley Lumber Company, Inc. Salem, Lee County, Alabama Facility Permit No. 206-S003
 STATEMENT OF BASIS Dudley Lumber Company, Inc. Salem, Lee County, Alabama Facility Permit No. 206-S003 This draft renewal Title V Major Source Operating Permit (MSOP) is proposed under the provisions of
AIR DISPERSION MODELING
 Click to edit Master title style AIR DISPERSION MODELING Use of AERMOD for NAAQS Area Designations and State Implementation Plan Submittals SPEAKER Stewart McCollam DATE February 10, 2016 USE OF AERMOD
New Source Review Rulemakings & Court Decisions
 Speaker 8: Kirk A. Lilley of K&L Gates Page 1 New Source Review Rulemakings & Court Decisions The federal New Source Review (NSR) program imposes preconstruction permitting requirements on new major stationary
AIR QUALITY REGULATORY ISSUES ASSOCIATED WITH RESOURCE RECOVERY
 AIR QUALITY REGULATORY ISSUES ASSOCIATED WITH RESOURCE RECOVERY DONALD M. POMPELIA Camp D resse r & McKee Inc. Boston, Massach usetts The paper reviews the air quality regulatory issues affecting resource
APPENDIX A TECHNICAL SUPPLEMENTS
 APPENDIX A TECHNICAL SUPPLEMENTS Disclaimer The Emissions Assessment Section (EAS) has developed technical supplements for several common emission sources. The supplements are intended to help you accurately
New Source Review (NSR) Program Review Questionnaire May 14, 2003
 Program Review Questionnaire May 14, 2003") New Source Review (NSR) Program Review Questionnaire May 14, 2003 Note: This questionnaire does not address implementation of changes made to the major NSR rules in EPA s rulemaking on December 31, 2002.
New Source Review (NSR) Program Review Questionnaire May 14, 2003 Note: This questionnaire does not address implementation of changes made to the major NSR rules in EPA s rulemaking on December 31, 2002.
Additional Information to Supplement PSD Air Permit Application and State Air Facility Permit Application (# /00004)
") Stephen Tomasik Project Manager Energy Projects and Management Division of Environmental Permits NYS Department of Environmental Conservation 625 Broadway 4th Floor Albany, New York 122331750 Steven Riva
Stephen Tomasik Project Manager Energy Projects and Management Division of Environmental Permits NYS Department of Environmental Conservation 625 Broadway 4th Floor Albany, New York 122331750 Steven Riva
27.0 SAMPLING AND TESTING METHODS
 27.0 SAMPLING AND TESTING METHODS 27.1 General It is explicitly implied that in addition to and consistent with specific methods of sampling and analysis described herein, that samples shall be taken in
NO2, SO2, PM2.5, Oh my!?! Information Session EPA R/S/L Modelers Workshop May 10, 2010
 NO2, SO2, PM2.5, Oh my!?! Information Session EPA R/S/L Modelers Workshop May 10, 2010 Purpose & Outline Provide background and updates on permit modeling processes and technical aspects related to new
BOILER AREA MACT 40 CFR PART 63 SUBPART JJJJJJ. Industrial Boilers used in manufacturing processing, mining, refining or other industry.
 BOILER AREA MACT 40 CFR PART 63 SUBPART JJJJJJ Applicability: Industrial Boilers used in manufacturing processing, mining, refining or other industry. Commercial Boilers used in stores/malls, laundries,
FERC PDF (Unofficial) 9/29/2014 4:29:38 PM. Title V Permit Modification Addendum Submitted June 23, 2014
 9/29/2014 4:29:38 PM. Title V Permit Modification Addendum Submitted June 23, 2014") Title V Permit Modification Addendum Submitted June 23, 2014 REVISED TITLE V PERMIT MODIFICATION APPLICATION Algonquin Gas Transmission, LLC > Stony Point Compressor Station Algonquin Incremental Market
Title V Permit Modification Addendum Submitted June 23, 2014 REVISED TITLE V PERMIT MODIFICATION APPLICATION Algonquin Gas Transmission, LLC > Stony Point Compressor Station Algonquin Incremental Market
Emergency Engine and Turbine Requirements
 1.0 Purpose and Applicability 1.1 The purpose of these guidelines is to identify the processes and requirements that must be followed to ensure compliance with the Massachusetts Department of Environmental
Air Individual Permit Part 70 Reissuance Pine St S Lester Prairie, MN McLeod County
 Air Individual Permit Part 7 Reissuance 8516-11 Permittee: Facility name: PFB Manufacturing LLC Plasti Fab 116 Pine St S Lester Prairie, MN 55354-11 McLeod County Expiration date: July 18, 222 * All Title
COMMONWEALTH OF VIRGINIA STATE AIR POLLUTION CONTROL BOARD REGULATIONS FOR THE CONTROL AND ABATEMENT OF AIR POLLUTION
 COMMONWEALTH OF VIRGINIA STATE AIR POLLUTION CONTROL BOARD REGULATIONS FOR THE CONTROL AND ABATEMENT OF AIR POLLUTION 9VAC5 CHAPTER 30. AMBIENT AIR QUALITY STANDARDS. 9VAC5-30-10. General. 9VAC5-30-15.
New Articles 76 & April 2012
 New Articles 76 & 79 30 April 2012 Agenda Why Change? Article 76 Revised Article il 79 Revised Why Change the Previous Articles? Updated Articles Replaced Appendices Modernized d Requires regular review
ARKANSAS DEPARTMENT OF ENVIRONMENTAL QUALITY
 ADEQ ARK A N S A S Departmentof Environmental Quality FEB 2 2 2018 Ashley Roundtree, Envirorunental Specialist Southwestern Electric Power Company d/b/a Flint Creek Power Plant P.O. Box 660164 Dallas,
EPA's Final Rules to Reduce Air Toxics from Industrial Boilers MARAMA/ICAC CONTROL TECHNOLOGY WORKSHOP MAY 18-19, 2011
 EPA's Final Rules to Reduce Air Toxics from Industrial Boilers MARAMA/ICAC CONTROL TECHNOLOGY WORKSHOP MAY 18-19, 2011 Topics Overview of actions Who is covered Why we issued the rules Benefits, costs,
ADEQ NON-CRITERIA POLLUTANT CONTROL STRATEGY Revised April 2015
 ADEQ NON-CRITERIA POLLUTANT CONTROL STRATEGY Revised April 2015 BACKGROUND Under the federal Clean Air Act, EPA is obligated to establish ambient air quality standards for 6 commonly found criteria pollutants:
Minor Source BAT Programs
 Minor Source BAT Programs Ali Mirzakhalili, P.E. Director DE Division of Air Quality NACAA JOINT PERMITTING AND ENFORCEMENT WORKSHOP December 9 11, 2014 Major Source Thresholds Pollutant Nonattainment
Worldwide Pollution Control Association
 Worldwide Pollution Control Association ESKOM Scrubber Seminar April 12 th 13 th, 2007 Visit our website at www.wpca.info Duke Carolinas Scrubbers Scott Williams Background North Carolina Clean Air Plan
Representing the Interests of America s Industrial Energy Users since 1978
 Representing the Interests of America s Industrial Energy Users since 1978 COMMENTS OF THE COUNCIL OF INDUSTRIAL BOILER OWNERS on EPA Proposed Reconsidered Rule National Emission Standards for Hazardous
New Nominal 44 MW CoGen Project Massachusetts Institute of Technology Prevention of Significant Deterioration Application (40 CFR 52.
 New Nominal 44 MW CoGen Project Massachusetts Institute of Technology Prevention of Significant Deterioration Application (40 CFR 52.21) Submitted to: Department of Environmental Protection Northeast Regional
ROCK CRUSHING PLANT APPLICATIONS ADVICE
 ROCK CRUSHING PLANT APPLICATIONS ADVICE This guidance is intended to help applicants prepare applications and certifications with a reduced amount of effort, yielding clearer and more accurate applications.