Pre-Event Activities. Blue River. Pre Field Trip Suggestions
|
|
|
- Daniella Stafford
- 5 years ago
- Views:
Transcription
1 Blue River Have you heard we all live in a watershed? Well, it is true! This total body activity will allow students to demonstrate how water flows in a watershed while exploring how seasonal variations affect the amount of water flowing through a river. With the local mountains serving as a backdrop, students can make connections to the watershed they live in.
2
3 Pre-Event Activities Blue River A watershed is an area of land that drains water toward a common river. It is also referred to as a drainage, basin, or catchment. You can trace the boundaries of a watershed on a topographical map by tracing a line along the highest elevations. Water from melted snowpack and rain will run off the highest elevations and merge into small headwater streams. As the water flows downhill, it will gather more water and join to become tributary streams. The tributaries then flow into the main stem of a river that will eventually flow out to the sea (with the exception of closed basins). Pre Field Trip Suggestions 1. Explain to students that we all live in a watershed. 2. Look at images and maps of the watershed students live in. USGS provides great examples, 3. Start a dialogue about what consequences certain environmentally harmful activities performed by populations of any given area in a watershed will affect communities in a different part of the watershed. 4. Discuss how weather events might impact water volume of streams and rivers. Brainstorm the similarities produced by surface runoff. Students might recall large storms where runoff appears to look like urban rivers flowing through their neighborhoods. Blue River Activity Adapted from Project WET Curriculum and Activity Guide, Generation 2.0 Full credit is given to the Project WET Foundation.
4 Activity Instructions Blue River Students participate in a whole-body exercise to simulate the movement of water through a river and its watershed. They will demonstrate water flows as affected by seasonal variations. Students will be assembled north to south in a manner that will represent the main stem of a river and its tributaries. Given CBWCD s location, it would be best to use an area with a slight slope, with the local mountains as a focal point to reinforce the idea that water flows from high to low elevations. It would be best to use an area with a slight slope, with the local mountains as a focal point to reinforce the idea that water flows from high to low elevations. Vocabulary Words: Basin Closed basin Drainage Gaging station Headwaters Main stem Runoff Spring Stream flow Watershed Catchment Downstream Floodplain Ground water Hydrograph Rivulet Snowpack Spring melt Tributary Materials Needed: beads or beans Large bucket One gallon pails Sign on sticks with pictures representing snow, rain, sun and each of the seasons (optional) Four chairs Length of rope or string Copies of Graph it! (one per two students)
5 Activity Instructions continued Blue River Creating a Watershed Part I Delineate the boundaries of a watershed with chairs or stakes. Students will assemble on a slight slope, simulating a river and its tributaries. Students at the headwaters of each stream will stand on a chair to reinforce that water flows from high to low elevations in a watershed. They will be responsible for passing one bead at a time downstream. Once they reach the last person in the river s main stem, the beads are deposited in a bucket and recorded at the end of the activity. Part II Instructors will call out seasons to demonstrate how seasonal variations affect the flow of a river and its tributaries. Each season simulation will be one minute in duration. Winter: When the minute begins, students pass beads/beans slowly, counting to three before passing it on. Spring: Snowpack begins to melt. Students pass beads quickly. When beads/beans inevitably spill, students must leave them to simulate flooding. Summer: Snowpack has melted. Streamflow decreases. Pass beads/beans at leisurely pace. Summer Storm: Pass beads/beans through one headwater stream for 20 seconds. Simulates isolated storm. Fall: Streams are slow. Student pass beads/beans after counting one or two before passing it on.
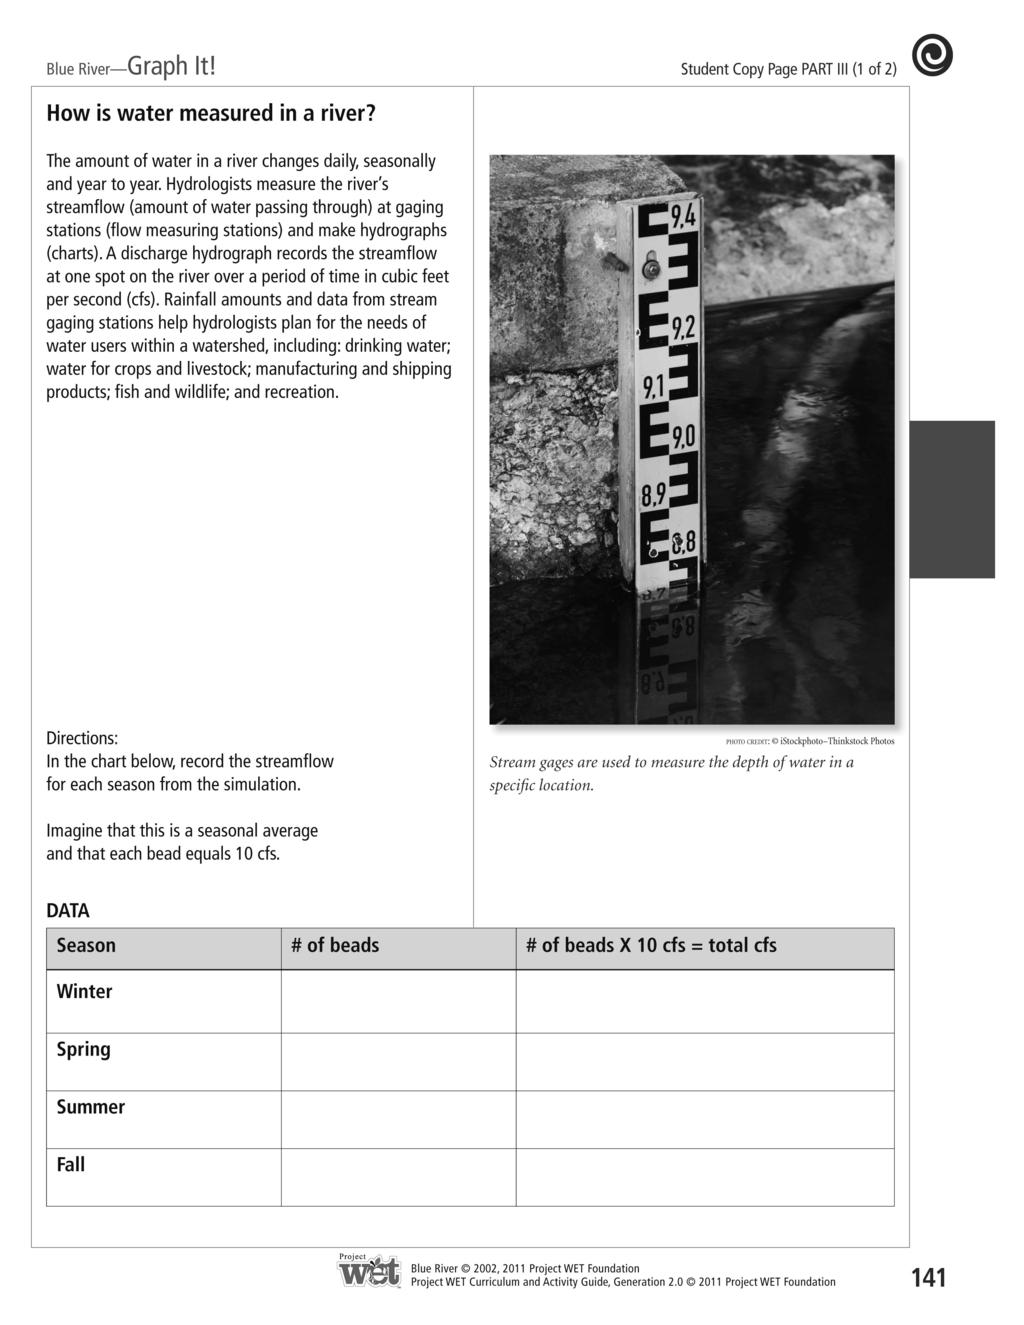
6 Post-Event Activities Blue River Post Field Trip Suggestions 1. Discuss with students the flow of water recorded at the mouth of the river for each season. Remind them that streamflow (amount of water passing through) is measured at several spots along a river, called gaging stations (measuring stations). This data is then represented in hydrographs (charts). A hydrograph records the streamflow at one spot on the river over a period of time in cubic feet per second (cfs) or cubic meters per second (cms). 2. Students can view data from gaging stations in their own watershed by visiting the USGS website, Have pairs of students record data from their simulation and complete the hydrograph on the Student Copy Page Graph it!
7
8
A Teacher Resource Guide for
 A Teacher Resource Guide for For Grades 3-6 Children s Museum of Virginia Children s Museum of Virginia Lesson Overview The education resource was developed using the 5E model of learning and involves
What is a Watershed? Lesson 2 Objectives Materials Background Advance Preparation Procedure
 What is a Watershed? Lesson 2 --------------------------------------------------------------------------------------------------------------------------- Objectives The student will be able to do the following:
UNIT HYDROGRAPH AND EFFECTIVE RAINFALL S INFLUENCE OVER THE STORM RUNOFF HYDROGRAPH
 UNIT HYDROGRAPH AND EFFECTIVE RAINFALL S INFLUENCE OVER THE STORM RUNOFF HYDROGRAPH INTRODUCTION Water is a common chemical substance essential for the existence of life and exhibits many notable and unique
THE WATER CYCLE IN GREATER VICTORIA
 THE WATER CYCLE IN GREATER VICTORIA KEY CONCEPTS THE GREATER VICTORIA DRINKING WATER SUPPLY SYSTEM IS DEPENDENT ON ANNUAL PRECIPITATION, WHICH FALLS MOSTLY AS RAIN. RESPONSIBILITY FOR WATER IS EVERYONE
EFFECT OF UPSTREAM DEVELOPMENT ON THE CLEAR CREEK AREA
 EFFECT OF UPSTREAM DEVELOPMENT ON THE CLEAR CREEK AREA Technical Memorandum Farming in the Floodplain Project Prepared for May 2017 PCC Farmland Trust Photo credit: Google Earth TABLE OF CONTENTS Page
When it Rains it Pours
 Lesson Summary: Students will understand how water is absorbed into the ground. They will also be able to explain the difference between pervious and impervious surfaces. Students will also learn about
BUILDING A WATERSHED MODEL
 BUILDING A WATERSHED MODEL OBJECTIVES Define a watershed and describe how it functions Identify that students live in a watershed within the San Antonio River Basin TOPICS Watersheds Runoff TEKS ALIGNMENT
Watersheds. A river is the report card for its watershed. Alan Levere. Arizona Water Issues 2010 The University of Arizona HWR203 1
 Watersheds A river is the report card for its watershed. Alan Levere 1 What separates watersheds? How do you identify watershed boundaries? Drainage Divides River Networks boto.ocean.washington.edu/gifs/purus.gif
INVESTIGATING YOUR STREAM S DRAINAGE BASIN
 IT S OUR WATER INVESTIGATING YOUR STREAM S STREAM ACTIVITY SUMMARY Using maps, students will determine land uses in the drainage basin of their stream and calculate the approximate percentage of impervious
Trends in Illinois River Streamflow and Flooding
 Trends in Illinois River Streamflow and Flooding H. Vernon Knapp, Interim Director Center for Watershed Science Illinois State Water Survey Institute of Natural Resource Sustainability University of Illinois
Municipal Stadium Wetland
 W A T E R S H E D F A C T S Total watershed area 140 mi 2 Average annual rainfall 38 in Average annual temperature 58 F Elevation Max 1321 ft Min 899 ft C. J. Brown Reservoir controls flow from 83 mi 2
Rock Creek Floodplain Analysis
 Rock Creek Floodplain Analysis www.co.washington.or.us By Jon Franczyk 1996 Flood, www.co.washington.or.us 1996 Flood, www.co.washington.or.us Project Outline Project Goals Introduction Background Study
2
 1 2 3 4 5 Context Our basin has diverse landscapes from the forested Cascade Mountains, the agricultural Willamette Valley, to the densely populated cities of Eugene, Salem, and Portland. Water flows through
21st Century Climate Change In SW New Mexico: What s in Store for the Gila? David S. Gutzler University of New Mexico
 21st Century Climate Change In SW New Mexico: What s in Store for the Gila? David S. Gutzler University of New Mexico gutzler@unm.edu Silver City, NM June 5, 2008 Global Warming in the 20th/Early 21st
Appendix VI: Illustrative example
 Central Valley Hydrology Study (CVHS) Appendix VI: Illustrative example November 5, 2009 US Army Corps of Engineers, Sacramento District Prepared by: David Ford Consulting Engineers, Inc. Table of contents
Reading the River, Summer Watersheds and Streams A unit for 8 th Grade Science. Arthur H. Shutt III. Bullitt Lick Middle School
 Reading the River, Summer 2001 Watersheds and Streams A unit for 8 th Grade Science Arthur H. Shutt III Bullitt Lick Middle School Bullitt County, Kentucky 1 Watersheds and Streams Grade Level: 8 Objectives
MODULE 1 RUNOFF HYDROGRAPHS WORKSHEET 1. Precipitation
 Watershed MODULE 1 RUNOFF HYDROGRAPHS WORKSHEET 1 A watershed is an area of land thaaptures rainfall and other precipitation and funnels it to a lake or stream or wetland. The area within the watershed
Hydrology and Water Management. Dr. Mujahid Khan, UET Peshawar
 Hydrology and Water Management Dr. Mujahid Khan, UET Peshawar Course Outline Hydrologic Cycle and its Processes Water Balance Approach Estimation and Analysis of Precipitation Data Infiltration and Runoff
Lab #2. Marcelo Almeida EEOS 121
 Marcelo Almeida EEOS 121 Lab #2 Materials: two adjacent topo maps showing the Pine Tree Brook Watershed 11" X 17" xerox of a topographic map of the Pine Tree Brook watershed 11" X 17" piece of velum tracing
Stanley J. Woodcock, Michael Thiemann, and Larry E. Brazil Riverside Technology, inc., Fort Collins, Colorado
 7.5 FRASER RIVER EXTENDED STREAMFLOW PREDICTION SYSTEM Stanley J. Woodcock, Michael Thiemann, and Larry E. Brazil Riverside Technology, inc., Fort Collins, Colorado Esther Vincent and Andy Pineda * Northern
Stream Reaches and Hydrologic Units
 Chapter United States 6 Department of Agriculture Natural Resources Conservation Service Chapter 6 Stream Reaches and Hydrologic Units Rain clouds Cloud formation Precipitation Surface runoff Evaporation
Water can have three states
 Water Cycle Goals 1. Know the states of water and how / why they change from one state to another 2. Describe the Water Cycle using specific and precise vocabulary when describing each part of the Water
Norman Maclean Snowmelt Flow rate Storm flows fs (c flow m a tre S
 Eventually, all things merge into one, and a river runs through it. Norman Maclean Understanding Streamflow ADEQ SW Short Course June 13, 213 Phoenix, AZ Hydrographs Discharge (Q) USGS flow data & plots
CONSISTENCY BETWEEN CUHP AND RATIONAL METHODS James C.Y. Guo, PhD, P.E., and Ben Urbonas, P.E., D.WRD 08/04/2008
 CONSISTENCY BETWEEN CUHP AND RATIONAL METHODS James C.Y. Guo, PhD, P.E., and Ben Urbonas, P.E., D.WRD 08/04/2008 When estimating runoff for a storm event it is assumed that the storm runoff occurs from
Culvert Sizing procedures for the 100-Year Peak Flow
 CULVERT SIZING PROCEDURES FOR THE 100-YEAR PEAK FLOW 343 APPENDIX A: Culvert Sizing procedures for the 100-Year Peak Flow A. INTRODUCTION Several methods have been developed for estimating the peak flood
ECOSYSTEMS, WATERSHEDS AND POLLUTION CONTROL REVIEW
 ECOSYSTEMS, WATERSHEDS AND POLLUTION CONTROL REVIEW ECOSYSTEMS: (6 th grade content) How biotic and abiotic factors make an ecosystem: https://www.youtube.com/watch?v=mdlwptkg-vi 1. A/An ecosystem is a
Nueces River Watershed
 Name period date assigned date due date returned In George West, we live next to the Nueces River. This river supplies many towns and cities with drinking water. It is very important to keep the river
Calculating System Development Charges for Stormwater Facilities
 Calculating System Development Charges for Stormwater Facilities Arthur C. Nelson Reprinted with permission from Nelson, Arthur C. 1995. System Development Charges for Water, Wastewater, and Stormwater
Water Budget III: Stream Flow P = Q + ET + G + ΔS
 Water Budget III: Stream Flow P = Q + ET + G + ΔS Why Measure Streamflow? Water supply planning How much water can we take out (without harming ecosystems we want to protect) Flood protection How much
GIS Applications in Water Resources Engineering
 King Fahd University of Petroleum & Minerals City & Regional Planning Department Introduction to Geographic Information Systems Term Paper Presentation GIS Applications in Water Resources Engineering Prepared
Hypothetical Flood Computation for a Stream System
 US Army Corps of Engineers Hydrologic Engineering Center Hypothetical Flood Computation for a Stream System December 1968 Approved for Public Release. Distribution Unlimited. TP-12 REPORT DOCUMENTATION
Hydrologic evaluation of flood flows from a burned watershed
 Flood Recovery, Innovation and Response II 257 Hydrologic evaluation of flood flows from a burned watershed A. W. Miller & E. J. Nelson Department of Civil & Environmental Engineering, Brigham Young University,
INFLOW DESIGN FLOOD CONTROL SYSTEM PLAN PLANT GREENE COUNTY ASH POND ALABMA POWER COMPANY
 INFLOW DESIGN FLOOD CONTROL SYSTEM PLAN PLANT GREENE COUNTY ASH POND ALABMA POWER COMPANY Section 257.82 of EPA s regulations requires the owner or operator of an existing or new CCR surface impoundment
Watersheds and the Hydrologic Cycle
 Watersheds and the Hydrologic Cycle The Global Hydrologic Cycle Water Cycle in Florida Florida Water Facts Surface Area = 170,452 km 2 Average Rainfall = 140 cm (55 ) Total Annual Rain = 238 billion m
Runoff Hydrographs. The Unit Hydrograph Approach
 Runoff Hydrographs The Unit Hydrograph Approach Announcements HW#6 assigned Storm Water Hydrographs Graphically represent runoff rates vs. time Peak runoff rates Volume of runoff Measured hydrographs are
Chapter 6. Hydrology. 6.0 Introduction. 6.1 Design Rainfall
 6.0 Introduction This chapter summarizes methodology for determining rainfall and runoff information for the design of stormwater management facilities in the City. The methodology is based on the procedures
2
 1 2 3 4 5 6 The program is designed for surface water hydrology simulation. It includes components for representing precipitation, evaporation, and snowmelt; the atmospheric conditions over a watershed.
Measuring Streamflow Lab
 1 Measuring Streamflow Lab Introduction Take a walk down to the banks of your local stream. What do you hear? Is it a lazily flowing river or a gurgling brook? What factors cause the velocity of a stream
APPENDIX A. This is a comprehensive map of the areas that will orient the. This map shows the cross-sectional Area A to B at which the
 APPENDIX A EXPLANATION OF MAPS AND PLANS 1. LOCATION MAP - PLATE 1 This is a comprehensive map of the areas that will orient the numbers indicated on the Flow Data Charts interested reader of general location
Proposed Project. Integrated Water Resources Management Using Remote Sensing Data in Upper Indus Basin
 Proposed Project Integrated Water Resources Management Using Remote Sensing Data in Upper Indus Basin Background Snowmelt contributes more than 6% of water resources of Upper Indus Basin Most of the moisture
Watershed: an area or ridge of land that separates waters flowing to different rivers, basins, or seas. It is the interdependent web of living
 Watershed: an area or ridge of land that separates waters flowing to different rivers, basins, or seas. It is the interdependent web of living organisms that inhabit a geographic area and depend on it
SPILL ESTIMATION. Not Just A Guess Anymore
 SPILL ESTIMATION Not Just A Guess Anymore SPILL ESTIMATION Under current regulations accurate spill estimation has become critical to the operation and maintenance of a sanitary collection system Reporting
COUNTY OF KANE. Kishwaukee River Headwaters Study Stakeholder Meeting Monday, February 26, :30 am Hampshire Village Hall
 COUNTY OF KANE ENVIRONMENTAL AND BUILDING MANAGEMENT Timothy Harbaugh, P.E., DEE Director County Government Center 719 Batavia Avenue Geneva, IL 60134 www.co.kane.il.us Environmental Management: (630)
Definitions 3/16/2010. GG22A: GEOSPHERE & HYDROSPHERE Hydrology
 GG22A: GEOSPHERE & HYDROSPHERE Hydrology Definitions Streamflow volume of water in a river passing a defined point over a specific time period = VxA discharge m 3 s -1 Runoff excess precipitation - precipitation
Application of SWAT Model in land-use. change in the Nile River Basin: A Review
 Application of SWAT Model in land-use change in the Nile River Basin: A Review By: Marwa Ali, Okke Batelaan and Willy Bauwens 15-6-2011 Application of SWAT Model in land-use 1 change in the Nile River
Water is everywhere on Earth oceans, glaciers, rivers, lakes, air,
 Section 6.1 6.1 Running Water 1 FOCUS Section Objectives 6.1 Explain how the water cycle circulates Earth s water supply in an unending cycle. 6.2 Explain how the water cycle is kept in balance. 6.3 Describe
SEWRPC Staff Memorandum
 SEWRPC Staff Memorandum EVALUATION OF PROPOSED STORMWATER QUANTITY MANAGEMENT FOR THE DES PLAINES RIVER WATERSHED PORTION OF THE PROPOSED FOXCONN DEVELOPMENT IN THE VILLAGE OF MOUNT PLEASANT June, 2018
Water Budget III: Stream Flow P = Q + ET + G + ΔS
 Water Budget III: Stream Flow P = Q + ET + G + ΔS Why Measure Streamflow? Water supply planning How much water can we take out (without harming ecosystems we want to protect) Flood protection How much
Rainfall, Runoff and Peak Flows: Calibration of Hydrologic Design Methods for the Kansas City Area
 Rainfall, Runoff and Peak Flows: Calibration of Hydrologic Design Methods for the Kansas City Area Bruce McEnroe, Bryan Young, Ricardo Gamarra and Ryan Pohl Department of Civil, Environmental, and Architectural
Building a Watershed Model
 9 Building a Watershed Model Purpose Students will build a model to identify the characteristics of a watershed. Students will learn how elevation determines the flow of water within a watershed. Overview
Flood risk management and land use planning in changing climate conditions Mikko Huokuna Finnish Environment Institute, SYKE
 10th International Drainage Workshop of ICID 06.-11. July 2008 Flood risk management and land use planning in changing climate conditions Mikko Huokuna Finnish Environment Institute, SYKE Background hydrological
Chehalis Basin Strategy Causes of Extreme Flooding. October 11, 2016 Policy Workshop
 Chehalis Basin Strategy Causes of Extreme Flooding October 11, 2016 Policy Workshop Agenda Hydrology o Precipitation o Flow Climate Change Effects Land Use o Channel straightening and incision o Riparian
Sincerely, The Educaiton Staff at the State Arboretum of Virginia
 1 A Blandy Experimental Farm Program Water Wonders Pre Trip Information: What to expect: Students will learn some indicators of water quality, and then will work in teams to collect measurements of several
HYDROLOGY NOTES LLAMA, LLAMA AND WRITE YOU NAME AND PERIOD AT THE TOP
 HYDROLOGY NOTES LLAMA, LLAMA AND WRITE YOU NAME AND PERIOD AT THE TOP QUIZ TIME: WHAT IS HYDROLOGY GOING TO BE ABOUT? A. A NATIVE AMERICAN MYTH ABOUT HYDROL THE SPIRIT WHO CONTROLS THE RAIN. B. AN EARLY
The Texas A&M University and U.S. Bureau of Reclamation Hydrologic Modeling Inventory (HMI) Questionnaire
 Questionnaire") The Texas A&M University and U.S. Bureau of Reclamation Hydrologic Modeling Inventory (HMI) Questionnaire May 4, 2010 Name of Model, Date, Version Number Dynamic Watershed Simulation Model (DWSM) 2002
The Texas A&M University and U.S. Bureau of Reclamation Hydrologic Modeling Inventory (HMI) Questionnaire May 4, 2010 Name of Model, Date, Version Number Dynamic Watershed Simulation Model (DWSM) 2002
Cokato Lake (86-263) Wright County. Hydrologic Investigation
 Wright County. Hydrologic Investigation") Cokato Lake (86-263) Wright County Hydrologic Investigation April 14, 2005 Cokato Lake (86-263) Wright County Hydrologic Investigation April 14, 2005 Problem Statement In recent years, heavy rainfall has
Cokato Lake (86-263) Wright County Hydrologic Investigation April 14, 2005 Cokato Lake (86-263) Wright County Hydrologic Investigation April 14, 2005 Problem Statement In recent years, heavy rainfall has
RIO GRANDE HEADWATERS RESPONSE TO CLIMATE AND FOREST CHANGE
 RIO GRANDE HEADWATERS RESPONSE TO CLIMATE AND FOREST CHANGE Melissa Valentin, PE, PhD Student and Terri Hogue, PhD, Professor Department of Civil and Environmental Engineering Colorado School of Mines,
HYDROLOGIC & HYDRAULIC ASPECTS of the Walnut Street Bridge over the Schuylkill River Philadelphia, PA
 HYDROLOGIC & HYDRAULIC ASPECTS of the Walnut Street Bridge over the Schuylkill River Philadelphia, PA J. Richard Weggel CAEE201 Lectures 30 April & 2 May 2007 HYDROLOGY (Natural Science) Study of the waters
Climate Change Impacts in Washington State
 Climate Change Impacts in Washington State Lara Whitely Binder Climate Impacts Group College of the Environment University of Washington Evergreen College January 13, 2016 Climate Science in the Public
SERVATION Focus Questions: What is a watershed? How do we manage it to make sure our water is clean and plentiful?
 Thank you for participating in the Arizona Water Festival program! Our program assessment shows that students who experience the entire Water Festival unit, from pre-lessons to post-lessons, get far more
Attachment 12 Stage 1 Flood Risk Assessment (IE RP-0001)
") IE0311133-22-RP-0001, Issue A 17/10/2013 Attachment 12 Stage 1 Flood Risk Assessment (IE0311133-30-RP-0001) IE0311133-22-RP-0001_A_02.DOC Flood Risk Assessment Celebrating 40 Years in Business Jazz Pharmaceuticals
IE0311133-22-RP-0001, Issue A 17/10/2013 Attachment 12 Stage 1 Flood Risk Assessment (IE0311133-30-RP-0001) IE0311133-22-RP-0001_A_02.DOC Flood Risk Assessment Celebrating 40 Years in Business Jazz Pharmaceuticals
Water Resources on PEI: an overview and brief discussion of challenges
 Water Resources on PEI: an overview and brief discussion of challenges Components: Components and links Atmospheric water Surface water (including glacial water) Groundwater Links: Precipitation (atm(
Timing Key Narrative Snapshots a) 00:44 How does groundwater recharge occur? How do streams form?
 00:44 How does groundwater recharge occur? How do streams form?") Module 4 Narration: Runoff and Recharge Timing Key Narrative Snapshots a) 00:44 How does groundwater recharge occur? How do streams form? These processes are closely linked. Lets first investigate how
Module 4 Narration: Runoff and Recharge Timing Key Narrative Snapshots a) 00:44 How does groundwater recharge occur? How do streams form? These processes are closely linked. Lets first investigate how
Freshwater. 260 Points Total
 9 SURFACE WATER SECTION 9.1 Surface Water Movement In your textbook, read about surface water and the way in which it moves sediment. Complete each statement. (13 points) 1. An excessive amount of water
Hydrologic cycle, runoff process
 Hydrologic cycle, runoff process Motivation of hydrological modelling What happens at the catchment and in the stream when it rains? How does the increased/decreased runoff affect (not only) the landowners
Flood Plain Functions
 Flood Plain Functions Lesson Abstract Summary: MO GLE: Subject Areas: Students will connect knowledge from previous watershed lessons to understand the functions of flood plains by participating in group
AS A COURTESY, PLEASE TURN OFF CELL PHONES AND PAGERS WHILE MEETING IS IN PROGRESS.
 Table of Contents Agenda 2 Wastewater Treatment Plant (WWTP) Hydraulic Capacity Update Staff Report 3 WWTP Capacity Outline 5 WWTP Capacity Charts 6 Drainage Concerns on Oak Hill Drive and Quail Drive
PART 3 - STANDARDS FOR SEWERAGE FACILITIES DESIGN OF STORM SEWERS
 PART 3 - STANDARDS FOR SEWERAGE FACILITIES 3.3 - DESIGN OF STORM SEWERS 3.301 Design of Storm Sewers A. General Information B. Investigations and Surveys C. Special Projects 3.302 Design Criteria for Storm
Hydrologic Calibration:
 Hydrologic Calibration: UPDATE OF EFFECTIVE HYDROLOGY FOR MARYS CREEK October 2010 Agenda Background Hydrologic model Calibrated rainfall Hydrologic calibration 100 year discharges, Existing Conditions
Overview of NRCS (SCS) TR-20 By Dr. R.M. Ragan
 TR-20 By Dr. R.M. Ragan") Overview of NRCS (SCS) TR-20 By Dr. R.M. Ragan TR-20 is a computer program for the simulation of runoff occurring from a single storm event. The program develops flood hydrographs from runoff and routes
Overview of NRCS (SCS) TR-20 By Dr. R.M. Ragan TR-20 is a computer program for the simulation of runoff occurring from a single storm event. The program develops flood hydrographs from runoff and routes
Ch 18. Hydrologic Cycle and streams. Tom Bean
 Ch 18. Hydrologic Cycle and streams Tom Bean Wednesday s outline 1. the hydrologic cycle reservoirs cycling between them Evaporation and the atmosphere 2. Surface hydrology infiltration and soil moisture
Background Information on the. Peace River Basin
 Background Information on the Peace River Basin Resource Conservation & Development Department August 24 Background Physiography The Peace River drainage basin occupies large parts of Polk, Hardee, DeSoto,
Hydrology Study. Ascension Heights Subdivision Ascension Drive at Bel Aire Road San Mateo, California (Unincorporated)
") Hydrology Study Ascension Heights Subdivision Ascension Drive at Bel Aire Road San Mateo, California (Unincorporated) Prepared for San Mateo Real Estate & Construction March 9, 21 Rev. 1 11-8-211 Rev.
Hydrology Study Ascension Heights Subdivision Ascension Drive at Bel Aire Road San Mateo, California (Unincorporated) Prepared for San Mateo Real Estate & Construction March 9, 21 Rev. 1 11-8-211 Rev.
Pre/Post Assessment Rubric for Unit: Urban Storm Hydrograph Modeling with the Rational Method for the Urban Desert Southwest USA
 Pre/Post Assessment Rubric for Unit: Urban Storm Hydrograph Modeling with the Rational Method for the Urban Desert Southwest USA 28 September 2012 (revision 3, 16 April 2013) Benjamin L. Ruddell, Arizona
Climate Change in the Columbia Basin. Stephanie Smith Manager of Hydrology, BC Hydro
 Climate Change in the Columbia Basin Stephanie Smith Manager of Hydrology, BC Hydro June 20, 2017 Outline Climate change in the Columbia River basin What has happened? What could happen? What can we do
Suspended Sediment Discharges in Streams
 US Army Corps of Engineers Hydrologic Engineering Center Suspended Sediment Discharges in Streams April 1969 Approved for Public Release. Distribution Unlimited. TP-19 REPORT DOCUMENTATION PAGE Form Approved
Module 4.3. Energy in the Earth s Systems How do external and internal sources of energy affect the Earth s systems? CT Science Framework Topics
 Module 4.3 Energy in the Earth s Systems How do external and internal sources of energy affect the Earth s systems? Science Content Standard 4.3 CT Science Framework Topics 1. Water is continuously moving
Economics of Green Infrastructure in Adapting to Extreme Precipitation
 Economics of Green Infrastructure in Adapting to Extreme Precipitation ERG: Arleen O Donnell, Tess Forsell, Lauren Scott Horsley Witten Group: Nate Kelly and Kathleen McAllister NOAA Coastal Services Center
Bird Track Springs Basis of Design Report APPENDIX HYDROLOGIC ANALYSIS FOR BIRD TRACK RESTORATION PROJECT
 Bird Track Springs Basis of Design Report APPENDIX C HYDROLOGIC ANALYSIS FOR BIRD TRACK RESTORATION PROJECT Technical Memorandum Date March 1, 2016 To: From: RE: Mike Knutson, Bureau of Reclamation Nick
Hydrology and Flooding
 Hydrology and Flooding Background The 1996 flood Between February 4, 1996 and February 9, 1996 the Nehalem reporting station received 28.9 inches of rain. Approximately 14 inches fell in one 48 hour period.
Radar-based flood forecasting: Quantifying hydrologic prediction uncertainty
 Severe Storms Prediction and Global Climate Impact on the Gulf Coast, Rice University, October 29 31, 2008 Radar-based flood forecasting: Quantifying hydrologic prediction uncertainty Baxter E. Vieux,
The Hydrologic Cycle. Floods 3 5. Flood Science LESSON PLAN 1. Key Terms and Concepts. Purposes. Objectives
 LESSON PLAN 1 The Hydrologic Cycle Floods It is important for children to understand the hydrologic cycle in preparation for learning the science behind floods and flash floods. Key Terms and Concepts
Appendix G Preliminary Hydrology Study
 Appendix G Preliminary Hydrology Study Preliminary Hydrology Study VESTING TTM 72608 Long Beach, CA Prepared for: The Long Beach Project, LLC 888 San Clemente, Suite 100 New Port Beach, CA May 28, 2014
Hydrology for Folsom Dam Water Control Manual Update
 Hydrology for Folsom Dam Water Control Manual Update Brian Walker, EIT Civil Engineer, Hydrology Section U.S. Army Corps of Engineers Sacramento District 1325 J Street Sacramento, CA 95816 Tel: (916) 557-7376
HYDROLOGY REPORT HEACOCK & CACTUS CHANNELS MORENO VALLEY, CALIFORNIA NOVEMBER 2005 REVISED APRIL 2006 REVISED AUGUST 2006
 HYDROLOGY REPORT HEACOCK & CACTUS CHANNELS MORENO VALLEY, CALIFORNIA NOVEMBER 2005 REVISED APRIL 2006 REVISED AUGUST 2006 RIVERSIDE COUNTY FLOOD CONTROL AND WATER CONSERVATION DISTRICT TABLE OF CONTENTS
SAN BERNARD RIVER WATER QUALITY MODEL UPDATE. August 18, 2011
 SAN BERNARD RIVER WATER QUALITY MODEL UPDATE August 18, 2011 Agenda Model Set-up Watershed model Watershed delineations Generate model input files & establish coefficients Receiving Water model Establish
A Journey Down the Tuin: the Hydraulics of an Internal Draining River from the Khangai Mountains to the Gobi Desert
 Proceedings of the Trans-disciplinary Research Conference: Building Resilience of Mongolian Rangelands, Ulaanbaatar Mongolia, June 9-10, 2015 A Journey Down the Tuin: the Hydraulics of an Internal Draining
Stormwater Runoff Water Quality Characteristics From Highways in Lake Tahoe, California
 California State University, Sacramento (CSUS) University of California, Davis (UCD) California Department of Transportation (Caltrans) Stormwater Runoff Water Quality Characteristics From Highways in
Modeling a Complex Hydraulic Environment Using a 1-D Approach Supplemented with Simple 2-D Principles Manas Borah Ed Dickson June 5, 2014
 ASFPM 2014 Annual Conference Modeling a Complex Hydraulic Environment Using a 1-D Approach Supplemented with Simple 2-D Principles Manas Borah Ed Dickson June 5, 2014 Agenda Overview and Background Hydrology
Long-Range Hydrology Study
 Long-Range Hydrology Study Northshore Mining Company Final Report November 2008 4700 West 77 th Street Minneapolis, MN 55435-4803 Phone: (952) 832-2600 Fax: (952) 832-2601 Long-Range Hydrology Study: Final
IPCC WG II Chapter 3 Freshwater Resources and Their Management
 IPCC WG II Chapter 3 Freshwater Resources and Their Management Impacts increasingly harmful & more costly to adapt as global temperature increases May imperil sustainable development goals Semi-arid /
What is runoff? Runoff. Runoff is often defined as the portion of rainfall, that runs over and under the soil surface toward the stream
 What is runoff? Runoff Runoff is often defined as the portion of rainfall, that runs over and under the soil surface toward the stream 1 COMPONENTS OF Runoff or STREAM FLOW 2 Cont. The types of runoff
Iowa Climate Change Adaptation and Resilience: Applying Climate Data to Plans & Ordinances
 Iowa Climate Change Adaptation and Resilience: Applying Climate Data to Plans & Ordinances Christopher J. Anderson, PhD Assistant Director, Climate Science Program Iowa State University Integrating Hazard
fcgov.com/water-quality Water Quality Update Summer 2017 Monitoring and Protecting Our Water Sources
 Water Quality Update Summer 217 Monitoring and Protecting Our Water Sources SOURCE WATER MONITORING The Upper Cache la Poudre (UCLP) Watershed Collaborative Monitoring Program was established in 28 between
Review Zone Application for D&R Canal Commission Decision
 Review Zone Application for D&R Canal Commission Decision MEETING DATE: June 15, 2016 DRCC #: 15-4748 Phase I and II Latest Submission Received: May 4, 2016 Applicant: Kevin Hayes Country Club Meadows,
New Castle County, DE. Floodplain Regulations
 New Castle County, DE Floodplain Regulations John J. Gysling, PE CFM Department of Land Use New Castle County, DE February 26, 2009 Today s Presentation Floodplain Protection and Uses Terms and Definitions
Runoff Processes. Daene C. McKinney
 CE 374 K Hydrology Runoff Processes Daene C. McKinney Watershed Watershed Area draining to a stream Streamflow generated by water entering surface channels Affected by Physical, vegetative, and climatic
In Your House and in Your Yard, Watch for Water, Be on Guard
 In Your House and in Your Yard, Watch for Water, Be on Guard KEY TERMS Arroyo: A water-carved gully or a normally dry creek found in arid or desert regions. Dam: A barrier built across a river, stream
Sunset Circle Vegetated Swale and Infiltration Basin System Monitoring Report: Rainy Seasons and
 Sunset Circle Vegetated Swale and Infiltration asin System Monitoring Report: Rainy Seasons 2012-13 and 2013-14 bstract Site Summary Project Features Sunset Circle Vegetated swales and infiltration basins
Lecture 9A: Drainage Basins
 GEOG415 Lecture 9A: Drainage Basins 9-1 Drainage basin (watershed, catchment) -Drains surfacewater to a common outlet Drainage divide - how is it defined? Scale effects? - Represents a hydrologic cycle