Globalization and urban environmental change in the Asia Pacific Region
|
|
|
- Daniela Underwood
- 5 years ago
- Views:
Transcription

1 UN DESA International workshop on Global urbanization, internal migration, population distribution and development January 2008 Globalization and urban environmental change in the Asia Pacific Region Peter J. Marcotullio Hunter College, CUNY United Nations University
2 Outline of talk Background Socio-ecological systems (SESs) and urban development Globalization and urban development Selected evidence of unique urban SES relationships in the Asia Pacific region Conclusions
3 Background
4 Socio-ecological systems Socio-ecological systems are composed of coupled human or social spheres and environmental or ecological spheres (SES). AKA as coupled human and natural systems (CHANS) Activities and changes in one sphere are dependent upon and interact with elements and processes in the other One way to make these linkages is through the concept of ecosystem services
5 Socio-ecological system change over time The social or human sphere has dramatically changed over the past 150 years in terms of absolute size and intensity of activities as well as in relative size and interaction with the ecological sphere; The implication is that the social sphere has grown and has increasingly linked (in more, deeper and more complex ways) to the environmental or ecological sphere;
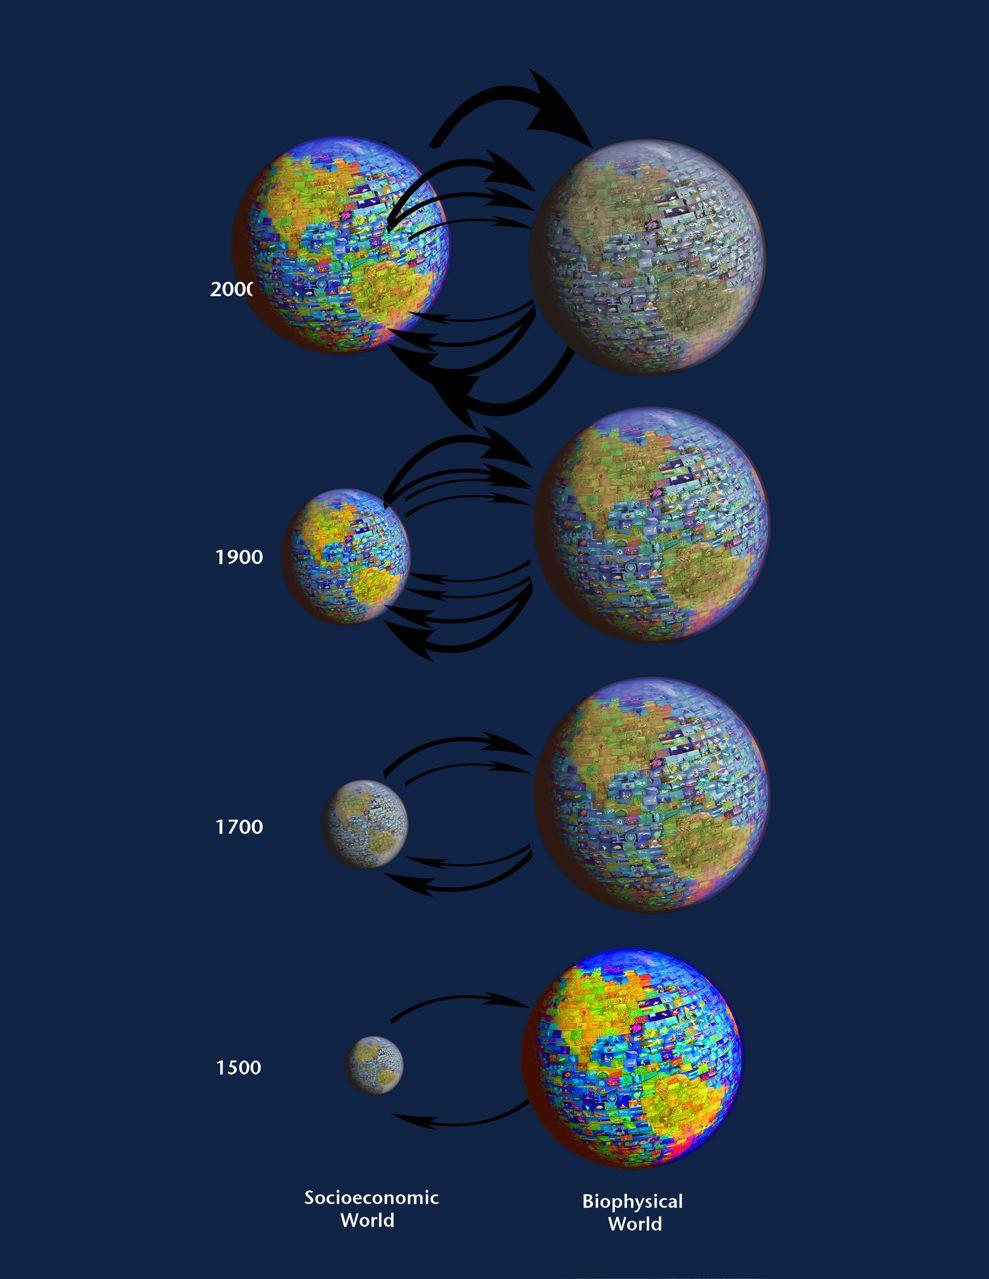
6 Socio-ecological systems
7 Globalization Globalization is defined as: the widening, deepening and speeding up of worldwide interconnectedness in all aspects of contemporary social life, from the cultural to the criminal, the financial to the spiritual (Held, et al, 1999) Globalization is not a single variable but a complex set of phenomena, captured in a large number of different variables
8 Globalization Previously indicators of the widening and deepening focused on, inter alia, the increasing number of multi-lateral and bi-lateral agreements and levels of trade, the increasing number of countries receiving Foreign Direct Investments (FDI) and other forms of capital and quantity of inflows and stocks, international travel, immigration sources and destinations, etc
9 Globalization Emphasis on socio-ecological development includes additional indicators such as increasing number and size of impacted ecosystems, spread of diseases, movements and concentrations of toxics, air pollutants, energy supplies, invasive species, etc;
10 Globalization Widening processes have attributed to the formation of a world city system in which urban regions articulated to the system are connected through economic, political, social and biological (genetic, species, population, etc), ecosystem services, waste/emissions flows; Deepening processes have attributed to world city formation or the accumulation of the world s capital in the major metro region and increased consumption of ecosystem services, increased interference with biogeochemical flows, more intensive reliance on social responses as ecosystem functions deteriorate, etc
11 Globalization The speeding up of interconnections have been facilitated by advanced technologies in telecommunications and transport and indicators of increasing speed include, for example, in the speed of transactions (and the lower relative costs of communications and people and goods movement) Increasing rates of change can also been observed in the socio-ecological systems, which are changing faster than previously experienced
12 Globalization Moreover, changing speeds and timing also influences the patterning of environmental transitions (McGranahan et al, 2001). In the past the transition from one set of environmental conditions to another took a longer period of time than it does today and occurred in a more simultaneous fashion. Given current patterns experienced by rapidly developing world cities, relationships that define the structure of urban environmental transition may no longer exit;
13 Selected evidence of unique urban SES relationships in the Asia Pacific region associated with globalization
14 Comparative impacts of Globalization in the Asia Pacific Globalization has impacted urban development in the Asia Pacific in following 4 ways: Widening: changes in SESs are being experienced sooner (at lower levels of GDP per capita or lower urbanization levels) than in the past Deepening: the extent of impact of social sphere on biophysical sphere in some cases is less intensive per capita, but potentially larger in absolute value and in other cases larger in impact per capita Speeding up: the speed of SESs change is more rapid than previously experienced; Speeding up: previously experienced sequential patterns associated with impact-responses are now experienced more simultaneously
15 Comparative widening Some changes within urban regions of the Asia Pacific are being experienced at lower economic or urbanization levels than in the past Major development patterns, such as urbanization, are occurring at lower levels of income Technologies are diffusing at lower levels of income Ecological degradation, such as transportation CO2 emissions, is occurring at lower levels of income Shifts in energy sources are occurring at lower levels of urbanization


16 Comparative changes in urbanization levels: USA and selected Asian economies
17 Technological Diffusion Comparison of Growth in ICT (Internet) Penetration by National GDP per capita USA Japan Korea Hong Kong Malaysia Thailand China GDP Per Capita
18 Comparative emergence of transportation CO2 emissions Total transportation CO2 emissions (kg) per capita per GDP per capita 3000 CO2 emissions (kg) per capita GDP per capita ASEAN-4 Least Developed Asian Asian Tigers Latin American Northern African Japan European Central and Eastern European USA
19 Share of Coal in TFC by Urbanization level USA Japan Philippines People's Republic of China Korea Malaysia Indonesia Thailand Urbanization level
20 Comparative deepening For some impacts changes are less intensive per capita, but potentially larger in absolute value. For other impacts changes are more intensive per capita; For some nations in the region transportation-related CO 2 emissions are lower then previously experienced Total CO2 emissions per capita are lower than some developed countries at all levels of GDP Consumption is higher per capita for some ecosystem goods and services
21 6,000 Figure 2: Road carbon dioxide emissions per capita by GDP per capita, USA and selected developed economies Road carbon dioxide emissions (kg per capita) 5,000 4,000 3,000 2,000 1,000 USA Australia France the Netherland s Italy Sweden GDP per capita (1990 G-K$) Source: Marcotullio 2006
22 Simplified chart of comparative developed economy trends with shaded area between the Netherlands and Australian curves 6,000 5,000 4,000 3,000 2,000 USA Australia France Italy Netherlands Sw eden UK 1, ,000 10,000 15,000 20,000 25,000 30,000 Source: Marcotullio and Marshall 2007
23 Group A low emitters Figure 3a Singapore Japan Hong Kong Source: Marcotullio and Marshall 2007
24 Group B medium emitters Figure 3b South Korea Taiw an Source: Marcotullio and Marshall 2007
25 Group C high emitters Figure 3c Malaysia Thailand Source: Marcotullio and Marshall 2007
26 7 Comparative changes in CO2 emissions per capita by GDP g p g p p y p p GDP per capita US Japan Romania South Africa Albania Philippines Hungary Poland Mexico Brazil Chile Egypt Tunisia Portugal Sri Lanka Indonesia Ireland Hong Kong Malaysia Thailand China Singapore Taiwan South Korea Rapid Developers Moderate Developers Non-rapid developers Source: Marcotullio and Schulz 2007
27 Cumulative impact may be larger Between now and 2030, a predicted additional 600 million people in developing countries will become middle class bringing the total population in these regions to 1 billion; By 2040, consumption of motor vehicles in China and India alone is predicted to match total global figures of today (800 million vehicles in use) (Goldman Saks, 2005, The Economist, 2006);
28 Average Daily Consumption per Capita by GDP Calories per day per capita China India Indonesia Japan Malaysia Philippines South Korea Thailand Viet Nam United States of America ,000 10,000 15,000 20,000 25,000 30,000 GDP per capita (G-K International dollars)
29 Comparative speeding up Changes are more rapid than previously experienced; Speed of urbanization is faster in many Asia Pacific nations when compared to the developed world Growth in energy supply is faster


30 Comparative speed of urbanization: USA and selected Asian economies Source: Marcotullio and Schulz 2008


31 Comparison in speed of increases in energy supply: USA and selected Asian economies Source: Marcotullio and Schulz 2007
32 Comparative speeding up: timing of impacts Previously experienced sequential development patterns are now experienced simultaneously Sets of multi-scale environmental conditions within urban populations of different income in the region Multi-scale urban water related conditions in Southeast Asia
33 Current Situation Urban Environmental Transitions CO2 Emissions Per Capita Y = (e 1.793X) R2 =.68 sign Standardized Value Percent Non-access to Safe Water Y = (2.087/X) R2 =.28 sign.000 SO2 Emissions Per Capita Y = (2.574X)+(-0.346X2) R2 =.22 sign Log GDP Per Capita Source: Marcotullio and Lee, 2003
34 Estimated Urban Population Living Under Different Environmental Conditions Total Urban Population Share of 1995 GDP Category Environmental (thousands) Total (US$) Challenge (N) (%) < Lack of Water and Sanitation ("brown" issues) 456, > and < 1, Rising Industrial pollution ("gray" issues), and significant "brown" issues 518, > 1, and < 3, High "grey" issues, rising modern risks ("green" issues) and "brown" issues 526, > 3, and < 14,125.3 High but decreasing "gray" issues, rising "green" issues 296, > 14,125.3 Largely "green" issues 613, Missing 147, Total global urban population 2,560,195 Source: Marcotullio and Lee, 2003
35 Sets of urban water related issues by scale within urban regions of ASEAN City Local Metro-wide Regional and global Low-income cities Low levels water supply coverage River and coastal water pollution Economic water scarcity Low levels of sanitation coverage Overdrawn groundwater Vulnerability due to climate change Poor drainage Subsistence Coastal area degradation Flooding Middle-income cities Low levels of water supply coverage River and coastal water pollution Economic water scarcity Low levels of sanitation coverage Overdrawn groundwater Vulnerability due to climate change Poor drainage Subsistence Coastal area degradation Flooding Upper-middle income cities Low levels to incomplete sanitation coverage River and coastal water pollution Increasing water consumption per capita Water supply coverage not complete Overdrawn groundwater Vulnerability due to climate change poor to inadequate drainage Subsistence Coastal area degradation Flooding High income cities River and coastal water pollution Coastal area degradation Physical water scarcity Increasing water consumption per capita Vulnerability due to climate change Notes: Cities in low income category include Vientiane, Phnom Phen, Hanoi, Ho Chi Minh, among others Cities in the middle income category include Manila, Jakarta, among others Cities in the upper-middle income category include Bangkok, Kuala Lumpur, among others Cities in the high income category include Singapore
36 Conclusions Globalization, at least at a theoretical level, is implicated in the structural differences between rapidly developing and developed world experiences with environmental conditions Widening, deepening and speeding up have underpinned increasingly diverse phenomena located in increasingly centralized nodes (cities) and altered time-space dynamics;
37 Conclusions While there is some evidence for the sooner (at lower levels of income and urbanization), faster (over time) and more simultaneous experiences of socio-ecological conditions, the impacts of these seemingly chaotic conditions have been both a lowering of levels of per capita impact in some areas (i.e., transportation CO2 emissions, energy consumption) and an increasing impact in other areas (i.e., ecosystem service consumption)
38 Conclusions The differences between these two results may be due to both the advantages of technology and public policy. In the rapidly developing world transportation emissions reductions have been due to a combination of motor vehicle reduction or control policies and the diffusion of low fuel consumption technologies; In the areas where there is higher impact, there is less or no policies;
39 Conclusions These broad observations demonstrate differences dependent upon the data sources (UN DESA, IEA, OECD, US Census, etc) and therefore require further exploration at both the global and regional scale and through local scale case study comparisons


40 Globalization and urban environmental change in the Asia Pacific Region The End
Outlook for Energy Market in Asia (India and ASEAN)
") 9 June, 2017 Smart Community Summit 2017 Outlook for Energy Market in Asia (India and ASEAN) Shigeru SUEHIRO Energy Data and Modelling Center (EDMC) The Institute of Energy Economics, Japan (IEEJ) 1 Energy
9 June, 2017 Smart Community Summit 2017 Outlook for Energy Market in Asia (India and ASEAN) Shigeru SUEHIRO Energy Data and Modelling Center (EDMC) The Institute of Energy Economics, Japan (IEEJ) 1 Energy
A Ten Year Strategic Outlook for the Global Flexible Plastic Packaging Market. Sample pages. Commodity Inside Ltd
 A Ten Year Strategic Outlook for the Global Flexible Plastic Packaging Market Sample pages Chapter 1- Executive summary 1.1 Changes in the global flexible plastic packaging industry 1.2 Cost effectiveness
Three topics: Regionalism s Rationale Structural Trade Barriers and Infrastructure Demand Side Perspective
 Comments on Asian Trade and Regional Integration David Roland-Holst, UC Berkeley Three topics: Regionalism s Rationale Structural Trade Barriers and Infrastructure Demand Side Perspective 2 June 2006 Pan
Motorization and Environmental Problem in Asia Kiyoyuki Minato Japan Automobile Research Institute
 2008.11.2 JARI JBIC-LPEM Workshop in Jakarta Motorization and Environmental Problem in Asia Kiyoyuki Minato Japan Automobile Research Institute 1 Contents 1. Japanese Environmental Policy 2. Motorization
GLOBAL VIDEO-ON- DEMAND (VOD)
") GLOBAL VIDEO-ON- DEMAND (VOD) HOW WORLDWIDE VIEWING HABITS ARE CHANGING IN THE EVOLVING MEDIA LANDSCAPE MARCH 2016 A CHANGING VIDEO-VIEWING LANDSCAPE Nearly two-thirds of global respondents say they watch
GLOBAL VIDEO-ON- DEMAND (VOD) HOW WORLDWIDE VIEWING HABITS ARE CHANGING IN THE EVOLVING MEDIA LANDSCAPE MARCH 2016 A CHANGING VIDEO-VIEWING LANDSCAPE Nearly two-thirds of global respondents say they watch
Evolution of Production Network: Measuring Trade in value-added (TiVA)
") Evolution of Production Network: Measuring Trade in value-added (TiVA) Norihiko YAMANO Directorate for Science Technology and Industry, OECD Working Party on Globalisation of Industry Committee on Industry,
Evolution of Production Network: Measuring Trade in value-added (TiVA) Norihiko YAMANO Directorate for Science Technology and Industry, OECD Working Party on Globalisation of Industry Committee on Industry,
ASIA PACIFIC ADVERTISING TRENDS
 ASIA PACIFIC ADVERTISING TRENDS April 2017 Table of Contents Executive Summary 1-24 Sources And Methodology 3 Overview 4-8 Asia Pacific Advertising Revenue (US$ mil.) 5 Asia Pacific Advertising Market
3-1. Progress Report on the APEC Outlook
 APERC Workshop at EWG 54 Wellington, New Zealand, 20 November 2017 3-1. Progress Report on the APEC Outlook James Kendell Vice President, APERC Modelling changes for the 7 th edition Extend forecast to
OECD WORK ON GLOBAL VALUE CHAINS AND TRADE IN VALUE ADDED
 OECD WORK ON GLOBAL VALUE CHAINS AND TRADE IN VALUE ADDED Koen De Backer Workshop on Global Value Chains in Shipbuilding Paris, November 01 The emergence of Global Value Chains Final consumption Final
Introduction and Background of the ILSI Japan/MAFF Project
 International Conference on Infrastructure Needs for a Food Control System: Roadmap for Regional Harmonization Introduction and Background of the ILSI Japan/MAFF Project December 9, 2014 New Delhi, India
Recent trends in trade
 level 2 Recent trends in trade Marc Bacchetta ERSD - WTO Trends in trade Dramatic increase in both the volumes and values of trade between 1980 and 2011, mostly manufactured goods. World trade grew much
The Future of Nuclear Power after Fukushima
 The Future of Nuclear Power after Fukushima Thomas Jonter Professor of International Relations Stockholm University Trends Energy consumption map 1 Before Fukushima: Nuclear Renaissance Reasons: The increasingly
Trading patterns: Global and regional perspectives
 Chapter V Trading patterns: Global and regional perspectives World merchandise trade in value terms fell by 3 per cent in 2016 following a 13 per cent slump recorded in 2015, with trade growth remaining
Energy Efficiency & the Energy Future in ASEAN Amit Bando, Executive Director, IPEEC Bangkok, Thailand 5 June 2013
 Energy Efficiency & the Energy Future in ASEAN Amit Bando, Executive Director, IPEEC Bangkok, Thailand 5 June 2013 1. What is IPEEC? 1 2 3 IPEEC is a high level international forum Provides global leadership
Solution Partner Program Global Perspective
 Solution Partner Program Global Perspective SPACe 2012 Siemens Process Automation Conference Business Development Solution Partner Program Copyright Siemens AG 2012. All rights reserved Solution Partner
Siemens Partner Program
 Siemens Partner Program Factory Automation Partner Strategy for Factory Automation End Customer Focus on core competencies Demand on efficient solutions Certified Partner Added value in solutions and services
Estimating Infrastructure s s Potential as a Catalyst for Asian Regional Integration, Growth, and Economic Convergence
 Estimating Infrastructure s s Potential as a Catalyst for Asian Regional Integration, Growth, and Economic Convergence David Roland-Holst, UC Berkeley joint work with Ifzal Ali and Fan Zhai,, ADB presented
PETER J. MARCOTULLIO ERIC WILLIAMS JULIAN D. MARSHALL
 JOURNALOF Marcotullio et ENVIRONMENT al. / FASTER, SOONER, & DEVELOPMENT AND MORE SIMULTANEOUSLY 10.1177/1070496504273716 Faster, Sooner, and More Simultaneously: How Recent Road and Air Transportation
Quarterly Survey of Overseas Subsidiaries (Survey from July to September 2017) ~ Summary of the Results ~
 ~ Summary of the Results ~") Quarterly Survey of Overseas Subsidiaries (Survey from July to September 2017) ~ Summary of the Results ~ December 27, 2017 Research and Statistics Department Ministry of Economy, Trade and Industry 1
Quarterly Survey of Overseas Subsidiaries (Survey from July to September 2017) ~ Summary of the Results ~ December 27, 2017 Research and Statistics Department Ministry of Economy, Trade and Industry 1
THE ECONOMIC IMPACT OF IT, SOFTWARE, AND THE MICROSOFT ECOSYSTEM ON THE GLOBAL ECONOMY
 Addendum THE ECONOMIC IMPACT OF IT, SOFTWARE, AND THE MICROSOFT ECOSYSTEM ON THE GLOBAL ECONOMY METHODOLOGY AND DEFINITIONS Global Headquarters: 5 Speen Street Framingham, MA 01701 USA P.508.872.8200 F.508.935.4015
Strategy and Outlook Annual General Meeting. Hubert Sagnières May 5, 2011
 Strategy and Outlook 2011 Annual General Meeting Hubert Sagnières May 5, 2011 The Optical Market in 2011 A still significantly under-penetrated market A high ramp-up potential A growing, profitable mid-range
CONVERSION FACTORS. Standard conversion factors for liquid fuels are determined on the basis of the net calorific value for each product.
 CONVERSION FACTORS The data which have been supplied by the countries in original units are converted to the common unit, terajoules (TJ), by using standard conversion factors or, in the case of solids,
Argus Benzene Annual 2017
 Argus Benzene Annual 2017 Petrochemicals illuminating the markets Market Reporting Consulting Events Argus Benzene Annual 2017 Summary The Argus (formerly DeWitt) Benzene Annual has provided an accurate
Decision taken from September 2010 Four focus areas: megacities, informal sector, global recycling markets & international aid tools Members: Antonis
 ISWA s Task Force on Globalization & Waste Management Decision taken from September 2010 Four focus areas: megacities, informal sector, global recycling markets & international aid tools Members: Antonis
Emergent Trilateralism in Developing Asia
 Emergent Trilateralism in Developing Asia Long Term Scenarios for Regional Growth and Trade Douglas Brooks, ADB David Roland-Holst, UC Berkeley Fan Zhai,, ADB presented at the ADB Dissemination Seminar
Argus Ethylene Annual 2017
 Argus Ethylene Annual 2017 Market Reporting Petrochemicals illuminating the markets Consulting Events Argus Ethylene Annual 2017 Summary Progress to the next peak of the economic cycle, now expected by
ASIA PACIFIC ADVERTISING TRENDS
 ASIA PACIFIC ADVERTISING TRENDS March 2018 Executive Summary 1-50 Regional Summary 5-6 Sources And Methodology 7 Regional Overview 8-15 Net Advertising In Asia Pacific 8 Advertising Y/Y Growth By Segment
The Climate for Development: Where Next on Climate Change. Dr. Andrew Steer Special Envoy for Climate Change, World Bank Group
 The Climate for Development: Where Next on Climate Change Dr. Andrew Steer Special Envoy for Climate Change, World Bank Group Public Seminar at the World Bank Tokyo Office March 2, 2012 Are You Concerned
Energy Sustainability Challenges in Asia-Pacific Opportunities for Regional Cooperation. Sergey Tulinov December 2013
 Energy Sustainability Challenges in Asia-Pacific Opportunities for Regional Cooperation Sergey Tulinov 11 12 December 2013 EQUITY EFFICIENCY RESILIENCE Asia and the Pacific Post-2015 Sustainable Development
Emergent Trilateralism in Developing Asia
 Emergent Trilateralism in Developing Asia Long Term Scenarios for Regional Growth and Trade Douglas Brooks, ADB David Roland-Holst, UC Berkeley Jean-Pierre Verbiest,, ADB Fan Zhai,, ADB presented at the
Urban Environmental Transitions and Transportation Systems: Comparison of Western and Asian Experiences
 IGES/APN International Workshop on Sustainable Urban Development in Asia: Policy Integration Towards Sustainable Urban Energy Use for Cities in Asia 4-5 February 2003 Urban Environmental Transitions and
IMPROVING SALES EFFECTIVENESS. John Kieffer Business Transformation Director
 IMPROVING SALES EFFECTIVENESS John Kieffer Business Transformation Director Working from a Position of Leadership and Growth Global Sales: $26.6 Billion (65% International) Net Income: $4.0 Billion R&D
WORLD ENERGY OUTLOOK Dr. Fatih Birol Chief Economist Head, Economic Analysis Division
 WORLD ENERGY OUTLOOK 2002 Dr. Fatih Birol Chief Economist Head, Economic Analysis Division World Energy Outlook Series World Energy Outlook 1998 World Energy Outlook - 1999 Insights: Looking at Energy
Forest Stewardship Council
 Global FSC certified area*: by region Africa CAMEROON CONGO, THE REPUBLIC OF GABON GHANA MOZAMBIQUE NAMIBIA SOUTH AFRICA SWAZILAND TANZANIA, UNITED UGANDA Asia CAMBODIA CHINA INDIA INDONESIA JAPAN KOREA,
WHO PRODUCES FOR WHOM IN THE WORLD ECONOMY?
 WHO PRODUCES FOR WHOM IN THE WORLD ECONOMY? Guillaume Daudin (Lille-I (EQUIPPE) & Sciences Po (OFCE), Christine Rifflart, Danielle Schweisguth (Sciences Po (OFCE)) 1 To be published in the Canadian Journal
CONVERSION FACTORS. Standard conversion factors for liquid fuels are determined on the basis of the net calorific value for each product.
 CONVERSION FACTORS The data which have been supplied by the countries in original units are converted to the common unit, terajoules (TJ), by using standard conversion factors or, in the case of solids,
Strengthening Institutional Capacity to Support Energy Efficiency in Asian Countries: UN ESCAP Project
 Strengthening Institutional Capacity to Support Energy Efficiency in Asian Countries: UN ESCAP Project KK Philip Kang Economic Affairs Officer Energy Security Section Environment and Development Division,
Steel Market Research & Consultancy
 Steel Market Research & Consultancy Flat Products Long Products Medium Term Forecast Long Term Forecast Consultancy GFMS: The Leading Provider p.2 Advantages From GFMS Steel Research p.3 GFMS Steel Research
LNG in the Asia Pacific
 2016/EWG52/WKSP1/004 LNG in the Asia Pacific Submitted by: APERC Asia Pacific Energy Research Centre Workshop Moscow, Russia 18 October 2016 APERC Workshop at EWG52 Moscow, Russia, 18 October, 2016 3-2.
Forest Stewardship Council
 Global FSC Certified Businesses: by country PUERTO RICO 4 FINLAND 83 BAHRAIN GUATEMALA 29 MACEDONIA 3 VIETNAM 004 CONGO, THE REPUBLIC OF 5 NEW ZEALAND 287 KOREA, REPUBLIC OF 243 UGANDA 3 MONACO 4 EGYPT
The Taiwanese Economy
 The Taiwanese Economy A new dynamic after the Economic Crisis March 22, 2012 1 The Taiwanese economy in a few words Important figures TAIWAN, 5 th ECONOMIC POWER IN ASIA A DYNAMIC ECONOMY 2011 GDP Growth:
and 40%, respectively, in
 Chapter 2 Japan growing with Asia's development - Asia -Pacific framework toward sustainable growth Section 4 Japan s contribution to the infrastructure development in Asia As shown in the previous Sections,
Statistical Yearbook for Asia and the Pacific 2013 F. Environment
 F.3. Water security involves the protection of livelihoods, human rights, and cultural and recreational values, as well as the preservation of ecosystems for socio-economic development. 1 One of the key
1 Controlling for non-linearities
 1 Controlling for non-linearities Since previous studies have found significant evidence for deaths from natural catastrophes to be non-linearly related to different measures of development (Brooks et
WORKFORCE METRICS BENCHMARK REPORT
 WORKFORCE METRICS BENCHMARK REPORT THE MORE YOU KNOW, THE SMARTER YOU WORK As an HR professional, you focus on helping your organization optimize its human capital, but how do you show that achievement?
FSC Facts & Figures. November 15. FSC F FSC A.C. All rights reserved
 FSC Facts & Figures November FSC F00000 FSC A.C. All rights reserved Global FSC certified forest area North America.u of total FSC certified area / 6.8.89 ha D 6 certificates Europe 8u of total FSC certified
Cargo Sales & Service Presentation. Air Logistics Group
 Cargo Sales & Service Presentation Air Logistics Group Air Logistics Group Introduction Introducing Air Logistics Group IATA Approved Over $450m cargo sales 280 employees worldwide Experienced management
Population Distribution by Income Tiers, 2001 and 2011
 1 Updated August 13, 2015: This new edition includes corrected estimates for Iceland, Luxembourg, Netherlands and Taiwan, and some related aggregated data. TABLE A1 Distribution by Income Tiers, 2001 and
World Potato Map 2019: Fries Are on the Menu Globally
 March 2019 World Potato Map 2019: Fries Are on the Menu Globally RaboResearch Food & Agribusiness Stefan van Merrienboer Analyst F&A NL +31 6 1162 7255 Only a small share of potatoes is traded internationally.
3-2. LNG in the Asia-Pacific
 APERC Workshop at EWG52 Moscow, Russia, 18 October, 2016 3-2. LNG in the Asia-Pacific Favoring trade and rational market development Kirsten Smith Researcher, APERC Report Highlights Report Highlights
MEDIA ADVISORY. Tokyo, January 29, 2007
 Tokyo, January 29, 2007 MEDIA ADVISORY The Waseda University Institute of E-Government has released its 2007 World E-Government Ranking. For three consecutive years, the Institute has ranked the development
Global IT Procurement and Logistics. Simplifying the complex: an end-to-end IT supply chain solution
 Global IT Procurement and Logistics Simplifying the complex: an end-to-end IT supply chain solution We make the complex simple Managing an international IT supply chain isn t an easy task, and comes with
FSC Facts & Figures. December 1, FSC F FSC A.C. All rights reserved
 FSC Facts & Figures December, 0 FSC F00000 FSC A.C. All rights reserved Global FSC certified forest area North America.9v of total FSC certified area m 67::08 ha I 47 certificates Europe 47.v of total
OTS. FEEL GOODS. COMPANY PROFILE
 OTS. FEEL GOODS. COMPANY PROFILE CONTENTS 4 ABOUT US 6 TRANSPORT 8 MISSION 10 VISION 12 SERVICES 14 SALES AND CUSTOMER SERVICE 16 IMPORT / EXPORT AND CROSSTRADE 18 LOGISTICS 20 CUSTOMS 22 PROJECT DIVISION
FSC Facts & Figures. September 1, FSC F FSC A.C. All rights reserved
 FSC Facts & Figures September 1, 2017 FSC F0001000 FSC A.C. All rights reserved Global FSC-certified forest area North America 34.9% of total FSC-certified area ( 69,014,953 ha ) 246 certificates Europe
FSC Facts & Figures. October 4, FSC F FSC A.C. All rights reserved
 FSC Facts & Figures October 4, 2017 FSC F0001000 FSC A.C. All rights reserved Global FSC-certified forest area North America 35.2% of total FSC-certified area ( 68,947,375 ha ) 246 certificates Europe
Policy Brief. Anita Prakash
 Economic Research Institute for ASEAN and East Asia Policy Brief NO. 2018-01, AUGUST 2018 ISSN: 2086-8154 Key Issues: Africa can benefit from trade, investment, and development cooperation through a measured
FSC Facts & Figures. December 1, FSC F FSC A.C. All rights reserved
 FSC Facts & Figures December 1, 2017 FSC F0001000 FSC A.C. All rights reserved Global FSC-certified forest area North America 35.7% of total FSC-certified area ( 69,695,913 ha ) 248 certificates Europe
FSC Facts & Figures. December 3, 2018
 FSC Facts & Figures December 3, 2018 Global FSC-certified forest area North America 34.5% of total FSC-certified area ( 69,285,190 ha ) 253 certificates Europe 50% of total FSC-certified area ( 100,482,414
FSC Facts & Figures. November 2, 2018
 FSC Facts & Figures November 2, 2018 Global FSC-certified forest area North America 34.6% of total FSC-certified area ( 69,322,145 ha ) 256 certificates Europe 49.9% of total FSC-certified area ( 100,198,871
Dr. Phyllis Yoshida Lead Shepherd, APEC Energy Working Group. Deputy Assistant Secretary for Asia, Europe and the Americas U.S. Department of Energy
 Dr. Phyllis Yoshida Lead Shepherd, APEC Energy Working Group Deputy Assistant Secretary for Asia, Europe and the Americas U.S. Department of Energy Global Energy Challenges Global energy consumption will
FSC Facts & Figures. August 4, FSC F FSC A.C. All rights reserved
 FSC Facts & Figures August 4, 2016 FSC F0001000 FSC A.C. All rights reserved Global FSC-certified forest area North America 35.9% of total FSC-certified area ( 68,725,419 ha ) 249 certificates Europe 47.7%
FSC Facts & Figures. September 12, FSC F FSC A.C. All rights reserved
 FSC Facts & Figures September 12, 2016 FSC F0001000 FSC A.C. All rights reserved Global FSC-certified forest area North America 35.8% of total FSC-certified area ( 68,217,276 ha ) 243 certificates Europe
FSC Facts & Figures. June 1, 2018
 FSC Facts & Figures June 1, 2018 Global FSC-certified forest area North America 34.6% of total FSC-certified area ( 69,460,004 ha ) 242 certificates Europe 49.4% of total FSC-certified area ( 99,068,686
10 ECB HOW HAVE GLOBAL VALUE CHAINS AFFECTED WORLD TRADE PATTERNS?
 Box 1 HOW HAVE GLOBAL VALUE CHAINS AFFECTED WORLD TRADE PATTERNS? In recent decades, global trade has undergone profound changes. Relative to global output, trade has risen sharply and cross-country linkages
FSC Facts & Figures. September 6, 2018
 FSC Facts & Figures September 6, 2018 Global FSC-certified forest area North America 34.5% of total FSC-certified area ( 69,584,479 ha ) 253 certificates Europe 49.4% of total FSC-certified area ( 99,747,108
FSC Facts & Figures. August 1, 2018
 FSC Facts & Figures August 1, 2018 Global FSC-certified forest area North America 34.6% of total FSC-certified area ( 69,481,877 ha ) 253 certificates Europe 49.4% of total FSC-certified area ( 99,104,573
Global and Regional Perspectives of Sustainable Transport Development
 Regional Expert Group Meeting on Sustainable and Inclusive Transport Development & 2 nd Asia BRTS Conference 29 Sept.-1 Oct 2014, Ahmedabad, India Global and Regional Perspectives of Sustainable Transport
FSC Facts & Figures. January 3, FSC F FSC A.C. All rights reserved
 FSC Facts & Figures January 3, 2018 FSC F0001000 FSC A.C. All rights reserved Global FSC-certified forest area North America 34.7% of total FSC-certified area ( 69,082,443 ha ) 245 certificates Europe
Bangladesh. Natural Resource Use Indicators in the SDGs. Bangladesh Asia-Pacific Developing. SDG Goal. 6.4 Increase water-use efficiency
 Natural Resource Use Indicators in the SDGs For more information, please visit http://www.unep.org/asiapacificindicators or contact janet.salem@unep.org Year SDG Goal 1 6.4 Increase water-use efficiency
Annual Report 2015 Bangkok Bank Public Company Limited
 4 Reaching Out As Thailand becomes part of a much wider international community, businesses need to think regionally to prosper locally and individuals need to be aware that the AEC will bring changes
FSC Facts & Figures. February 9, FSC F FSC A.C. All rights reserved
 FSC Facts & Figures February 9, 2018 FSC F0001000 FSC A.C. All rights reserved Global FSC-certified forest area North America 34.5% of total FSC-certified area ( 68,976,317 ha ) 243 certificates Europe
FSC Facts & Figures. April 3, FSC F FSC A.C. All rights reserved
 FSC Facts & Figures April 3, 2018 FSC F0001000 FSC A.C. All rights reserved Global FSC-certified forest area North America 34.7% of total FSC-certified area ( 69,167,742 ha ) 242 certificates Europe 49.3%
FSC Facts & Figures. January 6, FSC F FSC A.C. All rights reserved
 FSC Facts & Figures January 6, 2017 FSC F000100 0 FSC A.C. All rights reserved Global FSC-certified forest area North America 35.3% of total FSC-certified area ( 69,212,841 ha ) 248 certificates Europe
FSC Facts & Figures. February 1, FSC F FSC A.C. All rights reserved
 FSC Facts & Figures February 1, 2017 FSC F000100 0 FSC A.C. All rights reserved Global FSC-certified forest area North America 35.8% of total FSC-certified area ( 69,590,919 ha ) 249 certificates Europe
FSC Facts & Figures. March 13, FSC F FSC A.C. All rights reserved
 FSC Facts & Figures March 13, 2017 FSC F000100 0 FSC A.C. All rights reserved Global FSC-certified forest area North America 35.6% of total FSC-certified area ( 69,049,912 ha ) 248 certificates Europe
Sustainable Efforts & Environmental Concerns Around the World. A Nielsen Report August 2011
 Sustainable Efforts & Environmental Concerns Around the World A Nielsen Report August 2011 Global unease over the use of pesticides, packaging waste and water shortages overtake global warming as top concern
The competitiveness of CEE in a global context
 The competitiveness of CEE in a global context Marianne Kager, BA-CA Chief Economist Julia Wörz, WIIW 9 March 6 Fast growth in productivity Over the past decade, the new EU member states from Central Eastern
Transport Outlook 2012
 Transport Outlook 2012 Plenary 2: Towards a Green Economy (and CO 2 ) in 2050 ITF Transport Outlook International Transport Forum Perspective on Mobility Transforming Transportation Philippe LeRouic Crist,
APEC Energy Outlook and Security Issues Asia Pacific Energy Research Centre (APERC)
") APEC Energy Outlook and Security Issues (APERC) Summary of APERC Presentation Energy demand in the APEC region is projected to rise by almost 60 percent between 1999 and 2020, at 2.1 percent per annum.
APEC Energy Outlook and Security Issues (APERC) Summary of APERC Presentation Energy demand in the APEC region is projected to rise by almost 60 percent between 1999 and 2020, at 2.1 percent per annum.
A d i l N a j a m Pardee Center for the study of the Longer-Term Future B o s t o n U n i v e r s i t y
 A d i l N a j a m The Fredrick S. Pardee Chair for Global Public Policy Pardee Center for the study of the Longer-Term Future B o s t o n U n i v e r s i t y How can ECOSOC and AMR foster integration of
Manage Centre. Manage your IT operations from a single graphical interface
 Manage Centre Manage your IT operations from a single graphical interface One place where you can see all your technology Technology services are getting more complex all the time. Hybrid IT and cloud
HEALTH WEALTH CAREER MERCER LIFE SCIENCES REMUNERATION SURVEY
 HEALTH WEALTH CAREER MERCER LIFE SCIENCES REMUNERATION SURVEY MAKE SMART COMPENSATION DECISIONS BY JOINING THE 2016 MERCER TOTAL REMUNERATION SURVEY FOR THE LIFE SCIENCES SECTOR THE LIFE SCIENCES REMUNERATION
Energy efficiency: Market Report 2014 and Capturing the Multiple Benefits
 Energy efficiency: Market Report 2014 and Capturing the Multiple Benefits Didier Houssin Director, Sustainable Energy Policy and Technology International Energy Agency EUFORES 14 th Inter-Parliamentary
3R as The Basis for Rural Resources and Waste Management for Regional Development- Implications towards SDGs
 Seventh Regional 3R Forum in Asia and the Pacific 2-4 Nov 2016, Adelaide, SA Australia Background Paper on 3R as The Basis for Rural Resources and Waste Management for Regional Development- Implications
APEC s Energy Intensity Reduction Goal: Research Update Ralph D. Samuelson 17 October 2011 Asia Pacific Energy Research Centre (APERC)
") APEC s Energy Intensity Reduction Goal: Research Update Ralph D. Samuelson 17 October 2011 Asia Pacific Energy Research Centre (APERC) Outline What Happened in 2009? Comments on the ERIA Analysis A Look
APEC s Energy Intensity Reduction Goal: Research Update Ralph D. Samuelson 17 October 2011 Asia Pacific Energy Research Centre (APERC) Outline What Happened in 2009? Comments on the ERIA Analysis A Look
Guanghua Wan Principal Economist
 Guanghua Wan Principal Economist Main Messages Asia s urbanization is unprecedented & unique in several aspects leading to enormous challenges possibly including environmental degradation But urbanization
Delivering a Sustainable Energy Future for the World
 5th National Energy Forum - Malaysia 3 September 2013 Delivering a Sustainable Energy Future for the World Ralph D. Samuelson Asia Pacific Energy Research Centre (APERC) APEC Member Economies From APEC
2016 Global Manufacturing Competitiveness Initiative Report Highlights
 2016 Global Manufacturing Competitiveness Initiative Report Highlights Tim Hanley Global Leader, Consumer and Industrial Products Deloitte LLP MD81 1 Deloitte and US Council on Competitiveness I 2016 Global
Developing a Global Workforce January 26, 2012
 Developing a Global Workforce January 26, 2012 Steve Spires Managing Director, Southeast Regional and CT Solutions Kathy Allen Senior Consultant, Learning (c) U.S. BPI Partners, Inc. [32, Q5 FRAMEWORK,
The next generation in global consumer understanding
 The next generation in global consumer understanding We have chosen CAMEO because of its excellent value, multi-region scope, and ease of use. CAMEO allows us to better understand our customer s needs
Measuring Value in Global Value Chains
 GLOBAL COMMODITIES FORUM 7-8 April 2014 Measuring Value in Global Value Chains by Ms. Rashmi Banga UNCTAD The views expressed are those of the author and do not necessarily reflect the views of UNCTAD.
MERCER EXECUTIVE REMUNERATION GUIDE THE KEY TO DESIGNING COMPETITIVE EXECUTIVE REMUNERATION IN THE MIDDLE EAST
 MERCER EXECUTIVE REMUNERATION GUIDE THE KEY TO DESIGNING COMPETITIVE EXECUTIVE REMUNERATION IN THE MIDDLE EAST CONSIDER THESE QUESTIONS Do you have an easy-to-use source for comparing compensation and
A global view on the future of work. Irmgard Nübler Research Department International Labour Organisation Geneva
 A global view on the future of work Irmgard Nübler Research Department International Labour Organisation Geneva ILO initiative on the future of work Centenary Project 1 2 3 Four conversations around the
PEFC Global Statistics: SFM & CoC Certification. November 2013
 PEFC Global Statistics: SFM & CoC Certification 1 November 2013 Members; Endorsed Systems; Distribution of Certificates North America 151 million ha 60% TCA 503 CoC Europe 81 million ha 32% TCA 8,389 CoC
A decade of oil demand
 A decade of oil demand World oil demand Eni has recently published the thirteenth edition of the 2014 World Oil and Gas Review, the annual statistical review on the world oil and gas market and the refining
2015 MERCER LIFE SCIENCES REMUNERATION SURVEY
 2015 MERCER LIFE SCIENCES REMUNERATION SURVEY MAKE SMART COMPENSATION DECISIONS BY JOINING THE 2015 MERCER TOTAL REMUNERATION SURVEY FOR THE LIFE SCIENCES SECTOR THE LIFE SCIENCES REMUNERATION SURVEY PROVIDES
Overview of energy efficiency policies and trends at world level
 Overview of energy efficiency policies and trends at world level Dr Didier Bosseboeuf (ADEME, France) General secretary of the WEC energy efficiency policies Knowledge network Practical actions for accelerating
6.4.1 Water Intensity (litres per US dollar)
") Natural Resource Use Indicators in the SDGs For more information, please visit http://www.unep.org/asiapacificindicators or contact janet.salem@unep.org Year SDG Goal 6.4 Increase water-use efficiency
Natural Resource Use Indicators in the SDGs For more information, please visit http://www.unep.org/asiapacificindicators or contact janet.salem@unep.org Year SDG Goal 6.4 Increase water-use efficiency
Natural Resource Use Indicators in the SDGs
 Natural Resource Use Indicators in the SDGs For more information, please visit http://www.unep.org/asiapacificindicators or contact janet.salem@unep.org Year SDG Goal 6.4 Increase water-use efficiency