UNDERSTANDING NATURAL GAS
|
|
|
- Cornelius Wilkinson
- 5 years ago
- Views:
Transcription

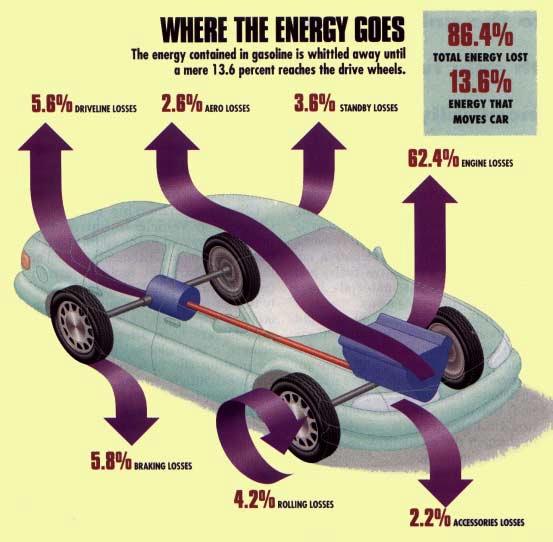
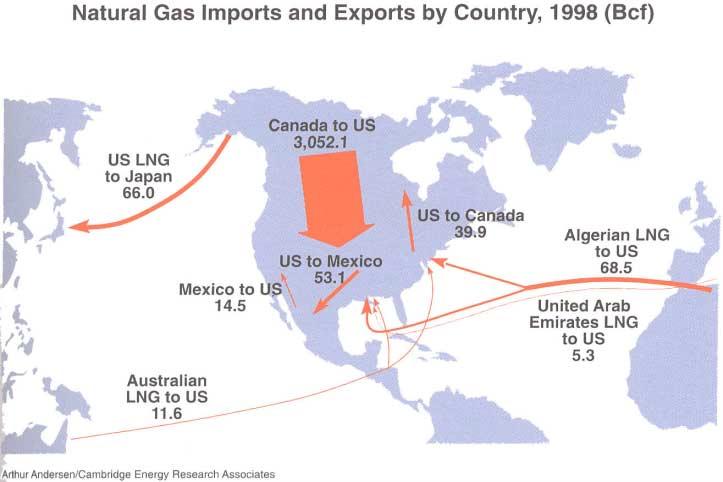
1 UNDERSTANDING NATURAL GAS Large domestic and North American reserves relative to current demand (U.S. currently imports ~15% and that comes largely from Canada in contrast to US oil imports of approximately 50%) Like all fossil fuels, natural gas is depletable and does contribute to global warming, however, it is the cleanest fossil fuel (lowest particulates, SOx, NOx, and C0 2 ). The Clean Air Act of 1990 and other environmental policies favor natural gas. Natural gas is the leading automotive fuel alternative to gasoline The winter of included the highest natural gas prices in over 15 years.

2 Increased Efficiency of Conversion of ENERGY RESOURCES to ENERGY SERVICES
3
4 Introduction What is Natural Gas Worldwide Natural Gas Production, Reserves Consumption US Natural Gas Reserves Production Consumption Prices The Natural Gas Industry Refining Transportation Pipelines LNG Storage Technology Environmental Impacts Future Lecture Outline

5 Source: EIA, Annual Energy Outlook 2001 December, 2000 World Energy Consumption by Fuel, (quadrillion Btu)
6 World Commercial Energy Consumption Nuclear Energy 8% Hydroelectric 3% by Resource, 1999 (Total Quads) Coal 25% Oil 40% Natural Gas 24% Source: BP Statistical Review, 2000 Note: difficult-to-measure, non-commercial energy sources like biomass are not included in this figure
7 US Commercial Energy Consumption by Resource, Quads Nuclear Energy 9% Hydroelectric 1% Coal 25% Oil 40% Natural Gas 25% Source: BP Statistical Review, 2000 Note: difficult-to-measure, non-commercial energy sources like biomass are not included in this figure
8 Source: The International Energy Outlook, EIA, 2000, World Electricity Production, Quads Oil 9% Coal 36% Hydro 21% Natural Gas 16% Renewables 2% Nuclear 16%

9 Total US Net Electricity Generation 1999, by Source and Industry Sector Note that: In 1998, Gas accounted for 9.1%, Coal accounted for 57.2%, Nuclear 20%, and Hydro 11% Nearly 48% of all gas-fired generation is non-utility
10 Source: EIA, July 2000 Electricity Generation by Fuel in Two Cases, (billion kilowatthours) Reference Case Renewable Hydropower Nuclear Petroleum Natural Gas Coal % Case
11 Gas Introduction Natural gas has attracted global attention as the transition fuel to a more sustainable/renewable energy mix world wide. Recent and dramatic deregulation and restructuring of the pricing and transmission of natural gas (both have been regulated for over fifty years) is allowing the development of new markets in all sectors for natural gas. In 1990, natural gas began trading on NYMEX which has become the primary reference point for U.S. gas prices. Weather and gas storage patterns are the principal influences on wellhead gas prices. With deregulation, the largest boom in natural gas pipeline construction since WW II began in late 80s and lasted into early 90s. Significant construction continues today to better link reserves and markets. New technologies and policies have caused natural gas to be a fuel of choice rather than the "boobie prize" of oil exploration and led to the development of natural gas reserves in "unconventional" reservoirs such as buried coal beds and "tight" sands.
12 Significance The first gas well in the US was drilled in 1825, long before the first oil well. It was connected by pipeline to users in Fredonia, New York. By 1886, an eight-inch gas line had been run 87 miles from Kane, PA to Buffalo, NY. Globally, natural gas has posted dramatic growth over the past four decades. The US and the countries of the former Soviet Union are by far the largest producers of natural gas. The Middle East, although a major holder of natural gas reserves, is not one of the largest producers.
13 How the Natural Gas Industry Changed Since the mid-1980 s Deregulation: Arkoma Basin example: prices, pipelines, third party transactions Oil and Gas have different origins and unconventional resources emerged to become very important Tight sands, Coalbed Methane The Clean Air Act and PURPA the spead of Non-utility generation which both favored natural gas
14 Source: Power Surge Current Production = 87 tcf
15 WHAT IS NATURAL GAS? Definitions Natural Gas is largely composed of methane (CH 4 ), the simplest hydrocarbon molecule. Like oil, natural gas is described as sweet (low) or sour (high) depending on its sulfur content. It is also described as wet or dry depending on the presence of natural gas liquids and other energy gases. If natural gas is greater than 90% methane then it is referred to as dry. Finally, natural gas is described as associated or non-associated depending upon whether or not it is associated with significant oil production. Contrary to popular belief, most natural gas is not associated with oil. In the US, only ~20% of natural gas reserves are believed to be oil associated.

16 Natural Gas Definitions A producing gas well Christmas Tree An approximate breakdown of raw natural gas by component. Other hydrocarbon gases are removed from the methane mixture and sold separately from natural gas


17 WHERE DOES NATURAL GAS OCCUR? WHAT METHODS ARE USED TO EXPLORE AND DEVELOP NATURAL GAS? MINERAL RIGHTS ARE RELEVANT HERE JUST AS THEY WERE FOR OIL WHERE DOES NATURAL GAS COME FROM? COASTAL SWAMP ALLUVIAL PLAIN
18 Mineral Rights in the U.S. FEE SIMPLE Largest, most extensive interest that can be owned in land SURFACE RIGHTS Includes water rights Divisible into: Real Estate Deed Lessee Mineral Deed MINERAL RIGHTS rights to any natural constituent of the earth s crust Oil and Gas Lease Lessor WORKING INTEREST OWNER Gives holder right to explore for and produce oil and gas Leases normally continue as long as wells drilled on the land produce oil and/or gas in commercial quantities ROYALTY INTEREST OWNER Interest in gross revenues of oil and gas production (usually 1/8th of 8/8ths) Limited liability: ownership is free and clear of all costs ( Landowner s Royalty ) Mineral owners receive a cash bonus as an inducement to execute a lease

19 Drilling for Gas Onshore Same procedures and basic equipment as for oil exploration

20 Offshore Gas Fields (North Sea) Source:
21 HOW MUCH NATURAL GAS IS THERE? World Proved Reserves are currently approximately 5171 trillion cubic feet (about 5100 quads) with 73% of these reserves concentrated in the Middle East and former Soviet Union World Natural Gas Proved Reserves Africa 8% Asia & Australia 7% North America 5% Latin America 4% Former Soviet Union 38% Middle East 34% Europe 4% Source: BP Statistical Review, 2000
22 1999 World Natural Gas Production Source: BP Statistical Review, Quads 1 bcf = 1.03 trillion Btu 1 tcf = 1.03 quadrillion Btu Latin America 4% Rest of World 16% North America 32% Middle East 8% Europe 12% Former Soviet Union 28%

23 Source: EIA, Natural Gas Use for Electricity Generation by Region,


24 World Natural Gas Consumption, Source: EIA, International Energy Outlook 2000 While the entire world continues to increase natural gas consumption World Natural Gas Reserves, Reserve Growth is Increasingly in Developing Countries


25 Natural Gas Consumption in Asia Gas growth in China and India Natural Gas Consumption Poised to Increase Gas Use in India, Source: EIA, International Energy Outlook 2000
26 Source: EIA U.S. Crude Oil, Natural Gas, and Natural Gas Liquids Reserves 1999 Annual Report 1999 United States Natural Gas Proved Reserves 167 tcf Rest of US 19% Alaska 6% Kansas 4% Louisiana 6% New Mexico 9% Federal Offshore 16% Oklahoma 8% Wyoming 8% Texas 24%

27 1999 Dry Natural Gas Proved Reserves Source: Energy Information Administration U.S. Crude Oil, Natural Gas, and Natural Gas Liquids Reserves 1999 Annual Report
28

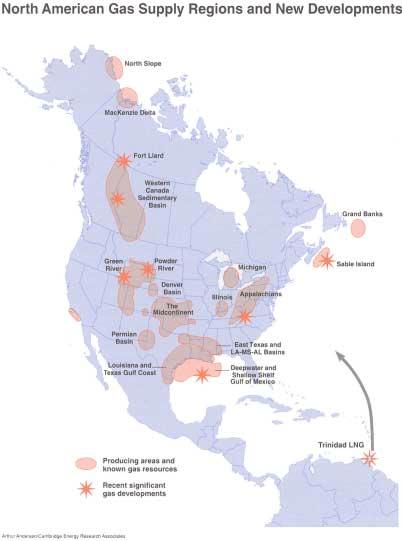
29 Producing Regions and Primary Markets
30 How much Natural Gas is There? At current production levels, world and US reserves to production ratios are approximately 64 and 9, respectively. The size of the natural gas resource base has been growing in recent years as scientists understanding of its origin and occurrence has improved, and as companies are beginning to actively look for gas resources due to rising demand. The DOE states that there are at least 1300 TCF of natural gas in the US that can be recovered. Proved reserves sit at about 167 TCF or about a 9-year supply at current rates of consumption. It is only in the last decade that we have begun to seek gas production. We haven t looked hard yet like we have for oil. Big potential: Deep gas, tight gas reservoirs, coal bed methane. US Government has given substantial tax credits to boost development of resources. Thomas Gold (Cornell) - Natural gas is abundant beyond imagination - not necessarily limited to organic origin, but to the earth s formation and thermal and chemical activity in the earth s mantle
31 Source: EIA Technically Recoverable Gas Resources in North America Comprise Almost 2,500 Trillion Cubic Feet Alaska 0 0 Northern Frontier WCSB* East Coast Resources (trillion cubic feet) Proved Reserves Conventional Resources Nonconventional Resources Western Region *WCSB = Western Canadian Sedimentary Basin Midcontinent Gulf Coast 70 0 Mexico Eastern Region
32 1999 US Natural Gas Production 23.7 Trillion Cubic Feet 24.4 Quads Source: EIA Natural Gas Monthly - February, Kansas 3% Rest of the US 15% Alaska 2% Wyoming 4% Texas 32% New Mexico 8% Oklahoma 8% Louisiana 28%
33 Lower 48 Dry Natural Gas Reserves and Production, Lower 48 Dry Gas Reserves Trillion Cubic Feet World War II Ends Rapid Reserves Peak 1967 Lower 48 Reserves Lower 48 Prod (Dry) AEO 2000 HISTORY Production Peak TCF Proved Reserves Decline Flattens High Gas Prices and Drilling Lower Gas Demand AEO 2000 Reference Case Projected Production in TCF Lower 48 Dry Gas Production Trillion Cubic Feet
34 U.S. Lower-48 Annual Estimates of Proved Natural Gas Reserves Source: PaineWebber (1950 to 1976, American Gas Association; 1977 to the present, Energy Information Agency) Net Reserves-to- Proved Reserves Additions Adjustments Production Year Beginning of YearExtensions Discoveries * & Revisions Production Ending Ratio
35 Source: EIA Trends in US Natural Gas Consumption and Supply Consumption Imports Production
36
37 Source: EIA U.S. Natural Gas Net Imports, (trillion cubic feet) History Projections Canada LNG Mexico
38 Current Natural Gas Spot Prices: Well Above the Recent Price Range $10.50 $8.50 Henry Hub Daily Spot Prices Compared to Typical Range for Dollars per MMBtu $6.50 $4.50 Henry Hub Midpoint $/MMBtu Average, /- two standard deviations, =$0.64 $2.50 $0.50 1/1/98 3/1/98 5/1/98 7/1/98 9/1/98 11/1/98 1/1/99 3/1/99 5/1/99 7/1/99 9/1/99 11/1/99 1/1/00 3/1/00 5/1/00 7/1/00 9/1/00 11/1/00 1/1/01 Average=$2.17 Source: Financial Times Energy, Gas Daily Source: EIA Why the price surge in 2000? Supply Tightness Storage Stocks - lower than average Consumption increases Oil Price Increases Market Perceptions
39 Baker Hughes Oil/Gas Split Rig Count /12/94 09/08/95 07/04/96 04/30/97 02/24/98 12/21/98 10/17/99 08/12/00 Date US Total Rigs US Oil Rigs US Gas Rigs Data Source: Baker Hughes February 10, 2001 Data Through 2/9/01

40 Natural Gas Prices by Sector Note: Year-end 2000 numbers not yet available but for the months June-October 2000 Average Wellhead price - $ 4.42 per Mcf 104% above 99 avg. Average Citygate price - $ 5.18 per Mcf 64% above 99 avg. Average Residential price - $ 9.64 per Mcf 44% above 99 avg. Average Commercial price - $ 6.32 per Mcf 19% above 99 avg. Average Industrial price - $ 4.61 per Mcf 49% above 99 avg. Average Electric Utility price - $ 4.50 per Mcf 72% above 99 avg. EIA Natural Gas Monthly January 2001
41 1998 US Natural Gas Consumption by End-Use 21.3 Trillion Cubic Feet Source: CERA, North American Gas Trends, 2000 Transportation 8% Electricity 15% Residential 21% Commercial 14% Industrial 42%
42 Source: EIA The Industry At A Glance Participants Miles of Pipe Regulatory Regime Producers 8,000 Independents 0 Phased price deregulation 24 Majors Begun in 1979, completed in 1989 Pipelines ,000 Federal Energy Regulatory Commission (FERC) Natural Gas Marketers Unregulated Local Gas Utilities 1, ,000 State Utility Commissions End Users Residential 53 million 0 Unregulated Commercial 4.5 million Industrial 40 thousand Electric Utilities Interstate - FERC Intrastate - State Commissions

43 The Natural Gas Industry
44 Natural Gas Supply and Disposition in the U.S., 1996 Source: EIA 24.1 (Trillion Cubic Feet)
45 How is Natural Gas Refined? Natural gas is the end product in contrast to oil which needs to be refined. Natural gas is gathered from individual wells, processed locally, and then moved via large pipelines to markets. Minimal refining is done near the production to remove water, hydrocarbon liquids, helium, carbon dioxide, hydrogen sulfide, etc. Referred to as gas processing plants; much simpler than an oil refinery and they are located closer to the production. The owners of the production usually receive revenues for the byproducts of processing that have value.
46 How is Natural Gas Transported? By Pipeline! The majority of the gas reserves in the US and the world aren t located near the markets for the gas. Oil goes by rail, truck, tanker and pipeline. Coal goes by rail, barge, truck and pipeline. Natural gas goes almost exclusively by pipeline. Why? Lack of energy density. Remember 7.5 gallons of oil as the same energy content as a 10x10x10 room filled with natural gas at standard conditions. Compressing natural gas is feasible but expensive. Compress to 1000 lbs/ sq inch to move economically.
47 Natural Gas Transportation - Pipelines Big upfront expense (low operating costs). Must be confident that the production and the markets that the pipeline will link will both last long enough to amortize the cost of the pipeline. Monopoly power: Intrastate: only made sense for cities and other customers to have one set of pipes rather than two competing sets - essentially have utility monopoly control and resulting regulations. Interstate: commerce laws like trucking, electric power transmission, again monopoly control for most of the century - only one pipeline between production and markets: no competition. This is changing radically now. First boom in long-distance high pressure pipeline construction right after WWII. Second boom began five years ago with deregulation. LNG: Indonesia Japan; N. Africa Italy; Russia W. Europe (-250 degrees C) If no pipeline: flare, reinject, shut-in, build a fertilizer plant or a power plant right next to production

48 Natural Gas Transportation - Pipelines Pipelines move raw gas from wellheads to regional distribution centers. A pipeline company is a totally separate company from a producer or a distributor, although sometimes pipelines sell gas directly to large customers. Most sections of large pipeline are made of steel piping, measuring anywhere from 20 to 42 inches in diameter. When natural gas is moved through a pipeline, it is transmitted at higher pressures (from 200 to 1500 psi) to reduce the volume of the gas, and provide a pushing force to propel the gas through the pipe. Periodic compressor stations maintain pressure in pipeline to keep large volumes of gas moving Compressor stations are installed about every 100 miles along the pipeline, and require significant amounts of electricity.
.")
49 Source: Liquified Natural Gas When natural gas is cooled to a temperature of approximately -260 F at atmospheric pressure it condenses to a liquid called liquefied natural gas (LNG). One volume of this liquid takes up about 1/600th the volume of natural gas at a stove burner tip. LNG weighs less than one-half that of water, actually about 45% as much. LNG is odorless, colorless, non-corrosive, and non-toxic. When vaporized it burns only in concentrations of 5% to 15% when mixed with air. Neither LNG, nor its vapor, can explode in an unconfined environment. Shipping LNG by tanker is an ideal solution in cases where pipeline export is ruled out for technical, economic or indeed geopolitical reasons. But the process is expensive and the LNG chain requires heavy capital investment in liquefaction and regasification plants, refrigerated storage tanks, port facilities for loading and unloading and of course the specially-designed LNG tankers. A LNG Tanker Source:
, but may also contain ethane, propane and heavier hydrocarbons.")
50 Source: The Liquified Natural Gas Cycle Natural gas is composed primarily of methane (typically, at least 90%), but may also contain ethane, propane and heavier hydrocarbons. Small quantities of nitrogen, oxygen, carbon dioxide, sulfur compounds, and water may also be found in "pipeline" natural gas. The liquefaction process removes the oxygen, carbon dioxide, sulfur compounds, and water. The process can also be designed to purify the LNG to almost 100% methane. A typical liquefaction plant producing 5 million tonnes of LNG per year needs 110 MW of electric power for the compression cycle and another 60 MW (not to mention 60,000 cu.m/hr of water) for the cooling process. The investment involved is quite considerable: construction of the plant alone would cost about $1.5 billion, and then there is the cost of developing the gas field to supply the plant, and the cost of the tankers to ship the LNG to market. Controlling costs will undoubtedly be a major factor in keeping LNG competitive.
51 World LNG Exporters PJ Indonesia Algeria Malaysia Australia Brunei UAE Qatar USA Libya Source: BP Amoco
52 LNG Trade Is Important in U.S. Regional Markets (1998, Billion Cubic Feet) 64 To Japan LNG Terminal Facilities Gas Storage From UAE, Algeria, and Australia Inactive, planned for late 2000 reopening Source: Energy Information Administration, Natural Gas Monthly (June 1999).

53 Natural gas: Major trade movements Trade flows worldwide (billion cubic metres) Natural gas LNG USA Canada Mexico S. & Cent. America Europe Former Soviet Union Middle East Africa Asia Pacific

54 SOURCE: El Paso Energy Building Our Merchant LNG Business, February 6, 2001
 Salt caverns, B) Mines, C) Aquifers, D) Reservoirs, E) Hard Rock Caverns The three principal types of underground storage sites used in the United States today are: 1.")

55 Natural Gas Storage A) Salt caverns, B) Mines, C) Aquifers, D) Reservoirs, E) Hard Rock Caverns The three principal types of underground storage sites used in the United States today are: 1. Depleted reservoirs in oil and/or gas fields 2. Aquifers 3. Salt cavern formations There are more than 400 underground storage sites in 27 states across the United States and Canada. Together, these sites can hold upwards of 3 quads of natural gas, Storage acts as a sort of buffer between the pipeline and the distribution system, allowing distribution companies to serve their customers more reliably by withdrawing more gas from storage to meet customer demands during peak use periods. It also allows the sale of fixed quantities of natural gas on the spot market during off-peak periods. Having local storage of gas also reduces the time necessary for a delivery system to respond to increased gas demand. Storage also allows continuous service, even when production or pipeline transportation services are interrupted.
56 How Has Natural Gas Been Regulated? History of US Government Regulation of Price and Distribution Local distributors of natural gas have long been regulated by states as public utilities. They were included with the natural monopoly concept because it is inefficient to let more than one company lay gas mains under the street. Once large transmission lines began to cross the country, Congress decided that serious matters of interstate commerce were involved Congress created the Federal Power Commission to regulate the price, transportation and production of natural gas. FPC set unrealistically low prices for interstate commerce. These artificially low wellhead prices for natural gas, which existed through the 70 s, increased demand but simultaneously gave producers no incentive to develop new reserves, thereby reducing overall supply Arab Oil Embargo. Oil price increase caused natural gas on intrastate markets (uncontrolled by FPC) to rise dramatically Natural Gas Policy Act; A new system of gas pricing that distinguished between old gas and new gas. Old gas still heavily controlled at low price levels. New gas decontrolled by January 1, s FERC (Federal Energy Regulatory Commission, successor to FPC) ruled in a series of orders that the role of pipeline companies would change from being gas purchasers and marketers to more strict transporters of gas and allowing the producers to sell their gas directly to customers Congress passed legislation to lead to complete decontrol of prices by January 1, 1993.

57 Environmental Benefits of Natural Gas CCGT Technology is the cleanest and most efficient fossil generation option Source: Power Surge
58 US Capacity Additions ( ) Steam 13% 40 GW Total US additions over this period Source: EPRI GT/CC 87% Steam = 5 GW GT/CC = 35 GW Forecasts for the US and Western Europe show that over 90% of new installed capacity over the next five years will be combined-cycle natural gas-fired turbines
59 Source: US Planned New Generating Capacity Utility 27,505 MW Non-Utility Total 61,220 MW Oil 3% Hydro 2% Other 3% Hydro 0% Wind 0% Other 5% Gas/Oil 27% Gas 92% Oil 0% Gas 68%
60 Natural Gas Will Hold a Larger Share of the US Energy Market in 2020 Total Energy Consumption 94.7 Q Natural Gas Consumption 94.7 Q (Quadrillion Btu) 22.5 Q Q 33.0 Q Natural Gas Coal Petroleum Products Other Industrial Electric Utility Other Residential Commercial Source: EIA

61 Source: Oil and Gas Journal
.")
 molecule, thereby providing source of hydrogen for the fuel cell Note that any hydrocarbon could be sent through a reformer, but NG is best because of its high H/C ratio")
62 The Link Between Natural Gas and Fuel Cells See the attached article from The Oil and Gas Investor When a hydrocarbon fuel is introduced into the system, the catalyst surface of the membrane splits hydrogen gas molecules into protons and electrons The protons pass through the membrane to react with oxygen in the air (forming water). The electrons, which cannot pass through the membrane, must travel around it, thus creating the source of DC electricity The Role of Natural Gas it is sent through a reformer that pulls hydrogen atoms off methane (NG) molecule, thereby providing source of hydrogen for the fuel cell Note that any hydrocarbon could be sent through a reformer, but NG is best because of its high H/C ratio compared to longer hydrocarbon chains (such as those in petroleum), thereby limiting the energy needed and waste produced to form Hydrogen Green sources of Hydrogen (windpower) would eliminate CO 2 produced in NG reforming
63 Helpful Resources Australian Gas Association American Gas Association Energy Information Association Gaz de France LNG information - Consolidated Natural Gas Natural Gas Council - Natural Gas Supply Association - Gas Research Institute Insterstate Natural Gas Association of America - DOE Fossil Energy Site - Enron DOE -
64 Helpful Resources CERA Cambridge Energy Research Associates in Cambridge, MA is the leading energy information consultancy in the world. They publish a book every year called North American Natural Gas Trends. Worldwatch Institute in Washington D.C. Excellent recent paper July 2000 on the micropower revolution by Seth Dunn Ron Barone and the Investment Research info provided by Paine Webber. Will release an annual paper on U.S. Natural Gas this week. BP Statistical Review of Energy (see BPAmoco s website) February 10,2001 Economist Survey of Energy
Short Term Energy Outlook March 2011 March 8, 2011 Release
 Short Term Energy Outlook March 2011 March 8, 2011 Release Highlights West Texas Intermediate (WTI) and other crude oil spot prices have risen about $15 per barrel since mid February partly in response
Annual Energy Outlook 2015
 Annual Energy Outlook 215 for Asia Pacific Energy Research Centre Annual Conference 215 Tokyo, Japan by Sam Napolitano Director of the Office of Integrated and International Energy Analysis U.S. Energy
Impact of American Unconventional Oil and Gas Revolution
 National University of Singapore Energy Studies Institute 18 May 215 Impact of American Unconventional Oil and Gas Revolution Edward C. Chow Senior Fellow Revenge of the Oil Price Cycle American Innovation:
Short-Term and Long-Term Outlook for Energy Markets
 Short-Term and Long-Term Outlook for Energy Markets Guy Caruso Administrator, Energy Information Administration guy.caruso@eia.doe.gov Fueling the Future: Energy Policy in New England December 2, 25 Boston,
International Energy Outlook: key findings in the 216 Reference case World energy consumption increases from 549 quadrillion Btu in 212 to 629 quadril
 EIA's Global Energy Outlook For The Institute of Energy Economics, Japan October 5, 216 Japan By Adam Sieminski, Administrator U.S. Energy Information Administration Independent Statistics & Analysis www.eia.gov
Overview. Key Energy Issues to Economic Growth
 Key Energy Issues to 225 The Energy Information Administration (EIA), in preparing model forecasts for its Annual Energy Outlook 25 (AEO25), evaluated a wide range of current trends and issues that could
AIChE: Natural Gas Utilization Workshop Overcoming Hurdles of Technology Implementation
 AIChE: Natural Gas Utilization Workshop Overcoming Hurdles of Technology Implementation Natural Gas in the United States: An Overview of Resources and Factors Affecting the Market November 2, 216 Justin
Liquefied Natural Gas (LNG) Production and Markets. By: Jay Drexler, Dino Kasparis, and Curt Knight
 Production and Markets. By: Jay Drexler, Dino Kasparis, and Curt Knight") Liquefied Natural Gas (LNG) Production and Markets By: Jay Drexler, Dino Kasparis, and Curt Knight Outline Purpose of the presentation What is Liquefied Natural Gas? (LNG) LNG Operations Brief History
Liquefied Natural Gas (LNG) Production and Markets By: Jay Drexler, Dino Kasparis, and Curt Knight Outline Purpose of the presentation What is Liquefied Natural Gas? (LNG) LNG Operations Brief History
OUR CONVERSATION TODAY
 OUR CONVERSATION TODAY Our goal is to raise the level of awareness around the natural gas supply chain among key stakeholders in order to facilitate positive working relationships and more informed decision
LNG Facts A Primer. Presentation before US Department of Energy, Office of Fossil Energy, LNG Forums. March 10, Kristi A. R.
 LNG Facts A Primer Presentation before US Department of Energy, Office of Fossil Energy, LNG Forums March 10, 2006 Kristi A. R. Darby Center for Louisiana State University Overview What is Natural Gas?
Natural Gas. Tuesday, May 1, 2012; 4:00 PM 5:15 PM
 Natural Gas Tuesday, May 1, 2012; 4:00 PM 5:15 PM Moderator: Joel Kurtzman, Senior Fellow and Executive Director of the Center for Accelerating Energy Solutions, Milken Institute Speakers: Ralph Eads,
Power & Politics Navigating the Changing Vision of Our Energy Future. Rayola Dougher, API Senior Economic Advisor,
 Power & Politics Navigating the Changing Vision of Our Energy Future Rayola Dougher, API Senior Economic Advisor, dougherr@api.org U.S. oil and natural gas production is increasing as a result of technological
CHAPTER ONE COPYRIGHTED MATERIAL
 c01.qxd:layout 1 10/29/08 5:29 PM Page xiv CHAPTER ONE COPYRIGHTED MATERIAL c01.qxd:layout 1 10/29/08 5:30 PM Page 1 The purpose of this chapter is to provide the candidate an overview of the energy cycle,
AEO2005 Overview. Key Energy Issues to Economic Growth
 Key Energy Issues to 225 The Energy Information Administration (EIA), in preparing model forecasts for its Annual Energy Outlook 25 (AEO25), evaluated a wide range of current trends and issues that could
Coal and Natural Gas The Evolving Nature of Supply and Demand
 Lab4energy International 2014 Coal and Natural Gas Coal and Natural Gas The Evolving Nature of Supply and Demand Dr. Francis O Sullivan February 13 th, 2014 1 Global energy supply Where does it come from?
The Role of GCC s Natural Gas in the World s Gas Markets
 World Review of Business Research Vol. 1. No. 2. May 2011 Pp. 168-178 The Role of GCC s Natural Gas in the World s Gas Markets Abdulkarim Ali Dahan* The objective of this research is to analyze the growth
Shale Gas and the Outlook for U.S. Natural Gas Markets and Global Gas Resources
 Shale Gas and the Outlook for U.S. Natural Gas Markets and Global Gas Resources Organization for Economic Cooperation and Development (OECD) Richard Newell, Administrator June 21, 2011 Paris, France U.S.
LNG basics. Juan Manuel Martín Ordax
 LNG basics Juan Manuel Martín Ordax LNG basics Definition: Liquefied Natural Gas (LNG) is the liquid form of natural gas. LNG is a natural gas. LNG is a liquid. When cooled at atmospheric pressure to temperatures
U.S. EIA s Liquid Fuels Outlook
 U.S. EIA s Liquid Fuels Outlook NCSL 2011 Energy Policy Summit: Fueling Tomorrow s Transportation John Staub, Team Lead August 8, 2011 San Antonio, Texas U.S. Energy Information Administration Independent
UNDERSTANDING NATURAL GAS MARKETS. Mohammad Naserifard MSc student of Oil & Gas Economics at PUT Fall 2015
 UNDERSTANDING NATURAL GAS MARKETS Mohammad Naserifard MSc student of Oil & Gas Economics at PUT Fall 2015 Table of Contents 3 Overview Natural Gas is an Important Source of Energy for the United States.
U.S. oil and natural gas outlook
 U.S. oil and natural gas outlook New York, NY By Adam Sieminski, EIA Administrator U.S. Energy Information Administration Independent Statistics & Analysis www.eia.go v The U.S. has experienced a rapid
Oil and natural gas: market outlook and drivers
 Oil and natural gas: market outlook and drivers for American Foundry Society May 18, 216 Washington, DC by Howard Gruenspecht, Deputy Administrator U.S. Energy Information Administration Independent Statistics
NARUC. Global Liquefied Natural Gas Supply: An Introduction for Public Utility Commissioners
 2009 Global Liquefied Natural Gas Supply: An Introduction for Public Utility Commissioners NARUC October 2009 The National Association of Regulatory Utility Commissioners Funded by the U.S. Department
Milken Institute: Center for Accelerating Energy Solutions
 Milken Institute: Center for Accelerating Energy Solutions Center for Accelerating Energy Solutions Promotes policy and market mechanisms to build a more stable and sustainable energy future Identifies
Natural gas. Natural Gas Embedded in Seas Close to Japan Natural gas reserves are abundant
 About Natural Gas Clean Energy, Natural Gas Natural Gas as an Unconventional Resource Emissions of combustion by-products from fossil fuels (Coal = 100) Natural gas, which is primarily composed of methane,
Status and outlook for shale gas and tight oil development in the U.S.
 Status and outlook for shale gas and tight oil development in the U.S. for Energy Symposium, University of Oklahoma, Price College Energy Institute Norman, OK by Adam Sieminski, Administrator U.S. Energy
The Outlook for Energy: A View to 2040
 The Outlook for Energy: A View to 2040 Rob Gardner March 2014 This presentation includes forward looking statements. Actual future conditions (including economic conditions, energy demand, and energy supply)
Overview of LNG in the United States
 Overview of LNG in the United States Dan McGinnis, Vice President of Gas Infrastructure Tractebel Project Development Inc. Natural Gas Conference Louisiana State University October 27, 2003 What Is Liquefied
APPA 2017 Fuels 1. Energy Fuel Types Fuel consumption What fuels are we using? What are we using it for?
 Barry Mielke, PE South Dakota State University Energy Fuel Types Fuel consumption What fuels are we using? What are we using it for? APPA 2017 Fuels 1 As defined by your science teacher, Energy is the
U.S. Shale Gas in Context
 U.S. Shale Gas in Context Overview of U.S. Natural Gas production and trends For National Conference of State Legislatures Natural Gas Policy Institute September 9, 215 Pittsburgh, Pennsylvania By Grant
Energy Availability and the Future of the Fertilizer Industry. Rayola Dougher API Senior Economic Advisor
 Energy Availability and the Future of the Fertilizer Industry Rayola Dougher API Senior Economic Advisor dougherr@api.org Energy: the engine of our economic growth 1974 1980 1986 1992 1998 2004 2010 2016
The Shifting Sands of Natural Gas Abundance
 August 17, 2016 The Shifting Sands of Natural Gas Abundance Richard Meyer Manager, Energy Analysis & Standards Here s how global energy changed between 2014 and 2015. Winners were oil, natural gas, renewables.
Natural Gas. Smarter Power Today. Perspectives on the Future of Regulatory Policy Illinois State University. Springfield, IL October 25, 2012
 Natural Gas Smarter Power Today. Perspectives on the Future of Regulatory Policy Illinois State University Springfield, IL October 25, 2012 ANGA Members 2 ABUNDANCE & PRICE STABILITY The Shale Gas Revolution
Natural Gas Monthly. July Office of Oil, Gas, and Coal Supply Statistics U.S. Department of Energy Washington, DC 20585
 Natural Gas Monthly Office of Oil, Gas, and Coal Supply Statistics www.eia.gov U.S. Department of Energy Washington, DC 20585 This report was prepared by the U.S. Energy Information Administration (EIA),
Natural Gas Monthly. August Office of Oil, Gas, and Coal Supply Statistics U.S. Department of Energy Washington, DC 20585
 Natural Gas Monthly Office of Oil, Gas, and Coal Supply Statistics www.eia.gov U.S. Department of Energy Washington, DC 20585 This report was prepared by the U.S. Energy Information Administration (EIA),
Natural Gas Monthly. September Office of Oil, Gas, and Coal Supply Statistics U.S. Department of Energy Washington, DC 20585
 Natural Gas Monthly September 2017 Office of Oil, Gas, and Coal Supply Statistics www.eia.gov U.S. Department of Energy Washington, DC 20585 This report was prepared by the U.S. Energy Information Administration
Edgardo Curcio President AIEE
 Edgardo Curcio President AIEE The First National Conference on Liquefied Natural Gas for Transports - Italy and the Mediterranean Sea April 11, 2013 What is LNG? The LNG (Liquefied Natural Gas) is a fluid
Comparison of Netbacks from Potential LNG Project with ALCAN Pipeline Project
 Comparison of Netbacks from Potential LNG Project with ALCAN Pipeline Project June 20, 2008 Barry Pulliam Senior Economist Econ One Research 5th Floor 601 W 5th Street Los Angeles, California 90071 213
World and U.S. Oil and Gas Production and Price Outlook: To Infinity (or at least 2050) and Beyond
 and Beyond") World and U.S. Oil and Gas Production and Price Outlook: To Infinity (or at least 25) and Beyond Energy and Environment Symposium April 18, 218 Rifle, Colorado by Troy Cook, Senior Global Upstream Analyst,
World and U.S. Oil and Gas Production and Price Outlook: To Infinity (or at least 25) and Beyond Energy and Environment Symposium April 18, 218 Rifle, Colorado by Troy Cook, Senior Global Upstream Analyst,
Biomass. Coal. 10 Intermediate Energy Infobook Activities. Description of biomass: Renewable or nonrenewable: Description of photosynthesis:
 Biomass Description of biomass: Description of photosynthesis: Ways we turn biomass into energy we can use: Who uses biomass and for what purposes: Effect of using biomass on the environment: Important
Fuels Used in Electricity Generation
 Fuels Used in Electricity Generation for Energy and Climate Change Research Seminar May 17 th, 2012 Washington, DC by, Office of Electricity, Coal, Nuclear and Renewables Analysis Energy Information Administration
INTERNATIONAL ENERGY AGENCY WORLD ENERGY INVESTMENT OUTLOOK 2003 INSIGHTS
 INTERNATIONAL ENERGY AGENCY WORLD ENERGY INVESTMENT OUTLOOK 2003 INSIGHTS Global Strategic Challenges Security of energy supplies Threat of environmental damage caused by energy use Uneven access of the
ENVIRONMENT AND ENERGY BULLETIN
 ENVIRONMENT AND ENERGY BULLETIN Vol. 3 No. 2 June 2011 Editor: Jock A. Finlayson THE NATURAL GAS STORY Both globally and in North America, natural gas is poised to play a bigger role in meeting the energy
An INDEPENDENT energy consulting company since 1996 No affiliation with any marketer, broker, agent, utility, pipeline or producer.
 An INDEPENDENT energy consulting company since 1996 No affiliation with any marketer, broker, agent, utility, pipeline or producer. More than two decades of experience in the natural gas and electric industries
North American Midstream Infrastructure Through 2035 A Secure Energy Future. Press Briefing June 28, 2011
 North American Midstream Infrastructure Through 2035 A Secure Energy Future Press Briefing June 28, 2011 Disclaimer This presentation presents views of ICF International and the INGAA Foundation. The presentation
October U.S. Energy Information Administration Winter Fuels Outlook October
 October 2017 Winter Fuels Outlook EIA forecasts that average household expenditures for all major home heating fuels will rise this winter because of expected colder weather and higher energy costs. Average
Shale Gas. A Game Changer for U.S. and Global Gas Markets? Flame European Gas Conference March 2, 2010, Amsterdam. Richard G. Newell, Administrator
 Shale Gas A Game Changer for U.S. and Global Gas Markets? Flame European Gas Conference March 2, 2010, Amsterdam Richard G. Newell, Administrator Richard Newell, March SAIS, December 2, 2010 14, 2009 1
International Association for Energy Economics Luncheon Presentation April 21, 2004
 International Association for Energy Economics Luncheon Presentation April 21, 2004 Recent Changes in the Natural Gas Market and the Need for More LNG in New England Mike Reimers, Weaver s Cove Energy,
International Energy Outlook 2011
 International Energy Outlook 211 Center for Strategic and International Studies, Acting Administrator September 19, 211 Washington, DC U.S. Energy Information Administration Independent Statistics & Analysis
Summer Fuels Outlook. Gasoline and diesel. April 2018
 April 2018 Summer Fuels Outlook This outlook focuses on prices and consumption of gasoline, diesel, and electricity (see Summer Fuels Outlook motor gasoline table and electricity table). The use of these
Natural Gas Abundance: The Development of Shale Resource in North America
 Natural Gas Abundance: The Development of Shale Resource in North America EBA Brown Bag Luncheon Bracewell & Giuliani Washington, D.C. February 6, 2013 Bruce B. Henning Vice President, Energy Regulatory
Annual Energy Outlook 2018 with projections to 2050
 Annual Energy Outlook 218 with projections to 25 February 218 U.S. Energy Information Administration Office of Energy Analysis U.S. Department of Energy Washington, DC 2585 This publication is on the Web
Spud, Pipe and Chill. Mapping a Secular Transition in North American Gas Markets
 Spud, Pipe and Chill Mapping a Secular Transition in North American Gas Markets Robert S. Linden 24 th Annual USAEE/IAEE North American Conference July 10, 2004 Washington, DC In praise of heresy The best
APPENDIX C FUEL PRICE FORECASTS
 APPENDIX C FUEL PRICE FORECASTS BACKGROUND Since the Council s 1991 Power Plan, fuel prices have been following the low forecast. Figure C-1 illustrates this for world oil prices, and similar patterns
NATURAL GAS 101 THE BASICS OF NATURAL GAS
 NATURAL GAS 101 THE BASICS OF NATURAL GAS April 25, 2014 Natural Gas Basics What is natural gas? Natural gas is a fossil fuel composed primarily of methane, and other hydrocarbons such as ethane, butane
Rice University World Gas Trade Model
 Rice University World Gas Trade Model Peter Hartley Kenneth B Medlock III Jill Nesbitt James A. Baker III Institute of Public Policy RICE 1 What does the model capture? World gas supply potential is large
A Different Future? Robert J. Finley Illinois State Geological Survey Champaign, Illinois
 Fossil Fuels, Energy Efficiency, and Carbon Emissions: A Different Future? Robert J. Finley Illinois State Geological Survey Champaign, Illinois Governor s Pollution Prevention Awards October 25, 2007
Winter U.S. Natural Gas Production and Supply Outlook
 Winter 2010-11 U.S. Natural Gas Production and Supply Outlook Prepared for Natural Gas Supply Association by: ICF International Fairfax, Virginia September, 2010 Introduction This report presents ICF s
Natural Gas Producer to Consumer
 Natural Gas Producer to Consumer Cy Esphahanian CCOP Beijing - June 25 Scope of this Presentation History and Overview The Physical Flow of Natural Gas Infrastructure The Financial/Business Structure Pricing
Fuel Information Sheet
 Wood (Biomass) Maine has 17 million acres of forest. Wood is a renewable energy source; we can grow more trees and manage forested areas. Wood must be transported to where it is used. Wood requires storage
Natural Gas Issues and Emerging Trends for the Upcoming Winter and Beyond
 Natural Gas Issues and Emerging Trends for the Upcoming Winter and Beyond 2013 NASEO WINTER ENERGY OUTLOOK CONFERENCE November 1, 2013 Kevin Petak Vice President, ICF International Kevin.Petak@icfi.com
WHAT IS LIQUEFIED NATURAL GAS?
 WHAT IS LIQUEFIED NATURAL GAS? WHAT IS NATURAL GAS? Natural gas is a colourless and odourless gas that is created from organic matter that has decayed for millions of years. Around the world, people use
The Gas Cycle in the 21 st Century
 The Gas Cycle in the 21 st Century Stephen A. Holditch Schlumberger Outline The Past The Golden Age of Oil The Golden Age of Gas - Now The Gas Cycle What is it? LNG, GTL, Gas by Wire, UGS Conclusions 2
Winter U.S. Natural Gas Production and Supply Outlook
 Winter 2012-13 U.S. Natural Gas Production and Supply Outlook Prepared for Natural Gas Supply Association by: ICF International Fairfax, Virginia September, 2012 Introduction This report presents ICF s
World Energy Outlook Bo Diczfalusy, Näringsdepartementet
 World Energy Outlook 2013 Bo Diczfalusy, Näringsdepartementet Energy demand & GDP Trillion dollars (2012) 50 40 30 20 10 000 Mtoe 8 000 6 000 4 000 GDP: OECD Non-OECD TPED (right axis): OECD Non-OECD 10
Shale Gas - Transforming Natural Gas Flows and Opportunities. Doug Bloom President, Spectra Energy Transmission West October 18, 2011
 Fort Nelson Gas Plant, British Columbia Shale Gas - Transforming Natural Gas Flows and Opportunities Doug Bloom President, Spectra Energy Transmission West October 18, 2011 Natural Gas Golden Age Natural
************ Day 2 ************ ************ Session 2, Session 3 11:45 and 1:45 ************
 Natural Gas Value Chain: Discussion Questions ************ Day 2 ************ ************ Session 2, Session 3 11:45 and 1:45 ************ Electric Generation What other generation fuels are in the mix?
Alternative Energy Resources. Environmental Earth Science Rev 2018, Spds 2011
 Alternative Energy Resources Environmental Earth Science Rev 2018, Spds 2011 Energy Sources Sun is the ultimate source of most energy on Earth. The Sun s energy is transferred from photosynthetic organisms
North America Midstream Infrastructure through 2035: Capitalizing on Our Energy Abundance
 North America Midstream Infrastructure through 2035: Capitalizing on Our Energy Abundance Prepared by ICF International for The INGAA Foundation, Inc. Support provided by America s Natural Gas Alliance
Energy Energizes. the Technology Marketplace. How oil & gas exploration worldwide will dictate instrumentation investments going forward
 FLOW update Oil & Gas Energy Energizes the Technology Marketplace How oil & gas exploration worldwide will dictate instrumentation investments going forward By Jesse Yoder, Ph.D. Michal Kodym/Getty Images/ThinkStock
ST98: 2018 ALBERTA S ENERGY RESERVES & SUPPLY/DEMAND OUTLOOK. Executive Summary.
 ST98: 2018 ALBERTA S ENERGY RESERVES & SUPPLY/DEMAND OUTLOOK Executive Summary ST98 www.aer.ca EXECUTIVE SUMMARY The Alberta Energy Regulator (AER) ensures the safe, efficient, orderly, and environmentally
ST98: 2018 ALBERTA S ENERGY RESERVES & SUPPLY/DEMAND OUTLOOK. Executive Summary.
 ST98: 2018 ALBERTA S ENERGY RESERVES & SUPPLY/DEMAND OUTLOOK Executive Summary ST98 www.aer.ca EXECUTIVE SUMMARY The Alberta Energy Regulator (AER) ensures the safe, efficient, orderly, and environmentally
Texas Water Resources Institute
 Texas Water Resources Institute October 1977 Volume 3 No. 8 Water for Energy By Lou Ellen Ruesink, Editor, Texas Water Resources Recent national concerns over future energy supplies have raised serious
Trends, Issues and Market Changes for Crude Oil and Natural Gas
 Trends, Issues and Market Changes for Crude Oil and Natural Gas East Iberville Community Advisory Panel Meeting Syngenta September 26, 2012 Center for Energy Studies David E. Dismukes, Ph.D. Center for
World Energy Outlook 2035: A focus on LNG supply and demand dynamics
 World Energy Outlook 2035: A focus on LNG supply and demand dynamics M.H. Siddiqui, Prescience, USA 1 Agenda The Energy Outlook in 2035 involving major landscape changes in supply, demand, fossil fuels,
Let's get non-technical: An economist's take on the past, the present, and the future of the industry
 Let's get non-technical: An economist's take on the past, the present, and the future of the industry Erkal Ersoy e.ersoy@hw.ac.uk www.erkalersoy.co.uk Agenda» The market > The petroleum industry > Supply
Shale Gas as an Alternative Petrochemical Feedstock
 Shale Gas as an Alternative Petrochemical Feedstock Tecnon OrbiChem Seminar at KICHEM 2012 Seoul - 2 November, 2012 Roger Lee SHALE GAS WHERE DOES IT COME FROM? Source: EIA SHALE GAS EXPLOITATION Commercial
North America s Natural Gas Crisis: The Big Picture Overview and the Role of Unconventional Gas
 North America s Natural Gas Crisis: The Big Picture Overview and the Role of Unconventional Gas Canadian Institute s 3 rd Annual Coalbed Methane Conference June 21, 24 J. David Hughes Geological Survey
API Industry Outlook. Third Quarter R. Dean Foreman, Ph.D. Great Plains and EmPower ND Energy Conference October 8, 2018.
 API Industry Outlook Third Quarter 2018 R. Dean Foreman, Ph.D. Chief Economist American Petroleum Institute Great Plains and EmPower ND Energy Conference October 8, 2018 American Updated Petroleum September
The Really Big Game Changer: Crude Oil Production from Shale Resources and the Tuscaloosa Marine Shale
 The Really Big Game Changer: Crude Oil Production from Shale Resources and the Tuscaloosa Marine Shale Baton Rouge Chamber of Commerce Regional Stakeholders Breakfast June 27, 2012 Center for Energy Studies
The Economic Value of American Coal Exports
 August 2012 The Economic Value of American Coal Exports Summary of Findings The United States has the world s largest endowment of low-cost, high quality coal reserves. These reserves can be competitively
Background, Issues, and Trends in Underground Hydrocarbon Storage
 Background, Issues, and Trends in Underground Hydrocarbon Storage David E. Dismukes Center for Energy Studies Louisiana State University Environmental Permitting Class January 29, 2009 Description of the
MEMORANDUM. May 6, Subcommittee on Energy and Power Democratic Members and Staff
 FRED UPTON, MICHIGAN CHAIRMAN HENRY A. WAXMAN, CALIFORNIA RANKING MEMBER ONE HUNDRED THIRTEENTH CONGRESS Congress of the United States House of Representatives COMMITTEE ON ENERGY AND COMMERCE 2125 RAYBURN
11/18/2011. Moderate demand increase High depletion rate. Alfa Laval 1. Sammy Hulpiau Segment Manager Energy & Environment. mb/d.
 Oil & Gas Sammy Hulpiau Segment Manager Energy & Environment Oil production investments are rapidly growing mb/d 120 100 80 60 NGLs Unconventional oil Crude oil fields yet to be developed or found Crude
Annual Energy Outlook 2017 with projections to 2050
 Annual Energy Outlook 217 with projections to 25 #AEO217 January 5, 217 Table of contents Page Overview/key takeaways 3 Critical drivers and uncertainty 31 Petroleum and other liquids 4 Natural gas 51
Five Things You Should Know
 Bureau of Economic Geology, Jackson School of Geosciences, The University of Texas at Austin Five Things You Should Know Tx Industries of the Future, March 7, 2013 M.M. Foss, 9/25/2012, BEG/CEE-UT, 1 #1
Natural Gas The Natural Choice Now.
 Natural Gas The Natural Choice Now. About ANGA ANGA is dedicated to increasing the understanding of the environmental, economic and national security benefits of clean, abundant, dependable and efficient
Section 1. Electricity and Your Community. What Do You See? Think About It. Investigate. Learning Outcomes
 Chapter 7 Earth s Natural Resources Section 1 Electricity and Your Community What Do You See? Learning Outcomes In this section, you will Compare energy resources used to generate electricity in the United
GAS MARKET INTEGRATION: FOR A SUSTAINABLE GLOBAL GROWTH By: Chairman of the Management Committee, Gazprom Alexey Miller
 GAS MARKET INTEGRATION: FOR A SUSTAINABLE GLOBAL GROWTH By: Chairman of the Management Committee, Gazprom Alexey Miller Growth dynamics and structure of energy consumption Dynamics of world energy consumption,
Annual Energy Outlook 2018
 Annual Energy Outlook 218 Columbia University, Center on Global Energy Policy February 13, 218 New York, NY John J. Conti, Deputy Administrator U.S. Energy Information Administration U.S. Energy Information
Assessing Today's Supplies to Fuel Tomorrow's Growth
 WORLD ENERGY OUTLOOK - INSIGHTS Assessing Today's Supplies to Fuel Tomorrow's Growth Dr. Fatih Birol Head, Economic Analysis Division International Agency / OECD World Series World 1998 World 1999 Looking
Industrial Demand and the Changing Natural Gas Market
 Industrial Demand and the Changing Natural Gas Market Robert Pirog Specialist in Energy Economics February 10, 2011 Congressional Research Service CRS Report for Congress Prepared for Members and Committees
Natural Gas Facts & Figures. New Approach & Proposal
 Natural Gas Facts & Figures New Approach & Proposal 1. Production and reserves Sources : Total G&P, WOC1, IEA, IHS Cera, Resources- Reserves o Conventional o Unconventional : types and reserves Countries,
The Outlook for Energy:
 The Outlook for Energy: A View to 2040 Bill Colton December 9, 2014 This presentation includes forward-looking statements. Actual future conditions (including economic conditions, energy demand, and energy
Alan D. Hatfield PE Braemar Wavespec USA Houston, Texas. Yukon Energy Corporation LNG Workshop
 LNG Fundamentals Alan D. Hatfield PE Braemar Wavespec USA Houston, Texas Yukon Energy Corporation LNG Workshop January 18, 2012 What is Liquefied Natural Gas (LNG)? Liquefied Natural Gas (LNG) is a clear,
US Oil and Gas Import Dependence: Department of Energy Projections in 2011
 1800 K Street, NW Suite 400 Washington, DC 20006 Phone: 1.202.775.3270 Fax: 1.202.775.3199 Email: acordesman@gmail.com Web: www.csis.org/burke/reports US Oil and Gas Import Dependence: Department of Energy
Oil and Gas Reserves and Production Volume
 Oil and Gas Reserves and Production Volume 1. OIL AND GAS RESERVES Proved reserves The following tables list the proved reserves of crude oil, condensate, LPG and natural gas of our company, our consolidated
US Energy Independence & Energy Exports
 US Energy Independence & Energy Exports Fred C. Beach, Ph.D. Earth Wind & Fire Conference Addison, TX. 4 October, 2014 10/12/2014 1 Global Consumption Trends 2011 Energy Consumption, + 2.5% OEDC, Down
U.S. Crude Oil, Natural Gas, and NG Liquids Proved Reserves
 1 of 5 3/14/2013 11:37 PM U.S. Crude Oil, Natural Gas, and NG Liquids Proved Reserves With Data for Release Date: August 1, 2012 Next Release Date: March 2013 Previous Issues: Year: Summary Proved reserves
Black Gold: America and Oil 9/23/08 NOTES 9/18/08 POSTED & ASSIGNMENT #4 INTER/EXTRAPOLATION & EXP. GROWTH?
 Black Gold: America and Oil 9/23/08 NOTES 9/18/08 POSTED & ASSIGNMENT #4 INTER/EXTRAPOLATION & EXP. GROWTH? Questions Is America / world running out of oil? Can the US be energy-independent? U.S. Energy