Jordan River TMDL Update
|
|
|
- Jessica Wilkerson
- 5 years ago
- Views:
Transcription


1 Jordan River TMDL Update 2010 Watershed Symposium August 4 th, 2010 Hilary N. Arens Utah Division of Water Quality

2 Jordan River TMDL Outline What is a TMDL and what is the Jordan impaired for? Evaluation of existing information Pollutant sources and loading Permissible Loads and Needed Reductions Load Allocation Scenarios Next Steps
3 What is a TMDL? If a waterbody (stream, lake, reservoir, etc.) fails to meet water quality standards, the state places the waterbody on the 303(d) list of impaired waters. State must then prepare a plan to restore water quality called a Total Maximum Daily Load study (TMDL). The Clean Water Act requires this study to determine how much a pollutant of concern has to be reduced to meet water quality standards and support an impaired waters designated beneficial uses.
, point sources (PS), and a margin of safety, that support water quality standards.")
4 Jordan River TMDL A TMDL establishes the maximum amount of a pollutant allowed in the water while supporting all of its designated beneficial uses. A TMDL is the sum of nonpoint sources (NPS), point sources (PS), and a margin of safety, that support water quality standards. TMDL = LA + WLA + MOS LA - Load Allocations from Non-Point Sources WLA - Waste Load Allocations from Point Sources MOS - Margin of Safety

5 Jordan River Beneficial Use Classes Class 2B: Protected for secondary contact recreation such as boating, wading, or similar uses. Class 3A: Protected for cold water species of game fish and other cold water aquatic life, including the necessary aquatic organisms in their food chain. Class 3B: Protected for warm water species of game fish and other warm water aquatic life, including the necessary aquatic organisms in their food chain. Class 4: Protected for agricultural uses including irrigation of crops and stock watering.
6 Utah Water Quality Standards and Pollutant Indicator Values Pollutant or Indicator Allowable or Recommended Limit Dissolved Oxygen (DO) (1) Total Dissolved Solids (TDS) (1) Temperature (1) Biochemical Oxygen Demand (BOD) (2) 30-day average 5.5 mg/l Aug-Apr instantaneous 4.0 mg/l May-July instantaneous 4.5 mg/l 1,200 mg/l for irrigation 2,000 mg/l for livestock 20 C for cold water fishery 27 C for warm water fishery 5 mg/l Total Suspended Solids (TSS) (2) 90 mg/l Total Phosphorus (2) 0.05 mg/l (1) Utah state water quality standard (2) Not a water quality standard but an indicator of water quality

7 Jordan River Segments and Water Quality Impairments
8 Evaluation of Existing Information Water quality and flow data available for use in the study EPA-STORET Data Warehouse: USGS-National Water Information Server: Wastewater Treatment Plants (DMR data, additional monitoring) Salt Lake City (municipal watersheds) Division of Water Rights (diversions) Salt Lake County (gaged tributaries and stormwater monitoring) Four basic types of data (routine, continuous, synoptic, diurnal) Data archived in MS Access database (currently more than 500,000 records of water quality and flow).
9 Significant Pollutant Sources Tributary Streams and Utah Lake Some streams not significant due to limited flow and diversions. Permitted discharges Central Valley WRF, South Valley WRF, South Davis WWTP. Storm water Storm water catchments from Salt Lake and Utah counties, none located in Davis County. Direct surface runoff Areas outside of storm water catchments that drain directly to Jordan River. Groundwater Flow based on USGS Salt Lake Valley model Considered all wells within 2 miles of Jordan River.

10 Pollutant Loads Pollutant loads were calculated using average monthly flows and water quality values. Water quality stations selected based on proximity to flow gages and length and frequency of the data record.
11 Updated Existing Loads Rationale Ensure that TMDL is based on most current data Include recent measurements of BOD and Total P Incorporate minor corrections Purged suspect data Results Minor changes in total loads Increased NH 4 -N in mainstem Significantly higher BOD 5 at CVWRF Increased TSS in small tributaries All data used in permitted discharge loads provided by facilities
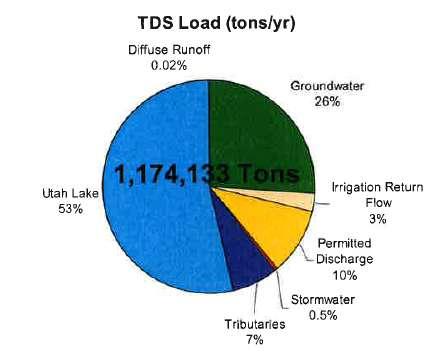
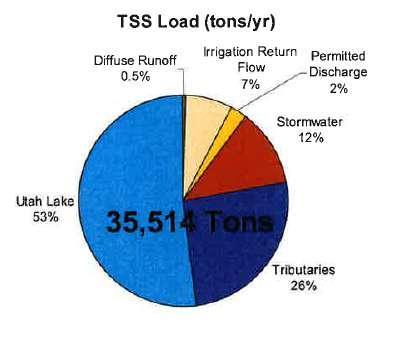
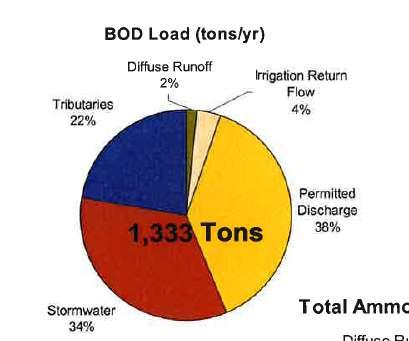
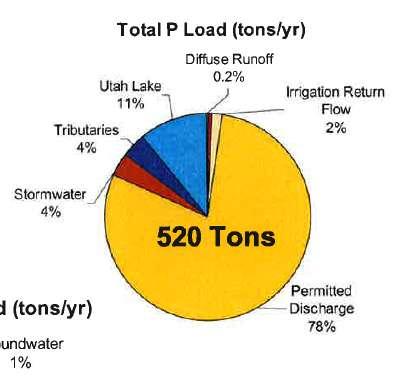
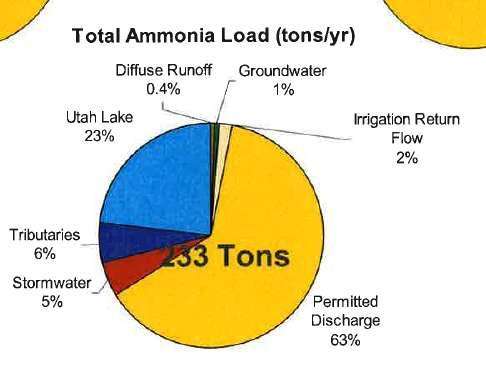
12 Previous Distribution of Annual Pollutant Loads to Jordan River
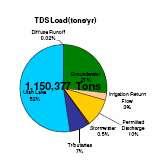
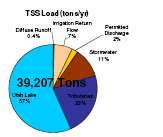
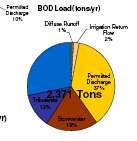
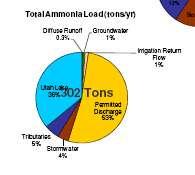
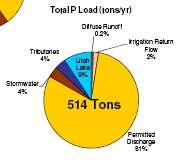
13 Updated: Distribution of Annual Pollutant Loads to Jordan River

14 Percent Change in Average Annual Load due to Update
15 Future Loads Percent Change in Total Pollutant Loadings by 2030 Pollutant TDS TSS BOD NH4 TP DWQ Segment % 0% -2% 12% 11% -3% -5% 2% 104% 5% 7% 32% 39% 71% 407% 0% 62% 4% 14% 59% 24% 320% 290% 1% 58% 5% 14% 36% 24% 2067% 43% 0% 58% 16% 10% 35% 18% 1364% 6% 1% TOTAL 3% 15% 56% 76% 59% Increases from existing loads Calculate the total reduction required for any new point source or non-point source load that is anticipated within the planning horizon For example, the Jordan Basin WWTP in Riverton under construction.

16 TMDL Compliance Points Monitoring locations where permissible loads are measured. Considerations: Location with respect to impaired segments Data history Group segments of similar impairment Monitoring points above impairment
17 Determine Permissible Loads and Necessary Reductions Identify Critical Conditions Establish Endpoints Assign Permissible Loads Definitions Temperature TDS DO
 that represent the worst case scenario Low flow (7Q10) Time period (seasonal, daily) Continuous simulation")
18 Definition: Critical Condition Combination of environmental factors (e.g., flow, temperature, etc.) that represent the worst case scenario Low flow (7Q10) Time period (seasonal, daily) Continuous simulation using models
19 Definition: Endpoints A measured value that represents a desired environmental condition. Hickey (2002) enforceable by law, indicative of ambient water quality, of ecological or anthropogenic significance, measurable in the field, predictable using a water quality model, of stakeholder concern.

20 Definition: Permissible Load The greatest amount of pollutant loading a water can receive without violating water quality standards
21 Percent Exceedance (%) Temperature ( C) Temp: Critical Conditions Percent Temperature Exceedance of 20 C Standard and Average Monthly Temperatures Upper Jordan River ( ) 100% 25 80% 20 60% 15 40% 10 20% 5 0% Jan Feb Mar Apr May Jun Jul Aug Sep Oct Nov Dec 0 Seg South Seg South Seg 7 - Bluffdale Rd Seg 7 - Narrows Seg S Temp Seg S Temp Seg 7 - Bluffdale Temp Seg 7 - Narrows Temp
22 Temp: Endpoints Average and maximum water temperatures at the Narrows and within Segments 5-7 modeled (QUAL2Kw) under different shading scenarios for August. Maximum Temp ( C) Average Temp ( C) At Segment At Segment Description Narrows Narrows Baseline: August % shading Segment 8, 60% shading Segments Practical alternative: 33% shading Segments 5-8, decrease SVWRF to 20 C Practical alternative in July
 Solar radiation = largest thermal load, (reduce by increasing shading) Natural hot spring: Temps from well = ~72 ºC SVWRF = anthropogenic thermal source")
23 Temp: Endpoints Only three significant sources of thermal loading in the upper Jordan River (two can be modified.) Solar radiation = largest thermal load, (reduce by increasing shading) Natural hot spring: Temps from well = ~72 ºC SVWRF = anthropogenic thermal source Discharge average 21.8 C in July and 22.3 C in August.

24 Temp: Permissible Load Even under very aggressive alternative, would not reach water quality standard. Permissible loads not calculated for temperature Unlikely that any reasonable strategy could achieve the State water quality standard. Assess the status of the aquatic biota and composition that could be achieved by reasonable efforts to limit high water temperatures. Yield a site specific criteria or a new subclass of beneficial use.

25 TDS: Critical Conditions Conservative substance Impairments listed in 4 segments Weak overall seasonal effect Seasonal pattern varies geographically Linked to Utah Lake

26 TDS: Utah Lake Critical Low levels in Utah Lake Condition Low precipitation, lake management 42% evaporation loss concentrates TDS Pumping for downstream water rights increases TDS concentration to Jordan River
27 Endpoint: TDS
28 TDS: Site Specific Criteria Effect of Endpoints and Permissible Loads Segment Segment 8 Segment 7 Compliance Point Narrows Bluffdale Road Significant TDS Sources (tons/yr) Utah Lake (627,980) Groundwater (7,645) Segment 8 (503,400) Groundwater (36,360) Segment 7 (180,854) Endpoint Site Specific Criterion: 1,300 mg/l Site Specific Criterion: 1,300 mg/l Sum of Monthly Exceedances of Endpoint (tons/yr) N/A (< 10% exceedances) N/A (< 10% exceedances) Segment 6 Segment 5 Segment South 5400 South 2100 South Groundwater (157,128) Irrigation Return Flow (14,197) Segment 6 (364,739) Site Specific Criterion: 1,300 mg/l 13,429 Site Specific SVWRF (39,915) Criterion: 143 Groundwater 1,300 mg/l (16,223) Not impaired: Only 4% of measurements last 5 years exceed 1,200 mg/l.
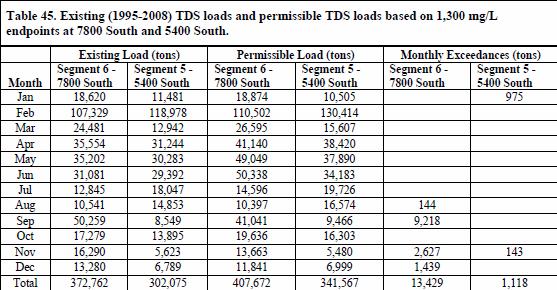
29 TDS: Permissible Loads
30 DO: Critical Conditions DO most critical in August, but varies significantly year to year. DO result of many interacting processes. DO exceedances may be linked to low levels of Utah Lake (concentrated detritus and algae). Use QUAL2Kw to explore reaction to changing pollutant loads at 2100 South.
31 DO: Endpoint Reducing nutrients alone at 2100 South does not resolve DO impairment. Significant reduction in organic matter can resolve DO impairment. Nutrients upstream may still contribute to organic matter at 2100 South.

32 QUAL2Kw Tool for Understanding Complex Chemical, Physical and Biological Interactions
33 Critical Pollutant Affecting DO Average DO (mg/l) Minimum DO (mg/l) Scenario Cudahy Lane Burnham Dam Cudahy Lane Burnham Dam August 2009 Synoptic Period Baseline TP = TP = 50% TP = 0.05 mg/l TP = 0.05 mg/l and NO3-N = 4 mg/l NO 3 = 4 mg/l NH 4 -N (only) = 0.08 mg/l Pollution Indicator Condition w/ NH 4 Limit ScBOD = 50% Eliminate Prescribed SOD Meet WQ Standard (min DO > 4 mg/l and mean DO > 5.5 mg/l) with Prescribed SOD and Detritus at 70% 12. Meet WQ Standard with all components of TSS and prescribed SOD at 75% baseline Meet WQ Standard + 2 mg/l with all components of TSS and prescribed SOD at 25% baseline (to protect diurnal swings)
34 DO: Permissible Loads Reducing TSS is one way to improve DO in the lower Jordan River. The mechanisms are two-fold: Reduce Organic Matter (OM): Reduces the DO demand from bacterial decomposition in both the water column and bottom sediment Reduce light attenuation: Allows benthic algae to produce DO during photosynthesis
35 Organic Matter Insoluble OM (or VSS) represented as detritus and chlorophyll-a
36 3 Load Allocation Scenarios Maximum allowable pollutant load accounts for both existing and future pollutant loads. 1. Proportional Allocation: Pollutant sources contribution of OM entering the lower Jordan River. Contribution of pollutant sources upstream of 2100 South Reduction distributed between pollutant sources based on their percent contribution to the Jordan River below 2100 South after losses have been accounted 2. Least Cost Allocation: Least expensive method for achieving load reductions that meet the permissible load. Costs for implementing BMPs and BATs to determine the cost per kg reduction for each source. 3. Most Practicable Allocation: Considers the constraints imposed by existing political and social settings or future trends that may influence implementing water quality improvements.
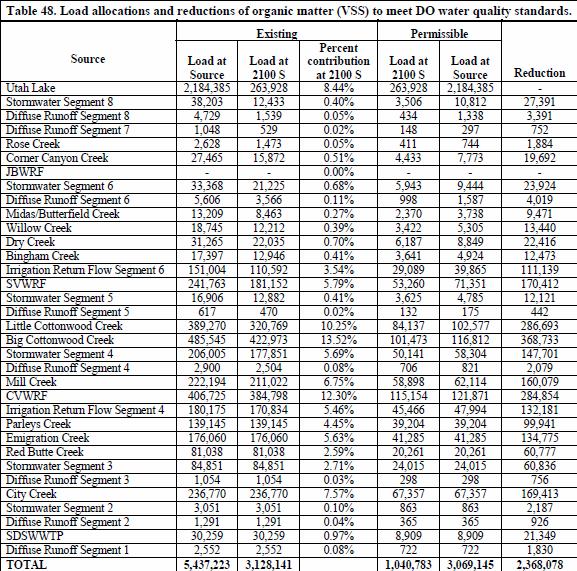
37 Existing Loads and Load Reductions 1. VSS Pollutant Loads at the Source 2. Residual VSS Source Loads Downstream of 2100 South 3. VSS Load Reductions Downstream of 2100 South 4. Proportional Load Allocation 5. VSS Load Reductions at the Source
38

39 VSS Loads From Different Sources * Tributaries contribute 53 percent of the VSS load to the lower Jordan River under existing conditions, while WWTPs contribute 19 percent of the load.
40 Next Steps Revise and update QUAL2Kw model based on Chapra review Inform permitted community of TMDL and load reduction scenarios Define elements of phased approach to TMDL development First phase submitted to EPA April 2011

41 Thank you! Hilary N. Arens
Jordan River Total Maximum Daily Load Study. Presented By: James Harris Utah Division of Water Quality
 Jordan River Total Maximum Daily Load Study Presented By: James Harris Utah Division of Water Quality Jordan River Watershed TMDL Study Area No Introduction Necessary A Few Things to Point Out... Lower
Jordan River TMDL Study What Have We Learned So Far?
 Jordan River TMDL Study What Have We Learned So Far? Salt Lake Countywide Watershed Symposium October 29 th, 2008 Hilary Arens & James Harris Utah Division of Water Quality TMDL Update Impairments Water
Total Maximum Daily Load Development for Unnamed Tributary to Pitts Creek. Public Meeting March 26, Why Are We Here
 Total Maximum Daily Load Development for Unnamed Tributary to Pitts Creek Public Meeting March, Why Are We Here. Learn about water quality of the stream. Discuss the Total Maximum Daily Load (TMDL) development.
Jordan River Total Maximum Daily Load (TMDL) Phase 1
 Phase 1") Jordan River Total Maximum Daily Load (TMDL) Phase 1 Presentation at Salt Lake County Watershed Symposium September 27, 2012 http://www.waterquality.utah.gov/tmdl/jordan_tmdl.htm What causes low oxygen
Jordan River Total Maximum Daily Load (TMDL) Phase 1 Presentation at Salt Lake County Watershed Symposium September 27, 2012 http://www.waterquality.utah.gov/tmdl/jordan_tmdl.htm What causes low oxygen
Watershed - Lake Model to Support TMDL Determinations for Lake Thunderbird
 Watershed - Lake Model to Support TMDL Determinations for Lake Thunderbird 18 th Annual EPA Region 6 Stormwater Conference Workshop 5: TMDLs and You October 3, 2016 Oklahoma City, OK Lake Thunderbird Watershed-Lake
Turbidity TMDL Allocations
 Turbidity TMDL Allocations wq-iw3-62 Minnesota River Turbidity TMDL 18 reaches 9 on major tributaries 9 on the mainstem The heart of a TMDL study is the pollutant load allocation Formula LA(s) + WLA(s)
Watershed and Water Quality Modeling to Support TMDL Determinations Lake Oologah
 Watershed and Water Quality Modeling to Support TMDL Determinations Lake Oologah 26 th Annual Conference Oklahoma Clean Lakes and Watersheds Association (OCLWA) April 5-6, 2017 Stillwater, Oklahoma Lake
Water Quality Study In the Streams of Flint Creek and Flint River Watersheds For TMDL Development
 Water Quality Study In the Streams of Flint Creek and Flint River Watersheds For TMDL Development Idris Abdi Doctoral Dissertation Presentation Major Advisor: Dr. Teferi Tsegaye April 18, 2005 Alabama
Otter Creek Watershed TMDL Project. Stakeholder Meeting June 6, 2013
 Otter Creek Watershed TMDL Project Stakeholder Meeting June 6, 2013 1 Meeting Purpose Meet with watershed & technical advisory group members and watershed landowners to provide basic Otter Creek TMDL project
Final TMDL Implementation Plan. Prepared for Minnesota Pollution Control Agency
 Wirth Lake Final TMDL Implementation Plan Prepared for Minnesota Pollution Control Agency September 2010 4700 West 77 th Street Minneapolis, MN 55435-4803 Phone: (952) 832-2600 Fax: (952) 832-2601 wq-iw11-03c
Total Maximum Daily Load of Biochemical Oxygen Demand (BOD) for the Western Branch of the Patuxent River. Prepared by:
 for the Western Branch of the Patuxent River. Prepared by:") Total Maximum Daily Load of Biochemical Oxygen Demand (BOD) for the Western Branch of the Patuxent River Prepared by: Maryland Department of the Environment 2500 Broening Highway Baltimore, MD 21224 Submitted
Total Maximum Daily Load of Biochemical Oxygen Demand (BOD) for the Western Branch of the Patuxent River Prepared by: Maryland Department of the Environment 2500 Broening Highway Baltimore, MD 21224 Submitted
Prepared by: Maryland Department of the Environment Broening Highway Baltimore, MD Submitted to:
 Total Maximum Daily Loads of Carbonaceous Biochemical Oxygen Demand (CBOD) and Nitrogenous Biochemical Oxygen Demand (NBOD) for the Little Youghiogheny River Prepared by: Maryland Department of the Environment
Little Cypress Bayou Special Study - Subwatershed 1.10
 - Subwatershed 1.1 Sabine River Authority of Texas August 31, 21 Prepared in Cooperation with the Texas Natural Resource Conservation Commission Under the Authorization of the Texas Clean Rivers Act Table
What is a TMDL? MWEA NPDES Permit Compliance Seminar. December 2, 2009
 What is a TMDL? Total Maximum Daily Load is an estimate of the maximum amount of a pollutant that a water body can receive and still meet water quality standards, and an allocation of that amount to the
Appendix D Monitoring Program
 Appendix D Monitoring Program [This page left intentionally blank.] Shingle Creek and West Mississippi Watershed Management Commissions Third Generation Watershed Management Plan Monitoring Program Minnesota
Salt Lake County Watershed Water Quality Model
 Salt Lake County Watershed Water Quality Model Watershed Symposium August 5, 2010 Presenters: Nicholas von Stackelberg Bryan Close Slide 1 Presentation Overview Background and Model Objectives (Nick) Model
Water Quality Analysis of Eutrophication. Youghiogheny River Main Stem (Maryland Portion) Prepared by:
 Prepared by:") Water Quality Analysis of Eutrophication Youghiogheny River Main Stem (Maryland Portion) Prepared by: Maryland Department of the Environment 2500 Broening Highway Baltimore, MD 21224 Submitted to: Watershed
Water Quality Analysis of Eutrophication Youghiogheny River Main Stem (Maryland Portion) Prepared by: Maryland Department of the Environment 2500 Broening Highway Baltimore, MD 21224 Submitted to: Watershed
Jordan River Watershed Council. Salt Lake County; Public Works Department Engineering Division Water Resources Planning and Restoration Program
 Jordan River Watershed Council Salt Lake County; Public Works Department Engineering Division Water Resources Planning and Restoration Program OUTLINE Background Information Jordan River Watershed Council
Draft Wasteload Allocation Report Town of Haworth
 Draft Wasteload Allocation Report Town of Haworth Contents 1. Problem Definition... 1 2. Endpoint Identification... 1 3. Source Analysis... 2 3.1. Point Sources... 2 3.2. Non-Point Sources... 2 3.3. Background...
Wanaque Reservoir TMDL and Cumulative WLAs/LA for the Passaic River Watershed
 Wanaque Reservoir TMDL and Cumulative WLAs/LA for the Passaic River Watershed Presented by NJ Department of Environmental Protection Division of Watershed Management Marco Al-Ebus August 4, 2005 The Problem
Evaluation of Water Quality in. Sylvia Heaton Water Bureau, MDNRE
 Evaluation of Water Quality in Ford and Belleville Lakes Sylvia Heaton Water Bureau, MDNRE Objectives of 2010 TMDL Reevaluation Evaluate nutrient (total phosphorus) levels in Ford and Belleville Lakes
Environmental Services
 215 Environmental Services River Water Quality Summary for the Twin Cities Metropolitan Area In 215, Metropolitan Council Environmental Services (MCES) river monitoring was conducted at six automated and
Protecting Utah s Water Resources. Nutrient Issues
 Protecting Utah s Water Resources Nutrient Issues Nutrient Issues Questions What are they? Why are they important? Nationally Locally What are the impact on my community Costs Timing What are Nutrients?
Lake of the Woods TMDL: Update and Next Steps November 21, 2017
 Lake of the Woods TMDL: Update and Next Steps November 21, 2017 Outline Where we ve been (2016) HSPF Bathtub Internal loading estimation Progress in 2017 Development of TMDL load allocation table Next
Draft Wasteload Allocation Report For Logan County Rural Water District #1
 Draft Wasteload Allocation Report For Logan County Rural Water District #1 Contents 1. Problem Definition... 1 2. Endpoint Identification... 1 3. Source Analysis... 2 3.1. Point Sources... 2 3.2. Non-Point
Comments from 4/12 - Draft Responses
 Comments from 4/12 - Draft Responses Introduction The following document covers the proposed path forward and responds to questions and comments from the April 12, 2017, Stakeholder Meeting. Please review
FINAL TURBIDITY TOTAL MAXIMUM DAILY LOADS FOR SALT CREEK AREA, OKLAHOMA OKLAHOMA DEPARTMENT OF ENVIRONMENTAL QUALITY
 FINAL TURBIDITY TOTAL MAXIMUM DAILY LOADS FOR SALT CREEK AREA, OKLAHOMA OKLAHOMA DEPARTMENT OF ENVIRONMENTAL QUALITY APRIL 2010 FINAL TURBIDITY TOTAL MAXIMUM DAILY LOADS FOR SALT CREEK AREA, OKLAHOMA OKWBID
Technical Tasks to Support Revision of the TMDL 1) Update lake models to account for slow decay rate for phosphorus (Anderson) 2) Update Lake
 Update lake models to account for slow decay rate for phosphorus (Anderson) 2) Update Lake") Technical Tasks to Support Revision of the TMDL 1) Update lake models to account for slow decay rate for phosphorus (Anderson) 2) Update Lake Elsinore model to include interaction between zooplankton and
Technical Tasks to Support Revision of the TMDL 1) Update lake models to account for slow decay rate for phosphorus (Anderson) 2) Update Lake Elsinore model to include interaction between zooplankton and
Draft Wasteload Allocation Report For McCurtain County Rural Water District #5
 Draft Wasteload Allocation Report For McCurtain County Rural Water District #5 Contents 1. Problem Definition... 1 2. Endpoint Identification... 1 3. Source Analysis... 2 3.1. Point Sources... 2 3.2. Non-Point
PREDICTED EFFECTS OF EXTERNAL LOAD REDUCTIONS AND IN-LAKE TREATMENT ON WATER QUALITY IN CANYON LAKE A SUPPLEMENTAL SIMULATION STUDY
 PREDICTED EFFECTS OF EXTERNAL LOAD REDUCTIONS AND IN-LAKE TREATMENT ON WATER QUALITY IN CANYON LAKE A SUPPLEMENTAL SIMULATION STUDY FINAL REPORT Submitted to: Lake Elsinore-San Jacinto Watershed Authority
Decision Rationale. Total Maximum Daily Load for Phosphorus for the Sassafras River, Cecil and Kent Counties, Maryland 4/1/2002
 Decision Rationale I. Introduction Total Maximum Daily Load for Phosphorus for the Sassafras River, Cecil and Kent Counties, Maryland 4/1/2002 The Clean Water Act (CWA) requires a Total Maximum Daily Load
TMDLs FOR CHLORIDE, SULFATE, TDS, AND AMMONIA IN THE ELCC TRIBUTARY, ARKANSAS. (Reach )
") TMDLs FOR CHLORIDE, SULFATE, TDS, AND AMMONIA IN THE ELCC TRIBUTARY, ARKANSAS (Reach 08040201-606) October 3, 2002 TMDLs FOR CHLORIDE, SULFATE, TDS, AND AMMONIA IN THE ELCC TRIBUTARY, ARKANSAS (Reach 08040201-606)
TMDLs FOR CHLORIDE, SULFATE, TDS, AND AMMONIA IN THE ELCC TRIBUTARY, ARKANSAS (Reach 08040201-606) October 3, 2002 TMDLs FOR CHLORIDE, SULFATE, TDS, AND AMMONIA IN THE ELCC TRIBUTARY, ARKANSAS (Reach 08040201-606)
The Myakka River. Presented to the Myakka River Management Coordinating Council January 9, 2009
 The Myakka River Presented to the Myakka River Management Coordinating Council January 9, 2009 Kathryn L. Meaux Environmental Specialist III Sarasota County Integrated Water Resources Historical Monitoring
Salinity TMDL Development and Modeling in the Otter Creek Watershed. Erik Makus DEQ Hydrologist June 6, 2013
 Salinity TMDL Development and Modeling in the Otter Creek Watershed 1 Erik Makus DEQ Hydrologist June 6, 2013 Outline for Today: Otter Creek and the Tongue River Previous salinity modeling efforts Existing
Water Quality Assessment in the Thames River Watershed
 Water Quality Assessment in the Thames River Watershed Nutrient Trends Karen Maaskant, Upper Thames River Conservation Authority 2015 Lake St. Clair Conference October 21, 2015 Outline Thames River watershed,
Decentralized Wastewater Treatment in Texas Watersheds
 Decentralized Wastewater Treatment in Texas Watersheds Bruce Lesikar Texas A&M University System Overview Surface water resources Water Quality Standards Watershed Management Programs Identifying Sources
The Total Maximum Daily Load (TMDL) Program in Illinois. Watershed Management Section Bureau of Water
 Program in Illinois. Watershed Management Section Bureau of Water") The Total Maximum Daily Load (TMDL) Program in Illinois Watershed Management Section Bureau of Water Illinois EPA TMDL Program Illinois Integrated Water Quality Report What is a TMDL The TMDL Process 11/10/2014
The Total Maximum Daily Load (TMDL) Program in Illinois Watershed Management Section Bureau of Water Illinois EPA TMDL Program Illinois Integrated Water Quality Report What is a TMDL The TMDL Process 11/10/2014
North Dakota s Nutrient Reduction Strategy. Presented to the 2016 ND Water Quality Monitoring Conference March 4, 2016
 North Dakota s Nutrient Reduction Strategy Presented to the 2016 ND Water Quality Monitoring Conference March 4, 2016 Nutrients Nutrients, in appropriate amounts, are essential to the growth and health
Prepared by: Maryland Department of the Environment 2500 Broening Highway Baltimore, MD Submitted to:
 Total Maximum Daily Loads of Nitrogen, Phosphorus and Biochemical Oxygen Demand for the Lower Wicomico River Wicomico County and Somerset County, Maryland Prepared by: Maryland Department of the Environment
When Things Heat Up. To relate the physical and chemical properties of water to a water pollution issue.
 Purpose: Summary: To relate the physical and chemical properties of water to a water pollution issue. In this exercise, students will measure the temperature and dissolved oxygen of a stream (or use their
Environmental Services
 Environmental Services 14 River Water Quality Summary for the Twin Cities Metropolitan Area This document is a summary of the 14 water quality of major rivers in the Twin Cities metropolitan area (metro
Pennsylvania s TMDL Program
 Pennsylvania s TMDL Program Restoring water quality (June 2003) What is a TMDL? A Total Maximum Daily Load (TMDL) is the amount of pollutant loading that a waterbody can assimilate and meet our water quality
Establishing Environmental Flows for California Streams. Eric Stein Southern California Coastal Water Research Project
 Establishing Environmental Flows for California Streams Eric Stein Southern California Coastal Water Research Project What Do We Know About the Status of Flows Statewide? First comprehensive study recently
Selena Medrano Water Quality Management Planning
 Selena Medrano Water Quality Management Planning Management Services Legal Fiscal Computer Public Outreach and Education Hazardous Waste Solid Waste Technical Services Mining Air Water Clean Water Act
Update on Water Quality Models. TMDL Review Process
 Update on Water Quality s for the Truckee River WQS and TMDL Review Process presented to the Northern Nevada Water Planning Commission (NNWPC) November 2, 2011 Laura Weintraub 1 Overview Water Quality
Long-Term Volunteer Lake Monitoring in the Upper Woonasquatucket Watershed
 Long-Term Volunteer Lake Monitoring in the Upper Woonasquatucket Watershed Linda Green URI Watershed Watch 1-87-95, lgreen@uri.edu WATER QUALITY IS A REFLECTION OF THE ACTIVITIES IN THE LANDS AND WATERS
Rainbow Creek TMDL Monitoring Program Report for October 2016 through September 2017
 Rainbow Creek TMDL Monitoring Program Report for October 2016 through September 2017 Introduction The Rainbow Creek monitoring program has been developed to provide water quality data in support of the
Watershed, Hydrodynamic, Water Quality and Sediment Flux Modeling to Support TMDL Determinations, Lake Thunderbird
 Watershed, Hydrodynamic, Water Quality and Sediment Flux Modeling to Support TMDL Determinations, Lake Thunderbird 24 th Annual Conference Oklahoma Clean Lakes and Watersheds Association (OCLWA) April
Source Water Protection Challenges in the Alafia River Watershed - Tampa, FL
 Source Water Protection Challenges in the Alafia River Watershed - Tampa, FL Doug Robison ESA Bob McConnell Tampa Bay Water AMERICAN WATER RESOURCES ASSOCIATION 2014 Annual Conference November 4, 2014,
Clean Water Act Basics: An Overview of Core Programs. Merritt Frey Habitat Program Director River Network
 Clean Water Act Basics: An Overview of Core Programs Merritt Frey Habitat Program Director 801-486-1224 mfrey@rivernetwork.org AGENDA Introduction History of Act Goals of Act Act & Jordan Resources Why
Numeric Nutrient Criteria Update
 Numeric Nutrient Criteria Update Kevin Carter South Florida Water Management District Office Of Everglades Policy and Coordination 561-682-6949, kecarter@sfwmd.gov Palm Beach County Water Resources Task
SURFACE WATER WITHDRAWALS & LOW FLOW PROTECTION POLICY MICHAEL COLLEGE, P.E. SUSQUEHANNA RIVER BASIN COMMISSION
 SURFACE WATER WITHDRAWALS & LOW FLOW PROTECTION POLICY MICHAEL COLLEGE, P.E. SUSQUEHANNA RIVER BASIN COMMISSION SCENARIOS Direct withdrawal from surface water (SW): PA MOU w/padep NY MOU w/nysdec MD No
Sandies Creek Watershed
 SH 97 Sandies Creek Watershed Gonzales De Witt FM 1116 Sandies Creek SH 72 FM 240 FM 466 Sandies Creek Karnes Smiley Elm Creek FM 108 US 87 SH 80 FM 1117 Guadalupe FM 1681 Wilson Nixon 13657 1803B 1803B
Sustaining Colorado s Watersheds: Making the Water Quality Connections October 2-4, 2007
 Sustaining Colorado s Watersheds: Making the Water Quality Connections October 2-4, 2007 Barr Lake and Milton Reservoir Watershed Management Plan ~ Brief History of the Reservoirs ~ Overview of the BMW
City of Albany, Oregon. Willamette Basin TMDL Implementation Plan
 City of Albany, Oregon Willamette Basin TMDL Implementation Plan July 1, 2013 - June 30, 2018 TABLE OF CONTENTS BACKGROUND... 1 LOCATION IN THE WATERSHED... 1 SCOPE AND SUMMARY OF TMDL IMPLEMENTATION PLAN...
Modeling the Middle and Lower Cape Fear River using the Soil and Water Assessment Tool Sam Sarkar Civil Engineer
 Modeling the Middle and Lower Cape Fear River using the Soil and Water Assessment Tool Sam Sarkar Civil Engineer Outline Problem statement and project objectives Watershed model development Model calibration
BLACK & VEATCH CORPORATION NISP EIS SUPPORT. Carl Brouwer, Northern Colorado Water Conservancy District
 NISP EIS SUPPORT To: Carl Brouwer, Northern Colorado Water Conservancy District From: Mark Maxwell, Black & Veatch Corporation Reviewed by: Klint Reedy, Black & Veatch Corporation Subject: Wastewater Treatment
Lake Pepin Photo by Guy Schmickle
 Options for Meeting Water Quality Standards Lake Pepin Technical Conference September 23, 28 Lake Pepin Photo by Guy Schmickle Overview Role of modeling in the TMDL Main features of UMR-LP Model Reductions
FOCUSING ON WHAT S IMPORTANT: PRIORITIZING AND IMPLEMENTING TMDLS. Carl Adams, Utah Division of Water Quality
 FOCUSING ON WHAT S IMPORTANT: PRIORITIZING AND IMPLEMENTING TMDLS Carl Adams, Utah Division of Water Quality 303(d) List Assessment of Water Quality Report on Condition TMDL To-Do List Restoration Goals
Goal of the 1972 Clean Water Act
 Goal of the 1972 Clean Water Act Clean Water Act provides framework to protect and restore water quality Recreation Aquatic Consumption Beneficial uses TMDLs and the How many pollutants before a water
Assessment Decision Report Indian Creek
 Assessment Decision Report Indian Creek Assessment Unit ID: AL06030002-0501-110 (CBOD, NBOD) Alabama Department of Environmental Management Water Quality Branch Water Division December 2017 Prepared by
2012 Nutrient Regulations Update
 2012 Nutrient Regulations Update OWEA Government Affairs Workshop March 1, 2012 Guy Jamesson, PE, BCEE Malcolm Pirnie, The Water Division of ARCADIS Imagine the result Agenda Nutrient impacts Nutrient
The Total Maximum Daily Load (TMDL) Program in Illinois. Trevor Sample Planning Unit Watershed Management Section Bureau of Water
 Program in Illinois. Trevor Sample Planning Unit Watershed Management Section Bureau of Water") The Total Maximum Daily Load (TMDL) Program in Illinois Trevor Sample Planning Unit Watershed Management Section Bureau of Water Illinois EPA TMDL Program What is a TMDL The TMDL Process in Illinois 3
The Total Maximum Daily Load (TMDL) Program in Illinois Trevor Sample Planning Unit Watershed Management Section Bureau of Water Illinois EPA TMDL Program What is a TMDL The TMDL Process in Illinois 3
Dissolved Oxygen and Nutrient TMDLs for Little Gully Creek (WBID 1039)
") FLORIDA DEPARTMENT OF ENVIRONMENTAL PROTECTION Division of Environmental Assessment and Restoration, Bureau of Watershed Restoration NORTHWEST DISTRICT APALACHICOLA BASIN Final TMDL Report Dissolved Oxygen
FLORIDA DEPARTMENT OF ENVIRONMENTAL PROTECTION Division of Environmental Assessment and Restoration, Bureau of Watershed Restoration NORTHWEST DISTRICT APALACHICOLA BASIN Final TMDL Report Dissolved Oxygen
Background. Oso Watershed Land Uses
 Monitoring and Modeling of the Oso Creek and Oso Bay Watershed, Texas for a Bacteria TMDL Background Oso Creek and Oso Bay were identified as impaired segments in the 24 Texas Water Quality Inventory and
Other Considerations & Review Building a Successful Monitoring Plan
 Other Considerations & Review Building a Successful Monitoring Plan Fundamentals of Developing a Water Quality Monitoring Plan Thursday, July 28, 2016 Larry Hauck hauck@tiaer.tarleton.edu Mention of trade
Fountain Creek Watershed Water Quality Overview. Fountain Creek Watershed Citizen Advisory Committee June 12, 2015
 Fountain Creek Watershed Water Quality Overview Fountain Creek Watershed Citizen Advisory Committee June 12, 2015 Outline Fountain Creek Watershed Strategic Plan - 2009 Regulatory standards and classifications
FINAL TURBIDITY TOTAL MAXIMUM DAILY LOADS FOR SULPHUR CREEK, OKLAHOMA (OK _00)
") FINAL TURBIDITY TOTAL MAXIMUM DAILY LOADS FOR SULPHUR CREEK, OKLAHOMA (OK410600010030_00) Prepared for: OKLAHOMA DEPARTMENT OF ENVIRONMENTAL QUALITY Prepared by: AUGUST 2010 FINAL TURBIDITY TOTAL MAXIMUM
FINAL TURBIDITY TOTAL MAXIMUM DAILY LOADS FOR SULPHUR CREEK, OKLAHOMA (OK410600010030_00) Prepared for: OKLAHOMA DEPARTMENT OF ENVIRONMENTAL QUALITY Prepared by: AUGUST 2010 FINAL TURBIDITY TOTAL MAXIMUM
Phosphorus Goal Setting Process Questions and Answers 2010
 Lake Winnipesaukee Watershed Management Plan Phase I: Meredith, Paugus, Saunders Bays 1. What is phosphorus? Phosphorus (P) is a naturally occurring element and a major nutrient required for biological
Bacteria Study on the Tres Palacios River
 Bacteria Study on the Tres Palacios River Prepared by David Bass and Alicia Reinmund Lower Colorado River Authority Austin, Texas December 1999 For The Texas Clean Rivers Program Texas Natural Resource
TMDL 101. Andrea M. Fredenburg Kentucky Division of Water TMDL Section November 15, 2011
 TMDL 101 Andrea M. Fredenburg Kentucky Division of Water TMDL Section November 15, 2011 What do TMDLs have to do with icebergs? Agenda Provide information about the TMDL program and why TMDLs are required
City of Fairmont Storm Water Pollution Prevention Plan (SWPPP) January 23, 2017
 January 23, 2017") City of Fairmont Storm Water Pollution Prevention Plan (SWPPP) January 23, 2017 Why is Water Quality Important? Water has always been important to Minnesota and is a key part of our history, culture, economy
City of Fairmont Storm Water Pollution Prevention Plan (SWPPP) January 23, 2017 Why is Water Quality Important? Water has always been important to Minnesota and is a key part of our history, culture, economy
2006 Aliceville Reservoir Report. Rivers and Reservoirs Monitoring Program
 2006 Aliceville Reservoir Report Rivers and Reservoirs Monitoring Program Field Operations Division Environmental Indicators Section Aquatic Assessment Unit May 2011 Rivers and Reservoirs Monitoring Program
Grants Pass Water Quality Monitoring
 Grants Pass Water Quality Monitoring 2003-2005 Rogue Valley Council of Governments April 2005 Rogue Valley Council of Governments Natural Resources Department 155 North First Street Central Point, Oregon
FINAL 2012 BACTERIA AND TURBIDITY TOTAL MAXIMUM DAILY LOADS FOR THE RED RIVER, OKLAHOMA (OK311100, OK311200, OK311210, OK311510, OK311600, OK311800)
") FINAL 2012 BACTERIA AND TURBIDITY TOTAL MAXIMUM DAILY LOADS FOR THE RED RIVER, OKLAHOMA (OK311100, OK311200, OK311210, OK311510, OK311600, OK311800) Prepared for: OKLAHOMA DEPARTMENT OF ENVIRONMENTAL QUALITY
FINAL 2012 BACTERIA AND TURBIDITY TOTAL MAXIMUM DAILY LOADS FOR THE RED RIVER, OKLAHOMA (OK311100, OK311200, OK311210, OK311510, OK311600, OK311800) Prepared for: OKLAHOMA DEPARTMENT OF ENVIRONMENTAL QUALITY
TOTAL MAXIMUM DAILY LOAD (TMDL)
") TOTAL MAXIMUM DAILY LOAD (TMDL) For Nutrients In Black Point Channel (WBID 1637) Prepared by: US EPA Region 4 61 Forsyth Street SW Atlanta, Georgia 30303 September 2009 TABLE OF CONTENTS 1.0 INTRODUCTION...
TOTAL MAXIMUM DAILY LOAD (TMDL) For Nutrients In Black Point Channel (WBID 1637) Prepared by: US EPA Region 4 61 Forsyth Street SW Atlanta, Georgia 30303 September 2009 TABLE OF CONTENTS 1.0 INTRODUCTION...
MARYLAND TRADING and OFFSET POLICY and GUIDANCE MANUAL CHESAPEAKE BAY WATERSHED
 MARYLAND TRADING and OFFSET POLICY and GUIDANCE MANUAL CHESAPEAKE BAY WATERSHED Marya Levelev Maryland Department of the Environment May 17, 2017 1 Overview of Presentation Background 2017 Trading Manual
Non-Tidal Passaic River Basin Water Quality Trading Project
 Non-Tidal Passaic River Basin Water Quality Trading Project A Collaboration of Rutgers and Cornell Universities USEPA Targeted Watershed Grant Program Upper Passaic River Great Falls Great Swamp Wanaque
Final Total Maximum Daily Load Allegheny River, Allegheny County PCBs
 Final Total Maximum Daily Load Allegheny River, Allegheny County PCBs Lock and Dam 3 to mouth March 1, 1999 Revised March 12, 1999 Table of Contents Introduction Background TMDL Development TMDL Implementation
The City of Cocoa (City) is located in east
 is located in east") FWRJ Reclaimed Water and Stormwater: A Perfect Pair to Meet Total Maximum Daily Load Wasteload Allocations? Danielle Honour, James Wittig, John A. Walsh, and Don Stevens Danielle Honour, P.E., D.WRE, and
FWRJ Reclaimed Water and Stormwater: A Perfect Pair to Meet Total Maximum Daily Load Wasteload Allocations? Danielle Honour, James Wittig, John A. Walsh, and Don Stevens Danielle Honour, P.E., D.WRE, and
Middle Huron Stormwater Plan for Addressing Total Maximum Daily Loads (TMDLs)
") Middle Huron Stormwater Plan for Addressing Total Maximum Daily Loads (TMDLs) The following plan was developed by the Middle Huron Watershed Stormwater Advisory Group (SAG) a collaboration between communities
Middle Huron Stormwater Plan for Addressing Total Maximum Daily Loads (TMDLs) The following plan was developed by the Middle Huron Watershed Stormwater Advisory Group (SAG) a collaboration between communities
TMDL Development. For Turkey Creek HUC 11 Watersheds. Final Report
 TMDL Development For Turkey Creek HUC 11 Watersheds Final Report Developed By Oklahoma Department of Environmental Quality September 19, 2006 TABLE OF CONTENT 1. BACKGROUND... 1 2. PROBLEM STATEMENT...
FINAL TURBIDTY TOTAL MAXIMUM DAILY LOADS FOR THE LOWER CIMARRON RIVER-SKELETON CREEK AREA (OK620910)
") FINAL TURBIDTY TOTAL MAXIMUM DAILY LOADS FOR THE LOWER CIMARRON RIVER-SKELETON CREEK AREA (OK620910) Prepared by: OKLAHOMA DEPARTMENT OF ENVIRONMENTAL QUALITY APRIL 2010 FINAL TURBIDTY TOTAL MAXIMUM DAILY
FINAL TURBIDTY TOTAL MAXIMUM DAILY LOADS FOR THE LOWER CIMARRON RIVER-SKELETON CREEK AREA (OK620910) Prepared by: OKLAHOMA DEPARTMENT OF ENVIRONMENTAL QUALITY APRIL 2010 FINAL TURBIDTY TOTAL MAXIMUM DAILY
FINAL BACTERIA TOTAL MAXIMUM DAILY LOADS FOR THE UPPER RED RIVER AREA, OKLAHOMA (OK311500, OK311510, OK311600, OK311800)
") FINAL BACTERIA TOTAL MAXIMUM DAILY LOADS FOR THE UPPER RED RIVER AREA, OKLAHOMA (OK311500, OK311510, OK311600, OK311800) Prepared for: OKLAHOMA DEPARTMENT OF ENVIRONMENTAL QUALITY Prepared by: PARSONS
FINAL BACTERIA TOTAL MAXIMUM DAILY LOADS FOR THE UPPER RED RIVER AREA, OKLAHOMA (OK311500, OK311510, OK311600, OK311800) Prepared for: OKLAHOMA DEPARTMENT OF ENVIRONMENTAL QUALITY Prepared by: PARSONS
Issues in Developing the San Joaquin River, CA DO TMDL: Balancing Point and Non-Point Oxygen Demand/Nutrient Control
 Issues in Developing the San Joaquin River, CA DO TMDL: Balancing Point and Non-Point Oxygen Demand/Nutrient Control G. Fred Lee PhD PE DEE & Anne Jones-Lee PhD G. Fred Lee & Associates El Macero, CA 95618
Utah s (d) List of Impaired Waters
 List of Impaired Waters") Utah s 2004 303(d) List of Impaired Waters Castle Valley Utah Department of Environmental Quality Division of Water Quality Utah s 2004 303(d) List of Waters April 1, 2004 Department of Environmental
Utah s 2004 303(d) List of Impaired Waters Castle Valley Utah Department of Environmental Quality Division of Water Quality Utah s 2004 303(d) List of Waters April 1, 2004 Department of Environmental
E3 Model Scenario Purpose and Definitions
 E3 Model Scenario Purpose and Definitions Gary Shenk (USGS) Jeff Sweeney (EPA) Chesapeake Bay Program Office Water Quality GIT Meeting August 14, 2017 Documentation of E3 and Planning Targets Chesapeake
Lake Pepin. TMDL Basics
 NORTH DAKOTA SOUTH DAKOTA Lake Pepin Basins BASIN Cannon River Basin Minnesota River Basin Minnesota River Basin St. Croix River Basin Upper Mississippi River Basin HUC 07040001 Major Rivers Metro Area
Effluent Treatment Alternatives
 Effluent Treatment Alternatives Harry Daniels Professor and Extension Specialist Department of Biology North Carolina State University Ohla Sydorovych Postdoctoral Research Associate Department of Agricultural
Proposed Addition to ATTACHMENT E, LIST OF TOTAL MAXIMUM DAILY LOADS (TMDLs) APPLICABLE TO INDUSTRIAL STORM WATER DISCHARGERS
 APPLICABLE TO INDUSTRIAL STORM WATER DISCHARGERS") Proposed Addition to ATTACHMENT E, LIST OF TOTAL MAXIMUM DAILY LOADS (TMDLs) APPLICABLE TO INDUSTRIAL STORM WATER DISCHARGERS Oxnard Drain No. 3 Total Maximum Daily Load (TMDL) for Pesticides, PCBs, and
Proposed Addition to ATTACHMENT E, LIST OF TOTAL MAXIMUM DAILY LOADS (TMDLs) APPLICABLE TO INDUSTRIAL STORM WATER DISCHARGERS Oxnard Drain No. 3 Total Maximum Daily Load (TMDL) for Pesticides, PCBs, and
Lake Pepin Photo by Guy Schmickle
 Science Advisory Panel Meeting Lake Pepin Water Quality Modeling Project April 30, 2008 Lake Pepin Photo by Guy Schmickle Overview Modeling status Historical system behavior Model simulation scenarios
Learning from Lake of the Woods
 Learning from Lake of the Woods Internal loading and resuspension in shallow lakes Julie Blackburn, Minnesota Area Manager Julie.Blackburn@respec.com 651-305-5705 Lake of the Woods Aug. 2006 In 2008,
Illinois EPA update to DuPage County Watershed Management Section Bureau of Water
 Illinois EPA update to DuPage County Watershed Management Section Bureau of Water Amy Walkenbach Coordinator, Financial and Technical Assistance Program, Bureau of Water, Illinois EPA Amy.walkenbach@illinois.gov
Boulder Elkhorn TMDL Project. TMDL Document Public Comment Meeting June 27, 2013
 Boulder Elkhorn TMDL Project TMDL Document Public Comment Meeting June 27, 2013 Presentation Outline: What are TMDLs? Boulder Elkhorn TMDL Project Area What s in a TMDL document? Sediment Overview Temperature
Causes and Possible Corrections for Nuisance Algae Conditions in Huron River Lakes: Summary Findings from 2003, 2004, and Prof John T.
 Causes and Possible Corrections for Nuisance Algae Conditions in Huron River Lakes: Summary Findings from 23, 24, and 25 Prof John T. Lehman Middle Huron Partners 8 November 25 Welcome Summary of public
WWOA Annual Conference October 6, John Kennedy. Green Bay Metropolitan Sewerage District Cleaning Water Today For Tomorrow s Generations
 WWOA Annual Conference October 6, 2011 John Kennedy Green Bay Metropolitan Sewerage District Cleaning Water Today For Tomorrow s Generations Lower Green Bay and Fox River Examples of Water Resource Degradation
TMDLS FOR TURBIDITY AND FECAL COLIFORMS FOR L'ANGUILLE RIVER, AR
 TMDLS FOR TURBIDITY AND FECAL COLIFORMS FOR L'ANGUILLE RIVER, AR October 2001 TMDLS FOR TURBIDITYAND FECAL COLIFORMS FOR L'ANGUILLE RIVER, AR Prepared for EPA Region VI Watershed Management Section Dallas,
Jackson Lake Analysis
 Jackson Lake Analysis Lake Zones Lake Zones Limnetic Zone- open water far from shore Light penetrates shallow, allowing photosynthesis Supports phytoplankton (algae, protists, cyanobacteria) which then
Nicholas A. Reckinger. June 11, 2007
 Comparison of Phosphorus Forms at Different Spatial Scales and Assessment of an Area-Weighted P-Index to Multi-Field Watersheds Nicholas A. Reckinger June 11, 2007 Watershed Activities Affect Water Quality
Lower Boise River Implementation Plan Total Phosphorus
 Lower Boise River Implementation Plan Total Phosphorus Final Lower Boise Watershed Council and the Department of Environmental Quality July 2008 Executive Summary The Idaho Department of Environmental