Shale Asset Production Evaluation by Using Pattern Recognition
|
|
|
- Rosalyn Hensley
- 5 years ago
- Views:
Transcription

1 SPE MS Shale Asset Production Evaluation by Using Pattern Recognition S. Esmaili, California Resources Corporation; S. D. Mohaghegh, West Virginia University; A. Kalantari-Dahaghi, California Resources Corporation Copyright 2015, Society of Petroleum Engineers This paper was prepared for presentation at the SPE Western Regional Meeting held in Garden Grove, California, USA, April This paper was selected for presentation by an SPE program committee following review of information contained in an abstract submitted by the author(s). Contents of the paper have not been reviewed by the Society of Petroleum Engineers and are subject to correction by the author(s). The material does not necessarily reflect any position of the Society of Petroleum Engineers, its officers, or members. Electronic reproduction, distribution, or storage of any part of this paper without the written consent of the Society of Petroleum Engineers is prohibited. Permission to reproduce in print is restricted to an abstract of not more than 300 words; illustrations may not be copied. The abstract must contain conspicuous acknowledgment of SPE copyright. Abstract Shale gas as one of the most important source of energy in US requires long-term development plans and reservoir management. Better understanding of the inherent complexities of shale system and identifying the key contributing parameters are essential for optimum operation of such assets. Different assessment techniques such analytical, numerical and statistical analyses have been applied to large multi-variable data set from shale assets with different degrees of success. In this paper, advanced Data-Driven Analytics that incorporates pattern recognition capabilities of Artificial Intelligence, Machine Learning and Data Mining is used to understand and rank the contribution and influence of rock characteristics and design parameters during the production from shale. Advanced Data-Driven Analytics provides much needed insight into hydraulic fracturing practices in Shale. Unlike analytical and numerical techniques that are based on Soft Data, Advanced Data-Driven Analytics incorporates Hard Data. Hard Data refers to field measurements (facts) such as drilling information, well logs (Gamma ray, density, sonic, etc.), hydraulic fracturing fluid type and amount, proppant type, amount and concentration, ISIP, breakdown and closure pressures, and rates, while Soft Data refers to variables that are interpreted, estimated or guessed (and never measured), such as hydraulic fracture half length, height, width and conductivity or the extent of the Stimulated Reservoir Volume (SRV). In this study, a spatio-temporal database including well locations and trajectories, reservoir characteristics, completion, hydraulic fracturing, and production parameters for a large number of horizontal wells in Marcellus Shale is generated. The impact of parameters such as up-dip versus down dip deviation of wells, TOC, porosity, stimulated lateral length and cluster spacing, etc. on production from wells in a shale asset is analyzed and the understandable trends and patterns in the database are identified. The analyses are performed using production from multiple time intervals (i.e. different production indicators) throughout the life of wells. Introduction Since 1998 unconventional natural gas production has increased nearly 65%. This growth has resulted in unconventional production becoming an increasingly larger portion of total natural gas production in the United States, increasing from 23% in 2010 to 49% of total dry gas production in 2035[U.S. EIA, 2012]. The development of shale gas production was prompted by technological advances particular concerning
2 2 SPE MS horizontal drilling and hydraulic fracturing. While these practices have led to the economical productions of natural gases in numerous shale gas reservoirs, the problem of understanding shale gas production has been much involved due to the complicated and unpredicted response of these reservoirs to fluid and proppant injection. Besides, each of the shale gas properties such as thickness of the productive layer and geomechanical properties of rock vary substantially within the same producing area and this variability of shale gas properties greatly influences the well performance. Understanding the performance of such ultra-low permeable media creates new challenges to scientists. Investigating the impact of rock properties and evaluating the effect of hydraulic fracturing process on well performance are the primary issues that have been addressed in several studies. Despite of extensive data acquisition during the field development in most shale reservoirs, there are still so many questions that are not answered; what is the best/optimized stimulation approach, what is the optimum well/hydraulic fractures/cluster spacing, is there any correlation between the reservoir characteristics and well behavior, and etc. Given the complex nature of hydraulic-fracture growth and the very low permeability of the matrix rock in many shale gas reservoirs, in combination with the predominance of horizontal completions, reservoir simulation is commonly the preferred method to predict and evaluate well performance (Cipolla, 2010). But dealing with a reservoir with more than hundreds of wells makes this process inefficient especially when it comes to short-term reservoir management decision making step. Discovering trends in data is a quest that has been followed by many scientists and engineers. Using Conventional statistical analysis such as cross-plots and regression to understand the complex behavior of shale plays mostly may not be a good approach due to their inherent nonlinear behavior. Pattern recognition is a tool for finding patterns among non-linear and interdependent parameters involve in the shale gas development process and it have proven to be capable of extracting useful information from large data sets and are extensively used in many industries. Given all the facts about the complexity of shale gas reservoirs one should not expect linear and intuitive behavior from such an unconventional system and consequently the use of conventional statistics in order to understand it and to make decisions is not a realistic task. Alternatively this study takes advantage of applying advanced pattern recognition tools in order to generate relevant and reasonable trends between parameters such as the impact of up-dip versus down dip deviation of wells, stimulated lateral length and cluster spacing on gas production in multiple time intervals throughout the life of wells. The study focuses on large number of horizontal wells in Marcellus shale including located on multiple pads with different landing targets, well length and reservoir properties. Methodology We have examined the application of conventional as well as new pattern recognition technologies to a data set from a Marcellus asset. During the conventional analyses, we used Cartesian, semi-log, log-log plots for all parameters versus some production indicators. Furthermore, normalized production indicators (production per foot of net thickness or production per foot of completed interval) are examined for different portions of the field. The results will show that production from shale is too complex to be meaningfully analyzed using these conventional statistical analyses. To address these complexities Advanced Data Mining technology is used to see if it can discover any hidden but potentially useful pattern in the existing data. The Advanced Data Mining technology being used here is called Fuzzy Pattern Recognition, since it is based on Fuzzy Set Theory (Mohaghegh 2000). Pattern Recognition is a branch of artificial intelligence concerned with classification or description of observations. Pattern Recognition aims to classify data (patterns) based on either a priori knowledge or on statistical information extracted from the pattern. The patterns to be classified are usually groups of measurements or observations, defining points in an appropriate multidimensional space. When fuzzy set theory is used to determine the appropriate multidimensional space that would provide optimum separa-
3 SPE MS 3 tion of overlapping classes, the result is known as Fuzzy Pattern Recognition. When Fuzzy Pattern Recognition is applied to a limited number of classes of wells (Such as Poor, Average and Good wells) the process is called the Step Analysis 1 or Well Quality Analysis (WQA). When a similar analysis is performed while every single well in the dataset is treated as a potential unique well quality 2 the result is a continuous curve (rather than a discrete set of steps), called a Fuzzy Trend Analysis (FTA). The objective of these Fuzzy Pattern Recognition analyses is to discover hidden but potentially useful patterns and trends in the data set that cannot be readily inferred from the conventional statistical analyses. Furthermore, we demonstrate the superiority of this technology to similar grouping and plotting of the data that is currently being used in many data mining analyses. In this article these two sets of Fuzzy Pattern Recognition analyses, namely Well Quality Analysis (WQA), and Fuzzy Trend Analysis (FTA) are applied to a dataset that includes more than 120 wells in Marcellus shale. Conventional Statistical Analysis Because of the well-known complexity of fluid flow in shale, expecting the linear and intuitive behavior from this kind of reservoir by performing the conventional statistical analysis might be challenging. In this section, we show the complexity of system by displaying the lack of any apparent correlation or pattern between a few parameters and the best three months production from the wells. Figure 1 and Figure 2 are demonstrating such analysis for Porosity and Total Injected Slurry, where the plots were made in Cartesian, Semi-log, Log-Log and histogram. As can be observed no trend or patterns can be found in this plots while it is obvious that the higher porosity for example results in better production performance, which cannot be realized by conventional statistical analysis. Figure 1 Correlation between Matrix Porosity (%) with the Best 3 Months of Rich Gas Production 1 The name reflects the shape of the resulted graphs that are in the form of ascending or descending steps. 2 Multiple wells with similar production indicator will be classified similarly.
4 4 SPE MS Figure 2 Correlation between Total Injected Slurry (bbl) with the Best 3 Months of Rich Gas Production Additionally, the best 3 and 24 months of production per stimulated lateral length (ft) and per total slurry/total proppant for different BTU areas and also for different horizontal lateral deviations are plotted versus thickness-porosity (ft-%) to see if there is any trend that can be identified using conventional statistical approaches. As shown in Figure 3 and Figure 4, even though the data are clustered based on different BTU areas and deviation types still a clear trend cannot be observed using conventional statistical technique for short and long-term production.
5 SPE MS 5 Figure 3 The Best 3 Months Rich Gas Production per Stimulated LL and Per Total Slurry Volume/Total Proppant for different BTU Area & Deviation Type Figure 4 The Best 24 Months Rich Gas Production per Stimulated LL and Per Total Slurry Volume/Total Proppant for different BTU Area & Deviation Type

6 6 SPE MS Fuzzy Pattern Recognition Analyses Once the conventional statistical analysis proved to be limited in application to this complex dataset, the Fuzzy Pattern Recognition was used in order to analyze the data. As mentioned earlier, the tasks involved in this study are Step Analysis or Well Quality Analysis and Fuzzy Trend Analysis. In all Step Analysis or Well Quality Analyses, three different well qualities (Poor, Average and Good) were defined based on the production indicators which are the best 3 months of production and the best 24 months of production. As shown in Figure 5, there are several regions that wells with different qualities overlap and because of this definition, some of the wells have membership in more than one class of wells. These class memberships are referred to as fuzzy membership function and it is a very unique feature of this technology. Figure 5 Fuzzy Clustering Plots and Values for the Best 3 Months (Right) and 24 Months (Left) In Fuzzy Trend Analysis, on the other hand, the integrated fuzzy pattern recognition was used in order to deduce understandable trends form seemingly chaotic behavior. The result of such analysis is the continuous curves rather than a discrete set of steps. Result and Discussion This study focuses on a part of Marcellus shale including large number of horizontal wells, which have different duration of production history. In order to perform the analysis, two datasets were prepared; the first one includes the wells with 3 months of production history and the later includes the wells up to 24 months of production history. The impact of native and design parameters on the best 3 months and 24 months of rich gas production for each well were evaluated. By definition, the native parameters are those inherent reservoir characteristics and the design parameters refer to field measurements that are usually measured during the operation such as injected fluid amount, injection pressure, rate etc. The results of FTA and WQA for five native parameters of Matrix Porosity, Net Thickness, BTU Area, Young s Modulus and Minimum Horizontal Stress Gradient and five design parameters including deviation type, total number of clusters, injected slurry volume, injected proppant per stage and inside distance between the laterals in the same pad will be discussed in details. Matrix Porosity- Because of relatively high porosity and low TOC, the Marcellus shale is a system dominated by matrix porosity and free gas and therefore porosity plays an important role in production. As it is obvious from the Figure 6 and Figure 7, higher matrix porosity results in the better production

 in Cartesian scale for reference.")
7 SPE MS 7 performance in both early and late time of well life although the trend in late time is not as sharp as the trend in early time. This is because of producing the free gas existing in the fracture and inorganic pores in first months, which makes the effect of matrix porosity more significant at the beginning of production. Figure 6 Matrix Porosity Behavior for Time Interval of 3 Months and 24 Months (Left to Right)-FTA Results Figure 7 Matrix Porosity for Different Well Clusters in 3 and 24 Months (Left to Right)-WQA Results In Figure 6, the actual data is plotted (grey dots corresponding to the y-axis in the right hand side) in Cartesian scale for reference. The red dots-line curve represents FPR, which illustrate the changes in dimensionless normalized rich gas behavior for the first three months of production for different matrix porosity values. In Figure 7, the y-axis shows the average of parameter (e.g. porosity) for each category of the wells and also for all data based on the WQA. Thickness of Pay Zone- Marcellus shale is extremely variable in thickness, ranging from a few feet to more than 250 feet in thickness, and generally becomes thicker to the east. The range of net thickness in the area of this study is 90 to 170 feet. Due to different well trajectory (deviation type), landing targets and completed stages, the pay zone is fully or partially accessible therefore this is another important factor in production performance of the wells. Figure 8 shows the clear increasing trend of rich gas production for higher thickness based on FTA. The same trend can be observed in Figure 9 from the poor to good wells with thicker net pay.
-WQA Results Young s Modulus- Young s modulus is one of the critical elastic attributes for shale gas reservoir characterization which indicate the resistance of rock to elastic")
8 8 SPE MS Figure 8 Thickness of pay Zone for Time Interval of 3 Months and 24 Months (Left to Right)-FTA Results Figure 9 Thickness of Pay Zone for Different Well Clusters in 3 and 24 Months (Left to Right)-WQA Results Young s Modulus- Young s modulus is one of the critical elastic attributes for shale gas reservoir characterization which indicate the resistance of rock to elastic deformation under pressure, i.e. the less young s modulus, the more flexible the rock could be. Marcellus shale is amidst those shale reservoirs with lower Young s modulus (E psi) and therefore the higher closure stress in fracture network could significantly reduce the production. Although the impact of increasing closure stress on network fractures can be severe for lower-modulus rock, the effects may not be evident during the initial 1-2 years of production (Cipolla, 2010). On the other hand, as stated by Economides a large young s modulus makes it harder for the fracturing fluid to produce width. This will make the fracture thinner, higher and longer. If we assume that all created induced fractures are propagating through the pay zone with equal half-length (due to almost equally spaced drilling), the thinner fracture resulting in less fracture conductivity and consequently lower gas production. Figure 10 and Figure 11 show the impact of Young s modulus on production performance in both 3 and 24 months of production based on FTA and WQ Analyses. As shown in these figures, the data reveals that those wells with higher young s modulus are showing the lower performance than those with lower young s modulus.
-WQA Results Minimum Horizontal Stress- As a proven fact, a horizontal well should be drilled parallel to minimum horizontal stress while the hydraulic fractures tend to initiate parallel to")

9 SPE MS 9 Figure 10 Young s Modulus for Time Interval of 3 Months and 24 Months (Left to Right)-FTA Results Figure 11 Young s Modulus for Different Well Clusters in 3 and 24 Months (Left to Right)-WQA Results Minimum Horizontal Stress- As a proven fact, a horizontal well should be drilled parallel to minimum horizontal stress while the hydraulic fractures tend to initiate parallel to max-horizontal stress. Rock mechanical studies show that, any increase in minimum horizontal stress causes the decrease in created hydraulic fracture width and results in lower performance of HF. By looking at minimum horizontal stress distribution in the reservoir, the area of having higher minimum horizontal stress are less favorable for creating wide and more conductive fractures. FTA and WQA analysis (as shown in Figure 12 and Figure 13) does not confirm the above-mentioned theory. The main reason for explaining this contrast could be due to the fact that the minimum horizontal stress dynamically changes as the fractures initiate. Therefore, considering this parameter as static element impacting production performance will not necessarily yield reasonable correlation.
-WQA Results BTU Area-Based on the content of condensate, the Marcellus")

10 10 SPE MS Figure 12 Minimum Horizontal Stress for Time Interval of 3 Months and 24 Months (Left to Right)-FTA Results Figure 13 Minimum Horizontal Stress for Different Well Clusters in 3 and 24 Months (Left to Right)-WQA Results BTU Area-Based on the content of condensate, the Marcellus shale area were divided into four different BTU areas varying from Dry (low BTU) to wet (high BTU) regions. Figure 14 shows the estimated distribution map of BTU area in this study. According to this figure, the eastern part of reservoir which most of wells were drilled, are located in BTU area of Dry and Low.
, are not as good as those wells located in BTU area of Dry and Low")
11 SPE MS 11 Figure 14 BTU Area Distribution Map This analysis (Figure A-1) shows the higher performance of wells in eastern part compare to the western part of the reservoir. Despite of being located in BTU area of Medium and Wet, the performance of these wells, as it has shown in WQA analysis (Figure 15), are not as good as those wells located in BTU area of Dry and Low and they are categorized in Poor and Average wells. It is worth mentioning that the BTU area is a discrete parameter and it was used in database as four numeric values (1 to 4), therefore no KPI analysis can be done for this parameter. This is true for deviation type as well. Figure 15 BTU Area for Different Well Clusters in 3 and 24 Months (Left to Right)-WQA Results Deviation Type- In the dataset, the wells were identified as having an Up-Dip, a Down-Dip or No-Dip deviation. The WQA analysis Figure 16) clearly shows that in this part of Marcellus shale, the well performance in both early and late time has been impacted by the well deviation favoring the Down-Dip wells. The Down-Dip wells are either completely or partially hydraulically fractured in Lower Marcellus which is more prolific in terms of reservoir characteristics and net thickness.

12 12 SPE MS Figure 16 Deviation Type for Different Well Clusters in 3 and 24 Months (Left to Right)-WQA Result Inside Distance- Most of the laterals in Marcellus shale are spaced from 1000 ft. to 2000 ft. apart even though some operators experimented drilling with decreasing spacing. In order to investigate the impact of distance between the laterals, the inside distance parameter was defined as the distance between the laterals located in a multi-well pad. As illustrated in Figure 17, at early stage of production in shale (Left Plot), lower inside distances between laterals which can be translated to more so-called stimulated reservoir volume, causes the higher productivity. Figure 17 Inside Distance for Time Interval of 3 Months and 24 Months (Left to Right)-FTA Results This behavior can also be observed in late time (Right Plot) to the point that the increasing distances between laterals shows reveres impact on production and elevate the performance of the wells. In this situation shale wells act like conventional wells and less interference between laterals have positive impact on production performance. It should be noted that increasing the inside distances between lateral does not necessarily increase the well performance as well produces more, therefore there should be an optimum distance to first establish enough connectivity to the matrix and second avoid well interference. The WQA analysis in Figure 18 justifies this statement and shows that for the wells in this study, the inside distance of 1900 ft. might be an optimum distance between laterals.

13 SPE MS 13 Figure 18 Inside Distance for Different Well Clusters in 3 and 24 Months (Left to Right)-WQA Result Total Number of Clusters- Horizontal drilling and Multi-Stage multi-cluster hydraulic fracturing became the preferred method of drilling for successful gas development from Marcellus Shale. Clearly, the longer horizontal lateral with more stages/clusters increases the reservoir exposure and resulting in more gas production. As it has shown in Figure 19 and Figure 20, the increase in number of clusters for each well indeed correlate with well quality. In other words, high performance wells are those that have been completed with more number of stages/clusters. Figure 19 Total Number of Clusters for Time Interval of 3 Months and 24 Months (Left to Right)-FTA Results

14 14 SPE MS Figure 20 Total Number of Clusters for Different Well Clusters in 3 and 24 Months (Left to Right)-WQA Result Injected Slurry Volume- The common practice in Marcellus is pumping water, sand and other additives under high pressure into the formation to create massive fracture networks. As shown in Figure 21 and Figure 22, a clear increasing trend can be observed in production performance by increasing the injected slurry volume. Figure 21 Total Injected Slurry for Time Interval of 3 Months and 24 Months (Left to Right)-FTA Results


-WQA Result The same analysis has been")
15 SPE MS 15 Figure 22 Total Injected Slurry for Different Well Clusters in 3 and 24 Months (Left to Right)-WQA Result Proppant per Stage- As illustrated in Figure 23 and Figure 24, the production performance of the wells has a direct correlation with the amount of proppant pumped in each stage. These figures show that better wells were treated with more proppant than wells with lower quality. Figure 23 Proppant per Stage for Different Well Clusters in 3 and 24 Months (Left to Right)-WQA Result Figure 24 Proppant per Stage for Different Well Clusters in 3 and 24 Months (Left to Right)-WQA Result The same analysis has been performed on other parameters as well and the results are illustrated in Appendix A.
16 16 SPE MS In similar analysis, by using the Pattern Recognition technology the contribution (influence) of each of the parameters on any given production indicator can be calculated and compared which is known as Key Performance Indicator (KPI). In this study, the impact of 30 parameters (Table 1) including native and design (15 per each category) are analyzed against the best 3 months and 24 months of rich gas production. Table 1 List of the Native and Design Parameters in KPI Analysis Design Parameters Native Parameters Deviation Type BTU Area Easting (m) Average Lang P(psi) Inside Distance Average Lang Vol.(scf/ton) Northing (m) Net Thickness(ft.) Outside Distance Permeability (md) Type Porosity (%) Cluster Spacing Water Saturation (%) Stimulated Lateral Length(ft.) TOC (%) Shot Density (shots/ft.) Bulk Modulus Total Clusters Min Horizontal Stress Average Max Rate Poisson s Ratio Average ISIP Shear Modulus Average Max Pressure Young s Modulus Slurry Volume (bbl.) Average Breakdown Pressure Total Proppant Injected(lb.) Average Breakdown Rate Upon completion of KPI analyses the score of the ranking of the parameters (represents the influence of each parameters- the higher score, the more influence) for both 3 months and 24 months of rich gas production, can be processed in order to analyze the overall impact of each category (native and design parameters) as a function of the production length. In this analysis, for simplicity, the average of the scores for all native parameters and design parameters were separately calculated and plotted versus 3 months and 24 months of production and Figure 25 illustrates the result of this analysis.

17 SPE MS 17 Figure 25 The Average Influence Degree of Native and Desing Parameters on 3 Months and 24 Months As can be seen from this figure, the effect of native parameters at early stage of production is much more important than the impact of design parameters. As time goes on, the design parameters effect becomes more considerable although the overall impact is still less than native parameters. Conclusions In this paper, the impact of different categories of parameters (native and design) on production from shale formation was evaluated by using the advance pattern recognition tools. The result of this study provides a guideline for designing optimum hydraulic fractures for the planned wells as well as estimating the production performance from each well by taking into account uncertainties associated with reservoir characteristics, completion and stimulation information. Additionally, the following conclusions can be drawn from this work: 1. Drilling in eastern part of the reservoir can result in better performance of the wells due to better reservoir quality. 2. The more inside distance between the laterals is not in favor of gas production at early stage of production however; it can have the reverse impact in later time. 3. The more outside distance between the pads is interpreted as the less gas production from the wells. The WQA result shows that the distance of 3500 ft. between the pads can be the optimum distance. 4. No apparent trend can be observed in TOC and it might be due to the fact that the effect of TOC as contributor to production will start to show later in the life of the well. 5. The analysis showed that lower Young s Modulus could be attributed to more gas recovery. 6. Hydraulic fracture treatment parameters such as injected slurry volume, proppant per stage and stimulated lateral length have positive impact on well productivity. Acknowledgments The authors would like to thank Intelligent Solutions Inc. for supporting us with Improve software package.
18 18 SPE MS References Cipolla, C.L., Lolon, E.P, Erdle, J.C. and Tathed, V.: Modeling Well Performance in Shale Gas Reservoirs, paper , presented at Reservoir Characterization and Simulation Conference, October Cipolla, C.L., Lolon, E.P, Erdle, J.C. and Rubin, B.: Reservoir Modeling in Shale Gas Reservoirs, paper , SPE Journal of Reservoir Evaluation & Engineering, August Mohaghegh, S.D. 2000; Virtual Intelligence Applications in Petroleum Engineering: Part 3; Fuzzy Logic. Journal of Petroleum Technology, Distinguished Author Series. November 2000, pp Mohaghegh, S.D.: Reservoir Modeling of Shale Formations Journal of Natural Gas Science and Engineering, Elsevier B.V., 2013

-WQA Resutls Figure A-3 Cluster Spacing for")
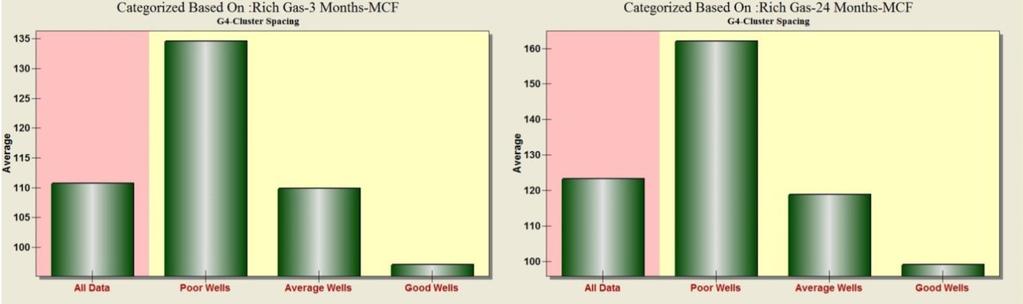
19 SPE MS 19 Appendix A Figure A-1 Easting for Different Well Clusters in 3 and 24 Months (Left to Right)-WQA Resutls Figure A-2 Outside Distance for Different Well Clusters in 3 and 24 Months (Left to Right)-WQA Resutls Figure A-3 Cluster Spacing for Different Well Clusters in 3 and 24 Months (Left to Right)-WQA Resutls
-WQA")
20 20 SPE MS Figure A-4 TOC for Different Well Clusters in 3 and 24 Months (Left to Right)-WQA Resutls Figure A-5 Stimulated Lateral Length for Different Well Clusters in 3 and 24 Months (Left to Right)-WQA Resutls
SPE-SPE MSMS. SPE Eastern Regional Meeting Copyright 2016, Society of Petroleum Engineers
 SPE Eastern Regional Meeting 2016 SPE-SPE-184064-MSMS Conditioning the Estimating Ultimate Recovery of Shale Wells to Reservoir and Completion Parameters Maher J. Alabboodi, Shahab D. Mohaghegh, Rachel
SPE Copyright 2009, Society of Petroleum Engineers
 SPE 124204 Top-Down Intelligent Reservoir Modeling (TDIRM) Y.Gomez, Y. Khazaeni, S.D. Mohaghegh, SPE, West Virginia University, R. Gaskari, Intelligent Solutions, Inc. Copyright 2009, Society of Petroleum
SPE Abstract. Introduction
 SPE 161184 Modeling and History Matching of Hydrocarbon Production from Marcellus Shale using Data Mining and Pattern Recognition Technologies S. Esmaili, A. Kalantari-Dahaghi, SPE, West Virginia University,
SPE Introduction. Abstract
 SPE 132621 New Insight into Integrated Reservoir Management using Top-Down, Intelligent Reservoir Modeling Technique; Application to a Giant and Complex Oil Field in the Middle East Amirmasoud Kalantari-Dahaghi,
N441: Data-Driven Reservoir Modeling: Top-Down Modeling
 Summary This course covers the fundamentals of data-driven analytics and predictive modeling. It explains how to build, history match and validate data-driven reservoir models. Instead of using first principle
Horizontal Well Spacing and Hydraulic Fracturing Design Optimization: A Case Study on Utica-Point Pleasant Shale Play
 URTeC: 2459851 Horizontal Well Spacing and Hydraulic Fracturing Design Optimization: A Case Study on Utica-Point Pleasant Shale Play Alireza Shahkarami*, Saint Francis University; Guochang Wang*, Saint
SPE Copyright 2014, Society of Petroleum Engineers
 SPE 169573 Production Analysis of a Niobrara Field Using Intelligent Top-Down Modeling S. Alireza Haghighat, Shahab D. Mohaghegh, Vida Gholami, David Moreno, West Virginia University Copyright 2014, Society
TRADITIONAL RESERVOIR SIMULATION & MODELING
 TOP-DOWN INTELLIGENT RESERVOIR MODELING (TDIRM); A NEW APPROACH IN RESERVOIR MODELING BY INTEGRATING CLASSIC RESERVOIR ENGINEERING WITH ARTIFICIAL INTELLIGENCE & DATA MINING TECHNIQUES Shahab D. Mohaghegh,
SPE Copyright 2012, Society of Petroleum Engineers
 SPE 152530 Impact of Completion System, Staging, and Hydraulic Fracturing Trends in the Bakken Formation of the Eastern Williston Basin Randy F. LaFollette, SPE, William D. Holcomb, SPE, and Jorge Aragon,
SPE Abstract. Copyright 2011, Society of Petroleum Engineers
 SPE 149441 A Parametric Study and Economic Evaluation of Drilling Patterns in Deep, Thick CBM Reservoirs Ali Omran Nasar, Shahab D. Mohaghegh, Vida Gholami, Department of Petroleum and Natural gas Engineering,
ANALTERNATIVE TO TRADITIONAL NUMERICAL RESERVOIR SIMULATION AND MODELING
 I N T E L L I G E N T S O L U T I O N S, I N C. SURROGATE RESERVOIR MODELS ANALTERNATIVE TO TRADITIONAL NUMERICAL RESERVOIR SIMULATION AND MODELING 5 5 T A R A P L A C E M O R G A N T O W N, W V 2 6 0
Kalantari-Dahaghi A., Mohaghegh S., Khazaeni Y. West Virginia University. SPE Western Regional Meeting, Anaheim, CA May 2010
 New Insight into Integrated Reservoir Management using Top-Down, Intelligent Reservoir Modeling Technique; Application to a Giant and Complex Oil Field in the Middle East Kalantari-Dahaghi A., Mohaghegh
Integrated Approach To Development Of Low Permeability Reservoirs Scot Evans, Vice President IAM and Halliburton Consulting
 Integrated Approach To Development Of Low Permeability Reservoirs Scot Evans, Vice President IAM and Halliburton Consulting SEPTEMBER 26, 2017, ST. PETERSBURG, HOTEL ASTORIA Integrated Approach To Development
Characterization and Simulation of ECBM: History Matching of Forecasting CO2 Sequestration in Marshal County, West Virginia.
 SPE 139034 Characterization and Simulation of ECBM: History Matching of Forecasting CO2 Sequestration in Marshal County, West Virginia. C. E. Calderon, S. D. Mohaghegh, West Virginia University, G. Bromhal,
Surrogate Reservoir Models
 Quantifying Uncertainties Associated with Reservoir Simulation Studies Using Surrogate Reservoir Models Shahab D. Mohaghegh West Virginia University & Intelligent Solutions, Inc. 1 Outline Reservoir Simulation
Approach Optimizes Frac Treatments
 JULY 2011 The Better Business Publication Serving the Exploration / Drilling / Production Industry Approach Optimizes Frac Treatments By Jamel Belhadi, Hariharan Ramakrishnan and Rioka Yuyan HOUSTON Geologic,
Improvement of Fracturing for Gas Shales
 Improvement of Fracturing for Gas Shales RPSEA Subcontract Number: 07122-38 Topical Progress Report Students: Abhishek Gaurav & Ming Gu Principal Investigator: Dr. Kishore Mohanty Department of Petroleum
How to get the most out of your multi stage unconventional fracture design
 WHITE PAPER How to get the most out of your multi stage unconventional fracture design Author: Robert F. (Bob) Shelley HOW TO GET THE MOST OUT OF YOUR MULTI STAGE UNCONVENTIONAL FRACTURE DESIGN A number
Successful Completion Optimization of the Eagle Ford Shale
 Successful Completion Optimization of the Eagle Ford Shale Supplement to SPE Paper 170764 Presented at the Society of Petroleum Engineers Annual Technical Conference and Exhibition Amsterdam, The Netherlands
Synergetic CO2 Storage and gas/oil production from tight reservoirs
 Synergetic CO2 Storage and gas/oil production from tight reservoirs Institute of Drilling and Fluid Mining, Reservoir Engineering, Production and Underground Storage of Oil and Gas, Technical University
Integrated Sensor Diagnostics (ISD) Subsurface Insight for Unconventional Reservoirs
 Subsurface Insight for Unconventional Reservoirs") HALLIBURTON WHITE PAPER Integrated Sensor Diagnostics (ISD) Subsurface Insight for Unconventional Reservoirs Solving challenges. Integrated Sensor Diagnostics (ISD) Subsurface Insight for Unconventional
HALLIBURTON WHITE PAPER Integrated Sensor Diagnostics (ISD) Subsurface Insight for Unconventional Reservoirs Solving challenges. Integrated Sensor Diagnostics (ISD) Subsurface Insight for Unconventional
A New Methodology for the Identification of Best Practices in the Oil & Gas Industry, Using Intelligent Systems
 A New Methodology for the Identification of Best Practices in the Oil & Gas Industry, Using Intelligent Systems Shahab D. Mohaghegh P. O. Box 6070, Morgantown, WV 26505 Tel: 304.293.7682 Ext. 3405 Fax:
The SPE Foundation through member donations and a contribution from Offshore Europe
 Primary funding is provided by The SPE Foundation through member donations and a contribution from Offshore Europe The Society is grateful to those companies that allow their professionals to serve as
Utica Point Pleasant Play - Range s View on a Key Appalachian Basin Unconventional Target & Plans for Future Development
 Utica Point Pleasant Play - Range s View on a Key Appalachian Basin Unconventional Target & Plans for Future Development STRH 5 th Utica Shale Mini Conference November 14, 2013 Forward-Looking Statements
SPE Abstract. 1. Introduction
 SPE 111205 Fieldwide Reservoir Characterization Based on a New Technique of Production Data Analysis: Verification Under Controlled Environment D. Mata, R. Gaskari, and S. Mohaghegh, West Virginia University
Analyzing Performance of
 Analyzing Performance of North American Shale Gas Resources 2013 SPE - GCS - Reservoir Technology Forum Rakesh R. Rai NanoDarcy Rock Changes Everything G&G: Shale petrophysics, seismic, core analysis,
Understanding the Challenge Design for Effective Stimulation. Visegrád, 20 November 2014 Jonathan Abbott, Schlumberger. Society of Petroleum Engineers
 Understanding the Challenge Design for Effective Stimulation Visegrád, 20 November 2014 Jonathan Abbott, Schlumberger Society of Petroleum Engineers 1 Agenda Stimulation Challenges Completion Selection
Transient IPR for Fractured Horizontal Wells in Niobrara Formation
 Transient IPR for Fractured Horizontal Wells in Niobrara Formation Bin Yuan, Rouzbeh Ghanbarnezhad Moghanloo, and Da Zheng, University of Oklahoma Copyright 2016, International Petroleum Technology Conference
Prediction of Water Production in CBM wells
 CHAPTER 7 Prediction of Water Production in CBM wells 7.1 Introduction Coal is a complex heterogeneous system with methane gas remaining adsorbed on coal surface by lithostatic and hydrostatic pressure
A Method for Stimulation Candidate Well Selection
 International Journal of Engineering and Technology Volume 5 No. 1, January, 2015 A Method for Stimulation Candidate Well Selection Okotie Sylvester 1, Ikporo Bibobra 2 and Ovuema Augustina 3 1,3 Department
Uncertainty Analysis of a CO2 Sequestration Project Using Surrogate Reservoir Modeling Technique
 SPE 153843-PP Uncertainty Analysis of a CO2 Sequestration Project Using Surrogate Reservoir Modeling Technique Shohreh Amini, SPE, West Virginia University, Shahab Mohaghegh, SPE, West Virginia University
Shale Projects Becoming Globally Important U.S. Shale Oil & Gas Experience Extrapolates Globally
 Shale Projects Becoming Globally Important U.S. Shale Oil & Gas Experience Extrapolates Globally Global Shale Gas Estimated Reserves Shale Projects are Going Global Source: EIA Potential projects are developing
Perforating for Hydraulic Fracturing Next Generation Technologies for Unconventional Completions
 Perforating for Hydraulic Fracturing Next Generation Technologies for Unconventional Completions 2018-NAPS-07 AUTHOR: Jim Gilliat Perforating Product Champion BakerHughes, a GE Company Introduction The
Jerzy M. Rajtar* SHALE GAS HOW IS IT DEVELOPED?
 WIERTNICTWO NAFTA GAZ TOM 27 ZESZYT 1 2 2010 Jerzy M. Rajtar* SHALE GAS HOW IS IT DEVELOPED? 1. INTRODUCTION XTO Energy, Inc. has been engaged in development of major gas shale plays in the continental
Fracturing Overview: Fact vs. Fiction Andy Bond, Subsurface Manager December 8,
 Fracturing Overview: Fact vs. Fiction Andy Bond, Subsurface Manager December 8, 2016 www.caelusenergy.com Agenda Brief History of Hydraulic Fracturing Why is Hydraulic Fracturing Used? Alaska Regulations
Improve Operator Benchmarking Using Graded Acreage
 Improve Operator Benchmarking Using Graded Acreage Learn how one operator optimized underperforming assets in the Bakken Copyright 2015, Drillinginfo, Inc. All rights reserved. All brand names and trademarks
Coalbed Methane- Fundamental Concepts
 Coalbed Methane- Fundamental Concepts By: K. Aminian Petroleum & Natural Gas Engineering Department West Virginia University Introduction This article is the first in a series of articles that will discuss
This paper was prepared for presentation at the Unconventional Resources Technology Conference held in San Antonio, Texas, USA, 1-3 August 2016.
 URTeC: 2461207 Managed Pressure Flowback in Unconventional Reservoirs: A Permian Basin Case Study Darryl Tompkins*, Robert Sieker, and David Koseluk, Halliburton; Hugo Cartaya, GMT Exploration Copyright
Unconventional Reservoir Stimulation. R. D. Barree Barree & Associates LLC
 Unconventional Reservoir Stimulation R. D. Barree Barree & Associates LLC How Do We Optimize Stimulation Designs? Experience Our personal observations Our past history Our expectations of what will be
White Paper: Shale Gas Technology. September Shale Gas Technology 2011 NRGExpert Page 1 of 8
 White Paper: Shale Gas Technology September 2011 Shale Gas Technology 2011 NRGExpert www.nrgexpert.com Page 1 of 8 Table of Contents An Introduction to Shale Gas Technology... 3 Horizontal drilling...
Southwest Petroleum Branch,SINOPEC. The Challenges of Stimulation In Sichuan Western Tight Sand Formation
 The Challenges of Stimulation In Sichuan Western Tight Sand Formation 1 7 2. Demands of This Expert Visits of PPM China Case Study 2.1 Objective When exploring and development T 3 X in west Sichuan, Southwest
A five-step method for optimizing perforating design and placement to engineer more profitable completions
 A five-step method for optimizing perforating design and placement to engineer more profitable completions 1 Data capture 5 Monitoring 2 Data analysis 4 High-efficiency field execution 3 Perforating design
NOTICE CONCERNING COPYRIGHT RESTRICTIONS
 NOTICE CONCERNING COPYRIGHT RESTRICTIONS This document may contain copyrighted materials. These materials have been made available for use in research, teaching, and private study, but may not be used
URTeC: Abstract
 URTeC: 2686732 Application of Fiber-optic Temperature Data Analysis in Hydraulic Fracturing Evaluation: A Case Study in Marcellus Shale Shohreh Amini*, Payam Kavousi, Timothy R Carr, West Virginia University
Borehole NMR: Different Problems Different Solutions
 Borehole NMR: Different Problems Different Solutions Stefan Menger Mgr. Applications Development Halliburton/NUMAR Abstract During the last decade, NMR has significantly improved the understanding of hydrocarbon
Development of Surrogate Reservoir Models (SRM) For Fast Track Analysis of Complex Reservoirs
 For Fast Track Analysis of Complex Reservoirs") Development of Surrogate Reservoir Models (SRM) For Fast Track Analysis of Complex Reservoirs Shahab D. Mohaghegh, WVU & ISI Modavi, A., Hafez, H. Haajizadeh, M., Kenawy, M., and Guruswamy, S., Abu Dhabi
Development of Surrogate Reservoir Models (SRM) For Fast Track Analysis of Complex Reservoirs Shahab D. Mohaghegh, WVU & ISI Modavi, A., Hafez, H. Haajizadeh, M., Kenawy, M., and Guruswamy, S., Abu Dhabi
Proxy Model Based on Butler s SAGD Theory
 Proxy Model Based on Butler s SAGD Theory Vahid Dehdari and Clayton V. Deutsch Oil sand reservoirs play an important role in the economy of Canada. There are huge reserves in these reservoirs. Due to the
Marcellus Shale Water Group
 Marcellus Shale Water Group Targeting unconventional oil & gas reservoirs with better ideas, better solutions Our technique of calculating actual production increases the value of your reservoir 1 Predictive
NEVADA EXPLORATION PROJECT
 Energizing the World, Bettering People s Lives NEVADA EXPLORATION PROJECT Legislative Committee on Public Lands June 12, 2014 Kevin Vorhaben, Rockies/Frontier Business Unit Manager Forward-looking Statements
COPYRIGHT. Development of a Gas Condensate Reservoir. The Anschutz Ranch East Field: Case Study
 Development of a Gas Condensate Reservoir The Anschutz Ranch East Field: Case Study SPE 10992, 11968, 12042, 12257, 13108, 14412, 14414, 14456, 22824 The Anschutz Ranch East Field Located in the Western
This Series of Guides Addresses:
 Fracturing What are you calling fracturing? Transport of materials to the well site? Surface equipment and pumping operations? Surface pressure control of the well during drilling or production? Well construction
Effective Use of Partial Monolayer Proppants to Enhance Production in a Tight Gas Reservoir.
 South Dakota School of Mines & Technology 2010 New Horizons in Oil & Gas Conference Effective Use of Partial Monolayer Proppants to Enhance Production in a Tight Gas Reservoir. Presented By: Wendell Salas
EnerCom's London Oil & Gas Conference 16 June 2011 London, England Danny D. Simmons
 Overview of Shale Plays EnerCom's London Oil & Gas Conference 16 June 2011 London, England Danny D. Simmons Daily Gas Production (BCFD) Barnett Shale Historical Gas Production Rig Count 6.0 300 5.0 Gas
The SPE Foundation through member donations and a contribution from Offshore Europe
 Primary funding is provided by The SPE Foundation through member donations and a contribution from Offshore Europe The Society is grateful to those companies that allow their professionals to serve as
Effect of Grain Size Distribution on Elastic Velocity
 Effect of Grain Size Distribution on Elastic Velocity Effect of Sorting. The constant cement and unconsolidated sand models (see Appendix) mimic the process of deteriorating sorting in sands. Core analysis
Analysis of Fracture Design in a Vertical Well with a Horizontal Fracture
 Analysis of Fracture Design in a Vertical Well with a Horizontal Fracture Kai Dong, China National Petroleum Corporation; Xiao Jin and Jie He, Texas A&M University Abstract The overwhelming majority of
Technology Enhancements in the Hydraulic Fracturing of Horizontal Wells
 Technology Enhancements in the Hydraulic Fracturing of Horizontal Wells Brian Clark Senior Production and Completions Engineer Unconventional Resources Group Topics Environmental Horizontal Completion
An Efficient and Optimized Approach to Multiple Fracturing of Horizontal Wells
 An Efficient and Optimized Approach to Multiple Fracturing of Horizontal Wells Injectivity Frcaturing and Assurance Advantek Waste Management Services 11000 Richmond Ave, Suite 190 Houston TX 77042 713.532.7627
Petroleum Production Systems
 Petroleum Production Systems SECOND EDITION Michael J. Economides A. Daniel Hill Christine Ehlig-Economides Ding Zhu PRENTICE HALL Upper Saddle River, NJ Boston Indianapolis San Francisco New York Toronto
An Alternative and Modular Approach to Enhanced Geothermal Systems
 Proceedings World Geothermal Congress 2005 Antalya, Turkey, 24-29 April 2005 An Alternative and Modular Approach to Enhanced Geothermal Systems Subir K. Sanyal 1, Eduardo E. Granados 1, Steven J. Butler
The Pore Structural Evolution of Mudrocks: A Case Study of Marcellus Shale
 2014 Eastern Unconventional Oil and Gas Symposium - November 5-7, 2014 in Lexington, Kentucky, USA http://www.euogs.org The Pore Structural Evolution of Mudrocks: A Case Study of Marcellus Shale Liaosha
SPE Reservoir Engineering and Production Optimization Mike Verney, P. Eng. February 28, 2017
 SPE Reservoir Engineering and Production Optimization Mike Verney, P. Eng. February 28, 2017 1 » Monograph 4 Estimating Ultimate Recovery of Developed Wells in Low Permeability Reservoirs» Purpose assess
Effect of Frequent Well Shut-In's on Well Productivity: Marcellus Shale Case Study
 SPE-187506-MS Effect of Frequent Well Shut-In's on Well Productivity: Marcellus Shale Case Study Saurabh Sinha and Kurt J. Marfurt, University of Oklahoma; Bhabesh Deka Copyright 2017, Society of Petroleum
Benelux Conference Pan European Days
 Benelux Conference Pan European Days 3-5 June 2013 Waldorf Astoria New York, New York Slide 1 Benelux Conference Pan European Days 3-5 June 2013 Waldorf Astoria New York, New York Slide 2 Three principal
Mechanism of Excessive Water Production in an Iranian Offshore Oilfield
 2012 International Conference on Bioscience, Biochemistry and Bioinformatics IPCBEE vol.3 1(2012) (2012)IACSIT Press, Singapoore Mechanism of Excessive Water Production in an Iranian Offshore Oilfield
SPE Introduction 1
 SPE 30979 State-Of-The-Art in Permeability Determination From Well Log Data: Part 2- Verifiable, Accurate Permeability Predictions, the Touch-Stone of All Models Mohaghegh, S., Balan, B., Ameri, S., West
Analysis Fraction Flow of Water versus Cumulative Oil Recoveries Using Buckley Leverett Method
 Analysis Fraction Flow of Water versus Cumulative Oil Recoveries Using Buckley Leverett Method Reza Cheraghi Kootiani, and Ariffin Bin Samsuri International Science Index, Physical and Mathematical Sciences
Analogs in Resource Assessment and Beyond
 Analogs in Resource Assessment and Beyond Presented by Dr. Shengyu Wu James Faroppa, Dr. S. Qing Sun Date October 16, 2018 Presented by The intelligence behind the world s most successful oil and gas companies
FRACTURED AND UNCONVENTIONAL RESERVOIRS
 FRACTURED AND UNCONVENTIONAL RESERVOIRS The power to understand and characterize the properties of your reservoir, to predict future behaviors, and to improve and commercialize its lifetime performance.
Bank of America Merrill Lynch 2012 Global Energy Conference
 Bank of America Merrill Lynch 2012 Global Energy Conference November 14-16, 2012 Fontainebleau Hotel Miami, Florida Slide 1 2012 Global Energy Conference November 14 16, 2012 Fontainebleau Hotel, Miami,
Uncertainty Analysis of Otway CO2 Sequestration Project
 Uncertainty Analysis of Otway CO2 Sequestration Project Shohreh Amini 1,2, Shahab D. Mohaghegh 1,2,, Razi Gaskari 3, Grant Bromhal 1 ( 1 National Energy Technology Laboratory-Regional University Alliance
PRESSURE TRANSIENT BEHAVIOUR OF A HORIZONTAL STEAM INJECTION WELL IN A NATURALLY FRACTURED RESERVOIR
 PRESSURE TRANSIENT BEHAVIOUR OF A HORIZONTAL STEAM INJECTION WELL IN A NATURALLY FRACTURED RESERVOIR Tan Tiek Yi and Azeb D. Habte Department of Petroleum Engineering, Universiti Teknologi PETRONAS, Malaysia
An Invitation to Join 3S Laboratory for World-class Petroleum Research. November 18 th, 2011 University Park campus, Pennsylvania
 An Invitation to Join 3S Laboratory for World-class Petroleum Research November 18 th, 2011 University Park campus, Pennsylvania Introduction To identify and solve challenging technical problems for your
Advanced Completion Design, Fracture Modeling Technologies Optimize Eagle Ford Performance
 DECEMBER 211 The Better Business Publication Serving the Exploration / Drilling / Production Industry Advanced Completion Design, Fracture Modeling Technologies Optimize Eagle Ford Performance By Lucas
EVALUATION OF WATER AND GAS INJECTION IN A CARBONATE RESERVOIR
 SCA-53 1/ EVALUATION OF WATER AND GAS INJECTION IN A CARBONATE RESERVOIR P.R. Nurafza 1, M.J. Blunt and M.R. Fassihi 3 1, - Department of Earth Science and Engineering, Imperial College, London SW7 AZ,
A Comparison Study between the Newly Developed Vertical Wells Steam Assisted Gravity Drainage and the Conventional SAGD Process
 Engineering, 217, 9, 575-59 http://www.scirp.org/journal/eng ISSN Online: 1947-394X ISSN Print: 1947-3931 A Comparison Study between the Newly Developed Vertical Wells Steam Assisted Gravity Drainage and
SONATRACH ALGERIA SONATRACH. Vision & Perspectives. ALGERIA - Energy Day 04th May, 2016 HOUSTON - TEXAS - USA
 SONATRACH ALGERIA SONATRACH Vision & Perspectives ALGERIA - Energy Day 04th May, 2016 HOUSTON - TEXAS - USA Sonatrach Corporate Profile : 2015 key figures E&P Midstream Downstream Marketing Discoveries
SPE Abstract. Introduction. Description of the ULIF Technology
 SPE 12391 Ultra-Low Invasion Fluids a Viable Technical Solution to Drill in Eastern Venezuela Alan G. Arbizú SPE, Dr. Paul Reid SPE, José G. Moreno, Impact Solutions Group; Alí A. Avila, Samán; N. Urbaneja
The SPE Foundation through member donations and a contribution from Offshore Europe
 Primary funding is provided by The SPE Foundation through member donations and a contribution from Offshore Europe The Society is grateful to those companies that allow their professionals to serve as
U.S. Natural Gas A Decade of Change and the Emergence of the Gas-Centric Future
 AIChE Alternative Natural Gas Applications Workshop U.S. Natural Gas A Decade of Change and the Emergence of the Gas-Centric Future Francis O Sullivan October 8 th, 214 1 Natural gas The new unconventional
Prediction of PEF and LITH logs using MRGC approach
 Prediction of PEF and LITH logs using MRGC approach Mahdi Pabakhsh 1, Kamyar Ahmadi 2 *, Mohammad Ali Riahi 3 and Abbas Abbaszadeh Shahri 4 1 M.Sc. Student of Exploration Petroleum Engineering, Islamic
SPE Copyright 2012, Society of Petroleum Engineers
 SPE 160076 Production Analysis in the Eagle Ford Shale Best Practices for Diagnostic Interpretations, Analysis, and Modeling D. Ilk, DeGolyer and MacNaughton, N. J. Broussard, El Paso Corp., T.A. Blasingame,
Division Mandates. Supervise the drilling, operation, and maintenance of wells to prevent damage to life, health, property, and natural resources.
 Division Mandates Supervise the drilling, operation, and maintenance of wells to prevent damage to life, health, property, and natural resources. Supervise and permit the owners/operators to utilize all
An application of liquid pipeline optimization through parametric studies Jennifer Worthen, Ph.D., Energy Solutions International, Inc.
 PSIG 1414 An application of liquid pipeline optimization through parametric studies Jennifer Worthen, Ph.D.,, Inc. Copyright 2014, Pipeline Simulation Interest Group This paper was prepared for presentation
Research Article Fuzzy Comprehensive Evaluation on the Effect of Measures Operation for Oil-Water Well
 Fuzzy Systems Volume 2011, Article ID 695690, 5 pages doi:101155/2011/695690 Research Article Fuzzy Comprehensive Evaluation on the Effect of Measures Operation for Oil-Water Well Zhi-Bin Liu, 1, 2 Wei
RESOURCE PLAYS: UNDEVELOPED RESERVES THE LEARNING CURVE
 RESOURCE PLAYS: UNDEVELOPED RESERVES THE LEARNING CURVE Tennessee Oil and Gas Association Nashville, TN May 12, 2011 D. Randall Wright (615) 370 0755 randy@wrightandcompany.com wrightandcompany.com Our
Comparison of Image Logs to Nuclear Magnetic Resonance Logs*
 Comparison of Image Logs to Nuclear Magnetic Resonance Logs* Charles H. Smith 1, Kyle Nelson 2, and Ashely Hall 2 Search and Discovery Article #70169 (2014) Posted September 22, 2014 *Adapted from oral
Simplified graphical correlation for determining flow rate in tight gas wells in the Sulige gas field
 258 Pet.Sci.(28)5:258-262 DOI.7/s12182-8-41-1 Simplified graphical correlation for determining flow rate in tight gas wells in the Sulige gas field Xiao Wei 1, Wu Xiaodong 1 and Liu Xiaojuan 2 1 Laboratory
Reservoir Engineering
 Reservoir Engineering How much oil is in place? How much oil is recoverable? How can I maximize oil recovery? Under economic constraints Origin of Petroleum Where are the resources? Traps Dome trap Fault
The SPE Foundation through member donations and a contribution from Offshore Europe
 Primary funding is provided by The SPE Foundation through member donations and a contribution from Offshore Europe The Society is grateful to those companies that allow their professionals to serve as
Numerical simulation of In-situ combustion and the effects of change in parameters on reservoir efficiency
 International Journal of Petroleum and Geoscience Engineering (IJPGE) 2 (4): ISSN 2289-4713 Academic Research Online Publisher Research paper Numerical simulation of In-situ combustion and the effects
An Empirical Correlation for Two-Phase Inflow Performance Relationship in Horizontal Oil Wells
 An Empirical Correlation for Two-Phase Inflow Performance Relationship in Horizontal Oil Wells Ramadan Emara 1, 2 1(Home) Mining and Petroleum Engineering Department, Faculty of Engineering, Al Azhar University
Characterization and Modeling to Examine the Potential for CO 2 Storage and Enhanced Oil Recovery in the Bakken Petroleum System
 Characterization and Modeling to Examine the Potential for CO 2 Storage and Enhanced Oil Recovery in the Bakken Petroleum System Williston Basin Petroleum Conference Regina, Saskatchewan April 29, 2015
Acid Stimulation of Carbonate Reservoir in Northeastern Thailand Using Developed Computer Program
 International Journal of Computer (IJC) ISSN 2307-4523 (Print & Online) Global Society of Scientific Research and Researchers http://ijcjournal.org/ Acid Stimulation of Carbonate Reservoir in Northeastern
The Pennsylvania State University. The Graduate School. Department of Energy and Mineral Engineering
 The Pennsylvania State University The Graduate School Department of Energy and Mineral Engineering EFFECT OF MULTI-PHASE FLOW ON RECOVERY OF FRACTURE FLUID AND GAS IN MARCELLUS SHALE RESERVOIRS A Thesis
SPE Top-Down Intelligent Reservoir Modeling of New Albany Shale A. Kalantari-Dahaghi, SPE, S.D. Mohaghegh, SPE, West Virginia University
 SPE 125859 Top-Down Intelligent Reservoir Modeling of New Albany Shale A. Kalantari-Dahaghi, SPE, S.D. Mohaghegh, SPE, West Virginia University Copyright 2009, Society of Petroleum Engineers This paper
ENHANCED OIL RECOVERY PLANNING FOR THE LUCKEY DITCH FIELD
 ENHANCED OIL RECOVERY PLANNING FOR THE LUCKEY DITCH FIELD Team Five: Rebecca Roskowski (Team Leader) Blake Robinson Christopher Siebert Hamilton Smith Whitney Smith Petroleum Engineering Undergraduate
TDWI strives to provide course books that are contentrich and that serve as useful reference documents after a class has ended.
 Previews of TDWI course books offer an opportunity to see the quality of our material and help you to select the courses that best fit your needs. The previews cannot be printed. TDWI strives to provide
Examining the Technology of CBM Multiple-lateral Horizontal Well
 Examining the Technology of CBM Multiple-lateral Horizontal Well Dr. S. K. Singh VP & Head-Technical-Unconventional Unconventional Gas Asia Summit (UGAS 2013) New Delhi, 18-19 April 2013 Agenda Essar CBM
Analysis of Sedimentary Geothermal Systems Using an Analytical Reservoir Model
 GRC Transactions, Vol. 38, 2014 Analysis of Sedimentary Geothermal Systems Using an Analytical Reservoir Model Chad Augustine National Renewable Energy Laboratory Keywords Sedimentary geothermal, reservoir