Using Data to Support Watershed Protection and Restoration Decisions
|
|
|
- Evelyn Jacobs
- 5 years ago
- Views:
Transcription

1 Using Data to Support Watershed Protection and Restoration Decisions
2 CSI Watershed You found the (water) body. There were signs of a struggle. What happened?

3 The evidence will come from lots of places...

4 Indiana Watershed Planning Process Watershed community Watershed inventory ID problems & causes ID sources, calculate loads Set goals, ID critical areas Select goals/indicators Choose BMPs/measures Action register & schedule Tracking effectiveness

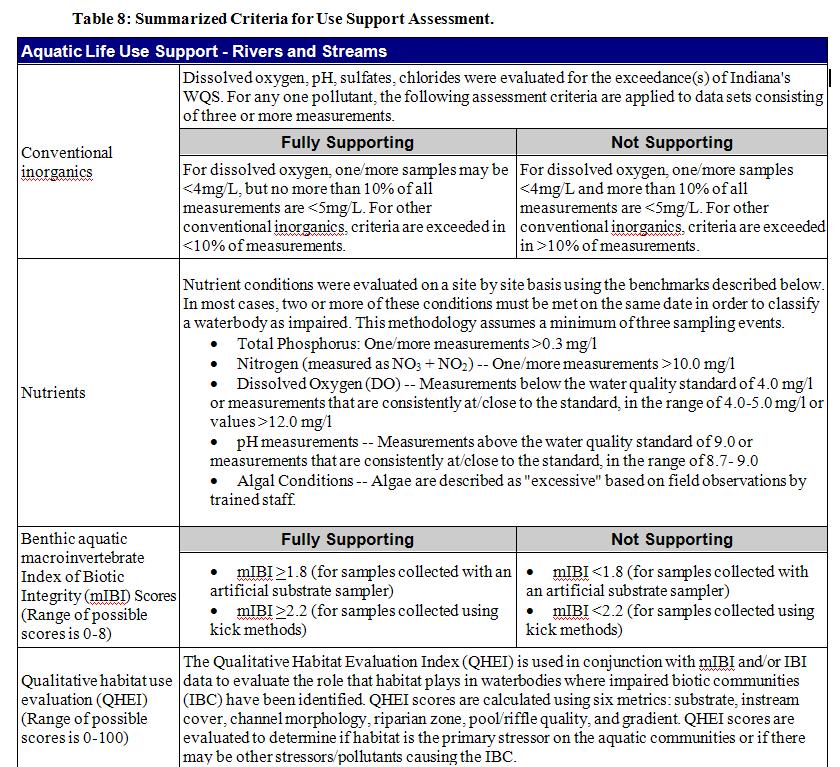
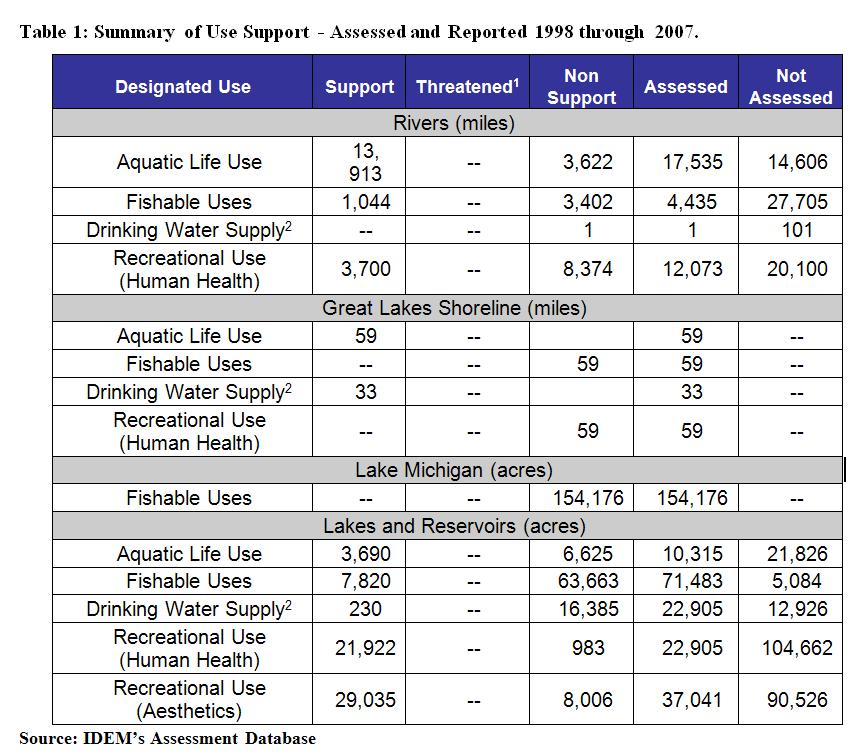
5 Identify problems (impairments & threats), causes (pollutants/conditions), & sources How does water quality compare to WQ criteria? What are the problem pollutants? What & where are the sources? We need to map locations & estimate magnitude...
6 Causes: pollutants or poor conditions Cause/Stressor Miles Cause unknown Impaired Biotic Communities 2,469 Pesticides Atrazine 7 Toxic Organics PAHs 22 Dioxins 154 Bioaccumulative Chemicals of Concern PCBs in Fish Tissue 3,194 Mercury in Fish Tissue 1,703 Other Total dissolved solids 341 Nutrient/Eutrophication Indicators 749 Organic Enrichment (Sewage) Indicators 36 ph 81 Oxygen Depletion 702 Temperature 15 Siltation 118 Flow alteration 57 Other habitat alterations 89 Pathogens (E. coli indicator) 8,322 Oil and grease 11 Algal Growth 123
7 Sources: origin(s) of the pollutants or problem conditions Source Miles Point Sources Package plants (small flows) 901 Combined Sewer Overflow 402 Collection System Failure 4 Industrial Point Sources 333 Agriculture Grazing Related Sources 1,465 Animal Feeding Operations (NPS) 1,191 Crop Production 1,473 Land Application/Waste Disposal Landfills 7 Illegal Dumps or Other Inappropriate Waste Disposal 45 Onsite Wastewater Treatment Systems (septic systems) 768 Hazardous waste 3 Hydromodification Channelization 179 Dam Construction 16 Flow Regulation/Modification 383 Habitat Alterations (not directly related to hydromodification) Loss of Riparian Habitat 549 Bank or shoreline modification/destabilization 312 Other Contaminated Sediments 165 Debris and Bottom deposits 18 Natural sources 132 Urban Runoff/Stormwater 430 Resource Extraction (Mining) 182

8 Building Conceptual Models Source Summarize hypotheses of perceived linkages between stressors and impacts Provide template for determining potential indicator measurements and management practices Cause Cause Cause Problem (Impairment)
9 Problem sources: sediment High upland erosion potential: Watershed slopes > 15%, row crops, active clearing/grading, erodible soils, few or no BMPs High stream channel erosion potential: Impervious area > 15-25%, overgrazed pastures (compacted soil), little or no stream vegetated buffer, active new development, few or no BMPs
10 Problem sources: nutrients High nutrient runoff potential: Animal feeding operations, overfertilized crops and lawns, high density septic system installations near streams, High nutrient point source potential: Concentrated animal feeding operations, wastewater treatment plants, municipal separate storm sewer systems (MS4s)
11 Problem sources: bacteria High priority bacteria sources: Poorly operated wastewater treatment plants, combined sewer overflows, high density septic systems near waterways, concentrated animal feeding operations near waterways Lower priority bacteria sources: Wildlife, pets in low concentrations, pastured livestock in upland areas, grasslands (no livestock)

12 Calculating loads: what is a load? A way to quantify our problems Usually measured by weight Kilograms per day Pounds per week Tons per month Other quantification schemes: Concentration-based expression of the load (e.g., milligrams per liter) # of miles of streambank needing stabilization or vegetation # of AFOs requiring nutrient plans
 Typical facility concentrations and flow")
13 Data-driven Approaches Estimate source loads using: Monitoring data Periodic water quality concentrations and flow gauging data Facility discharge monitoring reports Literature Loading rates, often by land use (e.g., lbs/acre/year) Typical facility concentrations and flow

14 Is a Data-Driven Approach Appropriate? Monitoring data Does it represent most conditions that occur (low flow, storms, etc.)? Are spatial and source variability wellrepresented? Have all parameters of interest been monitored? Is there a clear path to a management strategy?
15 Load Estimates Monitoring Data In simplest terms load = flow x concentration Load duration curves Flow-based presentation Statistical techniques Relationships between flow and concentration to fill in the blanks when data aren t available Examples include: Regression approach FLUX

16 IDEM s load calculation tool Need pollutant concentration averages & flow
17 Load Estimates Literature Land use-specific loading rates (typically annual) Multiply loading rate by area: load all = (area lu1 x loading rate lu1 )+ (area lu2 x loading rate lu2 ) + Generally for land use or watershed-wide analysis Many sources: Lin (2004); Beaulac and Reckhow (1982), etc. Use with caution (need correct representation for your local watershed) Pollution sources, climate, soils

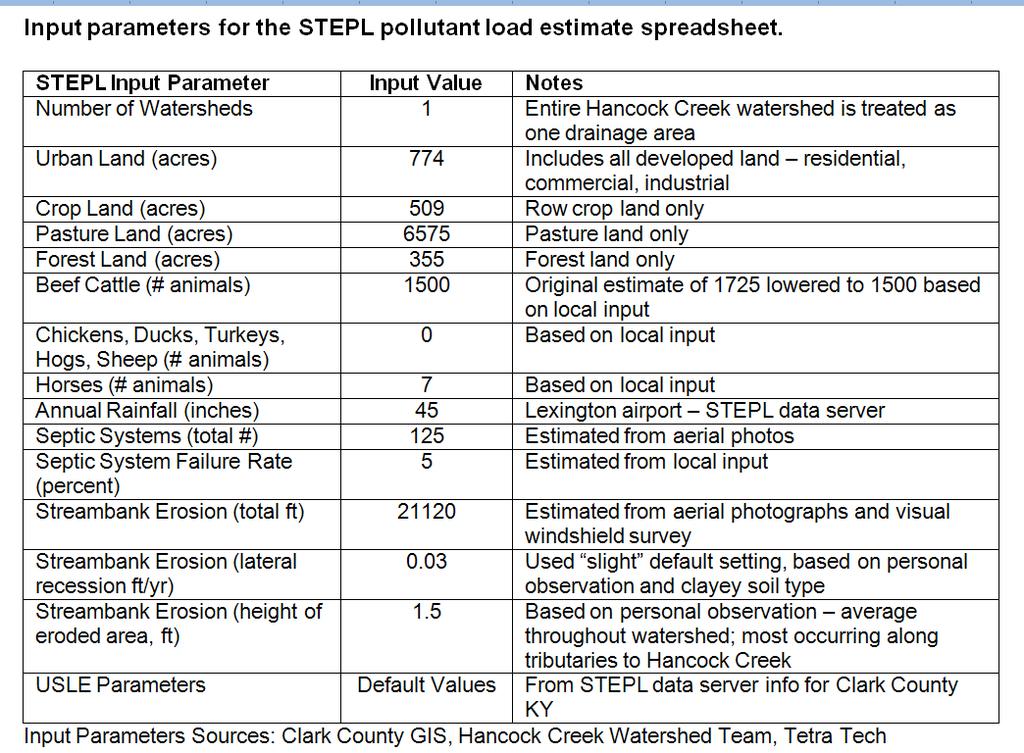
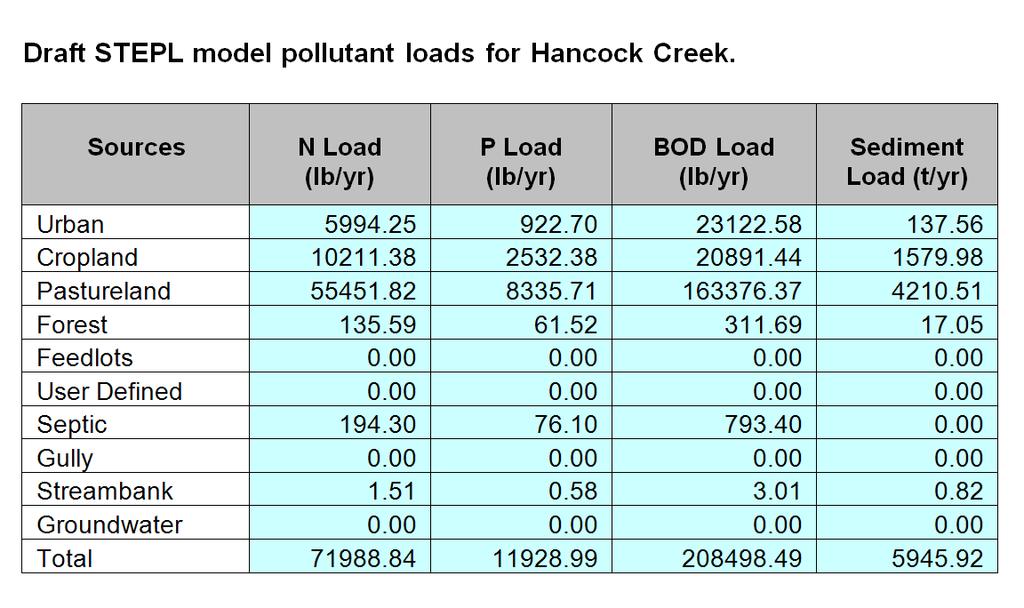
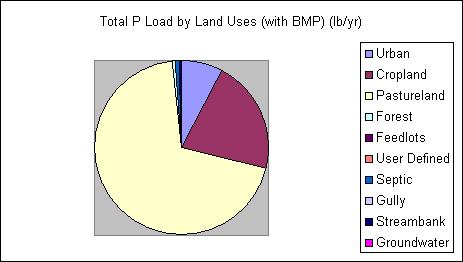
18 Example Load Estimation Based on Literature Values
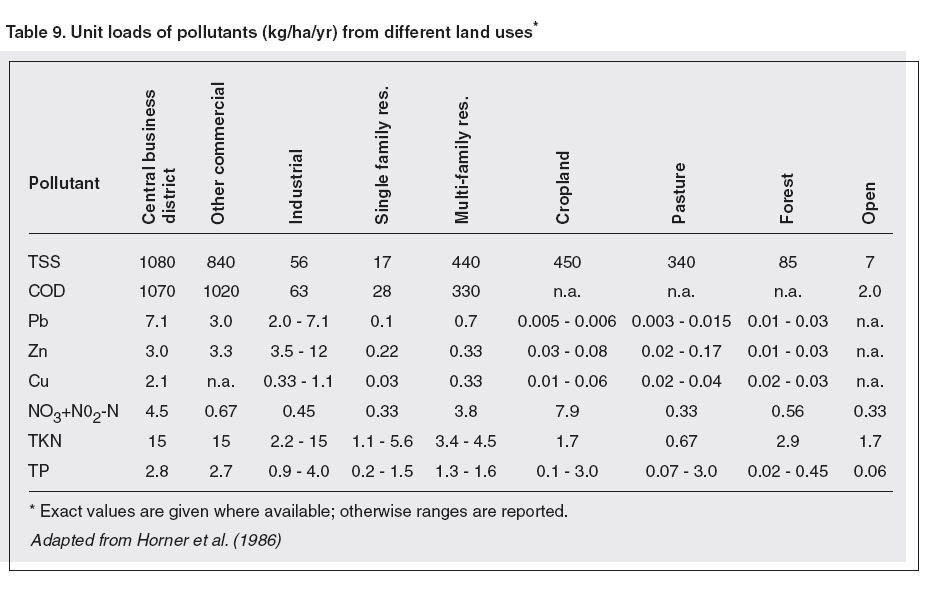
19
20 Limitations of Data-Driven Approaches Monitoring data Reflect current/historical conditions (limited use for future predictions) Insight limited by extent of data (usually water quality data) Often not source-specific May reflect a small range of flow conditions Literature Not reflective of local conditions Wide variation among literature Often a static value (e.g., annual)
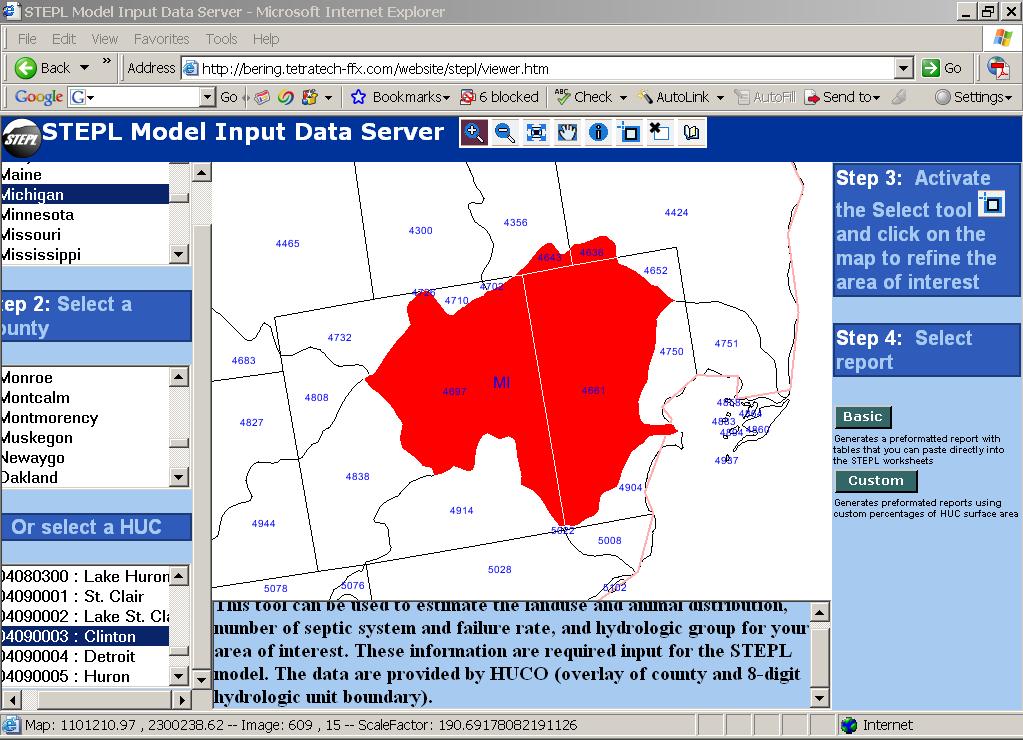
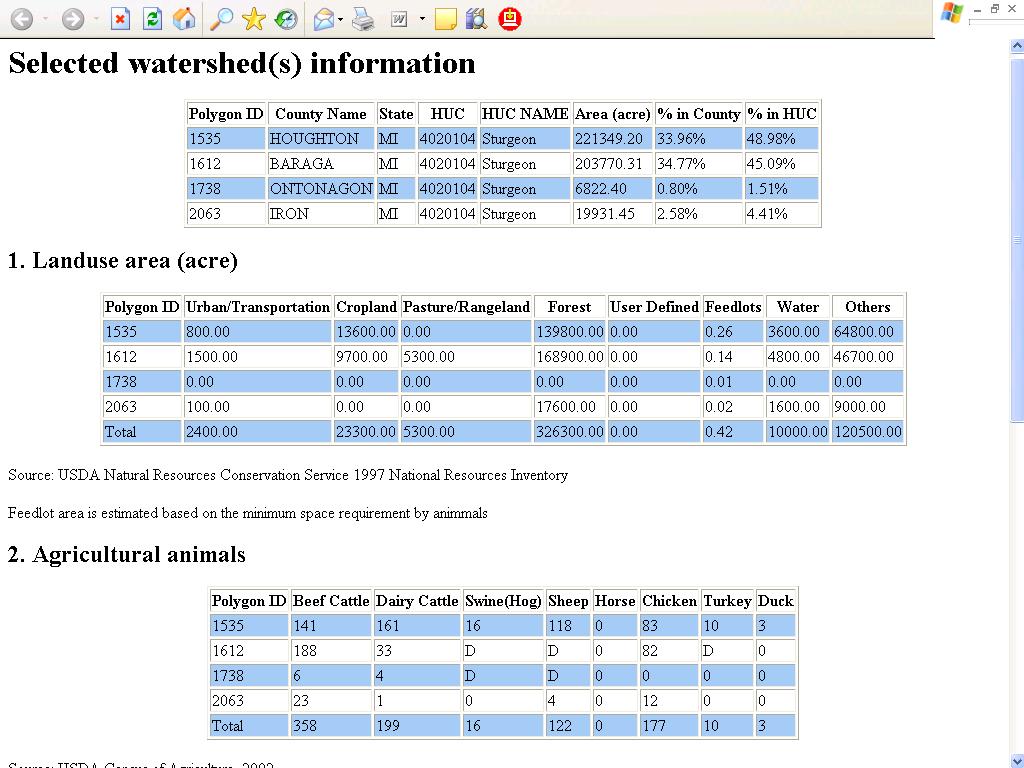
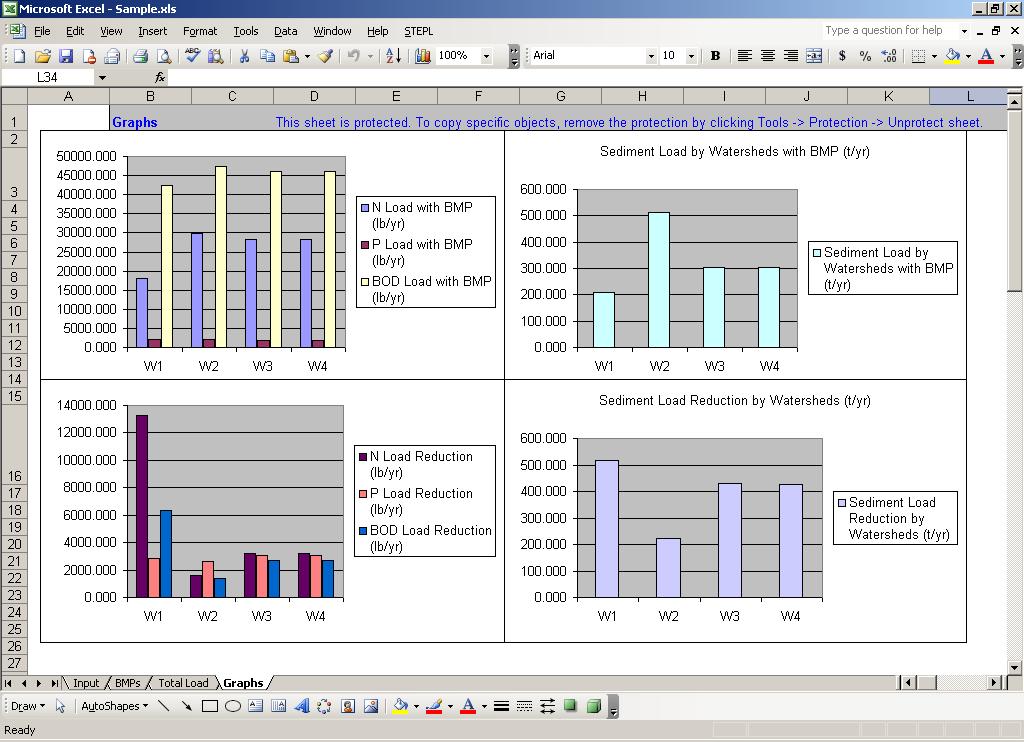
21 Example of Simple Model Application Spreadsheet Tool for Estimating Pollutant Load (STEPL) Employs simple algorithms to calculate nutrient and sediment loads from different land uses Also includes estimates of load reductions that would result from the implementation of various BMPs Data driven and highly empirical A customized MS Excel spreadsheet model Simple and easy to use

22
23 STEPL Process Sources Cropland Urban Runoff Pasture Load before BMP BMP Load after BMP Forest Erosion/ Sedimentation Feedlot Others STEP 1 STEP 2 STEP 3 STEP 4
24
25
26
27
28
29

30 Stream flow vs pollutants: always interesting....
31

32 T.C. Stiles, 2001; B.Cleland, 2002

33 But do your data measure up? What are the data quality objectives? Do you have a comprehensive picture? How old are your sampling results? Can you move forward with what you have?

34 Data quality objectives Quantify or qualify how good data must be to achieve the goals of monitoring / assessment Described in terms of: precision accuracy representativeness comparability completeness

35 Accuracy & precision Both needed to reflect true water body condition Can be biased away from target Addressed by following protocols, using field blanks, spiked samples in lab
36 Completeness, representativeness, and comparability Collecting all samples planned Collecting samples that represent true condition of the water body During various seasons, flows? Following sampling protocols? Confidence in comparing different data sets Use similar data quality objectives Avoids differences in methods, accuracy, precision
37 Comprehensiveness Do you have a clear picture of the problems? Land use, cover, and watershed activities indicate likely pollutants Biological assessments provide excellent screening info DO, ph, temp are primary parameters Conductivity, pesticides, herbicides, metals, and bacteria help to refine & focus results
 more useful Developing watersheds require")
 Note new or altered NPDES")
38 Age and applicability Data age considerations Stable land use & cover make older data (5-7 yrs) more useful Developing watersheds require newer data (2-4 years old) Rapidly developing watersheds may be difficult to characterize (apply LID & BMPs) Note new or altered NPDES discharger info

39 Volunteer derived data Credibility is improved when: Volunteers are trained by professionals Sampling and analytical procedures match accepted protocols Sampling is conducted under a Quality Assurance Project Plan
40 Volunteer vs agency data ( )
41
42
Analyzing Data to Characterize Your Watershed. November 29, Thomas Davenport
 Analyzing Data to Characterize Your Watershed November 29, 2017 Thomas Davenport tedavenport@comcast.net 1 Steps in the Watershed Planning and Implementation Process 2 Incorporation of the nine minimum
Which Data Are Important And Why? Barry Tonning Tetra Tech
 Which Data Are Important And Why? Barry Tonning Tetra Tech Last week... In-stream monitoring parameters Chemical, physical, biological Including in-stream habitat parameters Bank area assessment Vegetation,
Linda Cooper, Eno River State Park, Durham, NC
 Linda Cooper, Eno River State Park, Durham, NC 2 Rivers and Streams All 50 states, 2 interstate river commissions, American Samoa, Guam, Puerto Rico, the District of Columbia (collectively referred to
Stormwater Management in Your Backyard: Stormwater 101
 Stormwater Management in Your Backyard: Stormwater 101 Gregory Rusciano Program Associate, Water Resources Rutgers Cooperative Extension New Jersey Sea Grant Extension Program How much water do we have?
How is Water Quality Affected by Land Use?
 Watershed Connections Lesson Les4 3 How is Water Quality Affected by Land Use? Overview What are the benefits of a healthy watershed? What are examples of land uses? What types of pollution can come from
Lake Creek Watershed Management Plan Public Meeting. Arrowhead Lake May 3, :00 PM
 Lake Creek Watershed Management Plan Public Meeting Arrowhead Lake May 3, 2018 6:00 PM Agenda I. Welcome and Introductions II. III. IV. Watershed Basics Overview of Lake Creek Watershed Elements of a Successful
Lynda Hall. ASDWA Webinar Using Clean Water Act Funding For Source Water Protection January 19, 2012
 ASDWA Webinar Using Clean Water Act Funding For Source Water Protection January 19, 2012 Lynda Hall Chief, Nonpoint Source Control Branch Environmental Protection Agency Office of Wetlands, Oceans and
The Purpose and Scope of this Guidance
 Introduction The nation s aquatic resources are among its most valuable assets. While environmental protection programs in the United States have successfully improved water quality during the past 25
Spreadsheet Tool for Estimating Pollutant Loads. Models & Decision Support Tools Forum Penn State, Harrisburg, PA August 1, 2011
 Spreadsheet Tool for Estimating Pollutant Loads Models & Decision Support Tools Forum Penn State, Harrisburg, PA August 1, 2011 What is STEPL? A customized MS Excel spreadsheet model Simple and easy to
Regional Watershed Planning. Calumet Summit 2010: A Call to Connect Calumet Conference Center April 27, 2010
 Regional Watershed Planning Calumet Summit 2010: A Call to Connect Calumet Conference Center April 27, 2010 Basins The Calumet Region Watershed Communities Land Cover- 2006 Impervious Cover 303d Listed
Status of Water Quality in Ohio: The 2018 Integrated Report. April 25, 2018
 Status of Water Quality in Ohio: The 2018 Integrated Report April 25, 2018 Today s Topics Overview of the 2018 Integrated Report Purpose and requirements Assessment overview Differences from the 2016 Integrated
The Clean Water Act: Phase I
 Nearly 40 percent of all surveyed bodies of water in the U.S. do not meet the Environmental Protection Agency s (EPA s) water quality standards because of untreated polluted runoff that is often discharged
Summary of Water Quality Assessments for Each Waterbody Type. National Summary Water Quality Attainment in Assessed Rivers and Streams
 Summary of Water Quality Assessments for Each Waterbody Type National Summary Water Quality Attainment in Assessed Rivers and Streams National Summary Designated Use Support in Assessed Rivers and Streams*
Pollutants in our Waters
 Pollutants in our Waters CARIWIN Advanced Course in IWRM September 17, 2007 Apurva Gollamudi Brace Centre for Water Resources Management McGill University It isn t the pollution that s harming the environment.
Chapter 5 Goals and Objectives of the Watershed
 Chapter 5 Goals and Objectives of the Watershed 5.1 Goals for the Watershed 5.2 Objectives for the Watershed Goals 5.2.1 Water Quality Impairments 5.2.2 Preserving and Protecting Designated Areas 5.2.3
Reservoir age, increasing human population,
 B-6249 02/12 Eagle Mountain Watershed Management Brent Clayton, Justin Mechell, David Waidler and Clint Wolfe* Reservoir age, increasing human population, and changing land uses have prompted the development
Today s Webinar: Types of Monitoring and Assessment Data and What They Mean
 Welcome to the 1 st Webinar in the Series Monitoring & Assessment for Watershed Plans: Identifying, Accessing, and Using Data to Protect and Restore Indiana s Waters Each Monday in May at noon Today s
Appendix X: Non-Point Source Pollution
 Appendix X: Non-Point Source Pollution Sources Nonpoint source of pollution, unlike pollution from industrial and sewage treatment plants, comes from many different sources. Nonpoint source pollution is
Paul J. Pickett (co-author) Siana Wong (principal author) Washington State Department of Ecology AWRA National Conference Tysons Corner, VA
 Siana Wong (principal author) Washington State Department of Ecology AWRA National Conference Tysons Corner, VA") An Assessment of Nonpoint Pollution in Washington State Paul J. Pickett (co-author) Siana Wong (principal author) Washington State Department of Ecology AWRA National Conference Tysons Corner, VA November
An Assessment of Nonpoint Pollution in Washington State Paul J. Pickett (co-author) Siana Wong (principal author) Washington State Department of Ecology AWRA National Conference Tysons Corner, VA November
TMDLs & Storm Water. Connecting the Pieces. Minnesota PCA Technical Workshop St. Paul, MN. February 14, Discussion Lead: Bruce Cleland
 TMDLs & Storm Water Connecting the Pieces Minnesota PCA Technical Workshop St. Paul, MN February 14, 2006 Discussion Lead: Bruce Cleland Office of Wetlands, Oceans & Watersheds -- Watershed Branch 1200
Models Overview: Purposes and Limitations
 Models Overview: Purposes and Limitations Pollutant load originates from: Point-source discharges (NPDES facilities) Info is available on the discharges (DMRs, etc.) Some are steady-flow, others are precip-driven
Summary of Basin Characteristics and Facilities. General Land-use Characteristics: Withdrawal and Discharge Sites: Sampling Site Statistics:
 This report was prepared by the Kentucky Water Research Institute as a product of the statewide Kentucky Watershed Management process. Information presented in this report was collected from many sources.
DC STORMWATER PLAN CONSOLIDATED TOTAL MAXIMUM DAILY LOAD (TDML) IMPLEMENTATION PLAN
 IMPLEMENTATION PLAN") DC STORMWATER PLAN CONSOLIDATED TOTAL MAXIMUM DAILY LOAD (TDML) IMPLEMENTATION PLAN CONTENTS Introduction 1 The Challenge 5 The Solution 7 Tracking Progress 11 What can you do? 15 INTRODUCTION The DC Stormwater
DC STORMWATER PLAN CONSOLIDATED TOTAL MAXIMUM DAILY LOAD (TDML) IMPLEMENTATION PLAN CONTENTS Introduction 1 The Challenge 5 The Solution 7 Tracking Progress 11 What can you do? 15 INTRODUCTION The DC Stormwater
Role of Soils in Water Quality. Mike Marshall Extension Associate Texas A&M-Institute of Renewable Natural Resources
 Role of Soils in Water Quality Mike Marshall Extension Associate Texas A&M-Institute of Renewable Natural Resources Water Quality in Texas Water is a finite resource that can be impaired by pollution from
Watershed BMPs. Notes from NRCS online site on BMPs. Focus on key BMPs
 Notes from NRCS online site on BMPs http://www.nrcs.usda.gov/technical/standards/nhcp.html Focus on key BMPs Function, benefits, and drawbacks listed Definition Novotny & Olem: BMPs are methods and practices
CASE STUDY OF INTEGRATED WATER QUALITY APPROACH IN CINCINNATI WATERSHED
 CASE STUDY OF INTEGRATED WATER QUALITY APPROACH IN CINCINNATI WATERSHED DR. TING LU DEPUTY INTEGRATED PLANNING LEAD WET WEATHER IMPROVEMENT PROGRAM EVEN DURING DRY WEATHER, E. COLI HAS EXCEEDED THE WATER
OKLAHOMA DEPARTMENT OF ENVIRONMENTAL QUALITY PUBLIC NOTICE. June 24, 2010 AVAILABILITY OF DRAFT BACTERIA TMDL FOR THE BIRD CREEK AREA WATERSHED
 Steve Thompson Executive Director OKLAHOMA DEPARTMENT OF ENVIRONMENTAL QUALITY Brad Henry Governor PUBLIC NOTICE June 24, 2010 AVAILABILITY OF DRAFT BACTERIA TMDL FOR THE BIRD CREEK AREA WATERSHED REQUEST
Summary of Basin Characteristics and Facilities. General Land-use Characteristics: Withdrawal and Discharge Sites: Sampling Site Statistics:
 -Digit Watershed Identity Number: 28 This report was prepared by the Kentucky Water Research Institute as a product of the statewide Kentucky Watershed Management process. Information presented in this
Long Prairie River Watershed Restoration and Protection Strategies (WRAPS) Report Summary
 Report Summary") Long Prairie River Watershed Restoration and Protection Strategies (WRAPS) Report Summary Minnesota has adopted a watershed approach to address the state s 80 major watersheds (denoted by 8-digit hydrologic
Long Prairie River Watershed Restoration and Protection Strategies (WRAPS) Report Summary Minnesota has adopted a watershed approach to address the state s 80 major watersheds (denoted by 8-digit hydrologic
Fact Sheet. Chesapeake Bay Water Quality
 Fact Sheet Chesapeake Bay Water Quality Water quality is a critical measure of the Chesapeake Bay s health. For the Bay to be healthy and productive, the water must be safe for people and must support
Recommended Best Management Practices Bacteria
 Recommended Best Management Practices for Bacteria Total Maximum Daily Load Fact Sheet About Bacteria as an Indicator Water quality degradation due to bacteria pathogen pollution is a major concern in
2017 Agricultural Water Quality Workshop
 2017 Agricultural Water Quality Workshop Focus Area Lower Lewis and Clark Clatsop SWCD has identified this area as one that needs much improvement This does not mean we can t do projects in other areas
Grand Traverse Bay Watershed Protection Plan:
 Grand Traverse Bay Watershed Protection Plan: An Overview Sarah U Ren Program Director The Watershed Center 231-935-1514, suren@gtbay.org The Grand Traverse Bay Watershed 973 square miles Bay Volume =
Boulder Elkhorn TMDL Project. TMDL Document Public Comment Meeting June 27, 2013
 Boulder Elkhorn TMDL Project TMDL Document Public Comment Meeting June 27, 2013 Presentation Outline: What are TMDLs? Boulder Elkhorn TMDL Project Area What s in a TMDL document? Sediment Overview Temperature
Chesapeake Bay s Problems
 Environmental Issues for the Chesapeake Bay Russ Perkinson Virginia State Feed Association Conference February 16, 2011 Chesapeake Bay s Problems Congressional appropriation of $27 million for six year
Stormwater Programs. BIA Meeting June 5, Jason Uhley
 Stormwater Programs BIA Meeting June 5, 2014 Jason Uhley Chief of Watershed Protection Riverside County Flood Control and Water Conservation District Presentation Outline Clean Water Act Stormwater Program
Implementation of. Storm Water Phase II
 Implementation of Storm Water Phase II In implementing the Clean Water Act, EPA requires that all owners/operators of small MS4s reduce the discharge of pollutants from a regulated system to the maximum
Water Pollution. Dr. Sireen Alkhaldi/ Community Medicine
 Water Pollution Dr. Sireen Alkhaldi/ Community Medicine Water Situation 85% of the world population lives in the driest half of the planet (United Nations, 2013) 1 billion people do not have access to
PROTECTING OUR WATERWAYS: STORMWATER POLLUTION REDUCTION EFFORTS
 PROTECTING OUR WATERWAYS: STORMWATER POLLUTION REDUCTION EFFORTS Public Information Meeting ~ May 2, 2018 Public Works Stormwater Management Division OVERVIEW Surface Water Quality Protection Municipal
Linking Land Use to Water Quality
 Title Slide Title Slide Linking Land Use to Water Quality NEMO Intro/Credit Slide This educational slide show has been created by the NEMO Project at the University of Connecticut Cooperative Extension
Funding, Progress, and Other Issues Regarding Agricultural Nonpoint Source Pollution
 Funding, Progress, and Other Issues Regarding Agricultural Nonpoint Source Pollution Paul Van Lenten, Jr. Legislative Fiscal Analyst November 14, 2012 1 What is Nonpoint Source Pollution? Nonpoint source
Jason R. Vogel, Ph.D., P.E. Biosystems and Agricultural Engineering Oklahoma State University
 Stormwater 101 OKLAHOMA STATE UNIVERSITY Biosystems and Agricultural Engineering Department Jason R. Vogel, Ph.D., P.E. Biosystems and Agricultural Engineering Oklahoma State University Stormwater is excess
WATERSHED MANAGEMENT IN MINNESOTA. GOVERNANCE, PLANNING, AND FUNDING June 19, 2018 Cedar Rapids, Iowa
 WATERSHED MANAGEMENT IN MINNESOTA GOVERNANCE, PLANNING, AND FUNDING June 19, 2018 Cedar Rapids, Iowa GOVERNANCE - WD 1955 Watershed Act (MN Statute 103D) Local petition to form VOLUNTARY watershed district
OKLAHOMA DEPARTMENT OF ENVIRONMENTAL QUALITY PUBLIC NOTICE. January 24, 2008 AVAILABILITY OF DRAFT BACTERIA TMDL FOR THE NEOSHO RIVER BASIN
 Steve Thompson Executive Director OKLAHOMA DEPARTMENT OF ENVIRONMENTAL QUALITY Brad Henry Governor PUBLIC NOTICE January 24, 2008 AVAILABILITY OF DRAFT BACTERIA TMDL FOR THE NEOSHO RIVER BASIN REQUEST
Grand Traverse Bay Watershed Protection Plan:
 Grand Traverse Bay Watershed Protection Plan: An Overview Sarah U Ren Program Director The Watershed Center 231-935-1514, suren@gtbay.org What is a Watershed? A watershed is an area of land that captures
Lower Howard Creek W atershed Watershed Number:
 W atershed Watershed Number: 5255 Location Map Bourbon Lexington Ú Clark Mount Sterling Ú Fayette %g 6 Montgom ery %g927 %g 75 %g 8 %g 923 %g927 58 %g9 %g337 %g92 3 %g92 3%g 627 Ú W inchester %g9 7 %g89
Nonpoint Source Pollution A Challenge to Control
 Nonpoint Source Pollution A Challenge to Control Connecticut Envirothon Aquatics Workshop January 14, 2017 Presented by Denise Savageau Conservation Director, Town of Greenwich Point Source Pollution is
Appendix D: Visual aids and handouts for graphing lessons
 Appendix D: Visual aids and handouts for graphing lessons Macroinvertebrate Graphing Activity Amount Stonefly Caddisfly Beetle Cranefly Midge Leech 41 Water Pollution Graphing Activity Amount Sediment
Grants Pass Water Quality Monitoring
 Grants Pass Water Quality Monitoring 2003-2005 Rogue Valley Council of Governments April 2005 Rogue Valley Council of Governments Natural Resources Department 155 North First Street Central Point, Oregon
PUBLIC NOTICE. July 6, AVAILABILITY OF DRAFT BACTERIA TMDLs FOR THE WASHITA RIVER AREA WATERSHED REQUEST FOR PUBLIC COMMENTS
 PUBLIC NOTICE July 6, 2012 AVAILABILITY OF DRAFT BACTERIA TMDLs FOR THE WASHITA RIVER AREA WATERSHED REQUEST FOR PUBLIC COMMENTS Public Comment Period Ends: August 20, 2012 The Oklahoma Department of Environmental
Streamlines V2, n2 (May 1997) A Newsletter for North Carolina Water Supply Watershed Administrators
 A Newsletter for North Carolina Water Supply Watershed Administrators") Page 1 of 5 STREAMLINES A Newsletter for North Carolina Water Supply Watershed Administrators Volume 2, Number 2 May 1997 Non-Point Source (NPS) Pollution This issue of Streamlines provides basic information
Page 1 of 5 STREAMLINES A Newsletter for North Carolina Water Supply Watershed Administrators Volume 2, Number 2 May 1997 Non-Point Source (NPS) Pollution This issue of Streamlines provides basic information
BUREAU OF CLEAN WATER
 COMMONWEALTH OF PENNSYLVANIA DEPARTMENT OF ENVIRONMENTAL PROTECTION BUREAU OF CLEAN WATER NATIONAL POLLUTANT DISCHARGE ELIMINATION SYSTEM (NPDES) STORMWATER DISCHARGES FROM SMALL MUNICIPAL SEPARATE STORM
Site Condition Evaluation & Environmental Benefits Report
 Site Evaluation & Environmental Benefits Report Background The New York State Conservation Reserve Enhancement Program is a collaborative effort between the USDA and the State of New York. The goal of
Analysis of Effectiveness of Ohio NRCS Practice Standards in Addressing Five Leading Causes of Water Quality Impairment
 Analysis of Effectiveness of Ohio NRCS Practice Standards in Addressing Five Leading Causes of Water Quality Impairment March 1, 2010 By: Rick Wilson, Environmental Specialist, Ohio EPA -Division of Surface
Deep River-Portage Burns Waterway Initiative Cost-Share Program
 Deep River-Portage Burns Waterway Initiative Cost-Share Program Submitted: Northwestern Indiana Regional Planning Commission- May 2016 1. Project s executive document summary number: A30-3-12 2. Watershed
Science Enhanced Scope and Sequence Grade 6. Water Quality
 Water Quality Strand Topic Living Systems Investigating water quality Primary SOL 6.7 The student will investigate and understand the natural processes and human interactions that affect watershed systems.
Mill Creek W atershed Watershed Number:
 W atershed Watershed Number: 5153 Location Map W arsaw Milton %g 1 Trimble Bed ford %g %g 31 6 %g Ca rrollto n Ca rroll Presto nville %g %g 7 5 9 %g 7 1 %g 38 9 Ghe nt W orthville Watershed %g 7 1 Owe
Streaming to Cleaner Water
 Streaming to Cleaner Water A look at the past, present and future Doug Wetzstein Watershed Division February 23, 2013 Clean Water Act Federal Clean Water Act 72 Goal fishable/swimmable by 1983 Framework
Quittapahilla Creek Watershed Implementation Plan
 Quittapahilla Creek Watershed Implementation Plan Introduction Founded in 1997, the Quittapahilla Creek Watershed Association has been working with landowners, private organizations and public agencies
Impervious Cover as a Indicator and Tool of Watershed Protection
 Impervious Cover as a Indicator and Tool of Watershed Protection Tom Schueler Director of Watershed Research & Practice Center for Watershed Protection Ellicott City, MD trs@cwp.org Key Themes A. The strength
City of Texarkana, Arkansas. Storm Water Pollution
 City of Texarkana, Arkansas Storm Water Pollution STORM WATER GUIDE What is Storm Water Pollution? Stormwater can provide a toxic discharge which can enter into a lake, river or coastal water system. As
Flow-Based Surrogate TMDLs, A Case Study in Ohio
 Lower Grand River TMDL January 2012 This fact sheet describes the characteristics of a good surrogate total maximum daily load (TMDL) and the factors that should be considered when selecting a surrogate
6. Pollutant Sources in
 6. Pollutant Sources in 45 6. Pollutant Sources in the Plum Creek Watershed The LDC analysis for Plum Creek indicates that both point and nonpoint sources contribute pollutants in the watershed. Identifying
Salem River Water Quality
 Slide 1 Salem River Water Quality Salvatore Mangiafico County Environmental and Resource Management Agent Cooperative Extension of Salem and Cumberland Counties This presentation will review some information
Guidance for Developing a Stormwater Wasteload Allocation Implementation Plan for Bacteria Total Maximum Daily Loads
 Guidance for Developing a Stormwater Wasteload Allocation Implementation Plan for Bacteria Total Maximum Daily Loads DEPARTMENT OF THE ENVIRONMENT 1800 Washington Boulevard, Suite 540 Baltimore MD 21230
orking Trees for Water Quality
 W Agroforestry orking Trees for Water Quality Working Trees: a partner in watershed management. Agroforestry helps to protect water quality while achieving both landowner and community objectives. Water
Pollution Reduction Plan For Municipal Separate Storm Sewer System
 Pollution Reduction Plan For Municipal Separate Storm Sewer System West Chester University of Pennsylvania September 2017 Table of Contents Purpose and Scope Permit Requirements Pollution Reduction Conclusion
Eutrophication: Tracing Nutrient Pollution Back to Penns Creek
 Eutrophication: Tracing Nutrient Pollution Back to Penns Creek Nutrients are substances that life depends on for growth and reproduction. However, when these nutrients enter our planets waterways in excess,
Nonpoint Source Storm Water Management Plan
 Nonpoint Source Storm Water Management Plan Christine Pomeroy Dept. of Civil & Environnmental Eng. University of Utah Carl Adams Watershed Protection Utah Division of Water Quality Definitions Nonpoint
Decentralized Wastewater Treatment in Texas Watersheds
 Decentralized Wastewater Treatment in Texas Watersheds Bruce Lesikar Texas A&M University System Overview Surface water resources Water Quality Standards Watershed Management Programs Identifying Sources
Integrated Watershed Restoration in Urban Areas
 Integrated Watershed Restoration in Urban Areas Jarrod Karl, Hazen and Sawyer SESWA 2016 Annual Conference Presentation Outline Urban Watershed Challenges Tools for Addressing Impairments Ways of Achieving
City of Albany, Oregon. Willamette Basin TMDL Implementation Plan
 City of Albany, Oregon Willamette Basin TMDL Implementation Plan July 1, 2013 - June 30, 2018 TABLE OF CONTENTS BACKGROUND... 1 LOCATION IN THE WATERSHED... 1 SCOPE AND SUMMARY OF TMDL IMPLEMENTATION PLAN...
Chesapeake Bay TMDL Report Outline Reevaluation Technical Workgroup Conference Call September 3, Attachment A
 Last updated September 1, 2009 Cover Disclaimer Executive Summary Contents Tables Figures Foreward Preface Acknowledgements Acronyms and Abbreviations Chesapeake Bay TMDL Report Outline Reevaluation Technical
Communicating Models to Stakeholders. Nikki Dictson Texas Water Resources Institute
 Communicating Models to Stakeholders Nikki Dictson Texas Water Resources Institute Communicating to Stakeholders Throughout the process, there is a continuous need to inform, engage, and motivate water
A Primer on Stormwater Management, your Facility and the Chesapeake Bay. Tom Schueler Chesapeake Stormwater Network June
 A Primer on Stormwater Management, your Facility and the Chesapeake Bay Tom Schueler Chesapeake Stormwater Network June 5. 2017 Key Themes Why do we need to be concerned about Stormwater? What are all
St. Joseph River Watershed 319 Project Technical Subcommittee November 3, 2003 Meeting Summary DRAFT
 St. Joseph River Watershed 319 Project Technical Subcommittee November 3, 2003 Meeting Summary DRAFT Attendees Sandra Nordmark, FOTSJR Steve Blumer, USGS Water Resources Division Todd Kesselring, Elkhart
Plum Creek. The Plum Creek Watershed. Your Water, Your Home. Watershed Partnership
 The Watershed Your Water, Your Home, Extension Water Quality Program Specialist I Mark McFarland, Professor and Extension Specialist Nikki Dictson, Extension Water Quality Program Specialist II Department
The effects of pollution. What is stormwater runoff? Why is stormwater runoff a problem?
 What is stormwater runoff? Stormwater runoff occurs when precipitation from rain or snowmelt flows over the ground. Impervious surfaces like driveways, sidewalks, and streets prevent stormwater from naturally
CARANCAHUA BAY WATERSHED PROTECTION PLAN. Allen Berthold, Michael Schramm November 2, 2017
 CARANCAHUA BAY WATERSHED PROTECTION PLAN 1 Allen Berthold, Michael Schramm November 2, 2017 Today s Meeting 1. Introductions and recap of last meeting 2. Water quality in Carancahua Bay and West Carancahua
5. Pollutant Sources in the Lower Nueces River Watershed
 5. Pollutant Sources in the Lower Nueces River Watershed As mentioned in Chapter 4, SELECT analysis was developed to estimate pollutant loading, primarily bacteria, based on LULC and animal populations.
SANTA CLARA VALLEY WATER DISTRICT. Safe Clean Water and Natural Flood Protection Program
 SANTA CLARA VALLEY WATER DISTRICT Safe Clean Water and Natural Flood Protection Program Prioritization and Implementation of Pollution Prevention and Reduction Activities Plan to Address Impaired Water
Developing Interim Milestones & Criteria to Measure Progress. Thomas E. Davenport
 Developing Interim Milestones & Criteria to Measure Progress Thomas E. Davenport davenport.thomas@epa.gov We Cannot Solve The Problems That We Have Created With The Same Thinking That Created Them --Albert
CHAPTER 4 WATERSHED PLAN GOALS & OBJECTIVES
 4.0 Introduction CHAPTER 4 WATERSHED PLAN GOALS & OBJECTIVES After the watershed analysis had been completed, the next step in the planning process followed by the group was to come up with goals and objectives
What is an illicit discharge?
 What is an illicit discharge? The EPA defines an illicit discharge as any discharge to the municipal separate storm sewer system (MS4) that is not composed entirely of stormwater, except for discharges
Niantic River Watershed Protection Plan
 Niantic River Watershed Protection Plan ORIGINS OF THE NIANTIC RIVER WATERSHED PROJECT The Niantic River Watershed Protection Plan resulted from development of Connecticut s Coastal Nonpoint Source Pollution
Water Pollution Overview. Sewage dumping
 Water Pollution Water Pollution Overview Sewage dumping Ocean Pollution Water Pollution Overview Urban Water Pollution Water Pollution Overview Water Pollution Overview Urban Runoff Water Pollution Overview
Norwalk Harbor Report Card
 Norwalk Harbor Report Card C+ Following the water s trail from your house, into the river, and to the Harbor The way land is used in a watershed has a significant effect on water quality. In areas where
Water Pollution. Chapter 20
 Water Pollution Chapter 20 Water Pollution Comes from Point and Nonpoint Sources Water pollution Any chemical, biological, or physical change in water quality that harms living organisms or makes water
Shell Rock River Watershed: Water Plans
 Shell Rock River Watershed: Water Plans The Shell Rock River Watershed encompasses Freeborn County. Each county has developed a 10-year rotating comprehensive local water management plan (LWMP) in order
Pennsylvania Pequea and Mill Creek Watershed Section 319 National Monitoring Program Project
 Pennsylvania Pequea and Mill Creek Watershed Section 319 National Monitoring Program Project Figure 36: Pequea and Mill Creek (Pennsylvania) Watershed Project Location 231 T-1 C-1 T1-3 T-4 C1-2 T2-3 T-2
Holly Creek W atershed Watershed Number:
 W atershed Watershed Number: 529 Location Map Pow ell Watershed Morgan W olfe Cam pton %g33 55 %g249 %g9 9 %g 82 %g 49 Magoffin Fincastle %g2 28 %g 5 %g 26 %g2 %g 6%g 5 54 %g82 %g 25 %g 37 8 Lee Beattyville
WELCOME!!! POST CONSTRUCTION BMP INSPECTOR CERTIFICATION INTRODUCTION, PART 1 WHY POST CONSTRUCTION BMP INSPECTION TRAINING?
 WELCOME!!! 2 of 11 Your presenter for today s session POST CONSTRUCTION BMP INSPECTOR CERTIFICATION INTRODUCTION, PART 1 WHY POST CONSTRUCTION BMP INSPECTION TRAINING? Dan Hitchcock, Ph.D., P.E. Associate
THE WATERSHED The watershed is an area of land that drains into a stream. This includes both the surface runoff and groundwater. Because a stream is m
 Understanding Streams A stream is the product of its watershed. Good land use in the watershed will be reflected in the stream. MOST PEOPLE enjoy the captivating qualities of flowing water. But streams
Overview of Proposed Amendments to NR 151
 MAMSWaP Quarterly Meeting Overview of Proposed Amendments to NR 151 Jim Bertolacini WDNR Storm Water Program Topics (discussion focused on non-ag elements of rule) Historical background Overview of current
Quarterly Progress Meeting May Toxic Contaminants Research Outcome Scott Phillips, USGS Vice Chair of TCW
 Quarterly Progress Meeting May 2018 Toxic Contaminants Research Outcome Scott Phillips, USGS Vice Chair of TCW Toxic Contaminants: -Threats to human health -Degrade fish and wildlife Logic: Contaminant
Wisconsin Wastewater Operators Association. Protecting Our Water Resources: The Future Bill Hafs - NEW Water 10/2014
 Wisconsin Wastewater Operators Association Protecting Our Water Resources: The Future Bill Hafs - NEW Water 10/2014 The Fox River Contributes 1/3 of All Nutrients to Lake Michigan APRIL 15, 2011 Photo
Understanding Nutrients and Their Affects on the Environment
 Understanding Nutrients and Their Affects on the Environment Humans & Ecosystems Humans are just like ecosystems, too much or too little of a nutrient is bad for the system. Nutrient management is a balancing
Stormwater Runoff & Pesticides What Monitoring Done Elsewhere May Suggest for South Portland
 Stormwater Runoff & Pesticides What Monitoring Done Elsewhere May Suggest for South Portland South Portland City Council Workshop 8/8/16 Fred Dillon Stormwater Program Coordinator Stormwater 101 What stormwater
Appendix E : Guidelines for Riparian Buffer Areas
 Appendix E : Guidelines for Riparian Buffer Areas This document should be read in conjunction with the CRCA Planning Policy. 1.0 PURPOSE The purpose of this document is to summarize the recommendations
Conservation Practices for Water Quality: Sediment & Nutrient Control. Trap Sediments/Trap Nutrients on the Field. Improve Soil Health.
 Conservation Practices for Water Quality: Sediment & Nutrient Control. Trap Sediments/Trap Nutrients on the Field. Improve Soil Health. Sediment Conservation Cover Cover Crop Critical Area Planting Field