Energy Q&A. NAESB, 8 April 2015 BEG/CEE-UT, 1
|
|
|
- Ralf Jones
- 5 years ago
- Views:
Transcription


1 Energy Q&A NAESB, 8 April 2015 BEG/CEE-UT, 1
2 PRICE TRENDS BEG/CEE-UT, 2
3 Oil Price History $160 $140 $120 Cushing, OK WTI Spot Price FOB (Dollars per Barrel) Europe Brent Spot Price FOB (Dollars per Barrel) WTI-Brent Spread "Arab Spring" 2010 $10 Saudi Market $5 Share Strategy II 2014 $0 Price, $/BBL $100 $80 $60 $40 $20 Saudi Market Share Strategy I, 1986 Desert Storm, 1990 USD Neutral Asia Financial Collapse, China "Coming Out: Party, Iraq War, U.S.-Europe Financial Collapse, USD Neutral US LTO Glut -$5 -$10 -$15 -$20 -$25 WTI minus Brent, $/BBL $0 -$30 CME/NYMEX, EIA, CEE compilation BEG/CEE-UT, 3
4 Gas Price History $16 $14 Henry Hub Monthly Average Spot Price ($/MMBtu) Avg Feb 89-Feb 92 ($1.61) Avg Mar 92-Dec 98 ($2.11) U.S. shale gas drilling boom U.S. shale oil drilling boom $12 $10 $8 Avg Jan 99-Dec 01 ($3.46) Avg Jan 02-Sep 09 ($6.32) Avg Oct 09-Present ($3.83) GOM Hurricane Events El Paso pipeline explosion, Carlsbad, NM August 19, 2000 California market failure, Peak LNG imports with new regas capacity March-August 2007 Feb 2007, "Henry Hub at $3 or $5 published (Foss, OIES NG 18) Dec 2011, "Henry Hub at $3 or $10 published (Foss, OIES NG 58) $6 $ Energy Policy Act $2 Enron bankruptcy December 4, 2001 Lehman Brothers bankruptcy September 15, 2008 $0 Feb-89 Feb-90 Feb-91 Feb-92 Feb-93 Feb-94 Feb-95 Feb-96 Feb-97 Feb-98 Feb-99 Feb-00 Feb-01 Feb-02 Feb-03 Feb-04 Feb-05 Feb-06 Feb-07 Feb-08 Feb-09 Feb-10 Feb-11 Feb-12 Feb-13 Feb-14 Feb-15 CME/NYMEX, EIA, CEE compilation BEG/CEE-UT, 4
5 Price Drivers and Expectations Oil Saudi/GCC market share strategy and demand response US LTO surplus (condy) Iran, Iraq current/potential capacity, 9 MMBD (black oil) ST still price shoes to drop, MT long recovery ( at least 5 years until see $100 oil, if), 1990s scenario Gas Domestic drivers: unmotivated producers, motivated customers Policy impacts NAM trade ST already see effects of oil price, MT wellhead value likely sustained by HH BEG/CEE-UT, 5
6 PRODUCTION BEG/CEE-UT, 6
7 Shales: A Quick History Long history of production from shales example, Antrim in Michigan Upper Bakken vertical wells drilled, 1976 Upper Bakken horizontal wells drilled, 1987 Mitchell Energy drills vertical wells in Barnett (Texas) in 1989 Baker Hughes acquires Eastman Christensen for horizontal drilling tool and other technology 1990 National Petroleum Council seminal natural gas supply study points to role of non-conventional sources (CBM, shale, tight sands), 1992 Chevron drills Barnett vertical wells and improves measures of oil and gas in place (OGIP) measures, 1997 Mitchell absorbs CVX talent, demonstrates hydraulic fracturing, use of 3-D seismic, slick water frac Devon acquires Mitchell, 2002, spawns a series of transactions that expanded or created new unconventional players BEG/CEE-UT, 7
8 Perspective Helps Everybody looked at that technology (Mitchell Energy) was developing of hydraulic fracturing and said it doesn t work, said Devon Energy s co-founder and chief executive officer, Larry Nichols recalls in a company video here. It s old, it s tired... there s nothing there. Everyone knows that. Don t waste your time. From The Energy Fix, Jim Pierobon, 5 August BEG/CEE-UT, 8
9 *Feeling the need the need for shale: Oil 350,000 Federal OCS--Gulf of Mexico Field Production Midwest (PADD 2) Field Production Gulf Coast (PADD 3) Field Production U.S. Field Production of Crude Oil 300, ,000 Production from shale is about 70% of U.S. total Thousand Barrels 200, , ,000 Mainly West Texas and Eagle Ford 50,000 Mainly Bakken 0 Top Gun BEG/CEE-UT, 9
10 Feeling the need the need for shale: Gas 35,000,000 Canada remains about 10% of total dry gas supply 30,000,000 Now 50% of production Million Cubic Feet 25,000,000 20,000,000 15,000,000 10,000,000 Onshore (Conventional) CBM Shale 5,000,000 - Offshore (Federal, State) Note: 2014 data are estimates Gross withdrawals; CEE based on EIA and other sources BEG/CEE-UT, 10
11 Do producers like to lose money? Oil 50% 40% Y-Y Chg U.S. Crude Oil Production Y-Y Chg WTI Initial shale oil tests 200% 150% 30% 20% 100% Y-Y Chg Production 10% 0% -10% 50% 0% Y-Y Chg WTI -20% -30% Many reasons for recent production growth including: lease requirements, hedging, need to sustain cash flows -50% -100% BEG/CEE-UT, 11
12 Do producers like to lose money? Gas 20% 15% Y-Y Chg U.S. Natural Gas Marketed Production Y-Y Chg Henry Hub Dry Gas production drop 300% with low gas price 250% 10% 200% Y-Y Chg Production 5% 0% -5% 150% 100% 50% 0% Y-Y Chg HH -10% -15% -50% AG production surge with high oil price -100% BEG/CEE-UT, 12

13 Eagle Ford Shale BEG/CEE-UT, 13
 from all wells drilled in the Middle Bakken from")
14 Bakken Shale: Middle Bakken TudorPickeringHolt & Co. Note: Represents cumulative 12-month production (mboe) from all wells drilled in the Middle Bakken from Source: ESRI, Drilling Info, TPH Research BEG/CEE-UT, 14
15 Bakken Shale: Three Forks TudorPickeringHolt & Co. Note: Represents cumulative 12-month production (mboe) from all wells drilled in the Three Forks from Source: ESRI, Drilling Info, TPH Research BEG/CEE-UT, 15
16 Shale Oil View: TPH Comments on Bakken Industry focused on driving down well costs over the last few years after costs surged on tight service capacity and accelerated drilling programs. With held by production (HBP) commitments met and well costs reduced 15-20%, the industry focused in earnest on optimizing completions. While drilling efficiencies may continue to improve, many operators saw spud to total depth (TD) times approaching 20 days, making additional drilling cost reductions harder to achieve. One size will NOT fit all. Operators testing a variety of completion designs across the basin with a particular interest in slickwater fracs and a trend towards larger volumes of smaller mesh proppant. In general, better quality acreage is the focus of new completions designs. Tests expanding into Tier 2 positions. Ceramics: To use or not to use? That is the question. Some operators in the deeper part of the basin are doubling down and increasing ceramic use, while others are shifting their capital in favor of larger volumes of sand (100 mesh and #40/70 mesh sand). Completions being tested Slickwater hydraulic fracturing Increased proppant volumes: 2-10x standard completions in the basin Increased stage count combined with higher density clusters on plug and perf designs BEG/CEE-UT, 16
")
17 Barnett Shale BEG Shale Gas Resource Assessment (Sloan Foundation) BEG/CEE-UT, 17

 BEG/CEE-UT,")
18 Haynesville Shale OGIP free Productivity Overpressured BEG Shale Gas Resource Assessment (Sloan Foundation) BEG/CEE-UT, 18
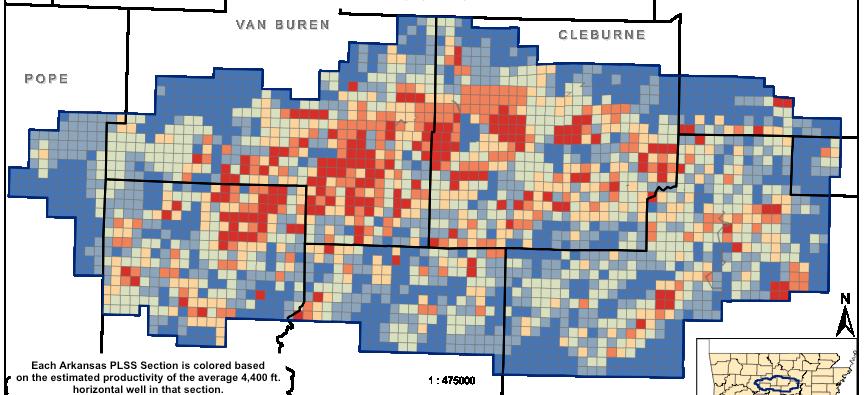
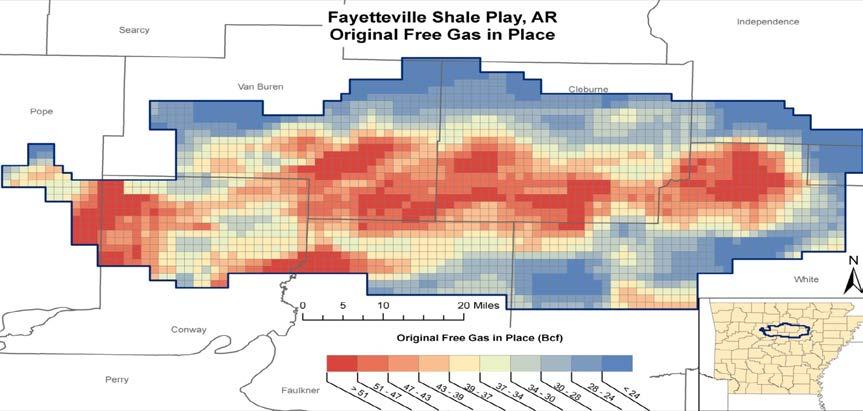


19 Fayetteville Shale OGIP free Natural Fractures Productivity BEG Shale Gas Resource Assessment (Sloan Foundation) BEG/CEE-UT, 19
20 Type Curves and Costs: Preliminary Results Do not cite BEG Shale Gas Resource Assessment (Sloan Foundation) BEG/CEE-UT, 20
21 Well Economics $18 $16 $14 $12 $10 $8 $6 $4 $2 Barnett Low Btu Barnett High Btu Fville Shallow Fville Medium Fville Deep Hville PA Dry PA Wet PA Rich Do not cite $0 Tier 1 Tier 2 Tier 3 Tier 4 Tier 5 Tier 6 Tier 7 Tier 8 Tier 9 Tier 10 What matters most: Costs (depth & length), by-products (ng vs. liquids), taxes. BEG Shale Gas Resource Assessment (Sloan Foundation) BEG/CEE-UT, 21
22 Tcf / year Production Sensitivity to Price 6$/MMBtu EIA price 4$/MMBtu Do not cite We expect liquids rollover to follow a similar, perhaps faster, path BEG Shale Gas Resource Assessment (Sloan Foundation) BEG/CEE-UT, 22
23 ECONOMICS BEG/CEE-UT, 23

24 Wellhead BE does not necessarily = Company BE Fast NPV attractive to investors Companies need enough tails to support business Continuous outlays of capital Onshore shale oil and offshore deep water can demonstrate comparable returns over time ainabilitypossible/shale-bubble/ 3% Challenge for companies is building robust portfolios Companies report only best wells ( 3% of total ) Company portfolios are highly variable (acreage, liquids, recovery, cost) Companies routinely deploy 100% of capital across portfolios in which, on average, 80% of production comes from 20% of fracs 67% 30% Best Wells, NPV>0 BE Wells, NPV=0 Worst Wells, NPV<0 BEG/CEE-UT, 24
25 Upstream Matters! Part Deux We add 2014 reporting data and affirm key considerations going forward Our sample represents the top tier of U.S. producers including leading shale players. We have *restated work from earlier research for changes to our sample and methodology The 15 publicly traded companies we use comprise 68% of Top 40 gas producers (NGSA.org) and 33% of U.S. marketed natural gas production In this snapshot including 2014 reporting we state results mainly in barrel of oil equivalent terms Overall, while FD capex has dropped, largely a result of increased volumes, cash costs remain substantial and stubborn High Cost Producer Average Low Cost Producer High Cost Producer Average Low Cost Producer High Cost Producer Average Low Cost Producer High Cost Producer Average Low Cost Producer High Cost Producer Average Low Cost Producer High Cost Producer Average Low Cost Producer $0 $20 $40 $60 $80 $100 3-Yr MA FD Costs/3-Yr MA Additions ($/BOE) Annual Cash Costs per Bbl of Production ($/BOE) FD = capital spending for exploration and development, calculated on a 3-year basis and applied to 3-year reserve additions as a moving average (MA) Cash cost = current year lease operating expense, general and administra tive, marketing, taxes (including state production tax), interest on debt, applied to current year production The cheapest producers are also the gassiest smaller companies that, for the most part, did not move out of gas and into liquids because of cost and capital constraints. BEG/CEE-UT, 25 *
26 How much spending? With what results?? 3-Year Capex Spending ($MM) $300,000 15,167 $250,000 11,969 3-Year Reserve Additions (MMBOE) 16,000 14,409 13,767 14,000 12,107 12,000 In the complex commodity markets of today, U.S. producer performance and cost is increasingly relied upon as a guide to possible floor prices and longer term price trends. We use 3 year rolling total FD spending against 3 year reserve additions to reach FD/BOE. The capex requirements to high grade upstream, especially shale, portfolios has been considerable, exceeding $270 billion by Substantial write downs and impairments were taken in 2012 (slide 3) as a result of the steep fall in gas prices. Reductions in capex are discernible when 2013 data are added but rose again in We use cash cost against current production for cash cost/boe. Companies have grown production on a BOE basis by about 22 percent since Natural gas remains the dominant proportion of production streams but 2014 showed a marked shift. This pattern holds when we compare our results to other research. 9 of the 15 companies in our sample are predominantly gas producers (50 to nearly 100 percent of production) including 6 that are among the shale specialists and 1 integrated major. Capex Total Production (MMBOE) $200,000 8,993 10,000 $150,000 8,000 $270,763 $210,908 $228,185 $100,000 $224,103 $241,876 6,000 $170,556 4,000 $50,000 2,000 $ U.S. Total Production (MMBOE) Ratio of Natural Gas:Total U.S. Production 3,000 64% 2,500 2,000 1,500 1, % 62% 2,466 2,511 61% 61% 2,380 60% 2,215 2,059 59% 2,036 58% 57% 56% 54% 53% 52% 50% Additions Natural Gas Split % BEG/CEE-UT, 26
27 Bonus: Sources of Additions 8,000 6,000 Most booked additions come from drilling out acreage as opposed to improved recovery. 4,000 2, ,000-4,000 Purchases of Reserves (MMBOE) Extensions & Discoveries (MMBOE) Improved Recovery (MMBOE) Total Revisions (MMBOE) BEG/CEE-UT, 27
28 Computing Returns U.S. producers have demonstrated success in key shale plays but it is not an easy business. In BOE terms, on average and as of 2014, the full cycle cost for our sample is close to $50 per BOE with a 10 percent return assumed. However, a 10 percent return does not provide sufficient recovery of capital spent in a current year. Alternatively, we use a return equal to capex spent that year against current production. With the alternative criteria imposed, the average full cycle cost for 2014 was about $80 per BOE. We believe this suggests an oil price signal of at least $80 is needed to sustain activity for our sample and the industry. We note that many producers realize considerably less than the traded domestic oil prices. Condensate, the main component of many production streams, typically sells $20-25 below West Texas Intermediate. Overall, the industry remains predominantly cash flow negative. Companies have had to spend capital well above cash flow from operations to replace production and improve leasehold positions. With lower oil prices companies are working to adjust capital spending to fall within cash flows. $50 $40 $30 $20 $10 $0 $100 $80 $60 $40 $20 $0 10% Return ($/BOE) Annual Cash Costs per Bbl of Production ($/BOE) 3-Yr MA FD Costs/3-Yr MA Additions ($/BOE) Return of Current Capex ($/BOE) Annual Cash Costs per Bbl of Production ($/BOE) 3-Yr MA FD Costs/3-Yr MA Additions ($/BOE) BEG/CEE-UT, 28
29 Implications for Gas While the pressure is on from oil prices, the implications for natural gas are more interesting to consider. With a 10 percent return assumed, the minimum back to producers and their investors, the implied natural gas price is close to $8 per million Btu (MMBtu). However this only returns a portion of current capex. To return 2014 capex producers would have needed an implied price of more than $13, on average. Much of the incremental gas supply for the U.S. in recent years has come in association with liquids production or where enough ethane is present and can be captured to justify drilling in nonassociated (dry) gas locations. Perhaps as much as 50 percent or more of U.S. gas supply is linked to liquids prices. As a result, oil prices are being watched closely for hints about gas supply and price impacts. Our full report with 2014 data is forthcoming in April $9 $8 $7 $6 $5 $4 $3 $2 $1 $0 $18 $16 $14 $12 $10 $8 $6 $4 $2 $0 10% Return ($/MCFE) Annual Cash Costs per Bbl of Production ($/MCFE) 3-Yr MA FD Costs/3-Yr MA Additions ($/MCFE) Henry Hub Spot Price $ Return of Current Capex ($/MCFE) Annual Cash Costs per Bbl of Production ($/MCFE) 3-Yr MA FD Costs/3-Yr Additions ($/MCFE) Henry Hub Spot Price $ BEG/CEE-UT, 29
30 Bonus: It Takes an Industry An industry leader with an early shift to liquids 100% 90% 80% 70% 60% 50% 40% 30% 20% 10% 0% U.S. NGL Production (MMBOE) U.S. Gas Production (MMBOE) $120 $100 $80 $60 $40 $20 $ EOG Resources U.S. Oil and Liquids Production (MMBOE) U.S. Total Production (MMBOE) Return of Current Capex ($/BOE) Annual Cash Cost ($/BOE) 3-Yr MA FD Costs ($/BOE) 0 Note: Began separating oil and NGLs in % 90% 80% 70% 60% 50% 40% 30% 20% 10% % U.S. NGL Production (MMBOE) U.S. Oil and Liquids Production (MMBOE) $70 $60 $50 $40 $30 $20 $10 $0 A successful gassy player U.S. Gas Production (MMBOE) Range Resources U.S. Total Production (MMBOE) 71 Return of Current Capex ($/BOE) Annual Cash Costs ($/BOE) 3-Yr MA FD Costs ($/BOE) BEG/CEE-UT, 30

31 Comparative View Capex exceeds cash flows Bernstein Research BEG/CEE-UT, 31

32 Comparative View and has done so historically Bernstein Research BEG/CEE-UT, 32
33 Weighted Average NOC Breakeven Costs* ($/BOE) $120 $100 $94 $101 $80 $60 $40 $65 $76 $81 $80 10% ROI Annual Cap. Exp. $20 $ *10% ROI represented 30% of capital expenditures CEE analysis based on company reports BEG/CEE-UT, 33
34 Weighted Average NOC Breakeven Costs ($/BOE) $120 $100 $80 $60 $40 $ $94 $ Annual Cap. Exp. Fiscal Contribution Cash Op. Exp. Find. & Dev. Costs $20 $ CEE analysis based on company reports BEG/CEE-UT, 34
35 NOC Breakeven Costs 2013 ($/BOE) $200 $180 $160 $140 $120 $100 $80 $60 $40 $20 $0 $78 $8 $8 $96 $98 $119 $120 $12 $107 $145 $18 Cap. Exp. Fiscal Contribution Cash Op. Exp. Find. & Dev. Costs *Ecopetrol production taxes included in production costs **CNOOC capital expenditures increased from $12 billion in 2012 to $41 billion CEE analysis based on company reports BEG/CEE-UT, 35
36 DEMAND BEG/CEE-UT, 36
37 World Oil Demand (MBD) Governments are seizing the opportunity to eliminate subsidies North Amwerica Europe & Erasia Central & South America North America Africa & Mid East Asia-Pacific Based on data from EIA BEG/CEE-UT, 37
38 A strong demand stack scenario TCF LNG Exports 2030 = 1.0 (EIA ER = 3.5) Pipe Exports 2030 = 3.9 (EIA ER = 3.4) LNG exports CEE Pipeline exports CEE Power generation CEE Power 2030 = 15.9 (EIA ER = 10.1) CEE assumes all possible EPA actions Industrial 2030 = 8.8 (EIA ER = 8.5) Industrial CEE Other (Res, Comm, Trans) EIA ER Dec 2013 Total demand CEE High Case 5 Other 2030 = 10.8 (residential+ commercial 10.5) Total supply EIA ER Dec 2013 CEE analysis; EIA ER refers to EIA 2014 Early Release, Dec 2013 (reference case) BEG/CEE-UT, 38
39 Industrial Demand: Robust Plans BCFD Steel MTG Hydrogen Chlor-Alkali Methanol Nitrogen fertilizers Propylene Polyethylene Ethylene Base Demand (2012) CEE s industrial projects inventory BEG/CEE-UT, 39
40 Gas Demand by Region, End User BCFD Steel MTG Hydrogen Chlor-Alkali Methanol Nitrogen fertilizers Propylene Polyethylene Ethylene 0 LA TX Rest of US CEE s industrial projects inventory BEG/CEE-UT, 40
41 Investment by Region $billion LA Rest of US TX CEE s industrial projects inventory BEG/CEE-UT, 41
42 Projects by Region Project type LA Rest of US TX Total Chlor-Alkali Ethylene GTL Hydrogen Methanol MTG Nitrogen fertilizers Polyethylene Propylene Steel Grand Total BEG/CEE-UT, 42
43 Drivers: Relative Prices BEG/CEE-UT, 43
44 Drivers: BEG/CEE-UT, 44
45 Power: Competing Views Based on data from EIA AEO 2013 and IHSE BEG/CEE-UT, 45
 Announced about 29 GW (2014-2020) BEG/CEE-UT,")
46 Coal Retirements About 50 GW of coal capacity may retire by 2020 Almost 21 GW already retired (mostly older units) Announced about 29 GW ( ) BEG/CEE-UT, 46

47 Nuclear Relicensing? 4 recent announcements, more possible but our modeling does not retire nuclear units 5,500 MW in 3 plants under construction BEG/CEE-UT, 47

48 Resulting Scenario on Gas Use in Power Incorporates a higher, more volatile gas price. BEG/CEE-UT, 48
 Value chain integrity supporting infrastructure ( both")
 Streamline existing process for long term optionality (exports, imports) Transport modes, risks, policy/regulatory considerations Perception of risk view: less drilling =")
49 Exports: The Crude Oil Debate Is exporting crude oil a problem?? yes no Upstream economics, impacts on wellhead value Regulatory efficiency (political risk of alternative approaches) Value chain integrity supporting infrastructure ( both regulatory process and infrastructure are so 70s ) Enough companies can get exemptions, approvals Revoke EAA or remove all hydrocarbon components (chance of success?) Streamline existing process for long term optionality (exports, imports) Transport modes, risks, policy/regulatory considerations Perception of risk view: less drilling = less production = fewer nuisances and hazards Quick fix to add condensate to CCL (or remove, whichever is correct) BEG/CEE-UT, 49
50 TRADE BEG/CEE-UT, 50


51 O Canada! Getting Their Dander Up Enbridge Eastern Access TransCanada Energy East BEG/CEE-UT, 51

52 Gas Exports: The Future? 2013: U.S. is 29% of Canadian consumption 2013: U.S. is 29% of Mexican consumption ~2x current NA exports by 2020? ~9+ BCFD Map presents a possible gas flow scenario, Foss, Ch. 3 in Pricing Internationally Traded Gas, Oxford, 2012; gas trade data from EIA BEG/CEE-UT, 52
53 LNG: Europe or Asia? Neither? 12 JCC Feb NBP April JKM April Europe Europe Europe Asia Asia Asia Henry Hub Liquefaction Shipping JKM JCC NBP Pertamina, Endesa SA, Iberdrola, EDF, EDP, Gas Natural fenosa, Woodside Energy Trading have signed PSA for $3.50/MMBtu BEG/CEE-UT, 53
54 Is U.S. LNG Competitive? $/MMBtu $10 Japan pre- Fukushima $9-11 NBP Regasification Shipping Liquefaction Field to Terminal Henry Hub Sep 14 NBP $ $14-19 Asia spot The Attraction "Reality" High Cost Delivery to Atlantic Basin High Cost Delivery to Pacific Basin Sep 14 LNG $ Super High Cost Delivery to Pacific Basin mpetitive.pdf BEG/CEE-UT, 54
55 OTHER BEG/CEE-UT, 55

56 Impact of anchoring Dan Ariely, Predictably Irrational, 2009 BEG/CEE-UT, 56
57 Predictable irrationality Anchor prices, arbitrary coherence Herding, self-propelling Perception of value with anchoring Persistence of perception with herding Impact of initial decision on future expectations Price manipulation (by both private market participants and governments) Dan Ariely, Predictably Irrational, 2009 BEG/CEE-UT, 57
58 In short, we re a mess Illusion of truth Confirmation bias Hindsight bias Halo effect Sunk-cost fallacy Loss aversion Self-serving Lady Macbeth effect Framing Availability heuristic We re more likely to believe a familiar statement Tendency to favor information that confirms our beliefs Duh! principle One trait influences others as we make judgments They matter (!), because we are more afraid of incurring losses than acquiring gains, and we ll happily claim responsibility for success more often than failure, but just to be sure Out, damn spot! We have blinders and silos Predict frequency based on how easily an example comes to mind BEG/CEE-UT, 58


59 In love with fear itself Beard/dp/ /ref=sr_1_1?s=books&ie=UTF8&qi d= &sr=1-1&keywords=paranoiaca BEG/CEE-UT, 59
60 Why this stuff matters It is much easier [and] more enjoyable to identify and label the mistakes of others than to recognize our own Most of our judgments and actions are appropriate most of the time We are often confident even when we are wrong In at least some cases, an accurate diagnosis may suggest an intervention to limit the damage that bad judgments and choices often cause BEG/CEE-UT, 60
")

61 unusual (but not unprecedented) Texas Insider; Mulvaney, et.al., BEG/CEE-UT, 61


62 Courtesy Dr. John Christy, NOAA-University of Alabama Huntsville, above as appeared in Wall Street Journal, right as appeared in What s Up with That. BEG/CEE-UT, 62
 in the context of natural")
63 Dynamic Earth Sea Surface Temp. Although warming of the northeastern Antarctic Peninsula began around 600 years ago, the high rate of warming over the past century is unusual (but not unprecedented) in the context of natural climate variability over the past two millennia. JRI Ice Core Temp. Mean (black lines are estimates of open water based on sediment cores) BAS Ice Core Temp. Mulvaney, et.al., Nature 11391; SOTU 2014 BEG/CEE-UT, 63

64 The Role of Science BEG/CEE-UT, 64

65 The 6X Gap BEG/CEE-UT, 65
66 An Impact (Scale) 5 Energy GHG (Climate) 4 Energy Security Web Envt (Land, Water) 0 Safety Coal Natural Gas LNG Nuclear Envt (Air) Reliability Hydroelectric Solar, Wind (grid-based) Solar, Distributed Market Friendly BEG/CEE-UT, 66
67 An Energy Web GHG (Climate) Impact (Scale) Energy Security 2 1 Envt (Land, Water) 0 Safety Coal Natural Gas LNG Nuclear Hydroelectric Envt (Air) Reliability Solar, Wind (grid-based) Solar, Distributed Market Friendly BEG/CEE-UT, 67
68 Contact Information All work in progress is located on CEE address - energyecon@beg.utexas.edu BEG/CEE-UT, 68
Major Challenges for Gas: What Can be Expected for Mexico?
 Major Challenges for Gas: What Can be Expected for Mexico? Gas Future Forum, Mexico, April 3, 2014 BEG/CEE UT, 1 Overall Observations Resources Reserves Deliverability Deliverability is key Sweet spot
Five Things You Should Know
 Bureau of Economic Geology, Jackson School of Geosciences, The University of Texas at Austin Five Things You Should Know Tx Industries of the Future, March 7, 2013 M.M. Foss, 9/25/2012, BEG/CEE-UT, 1 #1
Going through Another Cycle
 Global Rig Count Down 5 Since Nov ; Recent Uptick Driven by North America Capital spending cut significantly IEA: $583 billion upstream (25% less than ) IEA: Further 24% drop expected in 216 Going through
US Energy Independence & Energy Exports
 US Energy Independence & Energy Exports Fred C. Beach, Ph.D. Earth Wind & Fire Conference Addison, TX. 4 October, 2014 10/12/2014 1 Global Consumption Trends 2011 Energy Consumption, + 2.5% OEDC, Down
Paradoxically Abundant?
 Paradoxically Abundant? Mayer Brown, Houston, April 1, 2014 BEG/CEE UT, 1 200 180 140 120 Simon Erlich Wager Metals & Minerals Non Fuel 160 Energy 100 80 2010=100 120 60 40 20 0 Do cartels succeed? It
AIChE: Natural Gas Utilization Workshop Overcoming Hurdles of Technology Implementation
 AIChE: Natural Gas Utilization Workshop Overcoming Hurdles of Technology Implementation Natural Gas in the United States: An Overview of Resources and Factors Affecting the Market November 2, 216 Justin
Natural Gas Trends LNG 17 NYC, June 28, 2011
 Bureau of Economic Geology, The University of Texas at Austin Natural Gas Trends LNG 17 NYC, June 28, 211 Balancing Our Energy Future What do we want? Safe, clean, affordable, (abundant) energy Reduced
Oil and natural gas: market outlook and drivers
 Oil and natural gas: market outlook and drivers for American Foundry Society May 18, 216 Washington, DC by Howard Gruenspecht, Deputy Administrator U.S. Energy Information Administration Independent Statistics
Trends, Issues and Market Changes for Crude Oil and Natural Gas
 Trends, Issues and Market Changes for Crude Oil and Natural Gas East Iberville Community Advisory Panel Meeting Syngenta September 26, 2012 Center for Energy Studies David E. Dismukes, Ph.D. Center for
Natural Gas Issues and Emerging Trends for the Upcoming Winter and Beyond
 Natural Gas Issues and Emerging Trends for the Upcoming Winter and Beyond 2013 NASEO WINTER ENERGY OUTLOOK CONFERENCE November 1, 2013 Kevin Petak Vice President, ICF International Kevin.Petak@icfi.com
Natural Gas Abundance: The Development of Shale Resource in North America
 Natural Gas Abundance: The Development of Shale Resource in North America EBA Brown Bag Luncheon Bracewell & Giuliani Washington, D.C. February 6, 2013 Bruce B. Henning Vice President, Energy Regulatory
An INDEPENDENT energy consulting company since 1996 No affiliation with any marketer, broker, agent, utility, pipeline or producer.
 An INDEPENDENT energy consulting company since 1996 No affiliation with any marketer, broker, agent, utility, pipeline or producer. More than two decades of experience in the natural gas and electric industries
Winter U.S. Natural Gas Production and Supply Outlook
 Winter 2012-13 U.S. Natural Gas Production and Supply Outlook Prepared for Natural Gas Supply Association by: ICF International Fairfax, Virginia September, 2012 Introduction This report presents ICF s
Oil and Gas in 2018: Markets, Spending, Projects. Bob Tippee Editor, Oil & Gas Journal Rice Global E&C Forum March 9, 2018
 Oil and Gas in 2018: Markets, Spending, Projects Bob Tippee Editor, Oil & Gas Journal Rice Global E&C Forum March 9, 2018 For discussion Oil and gas markets will have a transformative year OPEC wants to
The US shale revolution and its economic impact
 The US shale revolution and its economic impact Sylvie Cornot-Gandolphe Groupe Idées, Rueil Malmaison, 16 mars 2015 1 The US shale revolution and its economic impact 1. Shale gas Coal-to-gas switching
The Really Big Game Changer: Crude Oil Production from Shale Resources and the Tuscaloosa Marine Shale
 The Really Big Game Changer: Crude Oil Production from Shale Resources and the Tuscaloosa Marine Shale Baton Rouge Chamber of Commerce Regional Stakeholders Breakfast June 27, 2012 Center for Energy Studies
U.S. Shale Gas in Context
 U.S. Shale Gas in Context Overview of U.S. Natural Gas production and trends For National Conference of State Legislatures Natural Gas Policy Institute September 9, 215 Pittsburgh, Pennsylvania By Grant
What s Going on With Energy? How Unconventional Oil & Gas Development is Impacting Renewables, Efficiency, Power Markets and All That Other Stuff
 What s Going on With Energy? How Unconventional Oil & Gas Development is Impacting Renewables, Efficiency, Power Markets and All That Other Stuff Atlanta Economics Club Monthly Meeting December 10, 2012
UNDERSTANDING NATURAL GAS MARKETS. Mohammad Naserifard MSc student of Oil & Gas Economics at PUT Fall 2015
 UNDERSTANDING NATURAL GAS MARKETS Mohammad Naserifard MSc student of Oil & Gas Economics at PUT Fall 2015 Table of Contents 3 Overview Natural Gas is an Important Source of Energy for the United States.
Global energy markets
 For Woodrow Wilson Center Global Energy Forum September 21, 215 Washington, DC by Adam Sieminski, Administrator U.S. Energy Information Administration U.S. Energy Information Administration Independent
Energy Prospectus Group
 Energy Prospectus Group Founded in 2001 Current Membership is 530 We have members in 38 states and eight countries ~ 60% of our members live in Texas Mission is to help our members make money Luncheons
Outlook for the Upstream Sector of the Oil and Gas Industry
 Outlook for the Upstream Sector of the Oil and Gas Industry VMA Market Outlook Workshop Chicago, IL Spears & Associates Tulsa, OK August 2015 Million bbls/day 3.5 World Oil Demand Growth/US Oil Supply
North American Midstream Infrastructure Through 2035 A Secure Energy Future. Press Briefing June 28, 2011
 North American Midstream Infrastructure Through 2035 A Secure Energy Future Press Briefing June 28, 2011 Disclaimer This presentation presents views of ICF International and the INGAA Foundation. The presentation
World and U.S. Oil and Gas Production and Price Outlook: To Infinity (or at least 2050) and Beyond
 and Beyond") World and U.S. Oil and Gas Production and Price Outlook: To Infinity (or at least 25) and Beyond Energy and Environment Symposium April 18, 218 Rifle, Colorado by Troy Cook, Senior Global Upstream Analyst,
World and U.S. Oil and Gas Production and Price Outlook: To Infinity (or at least 25) and Beyond Energy and Environment Symposium April 18, 218 Rifle, Colorado by Troy Cook, Senior Global Upstream Analyst,
Winter U.S. Natural Gas Production and Supply Outlook
 Winter 2010-11 U.S. Natural Gas Production and Supply Outlook Prepared for Natural Gas Supply Association by: ICF International Fairfax, Virginia September, 2010 Introduction This report presents ICF s
Natural Gas. Tuesday, May 1, 2012; 4:00 PM 5:15 PM
 Natural Gas Tuesday, May 1, 2012; 4:00 PM 5:15 PM Moderator: Joel Kurtzman, Senior Fellow and Executive Director of the Center for Accelerating Energy Solutions, Milken Institute Speakers: Ralph Eads,
International gas markets: recent developments and prospects
 International gas markets: recent developments and prospects Christopher Allsopp New College Oxford Director, Oxford Institute for Energy Studies December 2012 International gas markets are changing rapidly
U.S. Crude Oil, Natural Gas, and NG Liquids Proved Reserves
 1 of 5 3/14/2013 11:37 PM U.S. Crude Oil, Natural Gas, and NG Liquids Proved Reserves With Data for Release Date: August 1, 2012 Next Release Date: March 2013 Previous Issues: Year: Summary Proved reserves
API Industry Outlook. Third Quarter R. Dean Foreman, Ph.D. Great Plains and EmPower ND Energy Conference October 8, 2018.
 API Industry Outlook Third Quarter 2018 R. Dean Foreman, Ph.D. Chief Economist American Petroleum Institute Great Plains and EmPower ND Energy Conference October 8, 2018 American Updated Petroleum September
The New Superpower : Emerging Supplies of Gas Liquids from the United States
 The New Superpower : Emerging Supplies of Gas Liquids from the United States Lucian Pugliaresi President Energy Policy Research Foundation, Inc. Washington, DC Energy Policy Research Foundation, Inc. 1031
Oil and gas outlook. For New York Energy Forum October 15, 2015 New York, NY. By Adam Sieminski, Administrator. U.S. Energy Information Administration
 Oil and gas outlook For New York Energy Forum New York, NY By Adam Sieminski, Administrator U.S. Energy Information Administration U.S. Energy Information Administration Independent Statistics & Analysis
Framing the Challenge A large independent: I can t run a company on single well economics. The whole portfolio has to make sense. Is there a viable bu
 U.S. and Global Oil & Gas Dynamics IEEJ, June 23, 2016, Tokyo BEG/CEE-UT, 1 Framing the Challenge A large independent: I can t run a company on single well economics. The whole portfolio has to make sense.
Short Term Energy Outlook March 2011 March 8, 2011 Release
 Short Term Energy Outlook March 2011 March 8, 2011 Release Highlights West Texas Intermediate (WTI) and other crude oil spot prices have risen about $15 per barrel since mid February partly in response
Status and outlook for shale gas and tight oil development in the U.S.
 Status and outlook for shale gas and tight oil development in the U.S. for Energy Symposium, University of Oklahoma, Price College Energy Institute Norman, OK by Adam Sieminski, Administrator U.S. Energy
Shale Gas - From the Source Rock to the Market: An Uneven pathway. Tristan Euzen
 Shale Gas - From the Source Rock to the Market: An Uneven pathway Tristan Euzen Shale Gas Definition Seal Conventional Oil & Gas Tight Gas Source Rock Reservoir (Shale Gas) Modified from Williams 2013
Annual Energy Outlook 2017
 Annual Energy Outlook 217 Valve Manufacturers Association of America VMA Technical Seminar 217 March 2, 217 Nashville, TN By, Director, Office of Integrated and International Energy Analysis U.S. Energy
Annual Energy Outlook 2015
 Annual Energy Outlook 215 for Asia Pacific Energy Research Centre Annual Conference 215 Tokyo, Japan by Sam Napolitano Director of the Office of Integrated and International Energy Analysis U.S. Energy
Gas and Crude Oil Production Outlook
 Gas and Crude Oil Production Outlook COQA/CCQTA Joint meeting October 3-31, 214 San Francisco, California By John Powell Office of Petroleum, Natural Gas, and Biofuels Analysis U.S. Energy Information
North American Natural Gas Market Outlook
 North American Natural Gas Market Outlook Energy Trends & Impacts On Gas Infrastructure Prepared For: Gas/Electric Partnership, Conference XVIII Darryl Rogers February 10, 2010 Agenda Introduction to Purvin
ENERGY SLIDESHOW. Federal Reserve Bank of Dallas
 ENERGY SLIDESHOW Updated: July 5, 2018 ENERGY PRICES www.dallasfed.org/research/energy Brent & WTI & Crude Brent Oil Crude Oil Dollars per barrel 140 120 Brent (Jun 29 = $75.24) WTI (Jun 29 = $74.03) 95%
ENERGY SLIDESHOW. Federal Reserve Bank of Dallas
 ENERGY SLIDESHOW Updated: February 14, 2018 ENERGY PRICES www.dallasfed.org/research/energy Brent & WTI & Crude Brent Oil Crude Oil Dollars per barrel 140 Brent (Feb 9 = $65.50) WTI (Feb 9 = $62.01) 120
Comparison of Netbacks from Potential LNG Project with ALCAN Pipeline Project
 Comparison of Netbacks from Potential LNG Project with ALCAN Pipeline Project June 20, 2008 Barry Pulliam Senior Economist Econ One Research 5th Floor 601 W 5th Street Los Angeles, California 90071 213
Outlook for the Oil and Gas Industry
 Outlook for the Oil and Gas Industry VMA Market Outlook Workshop Boston, MA Spears& Associates Tulsa, OK August 2017 1 Outlook for the Oil and Gas Industry: Market Drivers Global oil consumption is forecast
The Evolving Global LNG Industry South Africa Gas Options, Cape Town, 3 rd 5 th October 2016
 The Evolving Global LNG Industry South Africa Gas Options, Cape Town, 3 rd 5 th October 2016 John Mauel Head of Energy Transactions, United States Norton Rose Fulbright US LLP An industry in transformation
Oil & The Economy: Boom-to-Bust and the Impact to States.
 Oil & The Economy: Boom-to-Bust and the Impact to States. Jesse Thompson Business Economist Houston Branch January, 2017 U.S. Oil U.S. Production & Rig Surged Count U.S. crude oil production Million barrels
Energy Markets. U.S. Energy Information Administration. for. October 29, 2015 Golden, Colorado. by Adam Sieminski, Administrator
 Energy Markets for The Payne Institute for Earth Resources at the Colorado School of Mines Golden, Colorado by Adam Sieminski, Administrator U.S. Energy Information Administration U.S. Energy Information
Markets and Opportunities. Paul Burgener March 2015
 Markets and Opportunities Paul Burgener March 2015 Disclaimer Copyright BP Energy Company. All rights reserved. Contents of this presentation do not necessarily reflect the Company s views. This presentation
Power & Politics Navigating the Changing Vision of Our Energy Future. Rayola Dougher, API Senior Economic Advisor,
 Power & Politics Navigating the Changing Vision of Our Energy Future Rayola Dougher, API Senior Economic Advisor, dougherr@api.org U.S. oil and natural gas production is increasing as a result of technological
Industry on the Move - What's Next? What will the changes in energy prices mean to industry in South Louisiana?
 Industry on the Move - What's Next? What will the changes in energy prices mean to industry in South Louisiana? Event Sponsored by Regions Bank and 1012 Industry Report May 5, 2015 David E. Dismukes, Ph.D.
ENERGY OUTLOOK 2017 FALL/WINTER
 ENERGY OUTLOOK 2017 FALL/WINTER With more than 105 years in the energy industry, BOK Financial is committed to helping you succeed. In this issue of the Energy Outlook, you ll learn more about the current
Energy Markets. U.S. Energy Information Administration. for Center on Global Energy Policy, Columbia University November 20, 2015 New York, New York
 Energy Markets for Center on Global Energy Policy, Columbia University New York, New York by Adam Sieminski, Administrator U.S. Energy Information Administration U.S. Energy Information Administration
Short-Term and Long-Term Outlook for Energy Markets
 Short-Term and Long-Term Outlook for Energy Markets Guy Caruso Administrator, Energy Information Administration guy.caruso@eia.doe.gov Fueling the Future: Energy Policy in New England December 2, 25 Boston,
U.S. Energy Market Outlook
 U.S. Energy Market Outlook for Energy Policy Institute National Governor's Association Washington, DC by Howard Gruenspecht, Deputy Administrator U.S. Energy Information Administration Independent Statistics
Unconventional Oil & Gas: Reshaping Energy Markets
 Unconventional Oil & Gas: Reshaping Energy Markets Guy Caruso Senior Advisor JOGMEC Seminar 7 February 2013 Landscape is Changing Even as We Sit Here Today - US Projected to reach 90% Energy Self-Sufficiency
North, South, Texas and the Rest
 North, South, Texas and the Rest CEE Annual Meeting 4 5 December 2013 BEG/CEE UT, 1 Welcome! Agenda highlights and other logistics Introductions Up at Night rules of the game and Chatham House rules for
Drilling Deeper: A Reality Check on U.S. Government Forecasts for a Lasting Tight Oil & Shale Gas Boom. Web Briefing December 9, 2014
 Drilling Deeper: A Reality Check on U.S. Government Forecasts for a Lasting Tight Oil & Shale Gas Boom Web Briefing December 9, 214 J. David Hughes Post Carbon Institute Global Sustainability Research
The State of the Energy Markets
 The State of the Energy Markets February 2015 The Disclaimer The information within this presentation has been compiled by the Melby Group for general purposes only. Melby Group assumes no responsibility
OVERVIEW OF DESERT SOUTHWEST POWER MARKET AND ECONOMIC ASSESSMENT OF THE NAVAJO GENERATING STATION
 OVERVIEW OF DESERT SOUTHWEST POWER MARKET AND ECONOMIC ASSESSMENT OF THE NAVAJO GENERATING STATION ARIZONA CORPORATION COMMISSION APRIL 6, 2017 DALE PROBASCO MANAGING DIRECTOR ROGER SCHIFFMAN DIRECTOR
Shale Gas as an Alternative Petrochemical Feedstock
 Shale Gas as an Alternative Petrochemical Feedstock Tecnon OrbiChem Seminar at KICHEM 2012 Seoul - 2 November, 2012 Roger Lee SHALE GAS WHERE DOES IT COME FROM? Source: EIA SHALE GAS EXPLOITATION Commercial
Contemplations about the future of natural gas: the good, the bad and the ugly
 Contemplations about the future of natural gas: the good, the bad and the ugly Charles F. Mason H.A. True Chair in Petroleum and Natural Gas Economics Department of Economics Associate Dean, College of
U.S. Natural Gas Market Dynamics
 U.S. Natural Gas Market Dynamics University of Houston Global Energy Management Institute The Future of the Gulf Coast Petrochemical Industry Michael Speltz April 29, 2005 ChevronTexaco 2002 Legal Disclaimer
GLOBAL OIL MARKET TRENDS
 GLOBAL OIL MARKET TRENDS Brent timeline and latest forward curve: Prompt prices recovering, back-end more stable ICE Brent crude, historical front month contract price and latest forward curve Our view
Gulf Coast Energy Outlook: Addendum.
 Gulf Coast Energy Outlook: Addendum. Addendum accompanying whitepaper. See full whitepaper here. David E. Dismukes, Ph.D. Gregory B. Upton, Jr., Ph.D. Center for Energy Studies Louisiana State University
Technologies to recover it were refined as natural gas prices rose to $10 per MMBtu Locations of shale gas were known for decades
 Technologies to recover it were refined as natural gas prices rose to $10 per MMBtu Locations of shale gas were known for decades Discovery rates are very high Reduces producer expenses Volume was greatly
Energy markets the short and the long term
 Energy markets the short and the long term Christof Rühl, Chief Economist, BP BP 2012 Outline The economy A year of disruptions Long term implications Conclusion Global growth: slow and on life support
North American Gas: A dynamic environment. Josh McCall BP North American Gas and Power November 16, 2011
 North American Gas: A dynamic environment Josh McCall BP North American Gas and Power November 16, 2011 Disclaimer Copyright BP Energy Company. All rights reserved. Contents of this presentation do not
INTERNATIONAL ENERGY AGENCY WORLD ENERGY INVESTMENT OUTLOOK 2003 INSIGHTS
 INTERNATIONAL ENERGY AGENCY WORLD ENERGY INVESTMENT OUTLOOK 2003 INSIGHTS Global Strategic Challenges Security of energy supplies Threat of environmental damage caused by energy use Uneven access of the
Shale Gas and U.S. LNG Exports. Vienna, January 29, 2013 Jean Abiteboul President, Cheniere Supply & Marketing
 Shale Gas and U.S. LNG Exports Vienna, January 29, 2013 Jean Abiteboul President, Cheniere Supply & Marketing Forward Looking Statements This presentation contains certain statements that are, or may be
By Bob Hugman and Harry Vidas
 WHITE PAPER Oklahoma: A Major Player for Future Hydrocarbon Production By Bob Hugman and Harry Vidas Bottom Line 1. Despite sharp drilling activity declines over the past year in most areas of the country,
The Unconventional Reservoirs Revolution and the Rebirth of the U.S. Onshore Oil & Gas Industry
 The Unconventional Reservoirs Revolution and the Rebirth of the U.S. Onshore Oil & Gas Industry Feb. 19, 2013 Cautionary Statement The following presentation includes forward-looking statements. These
Cheniere Energy Partners, L.P. / Cheniere Energy, Inc. Proposed Sabine Pass LNG Facility Expansion Adding Liquefaction Capabilities.
 Cheniere Energy Partners, L.P. / Cheniere Energy, Inc. Proposed Sabine Pass LNG Facility Expansion Adding Liquefaction Capabilities June 4, 2010 Forward Looking Statements This presentation contains certain
OIL AND GAS OUTLOOK: HOW ARE THE ENERGY MARKET AFFECTING METALS? Nicole Leonard, Project Manager, Oil & Gas Consulting Services November 2015
 OIL AND GAS OUTLOOK: HOW ARE THE ENERGY MARKET AFFECTING METALS? Nicole Leonard, Project Manager, Oil & Gas Consulting Services November 2015 KEY TAKEAWAYS Macroeconomic outlook: Prices have collapsed
Challenges of Fracking for the MENA Region Martin Bachmann, Member of the Board
 Challenges of Fracking for the MENA Region Martin Bachmann, Member of the Board NUMOV German MENA Conference Berlin, 26 January 2017 Simplified Model of Hydrocarbon Deposits Conventional versus Unconventional
A Tale of Two Fuels - Crude Oil and Natural Gas Supply. Private Capital Conference February 24, 2011 Houston, TX
 A Tale of Two Fuels - Crude Oil and Natural Gas Supply Private Capital Conference February 24, 2011 Houston, TX Henry Hub Natural Gas vs. WTI Crude $/MMBTU $14 $12 $10 $8 $6 $4 $2 Henry Hub WTI 160 140
Perspectives on the Impact of Shale Gas and Tight Oil Production on the Global E&C Industry and Vice Versa
 214 RICE GLOBAL E&C ANNUAL FORUM Perspectives on the Impact of Shale Gas and Tight Oil Production on the Global E&C Industry and Vice Versa September 23, 214 www.forum.rice.edu Today s objectives Review
Navigating the Uncertainties in the North American Gas Market
 Interesting Times: Navigating the Uncertainties in the North American Gas Market Ed Kelly Vice President North American Gas and Power Wood Mackenzie Risks and Uncertainties On the Supply Side The Resource
Natural Gas Outlook and Drivers
 Natural Gas Outlook and Drivers November 2012 33% BENTEK Energy 5% 40% Who We Are Based in Evergreen, CO 120 People 400+ Customers Subsidiary of McGraw-Hill/Platts 22% What We Do Collect, Analyze and Distribute
US LNG Supply into Europe. Baltic Energy Summit, Vilnius November 25 th, 2015 Helena Wisden, Cheniere Marketing International
 US LNG Supply into Europe Baltic Energy Summit, Vilnius November 25 th, 2015 Helena Wisden, Cheniere Marketing International Forward Looking Statements This presentation contains certain statements that
Thoughts on U.S. Unconventional Oil Production and Investment Following the Paris Agreement
 Thoughts on U.S. Unconventional Oil Production and Investment Following the Paris Agreement February 16, 2017 KAPSARC/IEF Riyadh, Saudi Arabia Trisha Curtis Co-Founder, PetroNerds, LLC trisha@petronerds.com
Energizing America: Facts for Addressing Energy Policy. Rayola Dougher API Senior Economic Advisor,
 Energizing America: Facts for Addressing Energy Policy Rayola Dougher API Senior Economic Advisor, dougherr@api.org 1970 1975 1980 1985 1990 1995 2000 2005 2010 2015 1970 1975 1980 1985 1990 1995 2000
North America Midstream Infrastructure through 2035: Capitalizing on Our Energy Abundance
 North America Midstream Infrastructure through 2035: Capitalizing on Our Energy Abundance Prepared by ICF International for The INGAA Foundation, Inc. Support provided by America s Natural Gas Alliance
Impact of Shale Gas on Transmission
 Impact of Shale Gas on Transmission February, 08 2012 February, 2012 1 Transco System Overview System Summary 2,000 Mainline Miles from Texas to New York. Approximately 11,000 Miles of Pipeline. Extensive
Milken Institute: Center for Accelerating Energy Solutions
 Milken Institute: Center for Accelerating Energy Solutions Center for Accelerating Energy Solutions Promotes policy and market mechanisms to build a more stable and sustainable energy future Identifies
Rice Global E&C Forum
 Rice Global E&C Forum "Will Shale revolution trigger game changes in Asian Energy Market and LNG?" Tevin Vongvanich President and Chief Executive Officer PTT Exploration and Production Public Company Limited
Summary - The Challenge to European Refining Posed by the Rise of US Unconventionals Scottish Oil Club
 Summary - The Challenge to European Refining Posed by the Rise of US Unconventionals Scottish Oil Club November 2014 About us We are a global leader in commercial intelligence for the energy, metals and
Energy Macro Review. 3 rd Quarter 2013
 Energy Macro Review 3 rd Quarter 2013 Oil Fundamentals 2 $/bbl WTI Oil Prices are Up in 2013 $115 $110 $105 Front Month WTI Prices WTI crude prices are up +11.1% year-to-date. Three factors have driven
Will The Plays Be Commercial? Impact on Natural Gas Price
 North American Shale Gas Will The Plays Be Commercial? Impact on Natural Gas Price Arthur E. Berman Slide 1 Natural Gas Prices Natural gas prices will increase over the next 12-24 months to meet the marginal
Natural Gas, Liquids and Crude Oil Market Outlook North America 2012 and Beyond
 Natural Gas, Liquids and Crude Oil Market Outlook North America 2012 and Beyond August 14th, 2012 On behalf of: for: 1 BENTEK Energy Market Information Agenda: U.S. Supply, Demand and Storage Outlook Macro
Colorado Energy & Environmental Issues. Chris Hansen, PhD Senior Advisor, Janys Analytics Candidate, Colorado House of Representatives
 Colorado Energy & Environmental Issues Chris Hansen, PhD Senior Advisor, Janys Analytics Candidate, Colorado House of Representatives Oil 2 Thousand Barrels per Day U.S. Crude Oil Production & Consumption,
Wood Mackenzie Gas Market Outlook
 Wood Mackenzie Gas Market Outlook Southern Gas Association April 20, 2009 Amber McCullagh Short-Term Outlook 2008 markets were volatile as underlying fundamentals shifted rapidly Three primary phases:
NEXUS Gas Transmission
 NEXUS Gas Transmission Bringing New Supplies to Market Ohio Manufacturers Association - October 2012 Agenda Project Introduction Utica and Marcellus Gas Supply Michigan and Ontario Markets Conclusion &
Energy Outlook. Kurt Barrow Vice President, Oil Markets, Midstream and Downstream Insights, IHS Markit
 Energy Outlook Kurt Barrow Vice President, Oil Markets, Midstream and Downstream Insights, IHS Markit kurt.barrow@ihsmarkit.com Building a Foundation for Profitable Growth in Uncertain Markets Agenda Short-term
US Oil and Natural Gas Perspective
 Presentation to the WEC-Mexican Committee 31 January 2018 US Oil and Natural Gas Perspective Guy Caruso Senior Advisor 1 Source: EIA 2 US Perspective: from Resource Scarcity to. - US is heading towards
Energy in 2011 disruption and continuity
 June 212 bp.com/statisticalreview Energy in 211 disruption and continuity Richard de Caux, Refining Analyst, Group Economics Outline A year of disruptions Energy and the economy Fuel by fuel Concluding
U.S. natural gas and LNG exports
 U.S. natural gas and LNG exports For Hudson Institute Washington DC April 6, 216 By Victoria Zaretskaya Office of Petroleum, Natural Gas, and Biofuels Analysis U.S. Energy Information Administration Independent
Global Energy Assessment: Shale Gas and Oil
 Global Energy Assessment: Shale Gas and Oil KEEI September, 2014 Yonghun Jung Shale Gas: a new source of energy Shale gas deposits around the world vs. 2009 natural gas consumption (tcf) U.S. 862 22.8
U.S. Historical and Projected Shale Gas Production
 U.S. Historical and Projected Shale Gas Production Phyllis Martin Phyllis Martin, Senior Energy Analyst Office of Petroleum, Gas and Biofuels Analysis U.S. Energy Information Administration phyllis.martin@eia.doe.gov
Outlook for the Upstream Sector of the Oil and Gas Industry
 Outlook for the Upstream Sector of the Oil and Gas Industry VMA Market Outlook Workshop San Diego, CA Spears& Associates Tulsa, OK August 2016 Oil market fundamentals remain strong World oil demand is
American Strategy and US Energy Independence
 Cordesman: Strategy and Energy Independence 10/21/13 1 American Strategy and US Energy Independence By Anthony H. Cordesman October 21, 2013 Changes in energy technology, and in the way oil and gas reserves
The U.S. Over-Supply of Oil is Ending
 The U.S. Over-Supply of Oil is Ending Pay-It-Forward Network Art Berman November 17, 217 Slide 1 The U.S. Over-Supply of Oil is Ending The U.S. Over-Supply of Oil is Ending 11 WTI Price Stocks 239 213