CHAPTER 1 A CASE STUDY FOR REGRESSION ANALYSIS
|
|
|
- Brenda Oliver
- 5 years ago
- Views:
Transcription
1 CHAPTER 1 AIR POLLUTION AND PUBLIC HEALTH: A CASE STUDY FOR REGRESSION ANALYSIS 1
2 2
3 Fundamental Equations Simple linear regression: y i = α + βx i + ɛ i, i = 1,, n Multiple regression: y i = p j=1 x ij β j + ɛ i, i = 1,, n The ɛ i are random errors (typically mean 0, common variance σ 2 ) 3
4 QUESTIONS Which variable should be y and which should be x? Should either or both variables be transformed (for example, by taking logarithms) prior to analysis? Is the relationship between y and x linear, or should some nonlinear function be considered? Are there omitted variables whose inclusion might substantially change our conclusions about the form of the relationship? Are there outliers or influential values among either the x or y variables which may be distorting the interpretation of the data? Are the random errors truly independent, of equal variance, and normally distributed? Finally and perhaps most problematically of all having found a relationship between the two variables and tested its statistical significance, can this be taken as evidence of a causal effect? 4
5 Background on Air Pollution and Health It is widely recognized that high air pollution has a significant public health impact However there are many issues that are still debated in the context of present-day air pollution regulations: Which precise pollutants are responsible, eg ozone, sulfur dioxide, fine particulate matter, coarse particulate matter, etc? Is there a threshold effect, ie a safe level below which air pollution essentially has no adverse consequences? Which subsets of the population are most affected, and in what ways (what kinds of deaths or other adverse reactions such as asthma)? Exactly how should one quantify the overall effect? 5
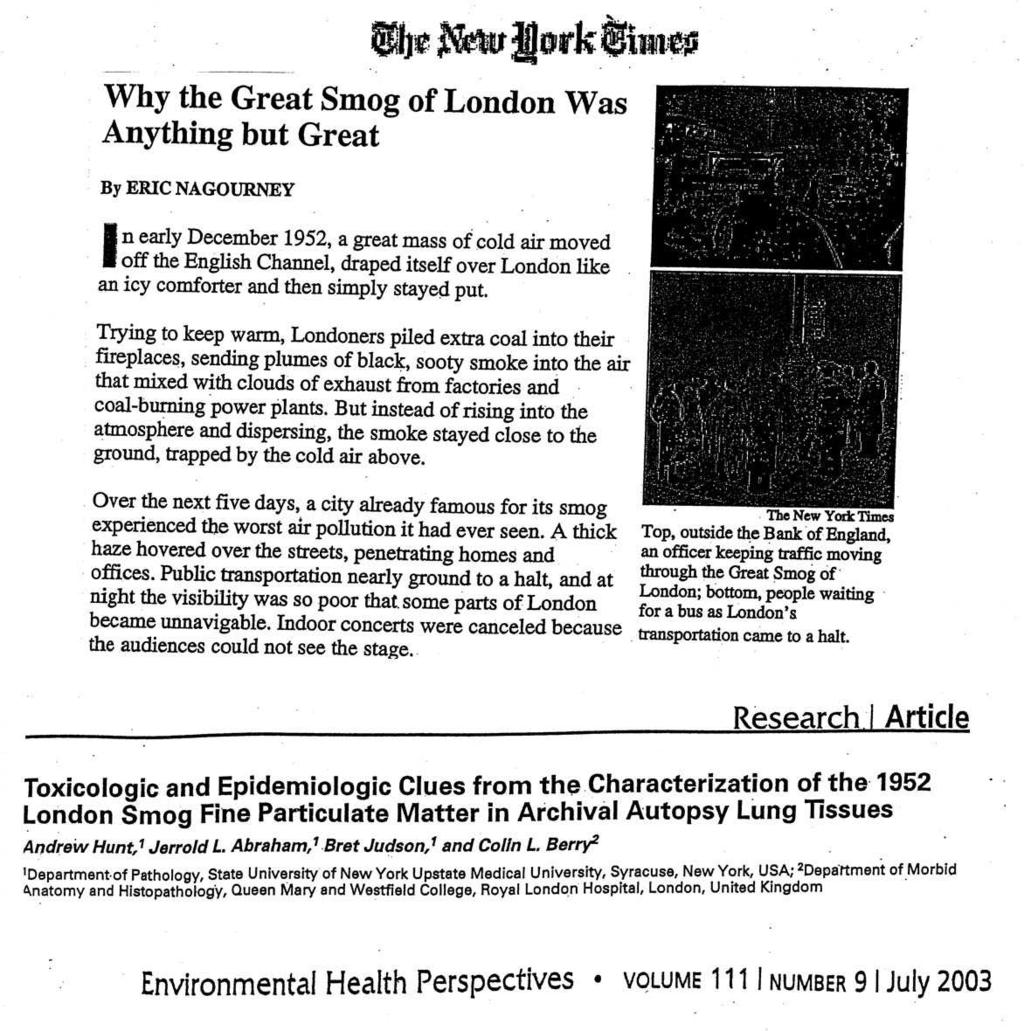
6 Early Studies London in the 1950s Very high air pollution levels (20 30 times current EPA standards?) and sharp rises in deaths (eg the December 1952 smog in London is generally reckoned to have caused 4,000 excess deaths in a 4 5 day period) Graphs of daily deaths versus air pollution levels give some nice simple examples of linear regression relationships Research on what really happened continues up to this day 6
7 7
8 8
9 Plots of data show: Strong visible association between smoke levels (circles) and deaths (black dots) suggestion of a one-day lag (Fig 12) A scatterplot shows a more direct relationship with high correlation (Fig 13) However, more detailed plots from a different smog event show a number of possible complicating factors, eg temperatures were also very low on the days when deaths were high We can also see some distinction among different age groups (Fig 14) Individual scatterplots give more information, but just looking at correlations could be misleading for determining the true causal relationship (Fig 15) Time series over several London winters show gradually decreasing deaths as smoke levels sharply decreased (Fig 16) 9
10 We can also look at scatterplots of the annual aggregated deaths (Fig 17) Note the effect of the outlier due to the very cold 1963 winter
11 10
12 11
13 12
14 13
15 14
16 15
17 Modern Studies of Air Pollution and Health Modern studies apply many of the same methods of analysis to much larger data sets For example, Kelsall et al analyzed a 14- year series of daily mortality and air pollution in Philadelphia They decomposed the observed daily time series of deaths into three components, (a) seasonal and long-term trend, (b) meteorology, (c) air pollution They concluded that even though much of the variability can be attributed to (a) and (b), there is a strong enough residual effect under (c) to conclude that air pollution has a very significant effect, even at levels of air pollution much lower than the infamous London smogs JE Kelsall, JM Samet, SL Zeger and J Xu, American Journal of Epidemiology 146,
18 The present study is based on a re-analysis of the same data and is intended to illuminate many of the issues, including some that remain controversial Figure 18 Time series plot of weekly deaths in Philadelphia, with smoothed lowess curve The vertical dotted lines are placed to indicate the ends of years Figure 19 Scatterplots of daily deaths against four covariates, with fitted subsample averages (the text will describe the details of how these were calculated) TSP is Total Suspended Particulates (this measure has now been replaced in most studies by more specific measures of particles in different size ranges) SO2 is sulfur dioxide 17
19 Deaths Week Deaths Week 18
20 (a) Temperature Deaths (b) Dewpoint Deaths (c) TSP Deaths (d) SO2 Deaths
21 Outline of analysis (more details in Chapter 5): The y variable was taken to be the square root of daily death count The square root transformation is motivated in part by the fact that if the death counts have a Poisson distribution, which seems a reasonable intuitive assumption, then taking square roots stabilizes the variances See Section 53 for a more detailed discussion of transformations Seasonal trend was handled by representing the smooth curve in Fig 18 as a linear combination of 180 fixed basis functions Since we believe that the acute effects of interest occur within at most one week of a high-pollution event, these seasonal covariates should not confound the pollution effect 20
22 Meteorological effects were handled by introducing linear and quadratic terms for both temperature and dewpoint, with additional terms for the range above 75 o F and 60 o F respectively Moreover, to allow for delayed effects of up to four days, the current day s values were supplemented by those lagged from one to four days A variable selection was performed to remove insignificant terms which could still confound the pollution effects we are trying to measure Section 52 in Chapter 5 has more detail on variable selection Five pollutants were introduced both singly and in combination Since we do not know which lags of pollutant are most relevant, we used all possible lags between 0 and 4 days, as well as averages of 2, 3, 4 and 5 consecutive days within this period Among 21
23 the 15 possible exposure measures thus generated, the one with the most significant effect was selected and used in the subsequent analysis Possible data snooping criticisms of this
24 Conclusions The most significant exposure measure for TSP is current day s value The t value (estimate divided by standard error) is 31, which is significant at the (two-sided) level of 002 The most significant exposure measure for SO 2 is current day s value, with t = 33 The most significant exposure measure for NO 2 is the 4-day lagged value, with t = 21 The most significant exposure measure for CO is the average of the 3-day and 4-day lags, with t = 28 The most significant exposure measure for O 3 is the average of the current day s value with those for lags 1 and 2 This leads to t = 29 All of these are statistically significant at the 5% level, but note the selection effect of comparing different measures of exposure and only picking out the most significant 22
25 When different combinations of the variables are included, the results change For instance, with TSP and SO 2 together, the t statistics are 15 (TSP) and 14 (SO 2 ) Other analyses are: TSP, O 3 together: t=28 (TSP), 29 (O 3 ) TSP, SO 2, O 3 together: t=11, 16, 29 TSP, SO 2, NO 2, CO, O 3 all included: t =12, 17, 04, 21, 27 23
26 We can also look for nonlinear relationships between airpollution and mortality, which are fitted by more complicated versions of regression analysis For example, Fig 110 shows some possible piecewise linear relationships between TSP and mortality, suggesting higher slopes at higher TSP levels (relevant to determination of standards) The conclusions about multiple pollutants and nonlinear relationships suggest that the truth about how air pollution affects mortality may be more complicated than a simple linear relationship based on a single pollutant would suggest 24
27 (a) (b) Effect 002 Effect TSP TSP 25
28 Other types of study lead to different types of conclusion For example, Fig 111 is based on a famous prospective study in which adjusted mortality rate was plotted against median level of fine particulate matter in each of 51 cities The difficultes here include that measurement of particulate matter is very imprecise if we are only using a single value to represent a long period of study, and there are many other possible reasons why the deaths rate in these cities might differ (ecological bias problem) Pope, CA, Thun, MJ, Namboodiri, MM, Dockery, DW, Evans, JS, Speizer, FE and Heath, CW (1995), Particulate air pollution as a predictor of mortality in a prospective study of US adults Am J Respir Crit Care Med 151,
29 27
30 Summary of Chapter Air pollution is a major public health issue The relationship between air pollution (particulate matter, sulfur dioxide, etc) can be examined through regression relationships Simple analyses individual-day analyses of high pollution episodes, analyses based on annual summary statistics from long time series are interesting exercises but don t really help understand the full phenomenon Therefore, in recent years attention has move to the daily analyses of long time series which are much more informative, but also pose many complicated problems of interpretation There are other types of data sets (eg prospective studies) that add to the information (and the confusion) 28
Donora, PA, (Source: New York Times, November )
") Donora, PA, 1948. (Source: New York Times, November 2 2008) 1 Air Pollution and Mortality Background of major air pollution incidents Donora, PA, 1948 London, 1952 Consequences: British Clean Air Act 1956
Donora, PA, 1948. (Source: New York Times, November 2 2008) 1 Air Pollution and Mortality Background of major air pollution incidents Donora, PA, 1948 London, 1952 Consequences: British Clean Air Act 1956
Multi-site Time Series Analysis. Motivation and Methodology
 Multi-site Time Series Analysis Motivation and Methodology SAMSI Spatial Epidemiology Fall 2009 Howard Chang hhchang@jhsph.edu 1 Epidemiology The study of factors affecting the health of human populations
New Problems for an Old Design: Time-Series Analyses of Air Pollution and Health. September 18, 2002
 New Problems for an Old Design: Time-Series Analyses of Air Pollution and Health Jonathan M. Samet 1, Francesca Dominici 2, Aidan McDermott 2, and Scott L. Zeger 2 September 18, 2002 1 The Johns Hopkins
Exposure, Epidemiology, and Risk Program, Environmental Health Department, Harvard School of Public Health, Boston, Massachusetts, USA
 Research Article Estimating the Independent Effects of Multiple Pollutants in the Presence of Measurement Error: An Application of a Measurement-Error Resistant Technique Ariana Zeka and Joel Schwartz
The Clean Air Act of 1970 and Adult Mortality
 The Journal of Risk and Uncertainty, 27:3; 279 300, 2003 c 2003 Kluwer Academic Publishers. Manufactured in The Netherlands. The Clean Air Act of 1970 and Adult Mortality KENNETH CHAY UC Berkeley and NBER
Traffic related air pollution and acute hospital admission for respiratory diseases in Drammen, Norway
 European Journal of Epidemiology 18: 671 675, 2003. Ó 2003 Kluwer Academic Publishers. Printed in the Netherlands. RESPIRATORY DISEASES Traffic related air pollution and acute hospital admission for respiratory
T he case-crossover design, introduced by in
 956 ORIGINAL ARTICLE The effects of particulate air pollution on daily deaths: a multi-city case crossover analysis J Schwartz...... Correspondence to: Associate Professor J Schwartz, Harvard School of
Particulate Air Pollution and Mortality in 20 U.S. Cities:
 Particulate Air Pollution and Mortality in 20 U.S. Cities: 1987-1994 Jonathan M. Samet, M.D., M.S., Francesca Dominici, Ph.D., Frank C. Curriero, Ph.D., Ivan Coursac, M.S., and Scott L. Zeger, Ph.D. From
Gasoline Consumption Analysis
 Gasoline Consumption Analysis One of the most basic topics in economics is the supply/demand curve. Simply put, the supply offered for sale of a commodity is directly related to its price, while the demand
Multi-site Time Series Analysis
 Multi-site Time Series Analysis Epidemiological Findings from the National Morbidity, Mortality, Air Pollution Study (NMMAPS) + the Medicare and Air Pollution Study (MCAPS) SAMSI Spatial Epidemiology Fall
Generalized Models to Analyze the Relationship between Daily
 Generalized Models to Analyze the Relationship between Daily Mortality Rates and Major Air Pollutants Minjae Park 1, Hoang Pham 1 and Ho Kim 2 1 Department of Industrial and Systems Engineering, Rutgers
STAT 2300: Unit 1 Learning Objectives Spring 2019
 STAT 2300: Unit 1 Learning Objectives Spring 2019 Unit tests are written to evaluate student comprehension, acquisition, and synthesis of these skills. The problems listed as Assigned MyStatLab Problems
Air Pollution and Daily Mortality in a City with Low Levels of Pollution
 Articles Air Pollution and Daily Mortality in a City with Low Levels of Pollution Sverre Vedal, 1 Michael Brauer,,3 Richard White, and John Petkau 1 Department of Medicine, National Jewish Medical and
The Clean Air Act of 1970 and Adult Mortality
 The Clean Air Act of 1970 and Adult Mortality Kenneth Chay, Carlos Dobkin and Michael Greenstone* This version: May 5, 2003 * Kenneth Chay, UC-Berkeley and NBER, Carlos Dobkin, UC-Berkeley Ph.D. Candidate,
Bivariate Data Notes
 Bivariate Data Notes Like all investigations, a Bivariate Data investigation should follow the statistical enquiry cycle or PPDAC. Each part of the PPDAC cycle plays an important part in the investigation
A Statistical Comparison Of Accelerated Concrete Testing Methods
 Journal of Applied Mathematics & Decision Sciences, 1(2), 89-1 (1997) Reprints available directly from the Editor. Printed in New Zealand. A Statistical Comparison Of Accelerated Concrete Testing Methods
Assessing Seasonal Confounding and Model Selection Bias in Air Pollution Epidemiology Using Positive and Negative Control Analyses NRCSE
 Assessing Seasonal Confounding and Model Selection Bias in Air Pollution Epidemiology Using Positive and Negative Control Analyses Thomas Lumley Lianne Sheppard NRCSE T e c h n i c a l R e p o r t S e
DEPARTMENT OF QUANTITATIVE METHODS & INFORMATION SYSTEMS
 DEPARTMENT OF QUANTITATIVE METHODS & INFORMATION SYSTEMS Time Series and Their Components QMIS 320 Chapter 5 Fall 2010 Dr. Mohammad Zainal 2 Time series are often recorded at fixed time intervals. For
Practical Regression: Fixed Effects Models
 DAVID DRANOVE 7-112-005 Practical Regression: Fixed Effects Models This is one in a series of notes entitled Practical Regression. These notes supplement the theoretical content of most statistics texts
Estimating the Health Effects of Ambient Air Pollution and Temperature
 Estimating the Health Effects of Ambient Air Pollution and Temperature Bart Ostro, Ph.D., Chief Air Pollution Epidemiology Section Office of Environmental Health Hazard Assessment California EPA Hundreds
Acknowledgments. Data Mining. Examples. Overview. Colleagues
 Data Mining A regression modeler s view on where it is and where it s likely to go. Bob Stine Department of Statistics The School of the Univ of Pennsylvania March 30, 2006 Acknowledgments Colleagues Dean
TECHNICAL REPORT NO. 8
 #8 The Clean Air Act of 1970 and Adult Mortality The University of Chicago Center for Integrating Statistical and Environmental Science www.stat.uchicago.edu/~cises Chicago, Illinois USA TECHNICAL REPORT
Agriculture and Climate Change Revisited
 Agriculture and Climate Change Revisited Anthony Fisher 1 Michael Hanemann 1 Michael Roberts 2 Wolfram Schlenker 3 1 University California at Berkeley 2 North Carolina State University 3 Columbia University
MEAN ANNUAL EXPOSURE OF CHILDREN AGED 0-4 YEARS TO ATMOSPHERIC PARTICULATE POLLUTION
 MEAN ANNUAL EXPOSURE OF CHILDREN AGED 0-4 YEARS TO ATMOSPHERIC PARTICULATE POLLUTION GENERAL CONSIDERATIONS Issues Type of indicator Rationale Issues in indicator design Respiratory disease Exposure (proximal)
Mentor: William F. Hunt, Jr. Adjunct Professor. In this project our group set out to determine what effect, if any, an air monitor s distance
 Assessment of Air Quality Trends Near Roadways By Taylor York, Carey Jackson, and Aaron Lamb Undergraduate Statistics Program North Carolina State University Mentor: William F. Hunt, Jr. Adjunct Professor
Chapter 2 Tools of Positive Analysis
 Chapter 2 Tools of Positive Analysis Multiple Choice 1. Positive economics A) does not depend on market interactions. B) only looks at the best parts of the economy. C) examines how the economy actually
Seasonal Analyses of Air Pollution and Mortality in 100 US Cities
 American Journal of Epidemiology Copyright ª 2005 by the Johns Hopkins Bloomberg School of Public Health All rights reserved Vol. 161, No. 6 Printed in U.S.A. DOI: 10.1093/aje/kwi075 Seasonal Analyses
Seasonal Analyses of Air Pollution and Mortality in 100 US Cities
 American Journal of Epidemiology Copyright ª 2005 by the Johns Hopkins Bloomberg School of Public Health All rights reserved Vol. 161, No. 6 Printed in U.S.A. DOI: 10.1093/aje/kwi075 Seasonal Analyses
Chapter 5 Regression
 Chapter 5 Regression Topics to be covered in this chapter: Regression Fitted Line Plots Residual Plots Regression The scatterplot below shows that there is a linear relationship between the percent x of
10.2 Correlation. Plotting paired data points leads to a scatterplot. Each data pair becomes one dot in the scatterplot.
 10.2 Correlation Note: You will be tested only on material covered in these class notes. You may use your textbook as supplemental reading. At the end of this document you will find practice problems similar
Quadratic Regressions Group Acitivity 2 Business Project Week #4
 Quadratic Regressions Group Acitivity 2 Business Project Week #4 In activity 1 we created a scatter plot on the calculator using a table of values that were given. Some of you were able to create a linear
ENVIRONMENTAL PROTECTION AGENCY APTI 435: Atmospheric Sampling Course. Student Manual
 ENVIRONMENTAL PROTECTION AGENCY APTI 435: Atmospheric Sampling Course Student Manual Table of Contents Chapter 1: An Introduction to Atmospheric Sampling... 1-1 1.1 Introduction... 1-2 1.2 Sampling Train
Particulate Matter Air Pollution and Health Risks ( edited for AHS APES)
") Particulate Matter Air Pollution and Health Risks ( edited for AHS APES) What is Particulate Matter? Image from http://www.epa.gov/eogapti1/ module3/distribu/distribu.htm Particulate matter (PM) describes
Particulate Matter Air Pollution and Health Risks ( edited for AHS APES) What is Particulate Matter? Image from http://www.epa.gov/eogapti1/ module3/distribu/distribu.htm Particulate matter (PM) describes
Air Pollution and Premature Mortality in Rapidly Growing Economies: Evidence from Santiago, Chile
 Air Pollution and Premature Mortality in Rapidly Growing Economies: Evidence from Santiago, Chile Abstract This paper looks at the effects of air pollution on premature mortality by using a municipality-week
Seasonal Analyses of Air Pollution and Mortality in 100 U.S. Cities
 Johns Hopkins University, Dept. of Biostatistics orking Papers 5-27-2004 Seasonal Analyses of Air Pollution and Mortality in 100 U.S. Cities Roger D. Peng Johns Hopkins Bloomberg School of Public Health,
Characterizing the long-term PM mortality response function: Comparing the strengths and weaknesses of research synthesis approaches
 Characterizing the long-term PM 2.5 - mortality response function: Comparing the strengths and weaknesses of research synthesis approaches Neal Fann*, Elisabeth Gilmore & Katherine Walker* 1 * Usual institutional
Lab 1: A review of linear models
 Lab 1: A review of linear models The purpose of this lab is to help you review basic statistical methods in linear models and understanding the implementation of these methods in R. In general, we need
PMF modeling for WRAP COHA
 PMF modeling for WRAP COHA Introduction In order to identify the sources of aerosols in the western United States, Positive Matrix Factorization (PMF) receptor model is applied to the 24-hr integrated
Comments On: Proposed Amendments: N.J.A.C. 7: and 7:27A-3.2 and Proposed New Rules: N.J.A.C. 7: and N.J.A.C.
 Comments On: Air Quality Management CO 2 Budget Trading Program Proposed Amendments: N.J.A.C. 7:27-22.16 and 7:27A-3.2 and 3.10 Proposed New Rules: N.J.A.C. 7:27-22.28 and N.J.A.C. 7:27C DEP Docket Number:
Interrupted time series
 Antonio Gasparrini London School of Hygiene and Tropical Medicine, UK Centre for Evaluation & Centre for Statistical Methodology 22 May 2018 Key messages ITS is a very strong and very weak design: quasi-experimental,
Learn What s New. Statistical Software
 Statistical Software Learn What s New Upgrade now to access new and improved statistical features and other enhancements that make it even easier to analyze your data. The Assistant Let Minitab s Assistant
Untangling Correlated Predictors with Principle Components
 Untangling Correlated Predictors with Principle Components David R. Roberts, Marriott International, Potomac MD Introduction: Often when building a mathematical model, one can encounter predictor variables
Air Quality, Infant Mortality, and the Clean Air Act of 1970*
 Air Quality, Infant Mortality, and the Clean Air Act of 1970* Kenneth Y. Chay and Michael Greenstone August 2001 * We thank David Card, Vernon Henderson, and participants of the NBER Workshop on Public
Creative Commons Attribution-NonCommercial-Share Alike License
 Author: Brenda Gunderson, Ph.D., 2015 License: Unless otherwise noted, this material is made available under the terms of the Creative Commons Attribution- NonCommercial-Share Alike 3.0 Unported License:
Layoffs and Lemons over the Business Cycle
 Layoffs and Lemons over the Business Cycle Emi Nakamura Harvard University May 9, 2007 Abstract This paper develops a simple model in which unemployment arises from a combination of selection and bad luck.
Econometric Analysis Dr. Sobel
 Econometric Analysis Dr. Sobel Econometrics Session 1: 1. Building a data set Which software - usually best to use Microsoft Excel (XLS format) but CSV is also okay Variable names (first row only, 15 character
USEPA Region 7 Regional Technical Assistance Group
 USEPA Region 7 Regional Technical Assistance Group Debbie Baker and Donald Huggins P C C Central Plains Center for BioAssessment, Kansas Biological Survey B Gary Welker USEPA Region 7, Kansas City, KS
Forecasting for Short-Lived Products
 HP Strategic Planning and Modeling Group Forecasting for Short-Lived Products Jim Burruss Dorothea Kuettner Hewlett-Packard, Inc. July, 22 Revision 2 About the Authors Jim Burruss is a Process Technology
Multilayer perceptron and regression modelling to forecast hourly nitrogen dioxide concentrations
 Air Pollution XXII 39 Multilayer perceptron and regression modelling to forecast hourly nitrogen dioxide concentrations C. Capilla Department of Applied Statistics and Operations Research and Quality,
Climate Change, Crop Yields, and Implications for Food Supply in Africa
 Climate Change, Crop Yields, and Implications for Food Supply in Africa David Lobell 1 Michael Roberts 2 Wolfram Schlenker 3 1 Stanford University 2 North Carolina State University 3 Columbia University
COMPARISON OF PM LEVELS OF TWO PUBLIC HIGH SCHOOLS LOCATED IN DIFFERENT SOCIAL-ECONOMIC LOCATIONS
 COMPARISON OF PM LEVELS OF TWO PUBLIC HIGH SCHOOLS LOCATED IN DIFFERENT SOCIAL-ECONOMIC LOCATIONS Adam Turay Directed by: Maurico Gonzalez Frederick Douglass Academy New York, NY 2009-2010 Introduction
Statistics in Risk Assessment
 What s about Truth? 100% 80% Effect 60% 40% 20% 0% 0 0.5 1 1.5 2 2.5 3 Log (Dose/concentration) Hans Toni Ratte Institute of Environmental Research (Biology V) Chair of Ecology, Ecotoxicology, Ecochemistry
Quantifying the long-term effects of air pollution on health in England using space time data. Duncan Lee Geomed th September 2015
 Quantifying the long-term effects of air pollution on health in England using space time data Duncan Lee Geomed 2015 10th September 2015 Acknowledgements This is joint work with Alastair Rushworth from
Relative risk calculations
 Relative risk calculations Introduction The assessment of the burden and impacts of air pollution on health is operated through a methodology that will be implemented in AirQ+ and it is briefly described
BETTER HEALTH FROM A BETTER ENVIRONMENT: A CROSS-COUNTRY EMPIRICAL ANALYSIS. By Hsiang-Chih Hwang. July Abstract
 BETTER HEALTH FROM A BETTER ENVIRONMENT: A CROSS-COUNTRY EMPIRICAL ANALYSIS By Hsiang-Chih Hwang July 2007 Abstract In recent decades, affluent countries have implemented many new regulations intended
Correlation between Air Pollution and associated Respiratory Morbidity in Delhi
 Correlation between Air Pollution and associated Respiratory Morbidity in Delhi Girija Jayaraman and Nidhi Centre for Atmospheric Sciences Indian Institute of Technology, New Delhi Context and Objectives
May 30, Harvard ACE Project 2 May 30, / 34
 Harvard ACE Project 2: Air Pollutant Mixtures in Eastern Massachusetts: Spatial Multi-resolution Analysis of Trends, Effects of Modifiable Factors, Climate, and Particle-induced Mortality Brent Coull,
Modelling buyer behaviour/3 How survey results can mislead
 Publishing Date: June 1993. 1993. All rights reserved. Copyright rests with the author. No part of this article may be reproduced without written permission from the author. Modelling buyer behaviour/3
Epidemiologic study design for investigating respiratory health effects of complex air pollution mixtures.
 Epidemiologic study design for investigating respiratory health effects of complex air pollution mixtures. The Harvard community has made this article openly available. Please share how this access benefits
Science of the Total Environment
 Science of the Total Environment 407 (2009) 3295 3300 Contents lists available at ScienceDirect Science of the Total Environment journal homepage: www.elsevier.com/locate/scitotenv Visibility, air quality
Categorical Predictors, Building Regression Models
 Fall Semester, 2001 Statistics 621 Lecture 9 Robert Stine 1 Categorical Predictors, Building Regression Models Preliminaries Supplemental notes on main Stat 621 web page Steps in building a regression
AP Statistics Part 1 Review Test 2
 Count Name AP Statistics Part 1 Review Test 2 1. You have a set of data that you suspect came from a normal distribution. In order to assess normality, you construct a normal probability plot. Which of
Business Quantitative Analysis [QU1] Examination Blueprint
![Business Quantitative Analysis [QU1] Examination Blueprint](/thumbs/94/121308410.jpg "Business Quantitative Analysis [QU1] Examination Blueprint") Business Quantitative Analysis [QU1] Examination Blueprint 2014-2015 Purpose The Business Quantitative Analysis [QU1] examination has been constructed using an examination blueprint. The blueprint, also
Business Quantitative Analysis [QU1] Examination Blueprint 2014-2015 Purpose The Business Quantitative Analysis [QU1] examination has been constructed using an examination blueprint. The blueprint, also
H R Anderson, S A Bremner, R W Atkinson, R M Harrison, S Walters
 54 Department of Public Health Sciences, St George s Hospital Medical School, Cranmer Terrace, London SW17 RE, UK H R Anderson S A Bremner R W Atkinson Institute of Public and Environmental Health, The
Methodology to Assess Air Pollution Impact on Human Health Using the Generalized Linear Model with Poisson Regression
 13 Methodology to Assess Air Pollution Impact on Human Health Using the Generalized Linear Model with Poisson Regression Yara de Souza Tadano 1, Cássia Maria Lie Ugaya 2 and Admilson Teixeira Franco 2
Political economy of pollution in China
 Political economy of pollution in China Jessica Leight Williams Department of Economics April 21, 2016 Introduction Over the last three decades, China has experienced phenomenal growth - but this growth
STAT 350 (Spring 2016) Homework 12 Online 1
 Homework 12 Online 1") STAT 350 (Spring 2016) Homework 12 Online 1 1. In simple linear regression, both the t and F tests can be used as model utility tests. 2. The sample correlation coefficient is a measure of the strength
STAT 350 (Spring 2016) Homework 12 Online 1 1. In simple linear regression, both the t and F tests can be used as model utility tests. 2. The sample correlation coefficient is a measure of the strength
Health impacts of air pollution in London: from understanding to forecasting
 Health impacts of air pollution in London: from understanding to forecasting John Gulliver University of the West of Scotland Marta Blangiardo, David Briggs, Anna Hansell Imperial College London Study
Semester 2, 2015/2016
 ECN 3202 APPLIED ECONOMETRICS 3. MULTIPLE REGRESSION B Mr. Sydney Armstrong Lecturer 1 The University of Guyana 1 Semester 2, 2015/2016 MODEL SPECIFICATION What happens if we omit a relevant variable?
A dverse short term effects of specific air pollutants on
 977 ORIGINAL ARTICLE Investigating the dose-response relation between air pollution and total mortality in the APHEA-2 multicity project E Samoli, G Touloumi, A Zanobetti, A Le Tertre, Chr Schindler, R
Canadian Environmental Sustainability Indicators. Air health trends
 Canadian Environmental Sustainability Indicators Air health trends Suggested citation for this document: Environment and Climate Change Canada (2018) Canadian Environmental Sustainability Indicators: Air
Effect of E. coli mitigation on the proportion of time primary contact minimum acceptable state concentrations are exceeded: Technical note.
 Effect of E. coli mitigation on the proportion of time primary contact minimum acceptable state concentrations are exceeded: Technical note. Prepared for Ministry for the Environment December 2016 Prepared
Preliminary Analysis of High Resolution Domestic Load Data
 Preliminary Analysis of High Resolution Domestic Load Data Zhang Ning Daniel S Kirschen December 2010 Equation Chapter 1 Section 1 1 Executive summary This project is a part of the Supergen Flexnet project
Design of Experiments
 Design of Experiments Statistical Principles of Research Design and Analysis Second Edition Robert O. Kuehl The University of Arizona Duxbury Thomson Learning* Pacific Grove Albany Belmont Bonn Boston
Correlation and Simple. Linear Regression. Scenario. Defining Correlation
 Linear Regression Scenario Let s imagine that we work in a real estate business and we re attempting to understand whether there s any association between the square footage of a house and it s final selling
How to Lie with Statistics Darrell Huff
 How to Lie with Statistics Darrell Huff Meredith Mincey Readings 5050 Spring 2010 In Darrell Huffs famous book, he teaches us how to lie with statistics so as to protect ourselves from false information.
Time-Series Studies of Particulate Matter
 Johns Hopkins University, Dept. of Biostatistics Working Papers 11-18-2003 Time-Series Studies of Particulate Matter Michelle L. Bell The Johns Hopkins Bloomberg School of Public Health, michelle.bell@yale.edu
Air Pollution and Total Mortality In California
 Air Pollution and Total Mortality In California James E. Enstrom, Ph.D., M.P.H. Epidemiologist UCLA School of Public Health President Scientific Integrity Institute Los Angeles, CA CSUSB Sustainable Goods
Air Pollution and Total Mortality In California
 Air Pollution and Total Mortality In California James E. Enstrom, Ph.D., M.P.H. Epidemiologist UCLA School of Public Health President Scientific Integrity Institute Los Angeles, CA CSUSB Sustainable Goods
Multiple Choice (#1-9). Circle the letter corresponding to the best answer.
. Circle the letter corresponding to the best answer.") !! AP Statistics Ch. 3 Practice Test!! Name: Multiple Choice (#1-9). Circle the letter corresponding to the best answer. 1. In a statistics course, a linear regression equation was computed to predict
!! AP Statistics Ch. 3 Practice Test!! Name: Multiple Choice (#1-9). Circle the letter corresponding to the best answer. 1. In a statistics course, a linear regression equation was computed to predict
Health impact assessment of exposure to inhalable particles in Lisbon Metropolitan Area
 Environmental Health Risk V 91 Health impact assessment of exposure to inhalable particles in Lisbon Metropolitan Area D. Dias, O. Tchepel & C. Borrego CESAM & Department of Environment and Planning, University
TIME-SERIES STUDIES OF PARTICULATE MATTER
 Annu. Rev. Public Health 2004. 25:247 80 doi: 10.1146/annurev.publhealth.25.102802.124329 Copyright c 2004 by Annual Reviews. All rights reserved TIME-SERIES STUDIES OF PARTICULATE MATTER Michelle L. Bell,
Price transmission along the food supply chain
 Price transmission along the food supply chain Table of Contents 1. Introduction... 2 2. General formulation of models... 3 2.1 Model 1: Price transmission along the food supply chain... 4 2.2 Model 2:
Learning Objectives. Module 7: Data Analysis
 Module 7: Data Analysis 2007. The World Bank Group. All rights reserved. Learning Objectives At the end of this module, participants should understand: basic data analysis concepts the relationship among
Lecture 4 Air Pollution: Particulates METR113/ENVS113 SPRING 2011 MARCH 15, 2011
 Lecture 4 Air Pollution: Particulates METR113/ENVS113 SPRING 2011 MARCH 15, 2011 Reading (Books on Course Reserve) Jacobson, Chapter 5, Chapter 8.1.9 Turco, Chapter 6.5, Chapter 9.4 Web links in following
FUNDAMENTALS OF QUALITY CONTROL AND IMPROVEMENT. Fourth Edition. AMITAVA MITRA Auburn University College of Business Auburn, Alabama.
 FUNDAMENTALS OF QUALITY CONTROL AND IMPROVEMENT Fourth Edition AMITAVA MITRA Auburn University College of Business Auburn, Alabama WlLEY CONTENTS PREFACE ABOUT THE COMPANION WEBSITE PART I PHILOSOPHY AND
Beachville, Oxford County Particulate Matter Sampling. Contact information:
 Beachville, Oxford County Particulate Matter Sampling Requestor: Request prepared by: Date: 26-Apr-16 Peter Heywood, Manager, Health Protection, Oxford County Public Health James Johnson MPH, Environmental
Real Estate Modelling and Forecasting
 Real Estate Modelling and Forecasting Chris Brooks ICMA Centre, University of Reading Sotiris Tsolacos Property and Portfolio Research CAMBRIDGE UNIVERSITY PRESS Contents list of figures page x List of
Oregon. 800 NE Oregon St. #640 Portland, OR (971)
") Air Quality Frequently Asked Questions Oregon Environmental Public Health Tracking (EPHT) Oregon ENVIRONMENTAL PUBLIC HEALTH TRACKING 800 NE Oregon St. #640 Portland, OR 97232 www.oregon.gov/dhs/ph/epht
Air Quality Frequently Asked Questions Oregon Environmental Public Health Tracking (EPHT) Oregon ENVIRONMENTAL PUBLIC HEALTH TRACKING 800 NE Oregon St. #640 Portland, OR 97232 www.oregon.gov/dhs/ph/epht
Key findings of air pollution health effects and its application
 CAFE Steering Group (Brussels, 17-18 18 May 2004) Key findings of air pollution health effects and its application Recent results from the WHO systematic review Jürgen Schneider Project Manger WHO ECEH,
Revisions to National Ambient Air Quality Standards for Particle Pollution. Webinar for States and Local Agencies December 19, 2012
 Revisions to National Ambient Air Quality Standards for Particle Pollution Webinar for States and Local Agencies December 19, 2012 1 Background on National Ambient Air Quality Standards The Clean Air Act
Effect of PM2.5 on AQI in Taiwan
 Environmental Modelling & Software 17 (2002) 29 37 www.elsevier.com/locate/envsoft Effect of PM2.5 on AQI in Taiwan Chung-Ming Liu * Department of Atmospheric Sciences, National Taiwan University, Taipei,
Thus, there are two points to keep in mind when analyzing risk:
 One-Minute Spotlight WHAT IS RISK? Uncertainty about a situation can often indicate risk, which is the possibility of loss, damage, or any other undesirable event. Most people desire low risk, which would
GCTA/GREML. Rebecca Johnson. March 30th, 2017
 GCTA/GREML Rebecca Johnson March 30th, 2017 1 / 12 Motivation for method We know from twin studies and other methods that genetic variation contributes to complex traits like height, BMI, educational attainment,
MEASURE DESCRIPTION. Temperatures: Daily, Weekly, Monthly, Seasonally Diurnal Temperature Range: Daily, Weekly Unit:
 STATE ENVIRONMENTAL HEALTH INDICATORS COLLABORATIVE (SEHIC) CLIMATE CHANGE INDICATORS Category: Indicator: Environmental Indicators Maximum, Minimum, and Diurnal Temperature Measure(s): 1) Maximum Temperature
Outliers identification and handling: an advanced econometric approach for practical data applications
 Outliers identification and handling: an advanced econometric approach for practical data applications G. Palmegiani LUISS University of Rome Rome Italy DOI: 10.1481/icasVII.2016.d24c ABSTRACT PAPER Before
Managerial Economics
 Managerial Economics Estimating Demand Functions Rudolf Winter-Ebmer Johannes Kepler University Linz Winter Term 2014 Winter-Ebmer, Managerial Economics: Unit 2 - Demand Estimation 1 / 21 Why do you need
Which is the best way to measure job performance: Self-perceptions or official supervisor evaluations?
 Which is the best way to measure job performance: Self-perceptions or official supervisor evaluations? Ned Kock Full reference: Kock, N. (2017). Which is the best way to measure job performance: Self-perceptions
Air Quality and GHG Emission Impacts of Stationary Fuel Cell Systems
 Air Quality and GHG Emission Impacts of Stationary Fuel Cell Systems An assessment produced by the Advanced Power and Energy Program at UC Irvine Introduction. The increasing percentage of intermittent
Is There an Environmental Kuznets Curve: Empirical Evidence in a Cross-section Country Data
 Is There an Environmental Kuznets Curve: Empirical Evidence in a Cross-section Country Data Aleksandar Vasilev * Abstract: This paper tests the effect of gross domestic product (GDP) per capita on pollution,