2.0 DESCRIPTION OF WATER SUPPLY DELINEATION OF THE WELLHEAD PROTECTION AREA METHODOLOGY UNCERTAINTY ANALYSIS...
|
|
|
- Darcy Jefferson
- 5 years ago
- Views:
Transcription
1
2
3 TABLE OF CONTENTS PAGE 1.0 INTRODUCTION DESCRIPTION OF WATER SUPPLY PHYSICAL SETTING GEOLOGY HYDROGEOLOGY DELINEATION OF THE WELLHEAD PROTECTION AREA METHODOLOGY UNCERTAINTY ANALYSIS DRINKING WATER SUPPLY MANAGEMENT AREA DELINEATION VULNERABILITY ASSESSMENT WELL VULNERABILITY ASSESSMENT DRINKING WATER SUPPLY MANAGEMENT AREA VULNERABILITY ASSESSMENT RECOMMENDATIONS REFERENCES...11
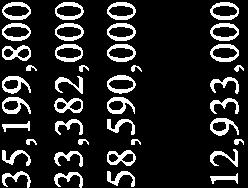
4 APPENDICES Appendix A Table 1 Active Appropriations Permits Near Redwood Falls Table 2 Summary of Reported Pumping Table 3 Aquifer Parameters from Literature and City Pumping Tests Appendix B Figure 1 Conceptual Hydrogeologic Model: B & C Aquifers Figure 2 Conceptual Hydrogeologic Model: A Aquifer Figure 3 Cross Section Location Map Figure 4 North South Cross Section Figure 5 West East Cross Section Figure 6 B & C Aquifers: 1, 10 and 20-Year Capture Zones Figure 7 A Aquifer: 1, 10 and 20-Year Capture Zones Figure 8 Capture Zones Adjusted for Uncertainty Figure 9 Wellhead Protection Areas with DWSMA and EMZ Figure 10 DWSMAs with Vulnerability Areas Appendix C Appendix D Appendix E City of Redwood Falls Well Logs MDH Tritium Analyses and Well Vulnerability Printout of Redwood Falls MLAEM Models
5 1.0 INTRODUCTION The City of Redwood Falls has a population of over 5,200 and is the seat of Redwood County. Redwood Falls is located approximately 110 miles west of the Twin Cities metropolitan area and serves as a sub-regional economic hub for the surrounding 17,000 residents in Redwood and Renville Counties. The City has a growing and diverse economic base comprised of tourism and entertainment, light and heavy industry and high-tech computer component manufacturing in addition to its retail and agricultural roots. An important component in maintaining this growth will be the availability of a high quality municipal water supply. As part of this work, the City of Redwood Falls is preparing a Wellhead Protection Plan to assist in preventing potential contaminants from entering the City s water supply at the source. Wellhead protection planning makes sense from a public health standpoint because it is intended to minimize exposure to potentially harmful contaminants and also from an economic standpoint as water supply contamination can be very costly to investigate, monitor and correct. Under the provisions of the 1986 and 1996 amendments to the Safe Drinking Water Act (SDWA), administered by the United States Environmental Protection Agency (EPA), states are required to develop wellhead protection programs for public water supplies. The 1986 Minnesota Groundwater Protection Act authorizes the Department of Health (MDH) to develop Minnesota s well head protection program which it administers through Minnesota Rules, Chapter to Minnesota s wellhead protection program requires public water suppliers to identify the area that contributes water to a public supply well, or well field, within a certain period of time. This is known as the wellhead protection area (WHPA) delineation which is in turn used to establish the drinking water supply management area (DWSMA). The City wells and this area are then assessed to determine the vulnerability of the water supply to contamination. These items constitute Part I of Minnesota s wellhead protection program which is the subject of this report. Part II of the program involves developing a management plan that may include an inventory of potential sources of contamination within the DWSMA and ways to manage existing and future activities that could impact the City s water supply. Activities to be included in Part II will be dependent on the results of Part I, particularly on whether the wells or DWSMAs are found to be vulnerable. If the City supply wells and associated DWSMA are found to be not vulnerable, this indicates that the wells are properly constructed and that the geologic formations provide February 2008 LIESCH ASSOCIATES, INC. Page 1 Hydrogeologists Engineers Environmental Scientists
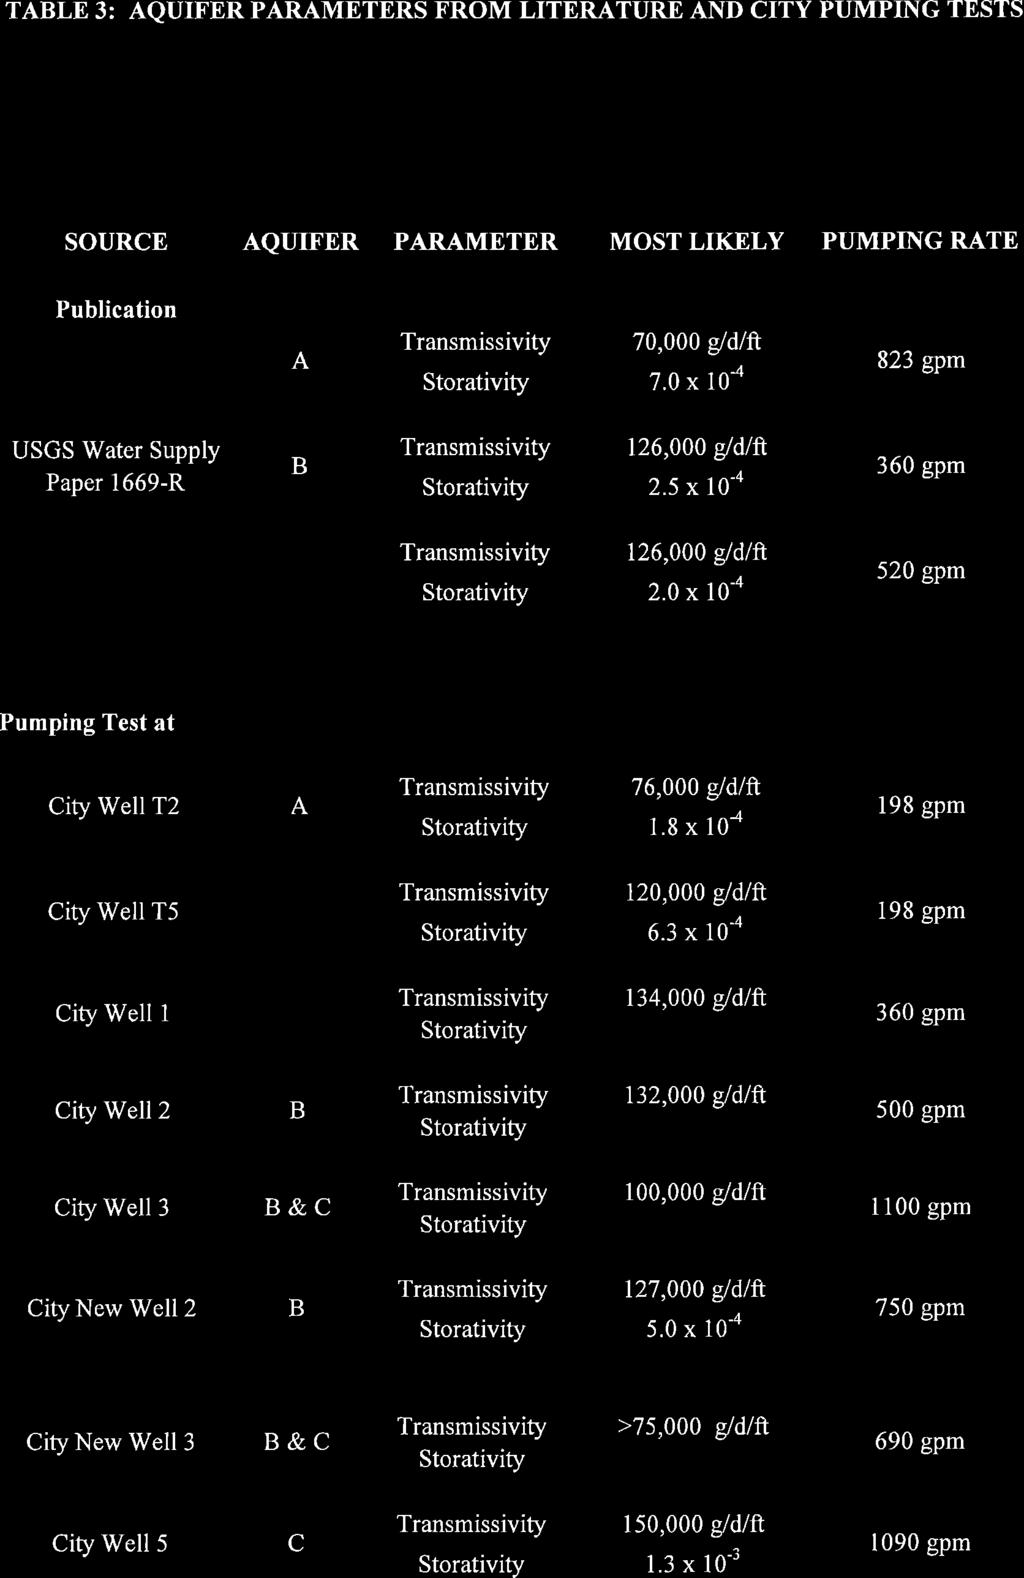
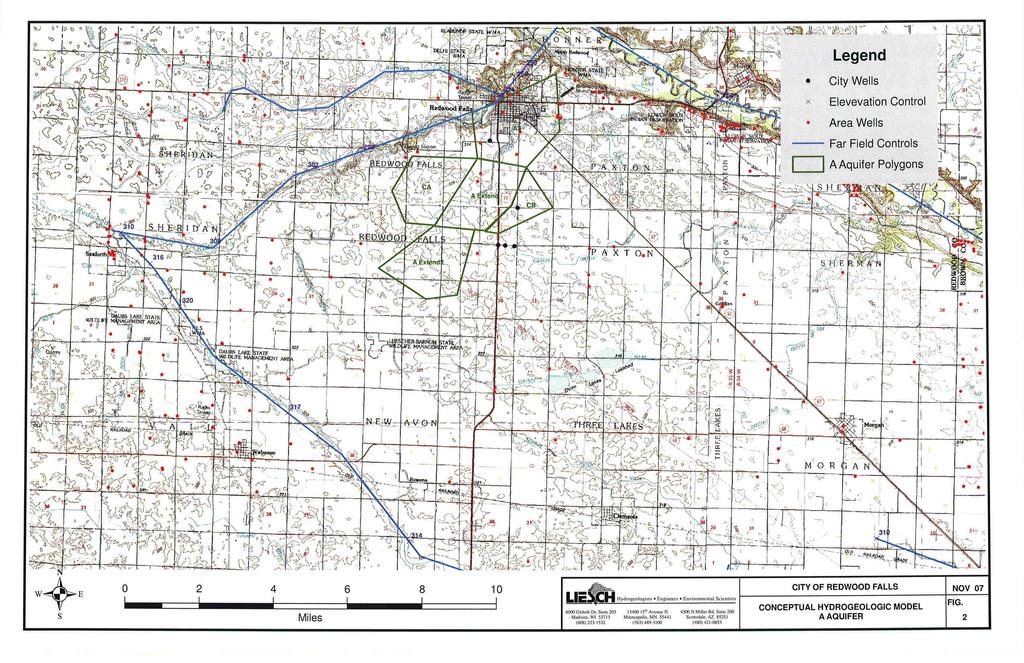
6 natural protection to the aquifer. This protection is usually in the form of a thick, low permeability confining layer that prevents or restricts potential contaminants from reaching the aquifer. In these cases, Part II may focus on preventing activities that could breach the confining layer such as improperly constructed or sealed wells. If one or more of the wells, or the DWSMA, is found to be vulnerable, then a more proactive approach to wellhead protection may be required including items such as a contaminant source inventory, enforcement of existing regulations regarding potential contaminant sources, monitoring of potential contaminant sources and public education in addition to development of a contingency plan to be implemented in the event of source water contamination. This report documents Part I of Redwood Falls wellhead protection program, prepared in accordance with the rules (Minnesota Rules to ) for preparing and implementing wellhead protection measures for public water supply wells. The next step in this process is to submit this report to the MDH for review and approval. The results described in this report are a group effort involving staff from the City of Redwood Falls, MDH and Liesch Associates, Inc. 2.0 DESCRIPTION OF WATER SUPPLY Redwood Falls water supply is currently obtained from five wells that utilize three glacial aquifers. These aquifers consist of sand and gravel outwash deposits sandwiched between glacial till layers and the underlying granitic bedrock. The uppermost aquifer (A Aquifer) averages about 20 foot in thickness just south of Redwood Falls where it is tapped by the South Ramsey Well. The B Aquifer is deeper and is the aquifer that supplies City Wells 1 and 2. The C Aquifer occurs on top of the granitic bedrock where a northwest- southeast trending channel has been eroded into the bedrock surface. This aquifer is the water source for City Wells 3 and 5. Locations for the City production wells are shown on Figures 1 and 2 located in Appendix B and the wells are identified by name on Figure 3 in Appendix B. Well and Boring Records for the City s wells are provided in Appendix C. 3.0 PHYSICAL SETTING The topography and landforms of the Redwood Falls area are primarily the result of Wisconsinan glaciation and more recent alluvial processes. Redwood Falls is located at the junction of the Redwood and Minnesota Rivers. Except for these river valleys, the topography can be characterized as a gently rolling plain interrupted by bands of low knobs and ridges. The knobs February 2008 LIESCH ASSOCIATES, INC. Page 2 Hydrogeologists Engineers Environmental Scientists
7 and ridges represent glacial moraines and the smooth rolling topography is representative of a glacial till plain. The City is located at on the southern bank of the Minnesota River approximately midway between the eastern and western boundaries of Redwood County Minnesota. The current City Limits include an area of approximately 2.5 square miles located in part of section 36 of township 113 north, range 36 west; most of section 1 township 112 north, range 36 west; portions of sections 31 and 32 of township 113 north, range 35 west; and fractions of section 6 in township 112 north, range 35west. The annual average temperature for Redwood Falls is approximately 45 o F with average annual precipitation of 26 inches. Drainage of the Redwood Falls area is through the Minnesota River and its tributaries. 3.1 GEOLOGY An intensive discussion of the geology of the area is included in the report published by the U. S. Geological Survey in 1964: Geology and Ground-Water Conditions of the Redwood Falls Area, Redwood County, Minnesota. The geology may be summarized as follows: The area is underlain by glacial drift deposits, thin, sporadic remnants of Cretaceous sediments and crystalline bedrock. Groundwater supplies adequate for municipal use are available only from the glacial drift deposits. Stratified glacial drift is deposited by glacial melt water. Accordingly, the accumulation of clay, silt, sand and gravel in discrete layers or strata occurs in response to the load carrying capacity or energy of the flowing melt water. In contrast, non-stratified glacial drift, which is largely glacial till, is deposited directly by moving ice which forms a tough, compact, heterogeneous mixture of all earth particles ranging in size from boulders to clay or rock flour. The stratified glacial drift deposits of sand and gravel form the major aquifers in much of Minnesota. The aquifers are characteristically lenticular, sinuous and elongate and as a result are difficult to locate and map by drilling methods alone. Three major glacial drift aquifers have been identified, described and partially tested in the Redwood Falls area. 3.2 HYDROGEOLOGY The uppermost aquifer has been named the A aquifer. This aquifer occurs at an elevation of approximately 970 feet above sea level to the south and southwest of the City. The A Aquifer February 2008 LIESCH ASSOCIATES, INC. Page 3 Hydrogeologists Engineers Environmental Scientists
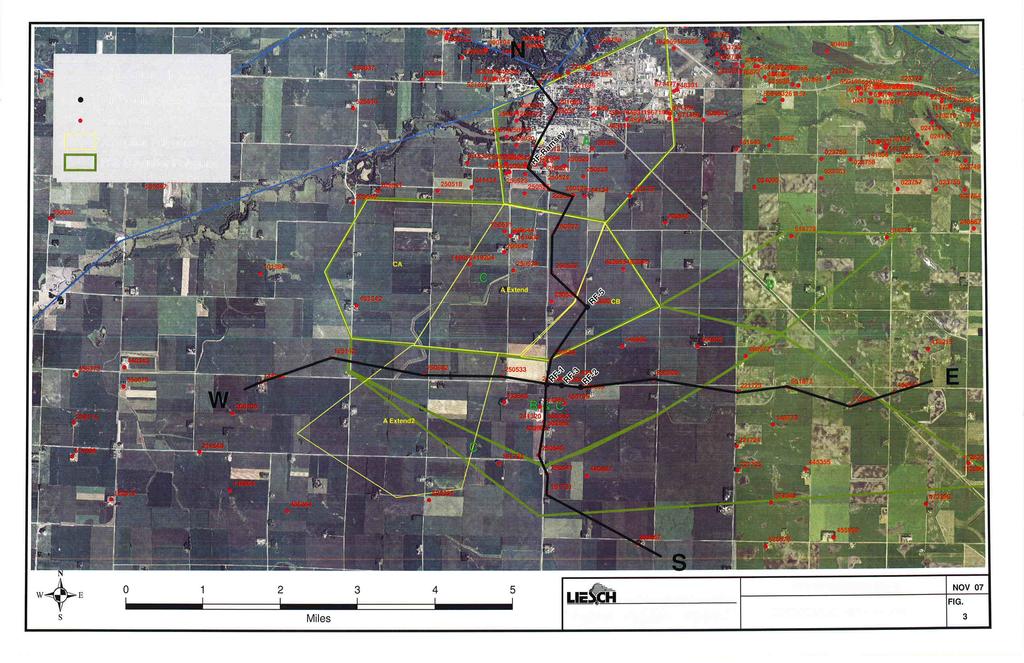
8 averages about 20 feet in thickness in the area where it is tapped by the South Ramsey Well. The A aquifer thins to the east and southeast and thickens to over 40 feet southwest of the South Ramsey well area. The B Aquifer occurs at an elevation of approximately 930 feet above sea level. This aquifer maintains a thickness of approximately 50 feet where utilized by City Wells 1 and 2. The C Aquifer occurs on top of the granitic bedrock where a northwest- southeast trending channel has been eroded into the bedrock surface. This aquifer occurs at an elevation of approximately 850 feet above sea level and is the water source for City Wells 3 and 5. The C Aquifer has an average thickness of 40 feet where present near Redwood Falls. Previous test drilling and aquifer testing confirm that there is a direct hydrologic connection between the B Aquifer and the C Aquifer in the vicinity of City Wells 2, 3 and 5. Geologic cross sections are provided on Figures 4 and 5 in Appendix B, and the lines of section are illustrated on Figure 3 in Appendix B. 4.0 DELINEATION OF THE WELLHEAD PROTECTION AREA The following discussion presents the values selected to meet the criteria for the delineation of the Redwood Falls Wellhead Protection Area (WHPA). These criteria are specified in Minnesota Rule Time of Travel A 10-year time of travel was selected. Hydrologic Flow Boundaries The principal hydrologic flow boundaries of concern in the Redwood Falls area relate to the aquifer geometry, recharge and discharge areas and presence of other high capacity pumping wells. In general, the conceptual models prepared for the Redwood Falls WHPA delineation, treat the three unconsolidated glacial outwash aquifers as separate hydrostratigraphic units. The same characteristics are assigned to the global aquifer in both models. Areas where the glacial aquifers are present are represented by inhomogeneities nested in the global aquifer. The aquifers receive recharge from above with the majority of the discharge occurring along the Minnesota River and a lesser amount discharging to the Redwood River. The recharge is primarily from the infiltration of local rainfall through the overlying strata. Other than the Redwood Falls City Wells, there are two high capacity wells located in the vicinity of the A, B and C Aquifers. One well (MDH ) is screened in the A Aquifer and is located approximately 1,000 feet from the South Ramsey Well. The other well (MDH ) is screened in the B Aquifer and is located about one half mile south of Well 1. The thickness and areal extent of each aquifer was inferred from the drilling information available from area wells. In the B and C Aquifer model, there is an area where both the B and C February 2008 LIESCH ASSOCIATES, INC. Page 4 Hydrogeologists Engineers Environmental Scientists
9 Aquifers appear to join and form a single hydrologically connected unit. (This hydrologic connection between the B and C aquifers was identified from the B. A. Liesch pumping test conducted at replacement Well 3 during the spring of 1985.) In the area where this connection occurs, the model has one aquifer with an average thickness and thickness weighted hydraulic conductivity of both the B and C Aquifers. In the A Aquifer model, the B and C Aquifers are not represented since they have no hydraulic effect on the A Aquifer. The need for a second separate model to simulate the hydrologic conditions in the A aquifer was determined by the characteristics of the computer modeling software. The computer model was initiated as a single layer model. Because of this, the polygons used to divide the B and C aquifers into areas with different characteristics interfered with the 10-year and 20-year particle tracking in the A Aquifer. The second model was required to allow the reverse particle tracking to reach the full requested extent. Daily Volume Table 1 in Appendix A presents the currently active high volume wells (DNR SWUDS database) in the Redwood Falls area of concern. These well locations were pumped at a yearly average rate based upon the highest total yearly volume reported for each active well. Table 2 in Appendix A shows the reported water use for the City of Redwood Falls wells over a five-year period. The City anticipates that this table also represents the near term future needs for the City. The table also lists the projected outputs in cubic meters per day which are the input units required by the groundwater model. In the A Aquifer model, the South Ramsey Well and well are the only wells pumping. In the B and C Aquifer model Wells 1, 2 3, 5 and are the pumping wells. Groundwater Flow The regional groundwater flow in the vicinity of Redwood Falls is towards the Minnesota River. Near the Redwood River, local flow is towards the Redwood River. This interpretation is based upon County Well Index static water level information and the generalized contours of the piezometric surface in August of 1953 as illustrated on Plate 4 of the USGS Water Supply Paper 1669-R. Aquifer Transmissivity Since the selected groundwater models require a value for hydraulic conductivity rather than a transmissivity value, an aquifer hydraulic conductivity of 3 m/day was utilized for the global aquifer. Hydraulic conductivities of 140 m/day for the A Aquifer, 100 m/day for the B Aquifer, 120 m/day for the C Aquifer and a value of 110 m/day where the B and C Aquifers were present and assumed to be hydrologically connected, were utilized in the inhomogeneities inserted into the global Aquifer to represent the three Glacial outwash aquifers. These values were chosen based upon pumping tests conducted on the City municipal wells and test wells. The testing was conducted by both the U. S, Geological Survey and Liesch February 2008 LIESCH ASSOCIATES, INC. Page 5 Hydrogeologists Engineers Environmental Scientists
10 Associates, Inc. Hydrologic testing conducted on the A Aquifer suggests hydraulic conductivities on the order of 143 to 155 m/day, in the B Aquifer hydraulic conductivities appear to range from 85 to 109 m/day and the C Aquifer exhibits values of 90 to 136 m/day. A compilation of the aquifer parameters that were determined through aquifer testing of the Redwood Falls area glacial aquifers is presented on Table 3 in Appendix A. 4.1 METHODOLOGY For the purpose of delineation of the wellhead protection area, the glacial aquifers have been represented by two distinct single layer models. The B ands C Aquifers have been modeled together, due to their areal extent and hydrologic connection. A separate model was used to represent the A Aquifer because this aquifer is not hydrologically connected to the B or C Aquifers and thus, does not interact with these deeper aquifers. The separate model was necessary due to the length of the ten and twenty year particle traces. One single layer model could not account for the presence of both the B and C Aquifers together in the same area as the overlying, hydrologically unconnected A Aquifer. The general layout of the B and C model is presented on Figure 1 in Appendix B and the model geometry for the A Aquifer model is provided on Figure 2 in Appendix B. Printed copies of both MLAEM model input sets are included in Appendix F. Calibration of the models were accomplished by comparison with the general head values presented in USGS Water Supply Paper 1669-R. Due to the lack of other simultaneously measured water level data sets for the modeled area, the USGS representation was selected as the best available data to use for initial calibration. The models were run without any wells pumping and the head values from the models were visually compared with the USGS report water level contours. At the completion of calibration, each model illustrated water elevations in general agreement with those provided in the USGS Report. The average stream flow increase between Marshall and Redwood Falls on the Redwood River was examined in an attempt to quantify and compare groundwater discharge into the Redwood River. The method did not aid in calibration due to the large variations in geology along the Redwood River and the inability of the model to create significant variations in the Redwood River discharge values through supportable alterations to the recharge rates and hydraulic conductivities in the aquifers. The method of calibration used for these models is rather crude. In order to account for this, a plus and minus 10 degree change was subsequently applied to the model flow direction. MLAEM developmental Version developed by Strack Consulting was used to create and the run the Redwood Falls models. After calibration, the maximum yearly values reported for February 2008 LIESCH ASSOCIATES, INC. Page 6 Hydrogeologists Engineers Environmental Scientists
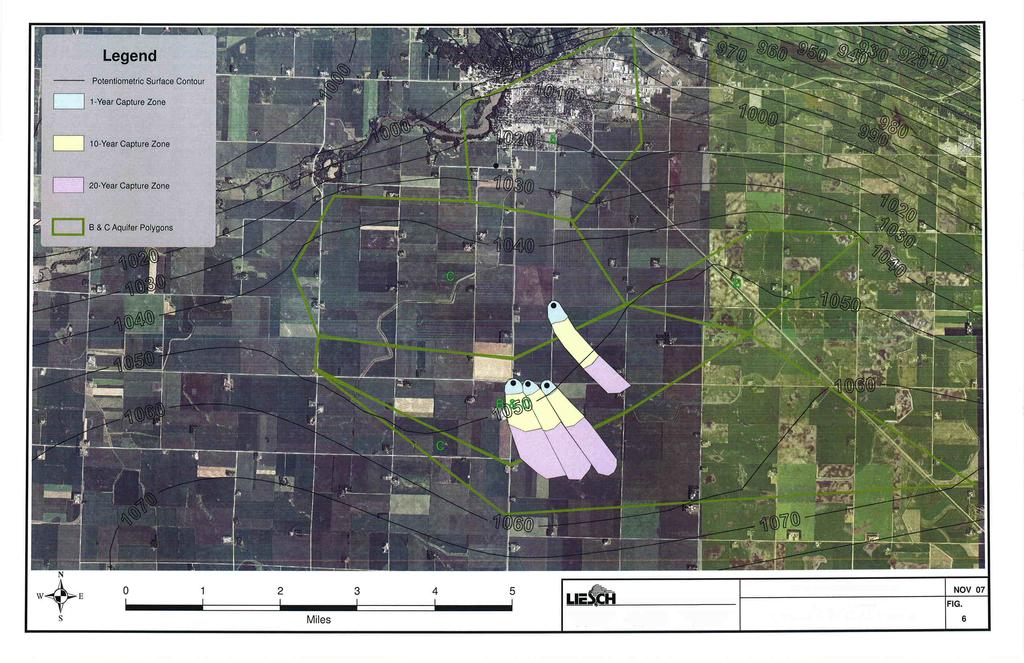
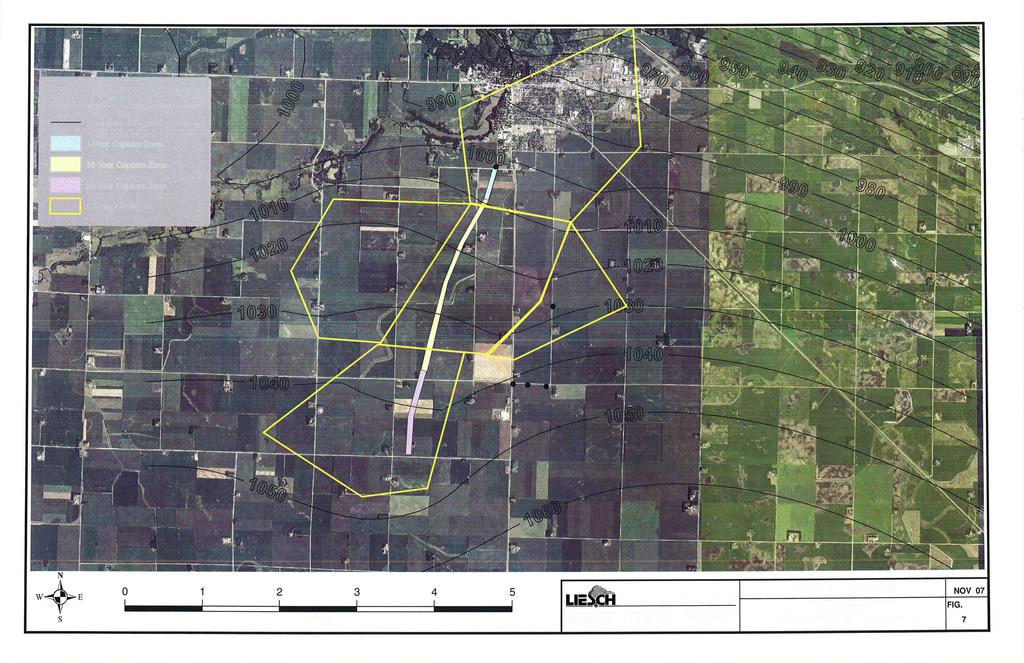
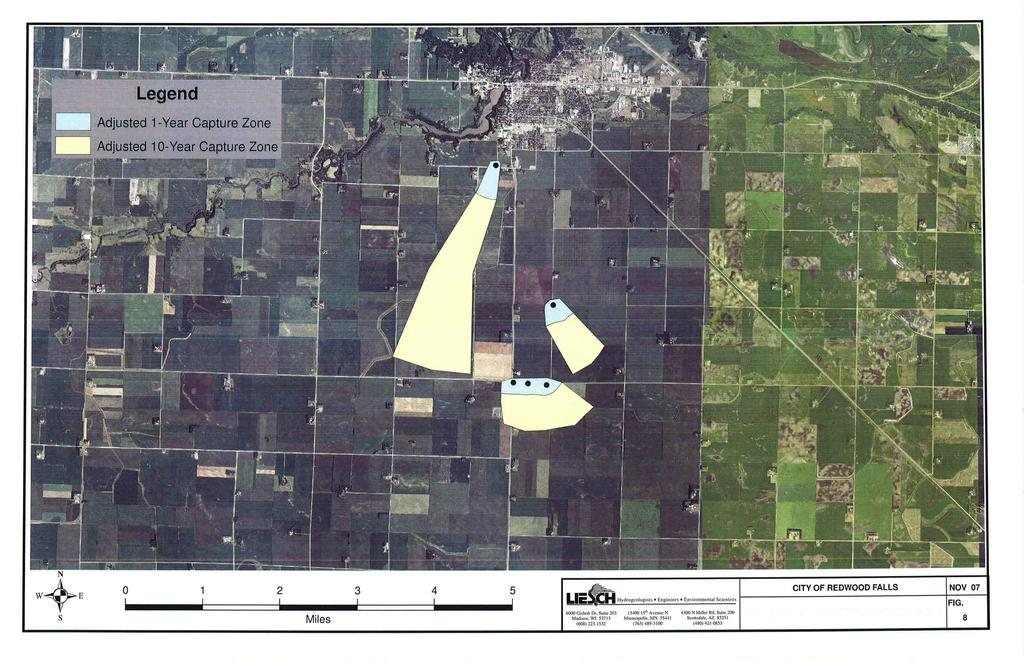
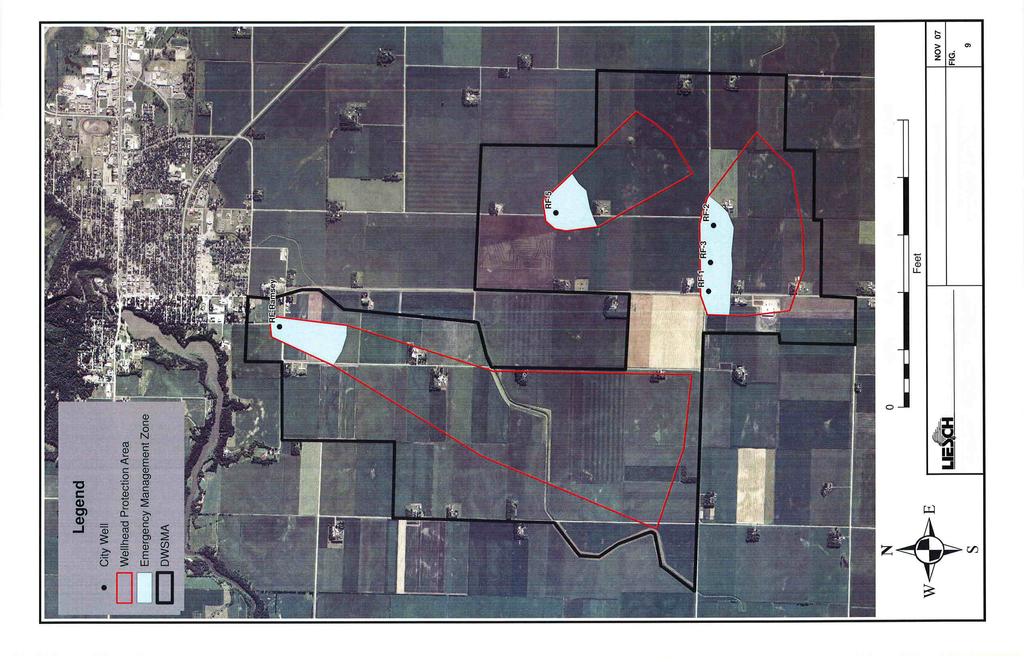
11 each of the two active appropriations permitted wells in the Redwood Falls area (SWUDS data base) were divided by 365 days and this rate applied as the continuous daily pumping rate to each active well. The Redwood Falls City Wells were pumped at the pumping rates selected for the capture zone determination. In the B and C model, Redwood Falls wells 1, 2, 3 and 5 along with SWUDS well were pumped at their applicable rates. In the A Aquifer model only the South Ramsey well and SWUDS well were pumping. Each model was run to delineate the one year, ten year and twenty year capture zones for the Redwood Falls wells. The capture zones were identified for each of the Redwood Falls wells by utilizing reverse particle tracking techniques. The one year, ten year and twenty year capture zones were plotted. These capture zones are illustrated on Figures 6 and 7 in Appendix B. The ten year capture zones were then adjusted for uncertainty (as discussed in the uncertainty analysis) and subsequently utilized to generate the Wellhead Protection Areas as shown on Figure 8 in Appendix B. Adjusted one-year capture zones were created and used to determine the Emergency Management Zones (EMZ) for each Redwood Falls well and the adjusted Wellhead Protection Areas were enclosed within the Drinking Water Supply Management Area shown on Figure UNCERTAINTY ANALYSIS An uncertainty analysis was conducted to determine each model s sensitivity to changes in aquifer parameters. Preliminary runs of the models indicate that the models are most sensitive to flow field created to match the initial water level conditions. Because of insufficient data available from the County Well Index or any other available sources, the interpretation of water levels presented in the 1964 U.S. Geological Survey water supply paper 1669-R were utilized. This data is old and most likely does not accurately portray the situation as it exists today. In addition, the U. S. Geological Survey paper assumes that all three aquifers exhibit the same potentiometric surface. The capture zones are directly influenced by the hydraulic conductivity, thickness and areal extent assigned to each aquifer polygon. After reviewing the pumping test information and reports, the most likely values were selected for the aquifer hydraulic conductivities based upon the significant data base of pumping test information. Aquifer thicknesses were plotted at each County Well Indexed well whose location could be identified to the quarter section or smaller areal unit. The sand and gravel aquifers were correlated throughout the Redwood Falls area and average thicknesses were selected for each aquifer polygon based upon the aquifer thickness exhibited in each polygon area. In order to compensate for the uncertainty evident in the Redwood Falls aquifer models, the 10- February 2008 LIESCH ASSOCIATES, INC. Page 7 Hydrogeologists Engineers Environmental Scientists
12 year capture zones have been adjusted by including a 10 degree variance to both the east and west in the 10 year reverse particle tracking from each well. The additional area resulting from this adjustment has been added to the model defined capture zone. The adjustment made to the capture zones to compensate for the aforementioned uncertainty is shown on Figure 8 in Appendix B. In addition, the lack of specific stratigraphic information in some areas south of Redwood Falls limits the accuracy to which the extent of the glacial aquifers can be defined. The City should make efforts to collect information from any new wells or test holes drilled in the vicinity of the DWSMA. This information can then be utilized to make adjustments to the vulnerability area boundaries as necessary. 5.0 DRINKING WATER SUPPLY MANAGEMENT AREA DELINEATION The Drinking Water Supply Management Areas (DWSMA) for the adjusted 10-year time of travel WHPA is shown on Figure 9. This DWSMA incorporates all of the ten year capture areas and the adjustments for uncertainty addressed in the previous section. The area was delineated using transportation corridors, surface water bodies, United States public land survey units and other criteria as defined by the wellhead protection rule. 6.0 VULNERABILITY ASSESSMENT This section documents the vulnerability assessments for the Redwood Falls municipal production wells and the DWSMA delineated to encompass the 10-year time of travel WHPAs. This assessment has been performed in accordance with Minnesota Rule for preparing and implementing wellhead protection measures for public water supply wells. The vulnerability of the Redwood Falls production wells was determined by evaluating available information on the geology, well construction and groundwater chemical and isotope concentrations. This information was then compared to the vulnerability criteria specified in Minnesota Rule The vulnerability of the DWSMA has been determined by evaluating the geologic conditions within the Redwood Falls area with particular emphasis upon the continuity of the three individual glacial outwash aquifers identified in U. S. Geological Survey Water Supply Paper 1169-R. Reviews of previously published reports, County Well Index stratigraphic information and Liesch Associates, Inc. pumping test reports along with the radiological composition of the February 2008 LIESCH ASSOCIATES, INC. Page 8 Hydrogeologists Engineers Environmental Scientists
13 aquifer waters and Chapters 1 and 3 of the DWSMA Vulnerability Assessment Guidance Document, have been instrumental in the determination of the DWSMA vulnerability. 6.1 WELL VULNERABILITY ASSESSMENT Redwood Falls South Ramsey and Well 5 are considered Vulnerable. These wells exhibited elevated tritium values when sampled by the Minnesota Department of Health (MDH). The laboratory results reported tritium concentrations of 1.2 and 1.3 tritium units at South Ramsey and Well 5, respectively. Redwood Falls Wells 1, 2 and 3 have not been sampled for tritium. At present MDH has preliminarily scored these wells as Not Vulnerable. The available Well and Boring Records for each of the Redwood Falls production wells were reviewed to determine well construction and the composition of the strata encountered during the drilling of each well. The South Ramsey well geology was inferred from surrounding well information. The materials encountered during drilling indicate the presence of significant thicknesses of lower permeability confining layers at the locations of all of the wells. All of the Redwood Falls production wells appear to meet current MDH well code. Copies of the Redwood Falls Well and Boring Records are included in Appendix C. Nitrate has been identified at low concentrations in Wells 1 and 5. Well 1 had a reported nitrate concentration of 1.5 mg/l and Well 5 exhibited a concentration of 0.5 mg/l. Both of these concentrations are significantly below the Federal Drinking Water Standard of 10 mg/l. As previously mentioned, the MDH has analyzed water samples from the Ramsey well and Well 5 for tritium content. Both of these wells had a tritium present indicating recharge from waters with a surface exposure more recent than Wells 1, 2 and 3 have not yet been tested for the presence of a detectable tritium. In the future, tritium testing could be conducted at these wells to substantiate their vulnerability. Copies of the MDH 2002 well vulnerability ratings with available tritium analysis results are included in Appendix D. At present, the City has no additional information that warrants changing the MDH assessments. 6.2 DRINKING WATER SUPPLY MANAGEMENT AREA VULNERABILITY ASSESSMENT The Redwood Falls Wellhead Protection Plan identifies one distinct DWSMA. The DWSMA has been assessed on the basis of area well logs, cross sections of geologic logs from wells located within the WHPA, previous test drilling conducted by the City and the radiological analyses performed by MDH. Methods outlined in the MDH Guidance Document: Assessing Well and Aquifer Vulnerability for Wellhead Protection were applied to assess DWSMA vulnerability. February 2008 LIESCH ASSOCIATES, INC. Page 9 Hydrogeologists Engineers Environmental Scientists
14 The Redwood Falls DWSMA has been assigned a Moderate Vulnerability. The DWSMA area exhibits confining clay layers in excess of 50 feet in thickness, however, because of the presence of the tritium isotope in water from Well 5 and the South Ramsey well, the DWSMA has been assigned a moderate rather than low vulnerability. 6.3 RECOMMENDATIONS At present, Wells 1, 2 and 3 have not been tested for tritium content. It is recommended that the MDH conduct tritium sampling at these three wells so that the degree of vulnerability can be verified. Based on the results of the current WHPA and DWSMA delineation and vulnerability assessment, Part II of Redwood Falls Wellhead Protection Plan should address Moderately Vulnerable areas by the identification of existing underground storage tanks, wells, large sewer systems, cesspools and automotive disposal systems. Wellhead protection in this area should include monitoring the status of any reported underground storage tank releases in this area and the identifying and properly sealing of abandoned wells that could provide a conduit for potential contaminants to reach the aquifer. The WHPA delineation conducted for this report was prepared using two calibrated steady-state, single-layer analytic element models (MLAEM). Pumping rates and locations for high volume pumping wells were computed from the State Water Use Data System (SWUDs) database. While this database may currently be the best source of information, the information is sometimes in error and not always current. When the Redwood Falls models are updated, the available data bases should be assessed to determine if more accurate high volume well locations and pumping rates are available at that time. As Redwood Falls continues to operate, maintain and expand its water supply system, information from any newly identified wells located near and within the DWSMA should be collected. Data concerning the geology, static and pumping water levels and any hydraulic testing should be collected and compiled for use in future model adjustments and calibrations. Any pumping test procedures conducted at existing or future wells should also include detailed water level measurements at available wells to facilitate calculation of aquifer parameters. February 2008 LIESCH ASSOCIATES, INC. Page 10 Hydrogeologists Engineers Environmental Scientists
15 7.0 REFERENCES Broussard, Anderson and Farrell, Water Resources of the Cottonwood River Watershed, Southwestern Minnesota, USGS Hydrologic Atlas HA-466, 1973, 3 pl. Driscoll, F. G., Groundwater and Wells, Second Edition, Johnson Filtration Systems, Inc., 1987, 1089 p. Koel, D. Report for City of Redwood Falls, Water Production and Distribution System Analysis, Redwood Falls, Minnesota, Dewild, Grant Reckert & Associates, May 1985 Liesch, B. A., Report for City of Redwood Falls, Electrical Resistivity Survey for Redwood Falls, Minnesota, Liesch Associates, Inc., July, Liesch, B. A., Report for City of Redwood Falls, Ground Water Investigation, Phase I, Redwood Falls, Minnesota, Liesch Associates, Inc., May, Liesch, B. A., Report for City of Redwood Falls, Ground Water Investigation, Redwood Falls, Minnesota, Liesch Associates, Inc., October, Liesch, B. A., Report for City of Redwood Falls, Ground Water Investigation, Test Drilling Program, Redwood Falls, Minnesota, Addendum, Liesch Associates, Inc., November, Liesch, B. A., Report for City of Redwood Falls, Hydrogeologic Investigation Well Construction Pumping Test Procedures New Well 2, Liesch Associates, Inc., November, 1988.Liesch, B. A., Report for City of Redwood Falls, Testing Procedure at Well No. 5, Redwood Falls, Minnesota, Addendum, Liesch Associates, Inc., June, Liesch, B. A., Report for City of Redwood Falls, Well Construction Pumping Test Procedures New Well 3, Liesch Associates, Inc., July, Minnesota Department of Health, Assessing Well and Aquifer Vulnerability for Wellhead Protection, Stamped DRAFT, February, 1997 Schiner, G.R and Schneider, R, Geology and Ground-water Conditions of the Redwood Falls Area, Redwood County, Minnesota, 1964, USGS, Water Supply Paper 1669-R, 1964, 46p. Van Voast, Jerabek and Novitzki, Water Resources of the Redwood River Watershed, Southwestern Minnesota, USGS Hydrologic Atlas HA-345, 1970, 3 pl. February 2008 LIESCH ASSOCIATES, INC. Page 11 Hydrogeologists Engineers Environmental Scientists
16 February 2008 LIESCH ASSOCIATES, INC. Page 12 Hydrogeologists Engineers Environmental Scientists
17 Wright, H.E., Jr., 1972, Quaternary History of Minnesota; in Sims, P.K. and Morey, G.B., EDS., Geology of Minnesota; University Press, p W:\ws\10922\Redwood Falls WHP Part 1\Final WHPA Part 1\Report Text\Part 1 Rpt (final).doc February 2008 LIESCH ASSOCIATES, INC. Page 13 Hydrogeologists Engineers Environmental Scientists
18
19

20
21
22
23
24
25
26
27
28
29
30
31


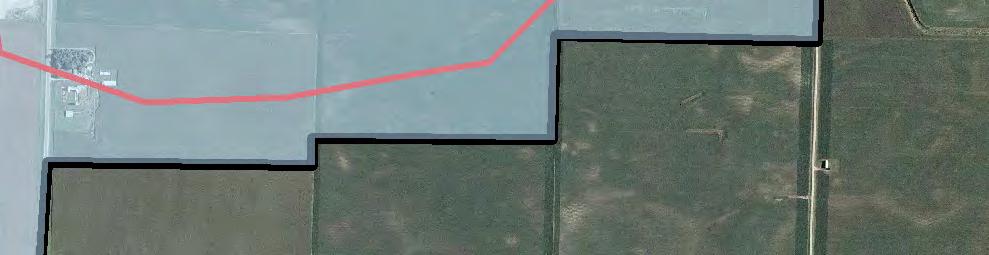
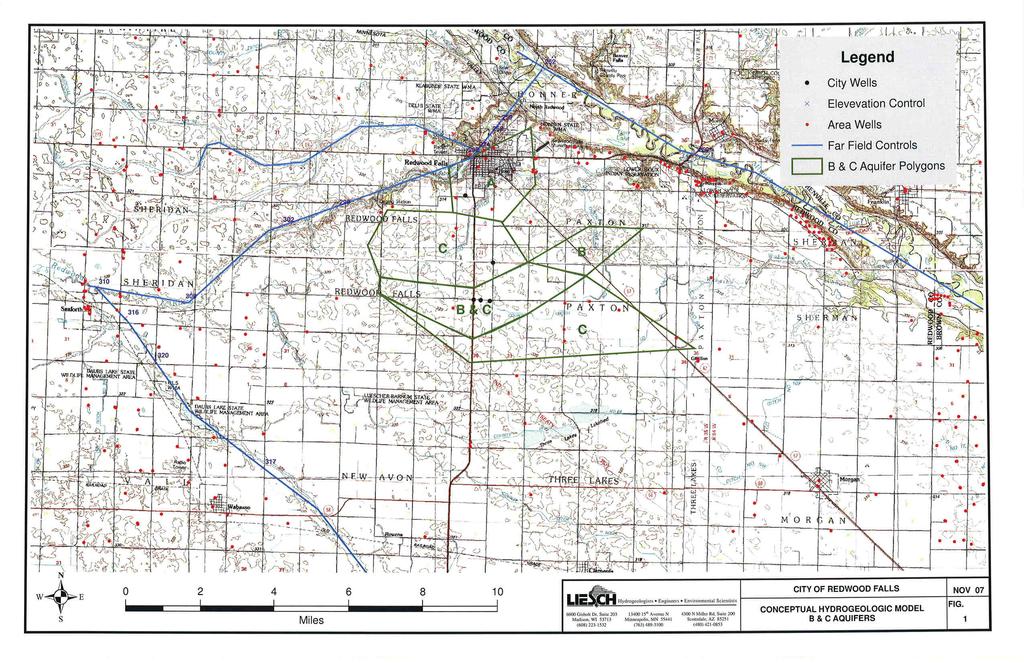
32 Legend City Well! Emergency Management Zone Wellhead Protection Area DWSMA DWSMA Vunerability Moderate! RF-Ramsey Moderate! RF-5 Moderate!. 0 2,000 RF-1! RF-3 4,000! 6,000 RF-2 8,000 10,000 Feet CITY OF REDWOOD FALLS Hydrogeologists Engineers Environmental Scientists 6000 Gisholt Dr, Suite 203 Madison, WI (608) th Avenue N Minneapolis, MN (763) N Miller Rd, Suite 200 Scottsdale, AZ (480) NOV 07 FIG. DWSMA WITH VUNERABILITY AREAS 10
33
34
35
36
37
38
39
40
41
42
43
44
45
46
47
48
49
50
51
52
53
54
55
56
57
58
59
60
WELLHEAD PROTECTION DELINEATION REPORT FOR THE VILLAGE OF BEAR LAKE DECEMBER 2002
 WELLHEAD PROTECTION DELINEATION REPORT FOR THE VILLAGE OF BEAR LAKE DECEMBER 2002 Prepared by: Gosling Czubak Engineering Sciences, Inc. 1280 Business Park Drive Traverse City, Michigan 48686 Telephone:
Wellhead Protection Plan. Part I
 Wellhead Protection Plan Part I Wellhead Protection Area Delineation Drinking Water Supply Management Area Delineation Well and Drinking Water Supply Management Area Vulnerability Assessments For Green
Supplemental Guide II-Delineations
 Supplemental Guide II-Delineations Contents Source Water Protection Area Delineation... 1 Delineation Criteria for Systems Using Groundwater Sources... 2 Time of Travel... 4 Flow Boundaries... 4 Delineation
Aquifer Characterization and Drought Assessment Ocheyedan River Alluvial Aquifer
 Aquifer Characterization and Drought Assessment Ocheyedan River Alluvial Aquifer Iowa Geological Survey Water Resources Investigation Report 10 Aquifer Characterization and Drought Assessment Ocheyedan
Aquifer Science Staff, January 2007
 Guidelines for Hydrogeologic Reports and Aquifer Tests Conducted Within the Jurisdictional Boundaries of the Barton Springs / Edwards Aquifer Conservation District I. Introduction Aquifer Science Staff,
City of Park Rapids WELLHEAD PROTECTION PLAN
 City of Park Rapids WELLHEAD PROTECTION PLAN Image of contractor sealing City well s 1 and 2 October 11, 2016 January 2018 1 TABLE OF CONTENTS Page Number I. PUBLIC WATER SUPPLY PROFILE 3 II. EXECUTIVE
Livingston County Department of Public Health Environmental Health Division. Hydrogeologic Investigation Requirements for Land Division Developments
 Livingston County Department of Public Health Environmental Health Division Hydrogeologic Investigation Requirements for Land Division Developments Reviewed March 1, 2013 Table of Contents Scope/Authority..1
WHPA AND DWSMA DELINEATIONS AND VULNERABILITY ASSESSMENTS
 APPENDIX I WHPA AND DWSMA DELINEATIONS AND VULNERABILITY ASSESSMENTS WHPA and DWSMA Delineations and Vulnerability Assessments -Appendix I contains the first part of the plan, consisting of the delineation
Updated Vulnerability Assessment and Scoring of Wellhead Protection Areas Regional Municipality of York
 Addendum Report Updated Vulnerability Assessment and Scoring of Wellhead Protection Areas Regional Municipality of York Prepared For: The Regional Municipality of York Environmental Services Environmental
WELLHEAD PROTECTION PLAN Amendment
 City of Mahnomen, Minnesota WELLHEAD PROTECTION PLAN Amendment Part 2 Potential Contaminant Source Inventory Potential Contaminant Source Management Strategy Evaluation Plan Emergency/Conservation Plan
Amendment to the Wellhead Protection Plan. Part I
 Amendment to the Wellhead Protection Plan Part I Delineation of Wellhead Protection Area Drinking Water Supply Management Area Delineation Well and Drinking Water Supply Management Area Vulnerability Assessments
DYNFLOW accepts various types of boundary conditions on the groundwater flow system including:
 Section 6 Groundwater Flow Model A groundwater flow model was developed to evaluate groundwater flow patterns in the site area and to provide a basis for contaminant transport modeling. 6.1 Model Code
WELLHEAD PROTECTION PLAN FOR THE CITY OF NORTH MANKATO, MINNESOTA
 WELLHEAD PROTECTION PLAN FOR THE CITY OF NORTH MANKATO, MINNESOTA September 2017 Forward This document presents the wellhead protection (WHP) plan for the City of North Mankato that will help provide for
4 DETERMINATION OF WELLHEAD PROTECTION AREAS
 4 DETERMINATION OF WELLHEAD PROTECTION AREAS A wellhead protection area is defined as the surface and subsurface area surrounding a well, wellfield or spring that supplies a public water supply through
RESPONSIBLE PLANNING FOR FUTURE GROUND WATER USE FROM THE GREAT FLATS AQUIFER : TWO CASE STUDIES: THE GEP ENERGY
 RESPONSIBLE PLANNING FOR FUTURE GROUND WATER USE FROM THE GREAT FLATS AQUIFER : TWO CASE STUDIES: THE GEP ENERGY Introduction PROJECT AND THE SI GREEN FUELS BOILER PROJECT Thomas M. Johnson Hydrogeologist,
Memorandum. Introduction. Carl Einberger Joe Morrice. Figures 1 through 7
 Memorandum TO: Michelle Halley, NWF DATE: October 9, 2007 FROM: Carl Einberger Joe Morrice PROJ. NO.: 9885.000 CC: Project File PROJ. NAME: National Wildlife Federation ATTACHMENTS: Tables 1 through 6
2015 WELLHEAD PROTECTION PLAN Part 2
 City of Excelsior 339 Third Street Excelsior, MN 55331 (952) 474-5233 2015 WELLHEAD PROTECTION PLAN Part 2 WSB Project No. 2073-21 701 Xenia Avenue South, Suite 300 Minneapolis, MN 55416 Tel: (763) 541-4800
Assessment of the Groundwater Quantity Resulting from Artificial Recharge by Ponds at Ban Nong Na, Phitsanulok Province, Thailand
 Research article erd Assessment of the Groundwater Quantity Resulting from Artificial Recharge by Ponds at Ban Nong Na, Phitsanulok Province, Thailand SIRIRAT UPPASIT* Faculty of Technology, Khon Kaen
Grounding Water: An Exploration of the Unseen World Beneath Our Feet
 1 Grounding Water: An Exploration of the Unseen World Beneath Our Feet Kerry Schwartz, Director, Arizona Project WET Protect Your Groundwater Day: Tuesday, September 9, 2014 What I Hope to Convey Groundwater
County Geologic Atlases. Applications and Uses
 County Geologic Atlases Applications and Uses Jim Berg, Hydrogeologist Minnesota Department of Natural Resources Ecological and Water Resources, St. Paul, Minnesota County Geologic Atlas Progress 2013
THE DAVIS BASIN DO NOT DELAY IN GETTING STARTED RIGHT AWAY!
 THE DAVIS BASIN This is not a lab. It is a project where you are representing your own consulting firm. Make up a catchy name if you like and have fun with it. However, you are expected to perform at a
The Michigan Wellhead Protection Program Guide
 The Michigan Wellhead Protection Program Guide Michigan Department of Environmental Quality Drinking Water & Environmental Health Section February 2006 State of Michigan Jennifer Granholm, Governor Department
Regional Municipality of Peel
 Regional Municipality of Peel Wellhead Protection Area Delineations and Vulnerability Assessments for Alton 1-2 Standby Wells, Cheltenham PW1/ PW2 Amended PTTW, and Caledon Village Proposed Well 5 (TW2-05).
MEMORANDUM. Notice of Designation of a Special Well Construction Area in the City of Long Prairie, Todd County, Minnesota
 Protecting, maintaining and improving the health of all Minnesotans DATE: MEMORANDUM TO: FROM: SUBJECT: Licensed and Registered Well Contractors John Linc Stine, Director Environmental Health Division
DEVELOPMENT OF AQUIFER TESTING PLANS. Brent Bauman, P.G. / Erin Lynam, Aquatic Biologist
 DEVELOPMENT OF AQUIFER TESTING PLANS Brent Bauman, P.G. / Erin Lynam, Aquatic Biologist DEVELOPMENT OF AQUIFER TESTING PLANS Goals of Aquifer Testing What questions are we trying to answer Staff review
Albemarle County Hydrogeologic Assessment Summary Report
 Albemarle County Hydrogeologic Assessment Summary Report Phase II Groundwater Availability and Sensitivity Assessment with Proposed Groundwater Assessment Standards Presented To: County of Albemarle Department
Groundwater level fluctuations caused by surface hydrologic pulsing of a wetland
 Groundwater 53 Groundwater level fluctuations caused by surface hydrologic pulsing of a wetland Bo Zhang and Frank W. Schwartz Department of Geological Sciences, The Ohio State University Introduction
Office of Land and Water Evaluations of Groundwater Resources of Southern Mississippi
 Office of Land and Water Evaluations of Groundwater Resources of Southern Mississippi Virtually all of the water used for public and domestic drinking water supplies in southern Mississippi is derived
WELLHEAD PROTECTION PLAN Part 2
 WELLHEAD PROTECTION PLAN Part 2 Part 2: Potential Contaminant Source Management Strategy Impacts of Expected Changes to Land and Water Resources Issues, Problems & Opportunities Wellhead Protection Plan
AQUIFER STORAGE AND RECOVERY EVALUATION REPORT
 AQUIFER STORAGE AND RECOVERY EVALUATION REPORT Prepared for: CLALLAM COUNTY 228 East 4 th Street, Port Angeles, WA 98362 Prepared by: 12100 NE 195 th Street, Suite 200, Bothell, WA 99011 July 2003 TABLE
General Groundwater Concepts
 General Groundwater Concepts Hydrologic Cycle All water on the surface of the earth and underground are part of the hydrologic cycle (Figure 1), driven by natural processes that constantly transform water
Freight Street Development Strategy
 Freight Street Development Strategy Appendix B: Naugatuck River Floodplain Analysis Freight Street Development Strategy DECEMBER 2017 Page B-1 1.0 NAUGATUCK RIVER FLOODPLAIN AT FREIGHT STREET 1.1 Watershed
Groundwater in Bayfield County. Madeline Gotkowitz Hydrogeologist April 23, 2015
 Groundwater in Bayfield County Madeline Gotowitz Hydrogeologist April 23, 2015 Groundwater in Bayfield County Groundwater basics Hydrogeology across Wisconsin Hydrogeology in Bayfield County Mapping groundwater
Predicting Groundwater Sustainability: What Tools, Models and Data are Available?
 Predicting Groundwater Sustainability: What Tools, Models and Data are Available? Ray Wuolo Barr Engineering Company Assessing Sustainability is All About: Predicting (or describing) how potentiometric
Traditional DEP Programs. Newer DEP Programs. Connecticut s Aquifer Protection Area Program. CT Aquifer Protection History
 Department of Environmental Protection Bureau of Water Protection and Land Reuse Traditional DEP Programs Working together to protect, maintain & restore Connecticut s water resources Newer DEP Programs
Groundwater Modeling Guidance
 Groundwater Modeling Guidance Richard J. Mandle Groundwater Modeling Program Michigan Department of Environmental Quality Draft 1.0 10/16/02 Executive Summary The use of groundwater models is prevalent
Reference Guideline #1. Hydrogeological Impact Assessment
 Reference Guideline #1 Hydrogeological Impact Assessment Reference Guideline #1 Hydrogeological Impact Assessment Hydrogeological assessments are required for some subdivision applications when triggered
Safe Drinking Water Program. Public Water System Permitting
 Safe Drinking Water Program Public Water System Permitting NC Region DEP Regions in Susquehanna Basin PA Safe Drinking Water Program The Safe Drinking Water Program implements the 1984 Safe Drinking Water
STANDARDS AND GUIDELINES FOR MUNICIPAL WATERWORKS, WASTEWATER AND STORM DRAINAGE SYSTEMS
 STANDARDS AND GUIDELINES FOR MUNICIPAL WATERWORKS, WASTEWATER AND STORM DRAINAGE SYSTEMS January 2006 Drinking Water Branch Environmental Policy Branch Environmental Assurance Division Pub. No.: T/840
OAK RIDGES MORAINE Groundwater Program
 celebrating 10 ten years OAK RIDGES MORAINE Groundwater Program SINCE 2001 Understanding and collecting the wealth of hydrogeological information generated over the last few decades will allow us to move
Illinois State Water Survey Division
 Illinois State Water Survey Division GROUND-WATER SECTION SWS Contract Report 456 SUMMARY REPORT: REGIONAL ASSESSMENT OF THE GROUND-WATER RESOURCES IN EASTERN KANKAKEE AND NORTHERN IROQUOIS COUNTIES by
2.0 REGULATORY AND ENVIRONMENTAL ASSESSMENTS
 2.0 REGULATORY AND ENVIRONMENTAL ASSESSMENTS Regional Solid Waste Master Plan The City of Sioux Falls is committed to complying with all regulatory requirements for the design, construction, and operation
Groundwater in the Santa Rosa Plain
 . Groundwater in the Santa Rosa Plain Marcus Trotta, PG, CHg Principal Hydrogeologist Sonoma County Water Agency Santa Rosa Plain Groundwater Sustainability Agency October 12, 2017 www.sonomacountywater.org
PROTECTING GROUNDWATER IN MINING AREAS. MME Workshop Duluth 2015 Bruce Olsen
 PROTECTING GROUNDWATER IN MINING AREAS MME Workshop Duluth 2015 Bruce Olsen WHY PROTECT GROUNDWATER? Principal Source of Drinking Water in MN Recharges Many Lakes and Streams Extensively Used to Irrigate
San Mateo Plain Groundwater Basin Assessment Stakeholder Workshop #7 9 NOVEMBER 2017
 San Mateo Plain Groundwater Basin Assessment Stakeholder Workshop #7 9 NOVEMBER 2017 PRESENTATION OVERVIEW Introductions Project Overview Stakeholder Outreach Summary Phase 2 Updates Modeling Activities
GEOLOGIC ATLAS OF BENTON
 Mapping Glacial Aquifers in Central MN as a Resource for Local Management Jeremy Rivord DNR Ecological and Water Resources October 1, 2012 GEOLOGIC ATLAS OF BENTON COUNTY, MINNESOTA COUNTY ATLAS SERIES
Wellhead Protection Issues Related to Mining Activities Minnesota Rural Water Conference March 4, 2014
 Wellhead Protection Issues Related to Mining Activities Minnesota Rural Water Conference March 4, 2014 Terry Bovee Source Water Protection Unit Minnesota Department of Health Purpose Response to requests
MR. & MRS. HERBERT DAY 5595 Hartnell Road Site 7A - 5, R.R. 8 VERNON, B.C. V1T 8L6
 EVALUATION OF WATER SUPPLY FOR A PkOPOSED SUBDIVISION LOCATED NORTHWEST OF THE INTERSECTION OF HARTNELL ROAD AND DAY ROAD, AT VERNON, B.C. Prepared for MR. & MRS. HERBERT DAY 5595 Hartnell Road Site 7A
Karst Spring: Generalized Monitoring Strategy
 General Hydrologic Characteristics of Karst Springs Karst spring means a location of concentrated groundwater discharge from conduits in bedrock (predominantly solution enhanced conduits or zones in carbonate
Saint Louis Water Supply Replacement Gratiot Area Water Authority
 Saint Louis Water Supply Replacement Gratiot Area Water Authority Public Forum October 23, 2013 Introduction Welcome and Introductions Format of Meeting Slide Show Presentation Question and Answer Period
APPENDIX 5: SAMPLE MODEL RESULTS
 APPENDIX 5: SAMPLE MODEL RESULTS A. Evaluation of Groundwater Sustainability in the Ramsey Area B. Evaluation of Groundwater Sustainability in the Woodbury Area C. Evaluation of Future Drawdown Conditions
Performance and Analysis of Aquifer Slug Tests and Pumping Tests Policy
 Performance and Analysis of Aquifer Slug Tests and Pumping Tests Policy May 31, 2007 Table of Contents page Introduction... 2 (1) Purpose of policy...2 (2) Basis for technical approach...2 (3) The purpose
B-7. Predictive Assessment Model of Quaternary Alluvium Hydrogeology. J:\scopes\04w018\10000\FVD reports\final EIA\r-EIA app.doc
 B-7 Model of Quaternary Alluvium Hydrogeology J:\scopes\04w018\10000\FVD reports\final EIA\r-EIA app.doc PREDICTIVE ASSESSMENT MODELING OF THE QUATERNARY ALLUVIUM HYDROGEOLOGY EAGLE PROJECT MARQUETTE COUNTY,
CHAPTER 14: TOWN OF NEW TECUMSETH
 CHAPTER 14: TOWN OF NEW TECUMSETH TABLE OF CONTENTS 14 TOWN OF NEW TECUMSETH... 5 14.1 Introduction... 5 14.2 Drinking Water Systems... 5 14.3 Alliston Water Works (Alliston & Hillcrest Water Supplies)...
Assessing and Communicating Risk: A Partnership to Evaluate a Superfund Site on Leech Lake Tribal Lands. Executive Summary
 Assessing and Communicating Risk: A Partnership to Evaluate a Superfund Site on Leech Lake Tribal Lands Executive Summary Background This summary highlights findings and output of from a series of panels
Groundwater Level and Movement
 Groundwater Level and Movement Infiltration and Recharge Infiltration Entry of rain water into the ground. Recharge Addition of infiltrated water to the aquifer. Two types of Recharge- 1. Natural 2. Artificial
How to Fill Out TABLE 10 in Your 2016 Water Supply Plan Potential Water Supply Issues & Natural Resource Impacts
 How to Fill Out TABLE 10 in Your 2016 Water Supply Potential Water Supply Issues & Natural Impacts Complete Table 10 by listing the types of natural resources that are or could potentially be impacted
Potential effects evaluation of dewatering an underground mine on surface water and groundwater located in a rural area
 Potential effects evaluation of dewatering an underground mine on surface water and groundwater located in a rural area ITRODUCTIO Michel Mailloux* Eng. M.Sc, Vincent Boisvert, M.Sc, Denis Millette, Eng.,
Addendum to Groundwater Flow Modeling Conducted for Simulation of Rosemont Copper's Proposed Mine Supply Pumping Sahuarita, Arizona
 November 11, 2010 REPORT ADDENDUM Addendum to Groundwater Flow Modeling Conducted for Simulation of Rosemont Copper's Proposed Mine Supply Pumping Sahuarita, Arizona Prepared for: Prepared by: Errol L.
OUTLINE OF PRESENTATION
 GROUNDWATER?? OUTLINE OF PRESENTATION What is groundwater? Geologic investigation Definitions: aquifer and aquitard, unconfined and semi-confined Water level and interpretation of water level data Well
How & Where does infiltration work? Context: Summary of Geologic History Constraints/benefits for different geologic units
 Associated Earth Sciences, Inc. Associated Earth Sciences, Inc. Presented by: Matthew A. Miller, PE April 23, 2013 How & Where does infiltration work? Context: Summary of Geologic History Constraints/benefits
Environmental Management Chapter ALABAMA DEPARTMENT OF ENVIRONMENTAL MANAGEMENT WATER DIVISION-WATER SUPPLY PROGRAM ADMINISTRATIVE CODE
 ALABAMA DEPARTMENT OF ENVIRONMENTAL MANAGEMENT WATER DIVISION-WATER SUPPLY PROGRAM ADMINISTRATIVE CODE CHAPTER 335-7-15 SOURCE WATER ASSESSMENT PROGRAM TABLE OF CONTENTS 335-7-15-.01 Applicability 335-7-15-.02
T E C H N I C A L M E M O R A N D U M
 INTERA Incorporated 9600 Great Hills Trail, Suite 300W Austin, Texas, USA 78759 512.425.2000 T E C H N I C A L M E M O R A N D U M To: From: Barton Springs/Edwards Aquifer Conservation District Wade Oliver,
Fundamental of Groundwater Hydrology. Ted Way
 Fundamental of Groundwater Hydrology Ted Way Outline Hydrologic cycle Aquifers Basic groundwater equations Well drilling and completion Groundwater level and velocity Definition of key hydrologic parameters
Preliminary Assessment
 Preliminary Assessment Runnymede Playhouse Dayton Unit IV Dayton, Ohio Prepared by: U.S. Army Corps of Engineers Buffalo District 1776 Niagara Street Buffalo, NY 14207-3199 September 5, 2000 TABLE OF CONTENTS
How does groundwater get in the earth? Where does it come from?
 What is Groundwater? How does groundwater get in the earth? Where does it come from? Groundwater begins as rain or snow that falls to the ground. This is called precipitation. Only a small portion of this
Purpose: Continued development of a conceptual model, incorporating the hydrogeologic information.
 GEO 440 Homework 3 Homer Hazardous Waste Site II: Hydrogeologic Investigation Due: September 19 Overview: We will we be continuing the series of exercises that walk you through the modeling process. The
SECTION 3 NATURAL RESOURCES
 SECTION 3 NATURAL RESOURCES The natural environment plays a large role in planning for future development. Environmental conditions, such as topography, wetlands, floodplains, and water bodies, can often
Wellhead Protection Issues Related to Mining Activities Minnesota Department of Health August 2009
 SN' source water protection Wellhead Protection Issues Related to Mining Activities Minnesota Department of Health August 2009 Purpose - This document has been drafted in response to requests from local
STRAWMAN OUTLINE March 21, 2008 ISWS/ISGS REPORT ON THE OPPORTUNITIES AND CHALLENGES OF MEETING WATER DEMAND IN NORTH-EAST ILLINOIS
 STRAWMAN OUTLINE March 21, 2008 ISWS/ISGS REPORT ON THE OPPORTUNITIES AND CHALLENGES OF MEETING WATER DEMAND IN NORTH-EAST ILLINOIS REPORT TO BE DELIVERED TO THE RWSPG BY SEPTEMBER 30, 2008 Table of Contents
FREQUENTLY ASKED QUESTIONS GUELPH/GUELPH-ERAMOSA TIER 3 WATER BUDGET AND LOCAL AREA RISK ASSESSMENT STUDY
 FREQUENTLY ASKED QUESTIONS GUELPH/GUELPH-ERAMOSA TIER 3 WATER BUDGET AND LOCAL AREA RISK ASSESSMENT STUDY Contents Overview... 3 1. What is a Tier 3 Water Budget Study?... 3 2. How does a Tier 3 Water
Environment and Natural Resources Trust Fund 2010 Request for Proposals (RFP)
") LCCMR ID: 004-A1 Project Title: Environment and Natural Resources Trust Fund 2010 Request for Proposals (RFP) Next Generation in Water Supply Management-Pilot Studies LCCMR 2010 Funding Priority: A. Water
LCCMR ID: 004-A1 Project Title: Environment and Natural Resources Trust Fund 2010 Request for Proposals (RFP) Next Generation in Water Supply Management-Pilot Studies LCCMR 2010 Funding Priority: A. Water
Groundwater Flow Demonstration Model Activities for grades 4-12
 Groundwater Flow Demonstration Model Activities for grades 4-12 NR/WQ/2012-5 SET-UP Please allow time to practice using the groundwater model before conducting demonstrations. 1. Remove the groundwater
LAKE ARROWHEAD Hayes Township, Otsego County, Michigan. Preliminary Lake Level Augmentation Evaluation
 LAKE ARROWHEAD Hayes Township, Otsego County, Michigan Preliminary Lake Level Augmentation Evaluation LAKE ARROWHEAD PROPERTY OWNERS ASSOCIATION Gaylord, Michigan AGS Project No. 12-5020 April 12, 2012
Overview of Water Availability in Mississippi
 Overview of Water Availability in Mississippi April 6, 2016 Pat Phillips, RPG MDEQ - OLWR Mississippi s Abundant Water Resources Groundwater Surface Water Average Annual Precipitation in Mississippi Surface
Movement and Storage of Groundwater The Hydrosphere
 Movement and Storage of Groundwater The Hydrosphere The water on and in Earth s crust makes up the hydrosphere. About 97 percent of the hydrosphere is contained in the oceans. The water contained by landmasses
WELLHEAD PROTECTION PLAN
 April 2003 City of Cloquet, Minnesota WELLHEAD PROTECTION PLAN Part 2 Potential Contaminant Source Inventory Potential Contaminant Source Management Strategy Evaluation Plan Emergency/Conservation Plan
NOTE ON WELL SITING AT CORNER OF CASTLE VALLEY DRIVE AND SHAFER LANE FOR TOWN OF CASTLE VALLEY, GRAND COUNTY, UTAH
 NOTE ON WELL SITING AT CORNER OF CASTLE VALLEY DRIVE AND SHAFER LANE FOR TOWN OF CASTLE VALLEY, GRAND COUNTY, UTAH Authors: Dr. Kenneth E. Kolm, Hydrologic Systems Analysis, LLC., Golden, Colorado and
TITLE 252. DEPARTMENT OF ENVIRONMENTAL QUALITY CHAPTER 652. UNDERGROUND INJECTION CONTROL
 Codification through the 2016 legislative session. Subchapters 1, 3 and 11 Board adoption - June 16, 2015 Gubernatorial approval - June 9, 2016 Effective date - September 15, 2016 TITLE 252. DEPARTMENT
CHAPTER 32 - WELL ABANDONMENT ORDINANCE OF DUBUQUE COUNTY, IOWA. Adopted September 5, Part 1 Introduction...2
 CHAPTER 32 - WELL ABANDONMENT ORDINANCE OF DUBUQUE COUNTY, IOWA Adopted September 5, 1989 Table of Contents Page Part 1 Introduction...2 32-1 Purpose...2 32-2 Applicability...2 32-3 Definitions...2 32-4
Investigation of a Floodplain Pond to Improve Alluvial Aquifer Sustainability: A Quantity and Quality Report
 Investigation of a Floodplain Pond to Improve Alluvial Aquifer Sustainability: A Quantity and Quality Report Water Resources Investigation Report 16 i P a g e Investigation of a Floodplain Pond to Improve
PUBLIC WATER SUPPLY WELLHEAD PROTECTION REGULATIONS
 94.01 Definitions 94.06 Determination of Locations Within Zones 94.02 Maps of Zones of Influence 94.07 Enforcement and Penalties 94.03 Restrictions Within the Primary Protection Zone 94.08 Inspections
Hydrogeology and Simulation of Ground- Water Flow in a Glacial-Aquifer System at Cortland County, New York
 In Cooperation with Cortland County Soil and Water Conservation District Hydrogeology and Simulation of Ground- Water Flow in a Glacial-Aquifer System at Cortland County, New York The City of Cortland
May 3, Kimberly D. Bose, Secretary Federal Energy Regulatory Commission 888 First Street NE, Room 1A Washington, D.C
 1250 West Century Avenue Mailing Address: P.O. Box 5601 Bismarck, ND 58506-5601 (701) 530-1600 May 3, 2018 Kimberly D. Bose, Secretary Federal Energy Regulatory Commission 888 First Street NE, Room 1A
Calcareous Fen: Generalized Monitoring Strategy
 Calcareous Fen: Generalized Monitoring Strategy General Hydrologic Characteristics of Trout Streams Fens are wetlands fed by groundwater. Calcareous fens are wetlands fed by groundwater containing high
Delineation of Time-Related Recharge Areas for the City of Shelbyville Well Fields
 Contract Report 611 Delineation of Time-Related Recharge Areas for the City of Shelbyville Well Fields by Mark A. Anliker Office of Ground-Water Resource Evaluation & Management George S. Roadcap Office
Upper Basalt-Confined Aquifer
 2.14 Upper Basalt-Confined Aquifer D. R. Newcomer and J. P. McDonald Upper basalt-confined aquifer groundwater quality is monitored because of the potential for downward migration of contaminants from
Purpose. Utilize groundwater modeling software to forecast the pumping drawdown in a regional aquifer for public drinking water supply
 MODFLOW Lab 19: Application of a Groundwater Flow Model to a Water Supply Problem An Introduction to MODFLOW and SURFER The problem posed in this lab was reported in Chapter 19 of "A Manual of Instructional
15A NCAC 02C.0225 GROUNDWATER REMEDIATION WELLS (a) Groundwater Remediation Wells are used to inject additives, treated groundwater, or ambient air
 Groundwater Remediation Wells are used to inject additives, treated groundwater, or ambient air") 15A NCAC 02C.0225 GROUNDWATER REMEDIATION WELLS (a) Groundwater Remediation Wells are used to inject additives, treated groundwater, or ambient air for the treatment of contaminated soil or groundwater.
15A NCAC 02C.0225 GROUNDWATER REMEDIATION WELLS (a) Groundwater Remediation Wells are used to inject additives, treated groundwater, or ambient air for the treatment of contaminated soil or groundwater.
GROUND-WATER LEVELS AND RIVER-AQUIFER INTERACTIONS IN THE UPPER ARKANSAS RIVER CORRIDOR IN SOUTHWEST KANSAS
 GROUND-WATER LEVELS AND RIVER-AQUIFER INTERACTIONS IN THE UPPER ARKANSAS RIVER CORRIDOR IN SOUTHWEST KANSAS Presentation for Upper Arkansas CREP Educational Meetings Donald Whittemore University of Kansas
Lowen Hydrogeology Consulting Ltd.
 Consulting Ltd. September 23, 2012 LHC Project File: 1218 Shawnigan Residents Association PO Box 443 Shawnigan Lake, BC V0R 2W0 Attention : Gary Horwood, President Dear Sir: Re: Proposed SIA Contaminated
Characterizing Groundwater and Surface- Water Interactions in Selected Northeast Twin Cities Lakes
 Characterizing Groundwater and Surface- Water Interactions in Selected Northeast Twin Cities Lakes Chapter A: Statistical Analysis and Field Study Chapter B: Groundwater-Flow Simulation Perry M. Jones,
CCR RULE 40CFR LOCATION RESTRICTIONS CRITERIA CERTIFICATION REPORT ASH DISPOSAL FACILITY COMANCHE STATION PUEBLO, COLORADO
 CCR RULE 40CFR 257.60 64 LOCATION RESTRICTIONS CRITERIA CERTIFICATION REPORT ASH DISPOSAL FACILITY COMANCHE STATION PUEBLO, COLORADO Prepared For: Public Service Company of Colorado (PSCo) Prepared by:
Introduction to Groundwater
 Introduction to Groundwater Unit Essential Questions: How does the Earth cycle its water through its major reservoirs? How does society s use of resources affect water quality? Presentation Objectives:
Protecting, maintaining and improving the health of all Minnesotans MEMORANDUM
 Protecting, maintaining and improving the health of all Minnesotans DATE: MEMORANDUM TO: Licensed and Registered Well Contractors City of Minneapolis FROM: Patricia A. Bloomgren, Director Division of Environmental
FAX
 21335 Signal Hill Plaza Suite 100 Sterling, Virginia 20164 www.geotransinc.com 703-444-7000 FAX 703-444-1685 Mr. William Kutash Florida Department of Environmental Protection Waste Management Division
MODELLING THE GROUNDWATER FLOW FOR ESTIMATING THE PUMPING COST OF IRRIGATION IN THE AQUIFER OF N. MOUDANIA, GREECE
 Proceedings of the 13 th International Conference on Environmental Science and Technology Athens, Greece, 5-7 September 2013 MODELLING THE GROUNDWATER FLOW FOR ESTIMATING THE PUMPING COST OF IRRIGATION
ENGINEERING HYDROLOGY
 ENGINEERING HYDROLOGY Prof. Rajesh Bhagat Asst. Professor Civil Engineering Department Yeshwantrao Chavan College Of Engineering Nagpur B. E. (Civil Engg.) M. Tech. (Enviro. Engg.) GCOE, Amravati VNIT,
Clearwater WHP Plan Phase II Public Water Supply Profile ii
 Clearwater WHP Plan Phase II Public Water Supply Profile ii CHAPTER CONTENT PAGE I. Public Water Supply Profile - II. Documentation List - III. Executive Summary - IV. Chapter 1 - Data Elements and Assessment
CHAPTER 7 PHYSICAL INVENTORY OF THE CITY
 CHAPTER 7 PHYSICAL INVENTORY OF THE CITY Chapter 7: Physical Inventory of the City 39 This page intentionally left blank. Chapter 7: Physical Inventory of the City 40 SECTION 1 PHYSICAL SETTING While communities