Traffic Data Collection Programs for PM 2.5 Non-Attainment Areas
|
|
|
- Ashlie Phillips
- 5 years ago
- Views:
Transcription
1 Traffic Data Collection Programs for PM 2.5 Non-Attainment Areas Jack Stickel Alaska Department of Transportation and Public Facilities NATMEC 23 June, 2010 Traffic Data to Address Air Quality and Climate Change
2 Outline References Vehicle Miles Traveled Estimates PM 2.5 background PM 2.5 Fairbanks PM 2.5 Non-Attainment Area Transportation Conformity Determinations Motor Vehicle Emission Simulator (MOVES) Model Travel Demand Forecast Model Research Needs
3 VMT & PM 2.5 References Cooperative Planning and Analysis for Non-Attainment Areas Requirement 23 CFR (b) Review of Methods for Estimating Vehicle Miles Traveled EPA Technical Note on PM2.5 National Ambient Air Quality Standards (NAAQS) Alaska Recommendations for Designation of Areas EPA Response to Alaska Recommendations Alaska Comments on EPA Non-Attainment Boundary Determination EPA Final Rule - Air Quality Designations for the Hour PM2.5 NAAQS 14 Dec, 2009
4 VMT & PM 2.5 References EPA MOVES Model MOVES Technical Background Quick Response Freight Manual Simple Freight Growth Factor Methods Alaska State Implementation Plan Alaska 2011 Air Quality Monitoring Network State Air Quality Implementation Plan (SIP): Chapter 3 - Fairbanks Analysis of Fairbanks Winter Inversions Fairbanks Climatology
5 VMT & PM 2.5 References Development of the Fairbanks Metropolitan Area Transportation System (FMATS) Travel Demand Model for PM 2.5 Conformity Analysis Collecting Local Road Traffic Volumes for FMATS PM 2.5 Conformity Analysis and Regional VMT Estimation
6 VMT Estimates Survey Review* VMT estimate methods review: Highway Performance Monitoring System (HPMS) Indiana Dept of Transportation (INDOT) programs Highway and transit network models Fuel sales Odometer recordings Household and driver surveys Key points Principals and assumptions supporting the methods Potential sources of error INDOT statewide VMT estimates from traditional traffic count-based method percent higher than the cross-classification classification VMT estimation model estimates Review of Methods for Estimating Vehicle Miles Traveled Robert K. Kumapley and Jon D. Fricker
7 PM Background 2.5 Fine particles about 1/30 the diameter of a human hair Sources generally come from activities that burn fossil fuels, e.g., mobile sources,, power plants, industrial plants, wood burning,, heating oil, refineries Filterable fraction Condensable fraction Circumstances: Can remain suspended for long periods Can create health problems far away from emission sources
8 PM Background 2.5 Public Health Problems Aggravated asthma Increased respiratory symptoms, e.g., coughing and difficult/painful breathing Chronic bronchitis Decreased lung function Potential for premature death in people with heart and lung disease
9 PM Background 2.5 EPA Non - Attainment Designation Factors (EPA( 2008 Report) 1) Pollution emissions - (based on air quality sampling ) 2) Air quality data 3) Population density and degree of urbanization 4) Traffic and commuting patterns 5) Growth 6) Meteorology 7) Geography 8) Jurisdictional boundaries 9) Level of control of emissions sources
10 Fairbanks North Star Borough Non-Attainment Area City of Fairbanks and FNSB designations: CO non-attainment area 1990 CO maintenance area hour PM 2.5 NAAQS non-attainment area Dec 14, Extends beyond the MPO boundary PM 2.5 impacts acerbated by: PM 2.5 Severity of inversions Limited diurnal variation of mixing heights Lack of wind speed for extended periods
11 Fairbanks Non-Attainment Area Average chemical composition highest on winter days: Secondary aerosol related (40 55% monthly average): o o o o o SO 2 - sulfur dioxide (space heaters, wood burning) NH 3 - ammonia VOC - volatile organic compounds CO - carbon monoxide (stationary sources) NO X - nitrous oxide (power utilities, industrial sources Wood burning related emissions Unidentified zinc-related source Mobile emissions
12 Fairbanks North Star Borough

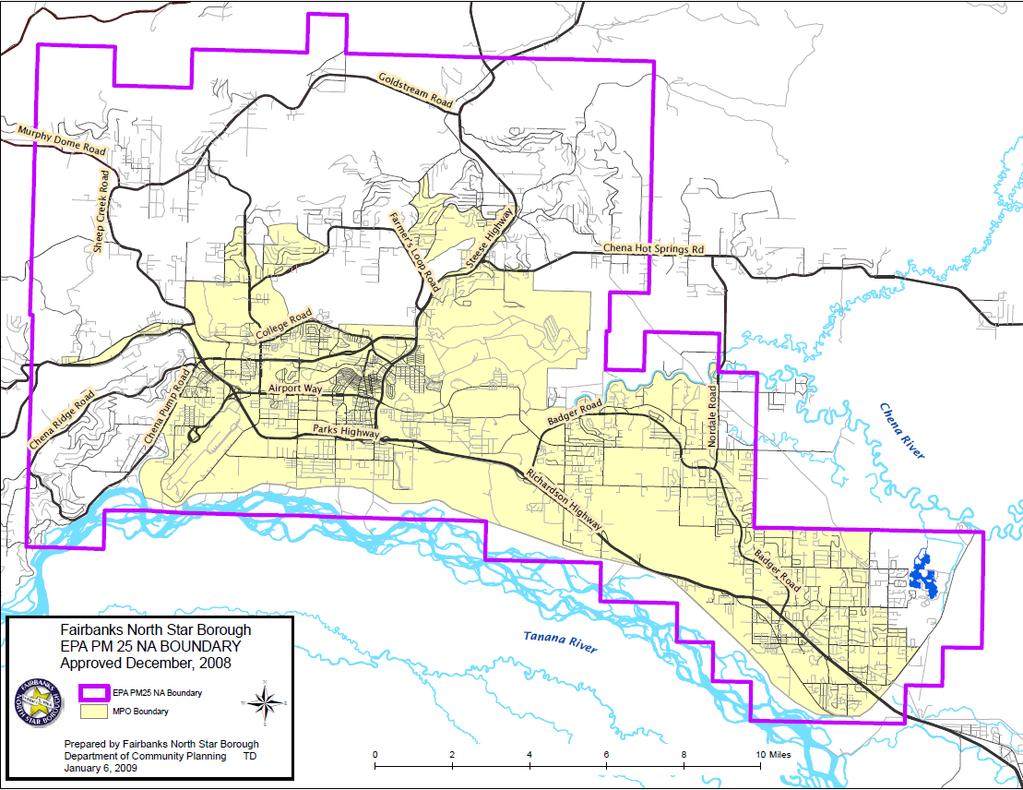
13 Fairbanks PM 2.5 Non-Attainment Area
14 Fairbanks Vehicle Miles Traveled (VMT) Growth Fairbanks Metropolitan Area Transportation System (FMATS) Long Range Transportation Plan (LRTP) Growth Factors Average growth modest : 1.1% average : 1.2% average : estimated 1.4% growth Focus on corridor specific VMT growth VMT estimation becomes important for nodes/links on transportation network
15 Transportation Conformity Determinations Within the Fairbanks PM Non-Attainment 2.5 Area CFR (b) - If the metropolitan planning area (MPA) does not include the entire non-attainment or maintenance area,, there shall be an agreement between the state department of transportation, state air quality agency, local agencies,, and MPO for planning and analysis. The agreement shall: Address projects outside the MPO but within the non-attainment area. Indicate how total transportation-related related emissions will be treated, for areas inside and outside MPA, for EPA conformity regulations. Address policy mechanisms for resolving conflicts concerning transportation-related related emissions
16 PM Non-Attainment 2.5 Area Roles and Responsibilities Department of Environmental Conservation Participate in the transportation conformity analysis for entire non-attainment area (shared with DOT). Provide technical and administrative assistance and assist in dealing with EPA, particularly in developing additional strategies to reduce PM 2.5 levels from mobile sources. Implement, along with the FNSB, air pollution control in the FNSB.
17 PM Non-Attainment 2.5 Area Roles and Responsibilities Department of Transportation & Public Facilities Take the lead in developing the transportation conformity analysis. Lead the regional Long Range Transportation Plan (LRTP)) that identifies a fiscally constrained transportation project list for the non-attainment area outside the MPA. Provide CMAQ funding for travel demand modeling and conformity determination.
18 PM Non-Attainment 2.5 Area Roles and Responsibilities Department of Transportation & Public Facilities Maintain a validated travel demand forecasting model for future vehicle miles of travel. Execute the conformity analysis using the Motor Vehicle Emission Simulator (MOVES) model or the latest EPA-approved model meeting the state plan and transportation conformity requirements. Develop future projections of travel using off- model projections such as the Highway Performance Monitoring System (HPMS).
19 PM Non-Attainment 2.5 Area Roles and Responsibilities Fairbanks Metropolitan Area Transportation System Participate in preparing the transportation conformity analysis for the non-attainment area Facilitate the Interagency Consultation Group to define the specific processes and adhere to the conformity determination schedule Coordinate future transportation plans with the development of transportation control measures
20 PM Non-Attainment 2.5 Area Roles and Responsibilities Fairbanks North Star Borough Participate in preparing the transportation conformity analysis for non-attainment area. Provide DOT a list of transportation projects for the PM 2.5 non-attainment area that are outside the MPA boundary. Assume responsibility for air pollution control in the Borough for mobile sources, residential homes, and small scale commercial activities. Provide planning assumptions to be used in developing the travel demand model.
21 Travel Demand Forecasting Model Need for new Travel Demand Model existing travel demand model is deficient in 3 areas: Air Quality - developed for CO conformity analysis. Need input to PM 2.5 conformity. Coverage captures traffic within the MPA. The MPA is substantially smaller than the PM 2.5 non- attainment area. Need increased traffic count coverage in non-attainment area. Technical specifications - fails to meet the model data traffic requirements. Need improved data input to the EPA s s new MOVES air quality model.
22 Motor Vehicle Emission Simulator (MOVES) Model Attributes Estimates air pollution emissions from mobile sources Provides estimates for exhaust and evaporative emissions Incorporates substantial new emissions test data Accounts for changes in vehicle technology & regulations Improved understanding of in-use emission levels and factors that influence them More flexibility for input and output options
23 Motor Vehicle Emission Simulator (MOVES) Model Attributes Can use, in most cases, existing MOBILE6 input parameters Uses a vehicle classification system based on the HPMS rather than the way they are classified in EPA emissions regulations.
24 Motor Vehicle Emission Simulator (MOVES) Model Features Execution Mode Run in County Level execution mode for State Implementation Plan (SIP) and regional transportation conformity use. (EPA recommendation) Driving Time Distributions 16 input speed bins by vehicle type, road type, time of day, and day of week. Ramp Fractions default fraction of ramp driving on selected road types, e.g., 8% of limited access VMT occurs on freeway ramps. Can be changed. Zone Road Activity provides override of the time provides override of the timeof-day distribution for any geographic subset.
25 Motor Vehicle Emission Simulator (MOVES) Model Attributes VMT Road Distribution VMT input by five road types: Off-network Rural restricted access Rural unrestricted access Urban restricted access Urban unrestricted access VMT Vehicle Type Distribution: VMT by vehicle type: Fleet population data compiled from Division of Motor Vehicles (DMV) registrations Sources such as Inspection and Maintenance (I/M) programs.
26 Model Challenges MOVES does not account for: benefits of motor block heater plug-ins Extended idle time to warm up vehicle block during cold weather Existing FMATS - region is smaller the PM region is smaller the PM 2.5 non- attainment area; travel is underestimated. Very limited cold weather test data incorporated in algorithms. Fairbanks test this past winter at temperatures below 0 o F to: Collect PM 2.5 at low temperatures Examine the effects of extended idle and block heater use on HC, CO, NO x, and PM 2.5.
27 Travel Demand Forecast Model Boundary expansion Improvements Retain the existing traffic analysis zone (TAZ ) structure within the MPO boundary. Add new TAZs that are outside the MPO boundary Network expansion: Add dd roads outside the MPA but within the PM 2.5 non- attainment area; new roads based on actual road network Ramp fractions: Use actual MPO ramp fractions in the PM 2.5 non- attainment area rather than default values
28 Travel Demand Forecast Model Improvements Demographic and employment data: Assemble ssemble demographic and employment data for the new TAZs and estimate future changes Driving Speed Calibration Calibrate model with field-measured driving speed data. Use GPS-based floating care method to collect speed on major roadways during morning and evening peak hours. Speed data not needed during off-peak hours due to lack of congestion. Use existing traffic volume data for linking volume to speed.
29 Travel Demand Forecast Model Improvements Calibration of link performance functions: Link performance functions for different types of roads using DOT volume and speed data. Estimate volume-link link running speeds using link performance functions. Analysis of heavy vehicles: Add a heavy vehicle VMT estimate and forecast component. Data source - DOT vehicle classification. Perform analysis using Methodologies in the Quick Response Freight Manual. Compare locally estimated VMT to VMT data from DMV registrations & I/M program.
30 Traffic Demand Forecast Model Improvements Seasonal traffic patterns: Analyze the seasonal variation of VMT by vehicle type using DOT vehicle classification data. Identify situations where seasonal VMT estimates are appropriate, e.g., heavy summer tourist traffic increases the seasonal traffic volume variability. Time of day calibration: Re-calibrate model for three different time periods: AM peak, PM peak, and off peak hours that includes a look at heavy vehicle traffic.
31 Traffic Demand Forecast Model Improvements Model re-calibration and validation: Re-calibrate expanded model and validate to the most current DOT volume data. Re-calibrate trip distribution results with travel time to work data from the US Census 2005 American Community Survey. Forecasting future traffic: Forecast orecast future traffic by modifying the calibrated and validated model based on future demographics and employment.
32 Sampling Plan for Traffic Volumes on Local Roads Four layers of data for identifying local road traffic count locations: PM2.5 non-attainment area MPO boundary Road centerlines Borough tax parcels Forecasting future traffic: Forecast orecast future traffic by modifying the calibrated and validated model based on future demographics and employment.
33 Sampling Plan for Traffic Volumes on Local Roads 1) Create new TAZs for the PM 2.5 area outside the MPO boundary following the layout of local road network and distribution of residential parcels 2) Create travel demand model links* for the local roads in the PM 2.5 non-attainment area to connect the new PM 2.5 TAZs. 3) Estimate the number of households for each PM 2.5 TAZ. 4) Run the extended travel demand model to calculate the number of trips generated for TAZ households in the PM2.5 and estimated traffic flows in the NA. PM 2.5
34 Sampling Plan for Traffic Volumes on Local Roads 5) Develop sampling plan to select 300 local roads in the entire PM 2.5 non-attainment area for traffic counts. 6) Enter counted traffic volumes into the travel model network 7) Estimate total VMT for the local roads in the PM 2.5 NA and the MPO boundaries using counted traffic data in conjunction with the travel model. 8) Report the estimates in HPMS. 9) Provide the estimates to the air quality conformity anlyst.
35 Sampling Plan for Traffic Volumes on Local Roads 10)Sample the local roads based on the traffic volume estimates following documented best practices Ensures that sufficient numbers of high volume roads are sampled. Because closely located links have higher probability of serving the same trip generating zones, oversampling from same area increases the change of missing critical links in other areas 11)Examine the sampling plan using the Origin-Destination (O-D) estimation procedure in TransCAD.
36 Research Needs Improved regional and statewide VMT estimates Improved algorithms for local VMT estimates Impact of extended idle and block heater use on HC, CO, NO x, and PM 2.5 emissions Larger data set of emissions at low temperatures (< -20 o F) for MOVES model Exact meteorological conditions required to accurately forecast exceedance conditions Better understanding of the exact percent contribution from non-wood contributions, e.g., mobile sources, waste oil, fuel oil, and coal Extent of PM 2.5 within isolated areas of the Borough
37 Jack Stickel Transportation Data Services Manager Division of Program Development Alaska Department of Transportation & Public Facilities Phone:
Wood-Washington-Wirt Interstate Planning Commission (WWW-IPC) PM 2.5 Air Quality Conformity Determination Report [2005]
![Wood-Washington-Wirt Interstate Planning Commission (WWW-IPC) PM 2.5 Air Quality Conformity Determination Report [2005]](/thumbs/94/120791542.jpg "Wood-Washington-Wirt Interstate Planning Commission (WWW-IPC) PM 2.5 Air Quality Conformity Determination Report [2005]") Wood-Washington-Wirt Interstate Planning Commission (WWW-IPC) PM 2.5 Air Quality Conformity Determination Report [2005] [Technical Report-Summary] Prepared by Sreevatsa Nippani, Transportation Specialist,
Wood-Washington-Wirt Interstate Planning Commission (WWW-IPC) PM 2.5 Air Quality Conformity Determination Report [2005] [Technical Report-Summary] Prepared by Sreevatsa Nippani, Transportation Specialist,
Appendix E. Air Quality Conformity Analysis
 Appendix E Air Quality Conformity Analysis AIR QUALITY CONFORMITY ANALYSIS FOR THE 2017-2020 REGIONAL TRANSPORTATION IMPROVEMENT PROGRAM Table of Contents INTRODUCTION... 1 AIR QUALITY STATUS... 1 Figure
Fine Particles in the Air
 Fine Particles in the Air Presentation for STAPPA Outreach Committee Rich Damberg, EPA Office of Air Quality Planning and Standards April 6, 2004 Particulate Matter: What is It? A complex mixture of extremely
Appendix C: GHG Emissions Model
 Appendix C: GHG Emissions Model 1 METHOD OVERVIEW The Maryland Statewide Transportation Model (MSTM) Emissions Model (EM) is a CUBE-based model that uses emission rates calculated by the MOVES2010 EPA
Appendix E. Air Quality Conformity Analysis
 Appendix E Air Quality Conformity Analysis AIR QUALITY CONFORMITY ANALYSIS FOR THE DRAFT 2019-2022 REGIONAL TRANSPORTATION IMPROVEMENT PROGRAM INTRODUCTION This paper documents the positive air quality
The Regional Transportation Plan Appendix D. Regional Air Quality Conformity Analysis. Puget Sound Regional Council.
 The 2018 Appendix D Regional Air Quality Conformity Analysis May 2018 Puget Sound Regional Council May 2018 Funding for this document provided in part by member jurisdictions, grants from U.S. Department
APPENDIX H: TRAVEL DEMAND MODEL VALIDATION AND ANALYSIS
 APPENDIX H: TRAVEL DEMAND MODEL VALIDATION AND ANALYSIS Travel demand models (TDM) simulate current travel conditions and forecast future travel patterns and conditions based on planned system improvements
CHAPTER 11. Air Quality and the Transportation Plan
 Chapter 11. Air Quality and the Transportation Plan 159 CHAPTER 11. Air Quality and the Transportation Plan Background Air quality in Anchorage is subject to national ambient air quality standards established
Conformity Analysis and Determination Report
 Conformity Analysis and Determination Report 2035 Long Range Transportation Plans: Burlington-Graham Metropolitan Planning Organization (Guilford County) Greensboro Urban Area Metropolitan Planning Organization
A. INTRODUCTION B. POLLUTANTS FOR ANALYSIS
 Chapter 2, Section F: Air Quality A. INTRODUCTION This section examines the potential for air quality impacts due to the proposed operational and geometric changes in traffic conditions along Fulton Street
Highlights from the 2012 FHWA EPA Northern Transportation and Air Quality Summit
 em summit highlights Highlights from the 2012 FHWA EPA Northern Transportation and Air Quality Summit by Kevin Black, Martin Kotsch, Michael Roberts, Greg Becoat, Melanie Zeman, Joseph Rich, Mark Glaze,
Air Quality Technical Report PM2.5 Quantitative Hot spot Analysis. A. Introduction. B. Interagency Consultation
 Air Quality Technical Report PM2.5 Quantitative Hot spot Analysis I 65, SR44 to Southport Road (Segmented from SR44 to Main Street and Main Street to Southport Road) A. Introduction This technical report
Fort Collins and Greeley Carbon Monoxide Maintenance Areas Conformity Determination
 Updated March 3, 2017 Fort Collins and Greeley Carbon Monoxide Maintenance Areas Conformity Determination for the North Front Range Metropolitan Planning Area 2040 Fiscally Constrained Regional Transportation
AIR QUALITY CONFORMITY ANALYSIS: VISUALIZE 2045 SCOPE OF WORK
 December 14, 2017 AIR QUALITY CONFORMITY ANALYSIS: VISUALIZE 2045 SCOPE OF WORK I. INTRODUCTION Projects solicited for the quadrennial update of the region s transportation plan, Visualize 2045, and the
Going One Step Beyond in North Denver
 Going One Step Beyond in North Denver A Neighborhood Scale Air Pollution Modeling Assessment Part I : Predicted Mobile Emissions in 2035 Michael Ogletree Denver Environmental Health Purpose To compare
AIR QUALITY CONFORMITY DETERMINATION FOR THE ANCHORAGE TRANSPORTATION IMPROVEMENT PROGRAM
 AIR QUALITY CONFORMITY DETERMINATION FOR THE 2010-2013 ANCHORAGE TRANSPORTATION IMPROVEMENT PROGRAM Prepared By: Municipality of Anchorage Community Planning & Development Department Transportation Planning
Final Revisions to the Primary National Ambient Air Quality Standard for Nitrogen Dioxide (NO 2 )
") Final Revisions to the Primary National Ambient Air Quality Standard for Nitrogen Dioxide (NO 2 ) General Overview Office of Air and Radiation Office of Air Quality Planning and Standards January 2010
Final Revisions to the Primary National Ambient Air Quality Standard for Nitrogen Dioxide (NO 2 ) General Overview Office of Air and Radiation Office of Air Quality Planning and Standards January 2010
2007 Chugiak-Eagle River Long-Range Transportation Plan and Transportation Improvement Program. PM-10 Air Quality Conformity Determination
 2007 Chugiak-Eagle River Long-Range Transportation Plan and 2006-2008 Transportation Improvement Program PM-10 Air Quality Conformity Determination Prepared By: Municipality of Anchorage Traffic Department
Triad Air Quality Conformity Determination Report 2040 Metropolitan Transportation Plan; and Transportation Improvement Plan (TIP)
") Triad Air Quality Conformity Determination Report 2040 Metropolitan Transportation Plan; and 2016-2020 Transportation Improvement Plan (TIP) Burlington-Graham Metropolitan Planning Organization (Guilford
Triad Air Quality Conformity Determination Report 2040 Metropolitan Transportation Plan; and 2016-2020 Transportation Improvement Plan (TIP) Burlington-Graham Metropolitan Planning Organization (Guilford
AIR QUALITY CONFORMITY ANALYSIS
 AIR QUALITY CONFORMITY ANALYSIS For the 2011 Regional Transportation Plan and 2013 Federal Transportation Improvement Program Adopted on July 25, 2012 Stanislaus Council of Governments 1111 I Street, Suite
9. TRAVEL FORECAST MODEL DEVELOPMENT
 9. TRAVEL FORECAST MODEL DEVELOPMENT To examine the existing transportation system and accurately predict impacts of future growth, a travel demand model is necessary. A travel demand model is a computer
OKI S CONFORMITY PROCESS
 AIR QUALITY CONFORMITY DETERMINATION FOR THE OKI 2040 METROPOLITAN TRANSPORTATION PLAN AND THE AMENDED OKI FY 2018 FY2021 TRANSPORTATION IMPROVEMENT PROGRAM (AMENDMENT 9C) FOR THE KENTUCKY PORTION OF THE
Implementation Issues for the PM 2.5 National Ambient Air Quality Standards PM 2.5 NAAQS
 Implementation Issues for the PM 2.5 National Ambient Air Quality Standards Update for MARAMA CEMS Webinar October 6, 2011 Rich Damberg US EPA Office of Air Quality Planning and Standards 1 PM 2.5 NAAQS
Air Quality Conformity Analysis Report NEPA MPO (Carbon County) 2015 TIP
 2015 TIP") Air Quality Conformity Analysis Report NEPA MPO (Carbon County) The Northeastern Pennsylvania Alliance (NEPA) Metropolitan Planning Organization (MPO) Portion of the Allentown-Bethlehem-Easton, Pennsylvania
Air Quality Conformity Analysis Report NEPA MPO (Carbon County) The Northeastern Pennsylvania Alliance (NEPA) Metropolitan Planning Organization (MPO) Portion of the Allentown-Bethlehem-Easton, Pennsylvania
Introduction to MOVES for Non-Modelers
 Introduction to MOVES for Non-Modelers David Bizot U.S. EPA Office of Transportation and Air Quality Southern Transportation & Air Quality Summit July 2011 Training Outline What is MOVES? How is MOVES
Air Q ualit y Con formity Det er minat ion a n d Document at io n 8 -Hour Ozone & P M 2.5
 AQ Air Q ualit y Con formity Det er minat ion a n d Document at io n 8 -Hour Ozone & P M 2.5 2022 Transportation t Program and related amendments t o Connected2045, t h e transportation plan for the St.
Air Q ualit y Con formity Det er minat ion a n d Document at io n 8 -Hour Ozone & P M 2.5
 AQ Air Q ualit y Con formity Det er minat ion a n d Document at io n 8 -Hour Ozone & P M 2.5 2022 Transportation t Program and related amendments t o Connected2045, t h e transportation plan for the region.
ECONOMIC IMPACTS ASSOCIATED WITH AIR QUALITY
 ECONOMIC IMPACTS ASSOCIATED WITH AIR QUALITY Regions As The Building Blocks of The Global Economy May 28, 2008 Chris Klaus Senior Program Manager North Central Texas Council of Governments ECONOMIC IMPACTS
MONITORING IMPLEMENTATION AND PERFORMANCE
 12 MONITORING IMPLEMENTATION AND PERFORMANCE The FAST Act continues the legislation authorized under MAP-21, which created a data-driven, performance-based multimodal program to address the many challenges
Air Quality Conformity Analysis Report Lehigh Valley MPO TIP and 2040 LRTP
 Air Quality Conformity Analysis Report Lehigh Valley MPO National Ambient Air Quality Standards (NAAQS) Addressed: - 2008 8-Hour Ozone (Nonattainment) - 2006 24-Hour PM2.5 (Maintenance) Prepared by: The
Database and Travel Demand Model
 Database and Travel Demand Model 7 The CMP legislation requires every CMA, in consultation with the regional transportation planning agency (the Metropolitan Transportation Commission (MTC) in the Bay
Chapter #9 TRAVEL DEMAND MODEL
 Chapter #9 TRAVEL DEMAND MODEL TABLE OF CONTENTS 9.0 Travel Demand Model...9-1 9.1 Introduction...9-1 9.2 Overview...9-1 9.2.1 Study Area...9-1 9.2.2 Travel Demand Modeling Process...9-3 9.3 The Memphis
Transportation Conformity Guidance for Qualitative Hot-spot Analyses in PM 2.5 and PM 10 Nonattainment and Maintenance Areas
 Transportation Conformity Guidance for Qualitative Hot-spot Analyses in PM 2.5 and PM 10 Nonattainment and Maintenance Areas United States Environmental Protection Agency Federal Highway Administration
AIR QUALITY CONFORMITY ANALYSIS of the 2015 CLRP Amendment and the FY TIP
 TPB Item #8 AIR QUALITY CONFORMITY ANALYSIS of the 2015 CLRP Amendment and the FY2015-2020 TIP Presentation to the Transportation Planning Board September 16, 2015 Pollutants Volatile Organic Compounds
New Castle County Air Quality Conformity Determination
 New Castle County Air Quality Conformity Determination for the FY 2014 2017 Transportation Improvement Program and 2040 Regional Transportation Plan Partners with you in transportation planning FY 2014
RESEARCH TRIANGLE REGION Conformity Determination Report. Amended 2035 Long Range Transportation Plan Transportation Improvement Program
 RESEARCH TRIANGLE REGION Conformity Determination Report Amended 2035 Long Range Transportation Plan 2012 2018 Transportation Improvement Program Durham-Chapel Hill-Carrboro MPO Burlington-Graham MPO NC
Wildfires: Smoke Impacts and Public Health Protection
 Wildfires: Smoke Impacts and Public Health Protection Julie Hunter, Senior Air Quality Specialist Washoe County Health District, Air Quality Management Division Great Basin Climate Forum December 6, 2018
Air Quality Conformity Analysis Report Johnstown Area Transportation Study (JATS) TIP and 2040 LRTP
 TIP and 2040 LRTP") Air Quality Conformity Analysis Report Johnstown Area Transportation Study (JATS) 20175 TIP and 2040 LRTP NAAQS Addressed: Cambria County Portion of Maintenance Area - 1997 Annual PM 2.5-2006 24-Hour PM
Air Quality Conformity Analysis Report Johnstown Area Transportation Study (JATS) 20175 TIP and 2040 LRTP NAAQS Addressed: Cambria County Portion of Maintenance Area - 1997 Annual PM 2.5-2006 24-Hour PM
IMPLICATIONS OF BEING DESIGNATED NONATTAINMENT
 IMPLICATIONS OF BEING DESIGNATED NONATTAINMENT WTS San Antonio/SWITE Professional Development Seminar Jenny Narvaez, Principal Air Quality Planner North Central Texas Council of Governments August 4, 2017
FHWA COST EFFECTIVENESS TABLES SUMMARY
 FHWA COST EFFECTIVENESS TABLES SUMMARY FHWA COST EFFECTIVENESS TABLES Summary... 1 Background And Summary Finding... 1 Introduction... 1 MAP-21... 2 Key Analytical Assumptions and Limitations... 2 Development
VEHICLE PARTICULATE EMISSIONS ANALYSIS
 VEHICLE PARTICULATE EMISSIONS ANALYSIS Prepared for ARIZONA DEPARTMENT OF TRANSPORTATION TRANSPORTATION PLANNING DIVISION MPOs/COGs AIR QUALITY POLICY AND LOCAL PROGRAMS SECTION AND YUMA METROPOLITAN PLANNING
I. Overview. II. Background. Light-Duty Motor Vehicle Emissions Standards
 Summary of NESCAUM Analysis Evaluating the NOx, HC, and CO Emission Reduction Potential from Adoption of the California Low Emission Vehicle (LEV II) Standards June, 2005 I. Overview This summary provides
Final Updates to National Ambient Air Quality Standards (NAAQS) for Ozone. October 2015
 for Ozone. October 2015") Final Updates to National Ambient Air Quality Standards (NAAQS) for Ozone October 2015 What we ll cover 2015 Final 8-hour Ozone Standards Primary: 70 ppb Secondary: 70 ppb Areas will meet the standards
Final Updates to National Ambient Air Quality Standards (NAAQS) for Ozone October 2015 What we ll cover 2015 Final 8-hour Ozone Standards Primary: 70 ppb Secondary: 70 ppb Areas will meet the standards
7.1 BICYCLE RIDERSHIP Estimated Current and Increased Bike Ridership
 CHAPTER 7 7.1 BICYCLE RIDERSHIP 7.1.1 Estimated Current and Increased Bike Ridership 7.2 IMPROVED AIR QUALITY 7.2.1 Annual Pollution from 7.2.2 National and State Ambient Air Quality Standards 7.2.3 Ozone
AMENDMENT TO INCLUDE THE KNIK ARM CROSSING in the 2025 ANCHORAGE LONG-RANGE TRANSPORTATION PLAN CARBON MONOXIDE AIR QUALITY CONFORMITY DETERMINATION
 AMENDMENT TO INCLUDE THE KNIK ARM CROSSING in the 2025 ANCHORAGE LONG-RANGE TRANSPORTATION PLAN CARBON MONOXIDE AIR QUALITY CONFORMITY DETERMINATION Prepared By: Municipality of Anchorage Traffic Department
Project Summary. AMPO Air Quality Work Group. Rich Denbow. April 27-28, presented to. presented by
 NCHRP 25-38, Input Guidelines for MOVES Project Summary presented to AMPO Air Quality Work Group presented by Rich Denbow April 27-28, 2015 Objectives and Products Objective» Produce guidelines for transportation
Pinal County Nonattainment Areas Regional Emissions Analysis
 CONSULTATION ON A CONFORMITY ASSESSMENT FOR AN AMENDMENT TO THE FY 2016-2025 SUN CORRIDOR MPO TRANSPORTATION IMPROVEMENT PROGRAM AND REGIONAL TRANSPORTATION PLAN 2040 The Sun Corridor Metropolitan Planning
Air Quality Conformity Analysis Report Lebanon County MPO 2015 TIP and 2040 LRTP
 Air Quality Conformity Analysis Report Lebanon County MPO Addressing the 2012 Annual PM 2.5 National Ambient Air Quality Standards Lebanon County Nonattainment Area Prepared by: The LEBCO MPO and Pennsylvania
Air Quality Conformity Analysis Report Cambria County Metropolitan Planning Organization (CCMPO) TIP and 2040 LRTP
 TIP and 2040 LRTP") Air Quality Conformity Analysis Report Cambria County Metropolitan Planning Organization (CCMPO) 2019-2022 TIP and 2040 LRTP National Ambient Air Quality Standards (NAAQS) Addressed: - 1997 8-Hour Ozone
Air Quality Conformity Analysis Report Cambria County Metropolitan Planning Organization (CCMPO) 2019-2022 TIP and 2040 LRTP National Ambient Air Quality Standards (NAAQS) Addressed: - 1997 8-Hour Ozone
DRAFT 2015 OZONE CONFORMITY ANALYSIS FOR THE 2019 FEDERAL TRANSPORTATION IMPROVEMENT PROGRAM AND THE 2018 REGIONAL TRANSPORTATION PLAN
 DRAFT 2015 OZONE CONFORMITY ANALYSIS FOR THE 2019 FEDERAL TRANSPORTATION IMPROVEMENT PROGRAM AND THE 2018 REGIONAL TRANSPORTATION PLAN JANUARY 9, 2019 KINGS COUNTY ASSOCIATION OF GOVERNMENTS This report
Oregon. 800 NE Oregon St. #640 Portland, OR (971)
") Air Quality Frequently Asked Questions Oregon Environmental Public Health Tracking (EPHT) Oregon ENVIRONMENTAL PUBLIC HEALTH TRACKING 800 NE Oregon St. #640 Portland, OR 97232 www.oregon.gov/dhs/ph/epht
Air Quality Frequently Asked Questions Oregon Environmental Public Health Tracking (EPHT) Oregon ENVIRONMENTAL PUBLIC HEALTH TRACKING 800 NE Oregon St. #640 Portland, OR 97232 www.oregon.gov/dhs/ph/epht
A. INTRODUCTION AND METHODOLOGY
 Chapter 10: Air Quality A. INTRODUCTION AND METHODOLOGY The different alternatives being evaluated as part of the Manhattan East Side Transit Alternatives Study have the potential to result in air quality
Travel Demand Modeling Applications How Modeling is Being Used to Address the Big Issues of Transportation Planning
 How Modeling is Being Used to Address the Big Issues of Transportation Planning Presented by: Dean Munn The Corradino Group Topics This Presentation is organized around two main topics: What is a travel
Air Quality in the San Joaquin Valley
 Air Quality in the San Joaquin Valley Core Values of the Valley Air District Protection of public health Active and effective air pollution control efforts with minimal disruption to the Valley s economic
Air Quality Conformity. TTP220 S. Handy 4/25/16
 Air Quality Conformity TTP220 S. Handy 4/25/16 The 4-Step Model INPUTS? Land use data Network Population, income, autos by zone Employment by type by zone Represented as nodes and links Travel times from
APPENDIX TRAVEL DEMAND MODELING OVERVIEW MAJOR FEATURES OF THE MODEL
 APPENDIX A TRAVEL DEMAND MODELING OVERVIEW The model set that the Central Transportation Planning Staff (CTPS), the Boston Region Metropolitan Planning Organization s (MPO) technical staff, uses for forecasting
USDOT PERFORMANCE BASED PLANNING AND PROGRAMMING (PBPP)
") USDOT PERFORMANCE BASED PLANNING AND PROGRAMMING (PBPP) Eric Randall TPB Transportation Engineer Jane Posey TPB Transportation Engineer MWAQC TAC February 14, 2017 Agenda Item 4 Performance Based Planning
USDOT PERFORMANCE BASED PLANNING AND PROGRAMMING (PBPP) Eric Randall TPB Transportation Engineer Jane Posey TPB Transportation Engineer MWAQC TAC February 14, 2017 Agenda Item 4 Performance Based Planning
Clean Air Interstate Rule (CAIR)
") Clean Air Interstate Rule (CAIR) Reducing Power Plant Emissions for Cleaner Air, Healthier People, and a Strong America Office of Air and Radiation March 2005 Benefits of the Clean Air Interstate Rule
Clean Air Interstate Rule (CAIR) Reducing Power Plant Emissions for Cleaner Air, Healthier People, and a Strong America Office of Air and Radiation March 2005 Benefits of the Clean Air Interstate Rule
DRAFT - Air Quality Conformity Analysis
 Anderson Metropolitan Planning Organization Columbus Metropolitan Planning Organization Indiana Department of Transportation Indianapolis Metropolitan Planning Organization DRAFT - Air Quality Conformity
Crittenden County NOx, VOC & CO Emission Inventory Ozone NAAQS Nonattainment
 Crittenden County NOx, VOC & CO Emission Inventory 2008 NAAQS Nonattainment 2014 TABLE OF CONTENTS 1 Introduction 2 A. Background B. Emissions Summary Section I 3 Area Source Inventory Section II 6 On-road
APPENDIX D. Glossary D-1
 APPENDIX D Glossary D-1 Glossary of Transportation Planning Terms ANNUAL AVERAGE DAILY TRAFFIC (AADT): The total number of vehicles passing a given location on a roadway over the course of one year, divided
YORK TOLL PLAZA MAINE TURNPIKE AUTHORITY AIR QUALITY REPORT. September 28, 2016 NOISE ANALYSIS REPORT MAINETURNPIKE AUTHORI TY
 NOISE ANALYSIS REPORT MAINETURNPIKE AUTHORI TY YORK TOLL PLAZA MAINE TURNPIKE AUTHORITY AIR QUALITY REPORT September 28, 2016 (Cover photograph provided by MTA) TABLE OF CONTENTS 1.0 EXECUTIVE SUMMARY...
Air Quality Conformity Determination
 14 Air Quality Conformity Determination 2016 Regional Transportation Plan 14 Air Quality Conformity Determination Amended 8/28/18 Introduction This report documents the air quality conformity determination
APPENDIX VIII AIR QUALITY CONFORMITY ANALYSIS
 2018 Kings County Regional Transportation Plan APPENDIX VIII AIR QUALITY CONFORMITY ANALYSIS H:\RTPA\2018 RTP Update\Final RTP\APPENDIX VIII - Air Quality Conformity Title Page.docx Appendix VIII CONFORMITY
AMENDMENT TWO TO CHARTING PROGRESS TO 2040
 A2 AMENDMENT TWO TO CHARTING PROGRESS TO 2040 AIR QUALITY CONFORMITY DETERMINATION MASSACHUSETTS DEPARTMENT OF TRANSPORTATION AND THE METROPOLITAN PLANNING ORGANIZATIONS JULY 2018 INTRODUCTION This report
Particulate Matter Air Pollution and Health Risks ( edited for AHS APES)
") Particulate Matter Air Pollution and Health Risks ( edited for AHS APES) What is Particulate Matter? Image from http://www.epa.gov/eogapti1/ module3/distribu/distribu.htm Particulate matter (PM) describes
Particulate Matter Air Pollution and Health Risks ( edited for AHS APES) What is Particulate Matter? Image from http://www.epa.gov/eogapti1/ module3/distribu/distribu.htm Particulate matter (PM) describes
August 25, Ms. Margaret Carpenter State of Alaska Department of Transportation and Public Facilities 2301 Peger Road Fairbanks, AK 99709
 August 25, 2016 Ms. Margaret Carpenter State of Alaska Department of Transportation and Public Facilities 2301 Peger Road Fairbanks, AK 99709 RE: FMATS FFY17-FFY18 Unified Planning Work Program (UPWP)
6.1 INTRODUCTION 6.2 REGULATORY FRAMEWORK NATIONAL AMBIENT AIR QUALITY STANDARDS COMPLIANCE STATUS TRANSPORTATION CONFORMITY
 Chapter 6 Air Quality 6.1 INTRODUCTION This chapter presents a project-level analysis of the potential for air quality impacts that could result from mobile and stationary sources of air emissions generated
I-70 East ROD 1: Phase 1 (Central 70 Project) Air Quality Conformity Technical Report
 Air Quality Conformity Technical Report") I-70 East ROD 1: Air Quality Conformity Technical Report January 2017 I-70 East ROD 1: Air Quality Conformity Technical Report TABLE OF CONTENTS Chapter Page 1 PURPOSE OF THIS REPORT... 1 2 PROJECT DESCRIPTION...
I-70 East ROD 1: Air Quality Conformity Technical Report January 2017 I-70 East ROD 1: Air Quality Conformity Technical Report TABLE OF CONTENTS Chapter Page 1 PURPOSE OF THIS REPORT... 1 2 PROJECT DESCRIPTION...
Traffic Data Quality Analysis. James Sturrock, PE, PTOE, FHWA Resource Center Operations Team
 Traffic Analysis James Sturrock, PE, PTOE, FHWA Resource Center Operations Team Source Material Traffic Measurement http://ntl.bts.gov/lib/jpodocs/repts_te/14058.htm Seven DEADLY Misconceptions about Information
PURPOSE OF THE TRANSPORTATION IMPROVEMENT PROGRAM (TIP)
") INTRODUCTION PURPOSE OF THE TRANSPORTATION IMPROVEMENT PROGRAM (TIP) The Transportation Improvement program (TIP) is a staged, four-year program of projects proposed for funding by federal, State, and
INTRODUCTION PURPOSE OF THE TRANSPORTATION IMPROVEMENT PROGRAM (TIP) The Transportation Improvement program (TIP) is a staged, four-year program of projects proposed for funding by federal, State, and
A. INTRODUCTION B. POLLUTANTS FOR ANALYSIS
 Chapter 18: Air Quality A. INTRODUCTION The potential for air quality impacts from the proposed project is examined in this chapter. Air quality impacts can be either direct or indirect. Direct impacts
AIR QUALITY CONFORMITY DETERMINATION
 AIR QUALITY CONFORMITY DETERMINATION Massachusetts Department of Transportation (MassDOT) and the Metropolitan Planning Organizations (MPOs) Introduction July 2018 This report documents the air quality
AIR QUALITY CONFORMITY DETERMINATION
 Massachusetts Department of Transportation (MassDOT) and the Metropolitan Planning Organizations (MPOs) July 2018 Introduction This report documents the air quality conformity determination for the Massachusetts
AIR QUALITY CONFORMITY DETERMINATION
 Massachusetts Department of Transportation (MassDOT) and the Metropolitan Planning Organizations (MPOs) July 2018 Introduction This report documents the air quality conformity determination for the Massachusetts
Air Quality Conformity Determination
 Air Quality Conformity Determination Between The 2040 Comprehensive Regional Plan, as amended The Fiscal Year 2012 to 2015 Transportation Improvement Program, as amended and The Indiana State Implementation
OUR NATION'S AIR STATUS AND TRENDS THROUGH 2015 WELCOME!
 Page 1 of 14 OUR NATION'S AIR STATUS AND TRENDS THROUGH 2015 WELCOME! The U.S. Environmental Protection Agency (EPA) is committed to protecting public health by improving air quality and reducing air pollution.
Americans make the equivalent of round
 AIR POLLUTION CE 326 Principles of Environmental Engineering Prof. Tim Ellis January 18, 2008 Air Pollution Factoids Americans make the equivalent of round trips to the moon each year in their automobiles.
REDESIGNATION REQUEST AND MAINTENANCE PLAN FOR THE CINCINNATI-HAMILTON, OH-KY-IN 8- HOUR OZONE NONATTAINMENT AREA
 REDESIGNATION REQUEST AND MAINTENANCE PLAN FOR THE CINCINNATI-HAMILTON, OH-KY-IN 8- HOUR OZONE NONATTAINMENT AREA Butler, Clermont, Clinton, Hamilton, and Warren Counties, Ohio Prepared by: Ohio Environmental
Proposed Comprehensive Update to the State of Rhode Island s Congestion Management Process
 Proposed Comprehensive Update to the State of Rhode Island s Statewide Planning Program January 2018 Summary Outline of of Action Steps 1. Develop Objectives for Congestion Management What is the desired
Wildfire Mitigation Plan for the Sacramento Federal Nonattainment Area for PM 2.5. (Aerial view of the Tubbs and Pocket fires, 10/12/2017)
") Wildfire Mitigation Plan for the Sacramento Federal Nonattainment Area for PM 2.5 (Aerial view of the Tubbs and Pocket fires, 10/12/2017) August 2018 El Dorado County Air Quality Management District Dave
Wildfire Mitigation Plan for the Sacramento Federal Nonattainment Area for PM 2.5 (Aerial view of the Tubbs and Pocket fires, 10/12/2017) August 2018 El Dorado County Air Quality Management District Dave
PM 2.5 Conformity Hot-spot Analysis for Fairbanks, Alaska
 PM 2.5 Conformity Hot-spot Analysis for Fairbanks, Alaska November 24, 2010 Practical Overview While a process is needed to meet the PM 2.5 project-level requirements after December 14, 2010, it is unlikely
Air Quality Analysis Report. Appendix H. Air Quality Analysis Report
 Air Quality Analysis Report Appendix H Air Quality Analysis Report I-35W North Corridor Project EA Minnesota Department of Transportation MEMORANDUM To: From: Brett Danner SRF Consulting Group, Inc. John
TRANSPORTATION PERFORMANCE MANAGEMENT Asset Management and Pavement Performance Measures The 30, mile view.
 TRANSPORTATION PERFORMANCE MANAGEMENT Asset Management and Pavement Performance Measures The 30,000 250 mile view. 1 Transportation Performance Management 2 2 Transportation Performance Management (TPM)
Air Quality Conformity Determination
 Air Quality Conformity Determination For the New Castle County, Delaware Portion of the PA-NJ-MD-DE 8-hour Ozone Nonattainment Area & PA-NJ-DE Fine Particulate Matter (PM2.5) Maintenance Area FY2017 2020
WASHINGTON COUNTY. Air Quality PM2.5
 WASHINGTON COUNTY Air Quality PM2.5 Introduction Background This presentation explains an air quality issue in Washington County (WC) as it relates to fine particulate pollution (PM2.5). Immediate plan
National Ambient Air Quality Standards, Implementation Plans and Public Participation. Laura McKelvey U.S. EPA
 National Ambient Air Quality Standards, Implementation Plans and Public Participation Laura McKelvey U.S. EPA mckelvey.laura @epa.gov Topics What are the NAAQS? Why are they important? What is the air
Clean Air and Climate Protection Software Overview
 STAPPA/ALAPCO Clean Air and Climate Protection Software Overview * * * On-Line Training Session* * * October 5, 2005 Jim Yienger and Ryan Bell ICLEI CCP The Cities for Climate Protection Campaign CCP is
TOWN OF BARGERSVILLE DEPARTMENT OF DEVELOPMENT TRAFFIC STUDY GUIDELINES
 TOWN OF BARGERSVILLE DEPARTMENT OF DEVELOPMENT TRAFFIC STUDY GUIDELINES Town of Bargersville Department of Development 24 North Main Street, P.O. Box 420 Bargersville, Indiana 46106 Adopted by the Bargersville
Air pollution is caused by high concentrations of gases and particles emitted form combustion sources (vehicles, power plants, industries)
") AIR POLLUTION Clean Air Act & Criteria Pollutants 7.1-7.5 Motor Vehicle Emissions: 7.8 Indoor Air and Box Models: 7.12 Air Pollution Meteorology: 7.10 Gaussian Plume Modeling: 7.11 1 Air pollution is caused
AIR POLLUTION Clean Air Act & Criteria Pollutants 7.1-7.5 Motor Vehicle Emissions: 7.8 Indoor Air and Box Models: 7.12 Air Pollution Meteorology: 7.10 Gaussian Plume Modeling: 7.11 1 Air pollution is caused
Association for Commuter Transportation Recommendations to USDOT on MAP-21 Performance Measures
 Association for Commuter Transportation 1341 G Street, NW, 10th Floor Washington, DC 20005 Tel: 202.719.5331 www.actweb.org Association for Commuter Transportation Recommendations to USDOT on MAP-21 Performance
CHAPTER 7. TRAVEL PATTERNS AND TRAVEL FORECASTING
 CHAPTER 7. TRAVEL PATTERNS AND TRAVEL FORECASTING TRAVEL PATTERNS Northwest Arkansas has experienced unprecedented growth in population and employment in the past 25 years. The economic vitality and diversity
Evaluation and Sensitivity Analysis of MOVES Input Data Submitted for the 2011 National Emissions Inventory
 1 2 3 4 5 6 7 8 9 10 11 12 13 14 15 16 17 18 19 20 21 22 23 24 25 26 27 28 29 30 31 32 33 34 35 36 37 38 39 40 41 42 43 44 45 46 47 14-2989 Evaluation and Sensitivity Analysis of MOVES Input Data Submitted
Draft Air Quality Analysis Protocol. Detroit River International Crossing Environmental Impact Statement
 Draft Air Quality Analysis Protocol Detroit River International Crossing Environmental Impact Statement May 31, 2007 1. Introduction Under the National Environmental Policy Act (NEPA), federal agencies
4.2 Air Quality and Greenhouse Gas
 4.2 Air Quality and Greenhouse Gas Federal agencies are required under the Clean Air Act (CAA) to ensure that projects they fund (such as the Center City Connector) are in compliance with existing federal
Air Quality Memorandum
 Air Quality Memorandum REPORT NO. 33 DATE October 22, 2015 SUBJECT **DRAFT** CONFORMITY ANALYSIS FOR THE AMENDED WFRC 2015-2040 REGIONAL TRANSPORTATION PLAN. ABSTRACT The Moving Ahead for Progress in the
A. INTRODUCTION B. POLLUTANTS FOR ANALYSIS
 Chapter 18: Air Quality A. INTRODUCTION The potential for air quality impacts from the proposed project is examined in this chapter. Air quality impacts can be either direct or indirect. Direct impacts
Air Quality Memorandum
 Air Quality Memorandum REPORT NO. 34 DATE May 7, 2016 SUBJECT **DRAFT** CONFORMITY ANALYSIS FOR THE AMENDED WFRC 2015-2040 REGIONAL TRANSPORTATION PLAN. ABSTRACT The Moving Ahead for Progress in the 21
Air Quality Conformity Demonstration
 Air Quality Conformity Demonstration for the Fiscal Year (FY) 2017-2020 Transportation Improvement Program (TIP) DeSoto County, Mississippi Prepared For: Memphis Urban Area Metropolitan Planning Organization
FAMPO RESOLUTION ADOPTING REGIONAL CONGESTION MITIGATION AND AIR QUALITY IMPROVEMENT PROGRAM PERFORMANCE MEASURE TARGETS
 Timothy McLaughlin Chair Paul Agnello FAMPO Administrator FAMPO RESOLUTION 19-02 ADOPTING REGIONAL CONGESTION MITIGATION AND AIR QUALITY IMPROVEMENT PROGRAM PERFORMANCE MEASURE TARGETS WHEREAS, the National