Winter U.S. Natural Gas Production and Supply Outlook
|
|
|
- Owen Rose
- 5 years ago
- Views:
Transcription
1 Winter U.S. Natural Gas Production and Supply Outlook Prepared for Natural Gas Supply Association by: ICF International Fairfax, Virginia September, 2012 Introduction This report presents ICF s current view of upstream industry activity, production, storage, and imports for the upcoming winter heating season. Significant developments in North American gas supply since our last report in the fall of 2011 are: Continued increase in U.S. gas production to new record levels; large increase in natural gas liquids production Low wellhead prices and relatively high crude prices; large decline in natural gas liquids prices since early 2012 Decline in reported gas-directed rigs and reduction in gas well completions Increase in reported oil-directed drilling rigs, many of which are targeting wet gas Sharp activity reductions in dry gas portions of shale plays Increased production from Marcellus despite fewer rigs, reflecting large overhang of unconnected wells Large amount of drilling activity in wet gas and tight oil; rapidly increasing oil and associated gas production; growth in Lower-48 onshore oil production Dominance of Bakken and Eagle Ford plays in tight oil activity Increased role of sandstone plays in unconventional production, including the Granite Wash and Permian Basin plays Emerging tight oil and wet gas plays include the Utica, Mississippi Lime, and Tuscaloosa Marine Shale 1
2 Continuing trend toward much longer horizontal laterals with more frac stages; higher well recoveries; improved economics Large scale build-out of midstream infrastructure to handle liquids production Hurricane Isaac resulted in the shutting in of a cumulative 28 Bcf of offshore gas production; no significant impact on markets Summary of Supply Indicators and Gas Production Gas-directed rig activity is down 30 percent and oil-directed activity is up 40 percent Gas well completions are down 33 percent Onshore rig costs are flattening after a period of rapid increase Lower-48 dry gas production in 2012 will be approximately 64.7 Bcf/d, or about 2.1 percent higher than in This is a much lower rate of growth than last year. Shale gas production as defined here (excluding tight oil) increased to 22.4 Bcf/d at year-end 2011, compared with 16.9 Bcf/d at year-end 2010 Working gas in storage at the end of August was 3.40 Tcf vs 3.02 Tcf last year. The forecast fill level for November 1 st is 3.91 Tcf, slightly above last year, and representing 94 percent of capacity. Pipeline imports from Canada will be higher than last year, largely because of the very warm winter last year. LNG imports will be unchanged. Data Sources and Approach The production analysis presented here is based upon analysis of data from commercial data, state agencies, and the Energy Information Administration (EIA). It incorporates a procedure to estimate recent production where reported production is not yet complete due to a reporting lag. Historic gas production at the play level is based upon ICF analysis of state agency and commercial well level production data, as well as company reports. The gas production forecast 2
3 presented here is consistent with the ICF Natural Gas Market Compass forecast, a detailed 25 year forecast and gas market analysis of North America that is developed quarterly. 1 Forecasts of gas storage fill, pipeline imports, and LNG imports are from Compass. For consistency between historic data and forecasts, some of the historic data shown differ slightly from EIA data. Emergence of Lower-48 Shale Plays Exhibit 1 illustrates the emergence of new U.S. shale plays through time. A decade ago, the only plays with drilling activity were the Fort Worth Barnett Shale, the Antrim Shale (Michigan Basin), and the New Albany Shale (Illinois Basin), in addition to minor vertical drilling in the Marcellus. Today, very active horizontal shale gas and tight oil plays are located in many parts of the country, and potential plays are present in most major producing basins. 1 Data area from the July, 2012 ICF Natural Gas Market Compass. 3

4 Exhibit 1 Original and Current Shale Gas and Tight Oil Plays 4

5 Drilling Activity U.S. total oil and gas rig activity (Baker-Hughes) in August 2012 averaged 1,871 rigs, which was 4 percent lower than in August of Sharp declines in gasdirected rig activity have been offset by increasing oil-directed activity, such that total rig activity has been relatively constant. These relationships are shown in Exhibit 2. The steep decline in gas rigs that began in late 2011 continues, but at a diminishing rate. Oil rig activity increased linearly, but in August appeared to begin to level off. Exhibit 2 The issue of classification of drilling rigs as gas rigs or oil rigs is significant for supply analysis. Prior to shale gas activity, there was little uncertainty about whether a rig was drilling for oil or dry gas. However, many shale plays, especially those that have been the most active recently, have a transition from oil to wet gas and dry gas. Currently, many rigs that are classified as oil-directed are drilling in the wet gas (gas and liquids) window of shale plays. Their production is therefore gas with liquids, which is far different from crude oil and 5
6 associated gas production. Because of this, the gas and oil-directed rig statistics can be of limited use in some cases in forecasting near-term oil and gas production trends. Largely dry gas plays such as the Haynesville, Barnett, Fayetteville, Arkoma Woodford and parts of the Marcellus have seen large declines in activity. In some cases, as with the Barnett, activity stabilized in In other cases, dry gas-directed activity continues to decline. Increases in oil-targeted drilling activity are widely distributed. Activity can be broadly divided into tight oil and wet gas. Areas of tight oil emphasis include the Bakken/Three Forks and Eagle Ford, the Permian Basin (Avalon, Bone Springs, Wolfberry, and Cline), and the Denver Niobrara. Numerous tight oil plays are taking off in western Canada as well, including the Cardium and Viking. Tight oil production in the Lower-48 is approximately 1.1 million barrels per day, mostly from the Bakken and Eagle Ford, and tight oil production in Canada is 200,000 barrels per day. 2 Drilling in wet gas plays is concentrated in the Granite Wash, Eagle Ford, Marcellus, and Cana Woodford. The wet gas plays are characterized by high volume gas production with a heavy natural gas liquids component. The increase in oil and wet gas directed rigs has resulted in surging NGL production, creating a glut in some markets and driving down NGL prices. This, combined with low natural gas prices is having an impact on the profitability of some shale gas development. A key factor in the low NGL prices is the transportation bottleneck at Conway, Kansas. The planned expansion of NGL transportation out of Conway by 2014 will improve the situation. 3 Continued development of NGL export markets will also be important. Over 800,000 b/d of propane and butane export terminal expansions have been announced. 2 National Energy Board, Tight Oil Developments in the Western Canada Sedimentary Basin, Dec.,
7 Exhibit 3 presents 2012 trends in total drilling activity by region. There was a national decline in rigs of four percent relative to August Most of the decline was in Louisiana, Appalachia, and other. Texas, the Rockies, and North Dakota saw continued gains. Exhibit 3 U.S. and Canadian Drilling Trends August Data - Total Rigs (Oil and Gas) Source: Baker Hughes Total Rigs Total Rigs Total Rigs Aug Aug Change (%) Regional U.S. Rig Trends Rockies % North Dakota % Midcontinent % Texas % Louisiana % Gulf of Mexico % Appalachia % Other % Lower-48 1,951 1,871-4% 3 7
8 Exhibit 4 compares rig activity in 2011 and Gas rig counts for the first eight months of 2012 averaged 629. This can be compared to an average of 896 gas rigs during the same period last year, a decline of 30 percent. On a calendar year basis, ICF is forecasting an average of 567 gas rigs this year, a decline of 37 percent. For oil-directed rigs, continued gains are expected, with a forecast 40 percent increase for Total rig activity is forecast to increase by 3.5%. Exhibit 4 Historical and Forecast Gas Rigs change January through August gas rigs (actual) % Annual average gas rigs * -36.6% Annual average oil rigs 978 1,372 * 40.3% Annual average total rigs 1,873 1,939 * 3.5% * 2012 forecast 8


9 Drilling Cost Trends Exhibit 5 shows the average day rate for onshore drilling rigs in the U.S. This is a key component of U.S. drilling costs. The average day rate doubled between 2003 and There was a sharp decline through Since then, onshore average day rates have continued to climb. However, rig rates in the second quarter of this year declined, reversing a two year trend. This reflects softness in demand for the specialized rigs used for horizontal shale gas. Exhibit 5 9


10 Exhibit 6 shows approximate rig rates for offshore deepwater semisubmersibles. These day rates more than quadrupled after 2003, peaking in Over the past two years, rates have climbed again to almost that level, reflecting the effects of worldwide strong demand for deepwater rigs. The primary reason deepwater rigs are in high demand around the world is the success achieved in emerging deepwater oil and gas provinces in South America and Africa. Gulf of Mexico deepwater activity has also rebounded. Exhibit 6 10

11 Gas Well Completions Exhibit 7 shows monthly U.S. gas well completion statistics from the EIA Monthly Energy Review. Completion activity in 2012 is much lower, and continues the trend observed in the last quarter of The number of monthly gas completions is impacted by many factors including the gas-directed rig count, geographic and play distribution, average well depths, and well complexity. Note that the recent declines correspond with the gas-directed rig trend. Exhibit 7 11
12 Exhibit 8 presents Lower-48 gas well completion statistics starting with the first quarter of The table presents EIA Monthly Energy Review data, API Quarterly Completion Report data, and ICF estimates. ICF is forecasting the completion of about 9,000 Lower-48 gas wells in This represents a decline of 33 percent from the estimated 13,300 wells completed in The actual count for 2011 was lower than forecast last year (15,300). This was due to lower than anticipated gas rig activity and a trend of fewer gas wells completed per active gas rig. Because of the drilling and completion of much longer laterals, wells are more complex, although much more productive. Exhibit 8 Comparison of Quarterly Lower 48 Completion Counts Estimated Gas Well Completions Sources: EIA Monthly Energy Review and API Completion Report. EIA API Monthly Energy Quarterly Comp. Review Report ICF With Estimated Estimated Forecast 2009 Q1 6,626 5,851 5, Q2 4,135 3,586 3, Q3 4,074 3,666 3, Q4 4,280 3,475 3, Q1 3,831 3,536 3, Q2 3,895 3,546 3, Q3 4,483 3,986 3, Q4 4,487 4,091 4, Q1 3,501 3,379 3, Q2 3,515 3,261 3, Q3 3,371 3,372 3, Q4 2,833 3,322 3, Q1 2,119 2,618 2, Q2 1,340 2,472 2, Q , Q ,850 Annual Totals Annual % chg ,115 16,578 16, % ,696 15,159 15, % ,220 13,334 13, % , % 12
13 Natural Gas Production Gas production from onshore unconventional plays continues to drive Lower-48 gas production higher. Despite the slowdown in gas rig activity and gas well completions, gas production continues to increase because of concentration on play sweet spots, higher production rates per well, the lag between drilling and production of shale wells in some areas, and from increased production of associated gas from tight oil and liquids plays. Exhibits 9a and 9b illustrate gas production trends from a selected onshore shale and tight plays. Included in Exhibit 9a are the Barnett Shale in the Fort Worth Basin, the Eagle Ford Shale in south Texas, the Bossier Tight Sandstone in East Texas, the Fayetteville Shale in Arkansas, the Woodford Shale in Eastern Oklahoma, the Jonah and Pinedale tight gas fields in Southwestern Wyoming, the Piceance Basin tight gas in Colorado, the Haynesville Shale of Northern Louisiana and East Texas, the Marcellus Shale in Appalachia and the Powder River Basin coalbed methane. These plays have experienced an increase in gas production of almost 30 Bcf per day since At year-end 2011, production from these plays accounted for 46 percent of Lower-48 gas production, as shown in Exhibit 9b. 13

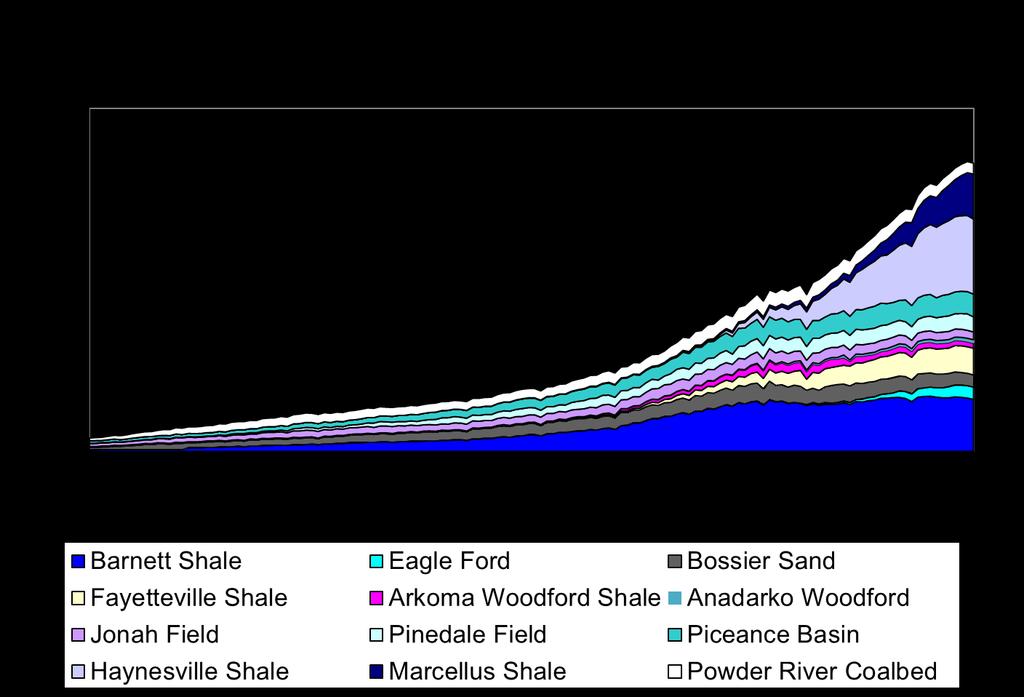
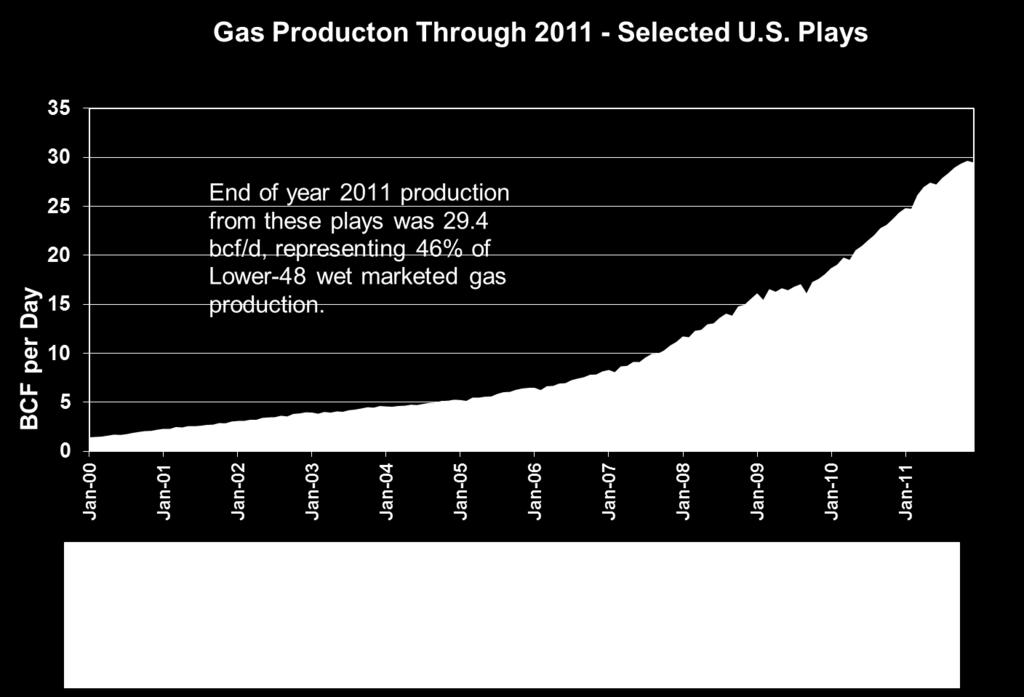
14 Exhibit 9a Exhibit 9b 14


15 Exhibit 9c shows shale play production. (Note that Bakken associated gas of about 500 MMcf/d in December, 2011 is excluded here). Through 2008, the Fort Worth Barnett Shale was the dominant play. Since 2009, most of the growth has been in other plays, with the Marcellus, Haynesville, and Fayetteville contributing the most. At year-end 2011, the Marcellus was producing almost 5 Bcf/d and growing rapidly, and the Haynesville was producing 7.7 Bcf/d. Lower- 48 shale gas production was 22.4 Bcf/d at year-end 2011, representing 35 percent of Lower-48 wet gas production. ICF has evaluated production and well data from the Pennsylvania portion of the Marcellus. The analysis indicates that there remain a very large number of drilled but nonproducing wells. Continuing hookup of these wells helps explain why production continues to increase despite the large decline in rigs. Eventually, most of this inventory will be connected. Additional analysis is needed to fully evaluate this issue and its implications for future production. Exhibit 9c 15
.")
16 Exhibit 10 presents Lower-48 tight oil production and associated-dissolved gas production from tight oil. The chart shows that tight oil (crude and condensate) production is approximately 1.1 million barrels per day and associated gas production is 1.5 Bcf/d. (Note that this excludes the gas well production in transition plays such as the Eagle Ford). Tight oil and associated gas production from plays other than the Bakken and Eagle Ford is estimated in this analysis (Permian, Niobrara, and Mississippian Lime). The magnitude of growth in tight oil production is also reflected in total onshore production, which has increased substantially. Exhibit 10 Lower-48 Tight Oil and Gas Production 16
17 Exhibits 11 through 13 present the ICF Lower-48 natural gas production analysis and forecast. Lower-48 gas production in the third quarter of 2012 is expected in this analysis to average 64.8 Bcf per day, up from 63.9 Bcf/d in the third quarter of last year. Historic and forecast production levels are presented graphically in Exhibit 12. The lower portion of Exhibit 11 presents an annual summary and shows the percentage change in Lower-48 production. ICF estimates that 2012 production will average 64.7 Bcf/d (23.7 Tcf), a 2.1 percent increase over This contrasts with an 8.6 percent increase last year. The forecast for 2013 is for an average of 65.8 Bcf/d, a 1.6 percent increase over this year. 17
18 Exhibit 11 ICF Analysis of Lower-48 Quarterly Wellhead Gas Production Dry marketed total gas - Bcf per day Quarterly averages Quarterly Bcf/d Quarterly Bcf per day * Change Pct. Chg Q % 2Q % 3Q % 4Q % Q % 2Q % 3Q % 4Q % Q % 2Q % 3Q % 4Q % Q % 2Q % 3Q % 4Q % Q % 2Q % 3Q % 4Q % Annual averages Annual Annual Bcf/d Annual Production Change Bcf per day Change Pct. Chg. Bcf/Yr. Bcf % 20, % 21,298 1, % 23,134 1, % 23, % 24, * Production excludes approximately 1.0 Bcfd of marketed Alaska gas production and 200 MMcfd of supplemental gas production consisting of coal gas and propane-air. 18

19 Exhibit 12 19
20 Exhibit 13 presents the details of winter monthly natural gas production since November 2010 and the ICF forecast for the upcoming winter. The forecast is for Lower-48 production to average 64.8 Bcf/d this winter through March of This is about 0.1 Bcf/d lower than last year. Exhibit 13 Historical and Forecast Winter Monthly Production November - March Source: ICF Database and Models Bcf Historical Historical ICF Forecast for this winter Bcf Bcf Bcf Nov ,804 Nov ,951 Nov ,950 Dec ,866 Dec ,014 Dec ,020 Jan ,910 Jan ,005 Jan ,022 Feb ,715 Feb ,877 Feb ,826 Mar ,920 Mar ,959 Mar ,025 total 9,217 9,806 9,843 Bcf per day Historical Historical ICF Forecast for this winter Bcfd Bcfd Bcfd Nov Nov Nov Dec Dec Dec Jan Jan Jan Feb Feb Feb Mar Mar Mar average
21 Comparison with EIA Short-Term Forecast EIA publishes a short-term forecast each month with quarterly estimates of U.S. natural gas production and imports. Exhibit 14 presents the EIA and ICF quarterly production averages for the Lower-48. EIA is forecasting a 2012 Lower-48 gas production increase of 3.9 percent. This compares to an increase of 2.1 percent in the ICF analysis. The EIA forecast for 2013 is for a 0.7 percent increase, compared with our 1.6 percent increase. 21
22 10-1Q 10-2Q 10-3Q 10-4Q 11-1Q 11-2Q 11-3Q 11-4Q 12-1Q 12-2Q 12-3Q 12-4Q 13-1Q 13-2Q 13-3Q 13-4Q Bcf per Day Exhibit 14 Comparison with EIA Short Term Outlook Bcf per day; Lower-48 and U.S. Total Dry Gas Production ICF Current Study vs. EIA Short Term Outlook Lower 48 ICF EIA EIA Difference (Lower 48) (U.S. Total) (Lower 48) ICF vs.eia Q Q Q Q Q Q Q Q Q Q Q Q Q Q Q Q % chg. % chg. Difference % % % % % % % % Lower-48 Production Comparison with EIA Short Term Outlook EIA ICF Current Study 52.0 Year and Quarter 22
23 Storage Injection At the end of August 2012, U.S. inventories of working natural gas in storage stood at 3.40 Tcf, or 320 Bcf above the five-year average of 3.08 Tcf and 380 Bcf above the 3.02 Tcf at the end of August, As shown in Exhibit 15a, storage volumes were far above the five year average during most of The excess over the five year average has declined consistently over the past six months. The ICF forecast is for the storage level on November 1 to be approximately 3.91 Tcf. This is about 100 Bcf above last year. Exhibit 15b presents the monthly working gas storage data. EIA recently published a new estimate of storage capacity. 4 EIA estimates that demonstrated peak working gas capacity rose from 4.10 Tcf in April, 2011 to 4.24 Tcf in April, ICF currently estimates that U.S. working gas storage capacity is 4.17 Tcf. This estimate is based upon project level analysis, including estimates for expected startups this year. The method used involves evaluation of historical storage fill in older facilities combined with design capacity for facilities without a history of storage. This estimate is generally equivalent in definition to the EIA demonstrated capacity estimate above. The current ICF forecast of peak storage this fall of 3.91Tcf represents 94 percent of our estimate of storage capacity

24 Exhibit 15a Exhibit 15b Underground Natural Gas Storage - BCF Working Gas - End of Month 2012 With ICF Forecast 2013 Forecast 5 year avg. Jan 2,304 2,308 2,916 2,603 2,238 Feb 1,683 1,724 2,455 2,171 1,656 Mar 1,652 1,581 2,477 2,063 1,552 Apr 2,011 1,789 2,613 2,220 1,772 May 2,420 2,188 2,890 2,585 2,199 Jun 2,740 2,530 3,118 2,557 Jul 2,966 2,774 3,231 2,848 Aug 3,153 3,020 3,402 3,083 Sep 3,508 3,416 3,723 3,409 Oct 3,851 3,804 3,906 3,685 Nov 3,769 3,843 3,781 3,647 Dec 3,111 3,462 3,281 3,085 24
25 Pipeline Imports and Exports Exhibit 16 shows the winter pipeline imports from Canada and exports to Mexico, starting with the winter of Import data are net to the U.S. The historical Canadian import data are taken from the ICF Natural Gas Market Compass. Net imports from Canada last winter ( ) averaged 4.50 Bcf/d, which was about 31 percent lower than the previous winter s average. Last winter s pipeline import volumes were low in part because it was one of the warmest winters on record. This winter we forecast that imports from Canada will average 5.53 Bcf/d, an increase of 23 percent or 1.03 Bcf/d relative to last winter. The volume of Canadian pipeline imports depends on WCSB gas production and demand in both Canada and the U.S. Western Canada production has been declining. Also, gas demand in Alberta has increased, primarily due to oil sands production and processing needs. Exports to Mexico in recent years have been constant at about 1.2 Bcf/d. In the future, Mexico may import larger volumes of natural gas from the U.S. While Mexico has excellent shale gas potential in the Burgos Basin adjacent to Texas, development drilling and significant new production from the basin has not yet occurred. 25
26 Exhibit 16 Pipeline Imports from Canada and Exports to Mexico November though March Sources: ICF Compass for forecast; history from Natural Gas Monthly Net Imports from Canada Bcf per day positive = net imports Historical Historical ICF Forecast for this winter Bcf/d Bcf/d Bcf/d Nov Nov Nov Dec Dec Dec Jan Jan Jan Feb Feb Feb Mar Mar Mar average Net Exports to Mexico Bcf per day negative = net exports Historical Historical ICF Forecast for this winter Bcf/d Bcf/d Bcf/d Nov Nov Nov Dec Dec Dec Jan Jan Jan Feb Feb Feb Mar Mar Mar average Winter LNG Imports In past years, the U.S. typically imported 1.0 to 1.5 Bcf/d of LNG during the winter months. We have historically imported more LNG in the summer months when there is less demand in Europe and Asia. Prior to the boom in shale gas, most analysts believed that LNG imports to the U.S. would ramp up greatly in coming years to fill a supply gap. While LNG is still expected to be a major source of incremental world supply over the long term, it is not expected to contribute greatly in the U.S. for many years due to surging U.S. gas production. There have also been applications to export LNG from Western Canada, the Gulf Coast, and the Atlantic Coast. 5 DOE has approved 26.6 Bcf/d of export
27 application volumes. However, the government has yet to decide the level of LNG exports that will ultimately be allowed. Exhibit 17 shows the recent history of worldwide LNG shipments and world gas production. LNG imports to North America (primarily to the U.S.) declined from 761 Bcf in 2010 to 671 Bcf in U.S. imports (not shown) declined from 432 Bcf in 2010 to 354 Bcf in World production of LNG increased to 11,681 Bcf and world gas production increased from 112 Tcf to 116 Tcf. LNG shipments to Europe, Asia, and South America increased. 27
28 Exhibit 17 World LNG Imports and Gas Production EIA data through 2005; BP Statistical Review for 2006 forward LNG Imports Gas Production LNG World North Post-2000 Gas Post-2000 America Europe Asia - Pacific Other Total Increase Production Increase Bcf Bcf Bcf Bcf Bcf Bcf Tcf Tcf ,150 3,544 4, ,157 3,776 5, ,386 3,671 5, ,390 3,978 5, ,423 4,347 6,453 1, ,668 4,495 6,827 1, ,028 4,774 7,454 2, ,883 5,225 7,994 3, ,949 5,502 7,975 3, ,437 5, ,571 3, ,099 6, ,509 5, ,201 7, ,681 6, Percentage of world LNG imports % 23.3% 71.8% 0.0% 100.0% % 22.3% 72.7% 0.0% 100.0% % 26.1% 69.1% 0.0% 100.0% % 23.5% 67.3% 0.0% 100.0% % 22.1% 67.4% 0.0% 100.0% % 24.4% 65.8% 0.0% 100.0% % 27.2% 64.0% 0.0% 100.0% % 23.6% 65.4% 0.0% 100.0% % 24.4% 69.0% 0.0% 100.0% % 28.4% 62.7% 1.2% 100.0% % 29.5% 59.7% 3.5% 100.0% % 27.4% 62.6% 4.2% 100.0% 28
29 Exhibit 18 shows monthly LNG gross imports for the past two winters and the ICF forecast for this winter. The winter total volume imported for was 200 Bcf, or 1.32 Bcf/d. Last winter, the volume was 112 Bcf, or 0.74 Bcf/d. For the upcoming winter, ICF is forecasting an identical volume of 112 Bcf. Exhibit 18 Historical and Forecast Winter LNG Imports November - March; Gross Imports - Not Net of Alaska Exports Source of historical data: EIA Natural Gas Monthly and ICF Source of forecast: ICF Compass Bcf Historical Historical ICF Forecast for this winter Bcf Bcf Bcf Nov Nov Nov Dec Dec Dec Jan Jan Jan Feb Feb Feb Mar Mar Mar total Bcf per day Historical Historical ICF Forecast for this winter Bcf/d Bcf/d Bcf/d Nov Nov Nov Dec Dec Dec Jan Jan Jan Feb Feb Feb Mar Mar Mar average
30 Percent Change Summary Exhibit 19 summarizes the results of the supply analysis and forecast. Supply Outlook for Winter percent source change change U.S. production vs previous year (trend) Even Annual gas well completions (2011 to 2012) 2 13,334 8,990-4, % Annual gas rig count (2011 to 2012) % Winter LNG imports (Bcf/d - Nov. - March) % Winter average gas production (Bcf/d - Lower 48) % Working gas in storage (Tcf - Nov.1) % Net pipeline imports from Canada (Bcf/d - Nov. - Mar.) % 30% 20% 10% 22.9% Gas Well Completions Gas Rig Count 0% -10% 0-0.2% 2.9% Winter LNG Imports Winter Gas Production -20% Working Gas in Storage -30% Net Pipeline Imports -32.6% -40% -36.6% Sources: 1. ICF - Current Study - State and federal data with ICF adjustments and forecast. 2. API Quarterly Completion Report with ICF estimates. 3. Baker Hughes gas rigs with ICF forecast through December. 4. Historical data from EIA Natural Gas Monthly; Forecast from ICF Compass. 5. Historical and forecast from current study. Derived from state and federal data with adjustments and forecast 6. Historical data from EIA; Forecast from ICF Compass 7. Historical data from StatsCanada and bulletin boards; Forecast from ICF Compass 30
Winter U.S. Natural Gas Production and Supply Outlook
 Winter 2010-11 U.S. Natural Gas Production and Supply Outlook Prepared for Natural Gas Supply Association by: ICF International Fairfax, Virginia September, 2010 Introduction This report presents ICF s
Trends, Issues and Market Changes for Crude Oil and Natural Gas
 Trends, Issues and Market Changes for Crude Oil and Natural Gas East Iberville Community Advisory Panel Meeting Syngenta September 26, 2012 Center for Energy Studies David E. Dismukes, Ph.D. Center for
Natural Gas Abundance: The Development of Shale Resource in North America
 Natural Gas Abundance: The Development of Shale Resource in North America EBA Brown Bag Luncheon Bracewell & Giuliani Washington, D.C. February 6, 2013 Bruce B. Henning Vice President, Energy Regulatory
The Really Big Game Changer: Crude Oil Production from Shale Resources and the Tuscaloosa Marine Shale
 The Really Big Game Changer: Crude Oil Production from Shale Resources and the Tuscaloosa Marine Shale Baton Rouge Chamber of Commerce Regional Stakeholders Breakfast June 27, 2012 Center for Energy Studies
Natural Gas Issues and Emerging Trends for the Upcoming Winter and Beyond
 Natural Gas Issues and Emerging Trends for the Upcoming Winter and Beyond 2013 NASEO WINTER ENERGY OUTLOOK CONFERENCE November 1, 2013 Kevin Petak Vice President, ICF International Kevin.Petak@icfi.com
AIChE: Natural Gas Utilization Workshop Overcoming Hurdles of Technology Implementation
 AIChE: Natural Gas Utilization Workshop Overcoming Hurdles of Technology Implementation Natural Gas in the United States: An Overview of Resources and Factors Affecting the Market November 2, 216 Justin
North America Midstream Infrastructure through 2035: Capitalizing on Our Energy Abundance
 North America Midstream Infrastructure through 2035: Capitalizing on Our Energy Abundance Prepared by ICF International for The INGAA Foundation, Inc. Support provided by America s Natural Gas Alliance
Outlook for Natural Gas Supply and Demand for Winter
 Outlook for Natural Gas Supply and Demand for 2013-2014 Winter Energy Ventures Analysis, Inc. (EVA) Executive Summary The outlook for both natural gas supply and demand for the forthcoming winter is very
U.S. Historical and Projected Shale Gas Production
 U.S. Historical and Projected Shale Gas Production Phyllis Martin Phyllis Martin, Senior Energy Analyst Office of Petroleum, Gas and Biofuels Analysis U.S. Energy Information Administration phyllis.martin@eia.doe.gov
Natural Gas Outlook and Drivers
 Natural Gas Outlook and Drivers November 2012 33% BENTEK Energy 5% 40% Who We Are Based in Evergreen, CO 120 People 400+ Customers Subsidiary of McGraw-Hill/Platts 22% What We Do Collect, Analyze and Distribute
North American Midstream Infrastructure Through 2035 A Secure Energy Future. Press Briefing June 28, 2011
 North American Midstream Infrastructure Through 2035 A Secure Energy Future Press Briefing June 28, 2011 Disclaimer This presentation presents views of ICF International and the INGAA Foundation. The presentation
U.S. Crude Oil and Natural Gas Proved Reserves, Year-end 2015
 U.S. Crude Oil and Natural Gas Proved Reserves, Year-end 2015 December 2016 Independent Statistics & Analysis www.eia.gov U.S. Department of Energy Washington, DC 20585 This report was prepared by the
U.S. Crude Oil and Natural Gas Proved Reserves, Year-end 2016
 U.S. Crude Oil and Natural Gas Proved Reserves, Year-end 2016 February 2018 Independent Statistics & Analysis www.eia.gov U.S. Department of Energy Washington, DC 20585 This report was prepared by the
By Bob Hugman and Harry Vidas
 WHITE PAPER Oklahoma: A Major Player for Future Hydrocarbon Production By Bob Hugman and Harry Vidas Bottom Line 1. Despite sharp drilling activity declines over the past year in most areas of the country,
U.S. Crude Oil, Natural Gas, and NG Liquids Proved Reserves
 1 of 5 3/14/2013 11:37 PM U.S. Crude Oil, Natural Gas, and NG Liquids Proved Reserves With Data for Release Date: August 1, 2012 Next Release Date: March 2013 Previous Issues: Year: Summary Proved reserves
ENERGY OUTLOOK 2017 FALL/WINTER
 ENERGY OUTLOOK 2017 FALL/WINTER With more than 105 years in the energy industry, BOK Financial is committed to helping you succeed. In this issue of the Energy Outlook, you ll learn more about the current
2005 North American Natural Gas Outlook Client Presentation
 2005 North American Natural Gas Outlook Client Presentation January 17, 2005 Ron Denhardt Vice President, Natural Gas Services Strategic Energy & Economic Research Inc. 781 756 0550 (Tel) Copyright 2004
Gas and Crude Oil Production Outlook
 Gas and Crude Oil Production Outlook COQA/CCQTA Joint meeting October 3-31, 214 San Francisco, California By John Powell Office of Petroleum, Natural Gas, and Biofuels Analysis U.S. Energy Information
Oil and natural gas: market outlook and drivers
 Oil and natural gas: market outlook and drivers for American Foundry Society May 18, 216 Washington, DC by Howard Gruenspecht, Deputy Administrator U.S. Energy Information Administration Independent Statistics
Global energy markets
 For Woodrow Wilson Center Global Energy Forum September 21, 215 Washington, DC by Adam Sieminski, Administrator U.S. Energy Information Administration U.S. Energy Information Administration Independent
Oil and gas outlook. For New York Energy Forum October 15, 2015 New York, NY. By Adam Sieminski, Administrator. U.S. Energy Information Administration
 Oil and gas outlook For New York Energy Forum New York, NY By Adam Sieminski, Administrator U.S. Energy Information Administration U.S. Energy Information Administration Independent Statistics & Analysis
World and U.S. Oil and Gas Production and Price Outlook: To Infinity (or at least 2050) and Beyond
 and Beyond") World and U.S. Oil and Gas Production and Price Outlook: To Infinity (or at least 25) and Beyond Energy and Environment Symposium April 18, 218 Rifle, Colorado by Troy Cook, Senior Global Upstream Analyst,
World and U.S. Oil and Gas Production and Price Outlook: To Infinity (or at least 25) and Beyond Energy and Environment Symposium April 18, 218 Rifle, Colorado by Troy Cook, Senior Global Upstream Analyst,
Shale Gas - Transforming Natural Gas Flows and Opportunities. Doug Bloom President, Spectra Energy Transmission West October 18, 2011
 Fort Nelson Gas Plant, British Columbia Shale Gas - Transforming Natural Gas Flows and Opportunities Doug Bloom President, Spectra Energy Transmission West October 18, 2011 Natural Gas Golden Age Natural
Ponzi Scheme Keeps US Market Well Supplied
 www.poten.com June 30, 2011 Ponzi Scheme Keeps US Market Well Supplied Conjuring up images of the dot-com bubble of the late-1990s, the industry leveled charges of unprofessional journalism against a story
A Tale of Two Fuels - Crude Oil and Natural Gas Supply. Private Capital Conference February 24, 2011 Houston, TX
 A Tale of Two Fuels - Crude Oil and Natural Gas Supply Private Capital Conference February 24, 2011 Houston, TX Henry Hub Natural Gas vs. WTI Crude $/MMBTU $14 $12 $10 $8 $6 $4 $2 Henry Hub WTI 160 140
We ve Seen This Movie Before
 The Dynamic Energy Landscape: Natural Gas in the U.S. We ve Seen This Movie Before October 26, 2015 Production of Natural Gas, NGLs & Crude Oil Bcf/d 75 70 65 60 55 50 U.S. Lower 48 Dry Gas Production
Shale Oil: A Turning Point for the Global Oil Market
 06 May 2013 Shale Oil: A Turning Point for the Global Oil Market Edith Southammakosane, Director - Research research@etfsecurities.com Key points Global oil supply is rising rapidly as shale oil production
Status and outlook for shale gas and tight oil development in the U.S.
 Status and outlook for shale gas and tight oil development in the U.S. for Energy Symposium, University of Oklahoma, Price College Energy Institute Norman, OK by Adam Sieminski, Administrator U.S. Energy
POTENTIAL GAS COMMITTEE REPORTS INCREASE IN MAGNITUDE OF U.S. NATURAL GAS RESOURCE BASE
 For Release April 8, 2015, 1100 EDT Contact: Dr. John B. Curtis, Potential Gas Agency, Colorado School of Mines, Golden, CO 80401-1887. Telephone 303-273-3886; fax 303-273-3574; ldepagni@mines.edu. POTENTIAL
U.S. Crude Oil and Natural Gas Proved Reserves, 2012
 U.S. Crude Oil and Natural Gas Proved, 2012 April 2014 Independent Statistics & Analysis www.eia.gov U.S. Department of Energy Washington, DC 20585 This report was prepared by the U.S. Energy Information
CERI Commodity Report Natural Gas
 CERI Commodity Report Natural Gas September 15 The Marcellus Shale Paul Kralovic Advances in horizontal drilling, 3-D seismic technology and hydraulic fracturing (fracking) are opening up new shale gas
Drilling Deeper: A Reality Check on U.S. Government Forecasts for a Lasting Tight Oil & Shale Gas Boom. Web Briefing December 9, 2014
 Drilling Deeper: A Reality Check on U.S. Government Forecasts for a Lasting Tight Oil & Shale Gas Boom Web Briefing December 9, 214 J. David Hughes Post Carbon Institute Global Sustainability Research
Natural Gas, Liquids and Crude Oil Market Outlook North America 2012 and Beyond
 Natural Gas, Liquids and Crude Oil Market Outlook North America 2012 and Beyond August 14th, 2012 On behalf of: for: 1 BENTEK Energy Market Information Agenda: U.S. Supply, Demand and Storage Outlook Macro
CERI Commodity Report Natural Gas
 CERI Commodity Report Natural Gas November-December 15 The Energy Information Administration s New Storage Classifications Paul Kralovic November 19, 15 was an important date for the Energy Information
Natural Gas Market Update
 Natural Gas Market Update John Jicha - MGE Director - Energy Supply and Trading Madison Gas and Electric Company Agenda What a difference ten years can make Low prices Fundamental factors impacting the
ENERGY SLIDESHOW. Federal Reserve Bank of Dallas
 ENERGY SLIDESHOW Updated: July 5, 2018 ENERGY PRICES www.dallasfed.org/research/energy Brent & WTI & Crude Brent Oil Crude Oil Dollars per barrel 140 120 Brent (Jun 29 = $75.24) WTI (Jun 29 = $74.03) 95%
Major Challenges for Gas: What Can be Expected for Mexico?
 Major Challenges for Gas: What Can be Expected for Mexico? Gas Future Forum, Mexico, April 3, 2014 BEG/CEE UT, 1 Overall Observations Resources Reserves Deliverability Deliverability is key Sweet spot
U.S. natural gas and LNG exports
 U.S. natural gas and LNG exports For Hudson Institute Washington DC April 6, 216 By Victoria Zaretskaya Office of Petroleum, Natural Gas, and Biofuels Analysis U.S. Energy Information Administration Independent
ENERGY SLIDESHOW. Federal Reserve Bank of Dallas
 ENERGY SLIDESHOW Updated: February 14, 2018 ENERGY PRICES www.dallasfed.org/research/energy Brent & WTI & Crude Brent Oil Crude Oil Dollars per barrel 140 Brent (Feb 9 = $65.50) WTI (Feb 9 = $62.01) 120
U.S. Shale Gas in Context
 U.S. Shale Gas in Context Overview of U.S. Natural Gas production and trends For National Conference of State Legislatures Natural Gas Policy Institute September 9, 215 Pittsburgh, Pennsylvania By Grant
The Unconventional Reservoirs Revolution and the Rebirth of the U.S. Onshore Oil & Gas Industry
 The Unconventional Reservoirs Revolution and the Rebirth of the U.S. Onshore Oil & Gas Industry Feb. 19, 2013 Cautionary Statement The following presentation includes forward-looking statements. These
CenterPoint Energy Services. Current Market Fundamentals June 27, 2013
 CenterPoint Energy Services Current Market Fundamentals June 27, 2013 CenterPoint Energy is one of the largest combined electric and natural gas delivery companies in the U.S. Asset portfolio CNP Footprint
The Energy Consortium Recent Developments and the Outlook for Natural Gas in the Northeast. John R. Bitler October 20, 2010
 The Energy Consortium Recent Developments and the Outlook for Natural Gas in the Northeast John R. Bitler October 20, 2010 Northeast Overview Traditional Sources of Supply Gulf Coast Western Canada (WCSB)
OIL AND GAS OUTLOOK: HOW ARE THE ENERGY MARKET AFFECTING METALS? Nicole Leonard, Project Manager, Oil & Gas Consulting Services November 2015
 OIL AND GAS OUTLOOK: HOW ARE THE ENERGY MARKET AFFECTING METALS? Nicole Leonard, Project Manager, Oil & Gas Consulting Services November 2015 KEY TAKEAWAYS Macroeconomic outlook: Prices have collapsed
CERI Commodity Report Natural Gas
 March 15 CERI Commodity Report Natural Gas Analyzing Rig In-Activity Paul Kralovic Despite the West Texas Intermediate (WTI) oil price rebounding from a low of US$3.39 per barrel on March 17, 15 to US$55.
Energy Outlook. Kurt Barrow Vice President, Oil Markets, Midstream and Downstream Insights, IHS Markit
 Energy Outlook Kurt Barrow Vice President, Oil Markets, Midstream and Downstream Insights, IHS Markit kurt.barrow@ihsmarkit.com Building a Foundation for Profitable Growth in Uncertain Markets Agenda Short-term
Navigating through the energy landscape.
 Navigating through the energy landscape. Baton Rouge Rotary Club Luncheon, May 24, 2017. David E. Dismukes, Ph.D. Executive Director & Professor Center for Energy Studies Louisiana State University Professor
A Decade of Progress in Unconventional Gas
 A Decade of Progress in Unconventional Gas Vello A. Kuuskraa, Advanced Resources International, Arlington, VA Unconventional gas resources - - tight gas sands, coalbed methane and gas shales - - have become
IAF Advisors Energy Market Outlook Kyle Cooper, (713) , October 31, 2014
 , October 31, 2014") IAF Advisors Energy Market Outlook Kyle Cooper, (713) 722 7171, Kyle.Cooper@IAFAdvisors.com October 31, 2014 Price Action: The December contract rose 17.5 cents (4.7%) to $3.873 on a 33.3 cent range. Price
IAF Advisors Energy Market Outlook Kyle Cooper, (713) 722 7171, Kyle.Cooper@IAFAdvisors.com October 31, 2014 Price Action: The December contract rose 17.5 cents (4.7%) to $3.873 on a 33.3 cent range. Price
Major Changes in Natural Gas Transportation Capacity,
 Major Changes in Natural Gas Transportation, The following presentation was prepared to illustrate graphically the areas of major growth on the national natural gas pipeline transmission network between
Durability of Eagle Ford Investment: How does the Eagle Ford Compare in North America?
 Durability of Eagle Ford Investment: How does the Eagle Ford Compare in North America? March 27, 2013 Unconventional Development Activity North American Shale Plays Source: EIA 2 Converging Consumption
Connecting Supply Options GasMart May 21, 2008, Chicago
 Connecting Supply Options GasMart May 21, 2008, Chicago Dean Ferguson, VP Marketing, Business Development & Regulatory Affairs, U.S. Pipeline Central Forward-Looking Information 2 This presentation may
UNDERSTANDING NATURAL GAS MARKETS. Mohammad Naserifard MSc student of Oil & Gas Economics at PUT Fall 2015
 UNDERSTANDING NATURAL GAS MARKETS Mohammad Naserifard MSc student of Oil & Gas Economics at PUT Fall 2015 Table of Contents 3 Overview Natural Gas is an Important Source of Energy for the United States.
The New Superpower : Emerging Supplies of Gas Liquids from the United States
 The New Superpower : Emerging Supplies of Gas Liquids from the United States Lucian Pugliaresi President Energy Policy Research Foundation, Inc. Washington, DC Energy Policy Research Foundation, Inc. 1031
Greg Hathaway Energy Source Holdings, LLC
 Greg Hathaway Energy Source Holdings, LLC WEATHER THE PICTURE TO THE RIGHT SHOWS THE 2015-16 WINTER HAS BEEN MUCH ABOVE NORMAL. SINCE 2008 THE NATIONAL TEMPERATURE HAS BEEN BELOW NORMAL SIX TIMES 2013-14
NEXUS Gas Transmission
 NEXUS Gas Transmission Bringing New Supplies to Market Ohio Manufacturers Association - October 2012 Agenda Project Introduction Utica and Marcellus Gas Supply Michigan and Ontario Markets Conclusion &
IAF Advisors Energy Market Outlook Kyle Cooper, (713) , March 6, 2015
 , March 6, 2015") IAF Advisors Energy Market Outlook Kyle Cooper, (713) 722-7171, Kyle.Cooper@IAFAdvisors.com March 6, 2015 Price Action: The April contract rose 10.5 cents (3.8%) to $2.839 on a 22.9 cent range. Price Outlook:
IAF Advisors Energy Market Outlook Kyle Cooper, (713) 722-7171, Kyle.Cooper@IAFAdvisors.com March 6, 2015 Price Action: The April contract rose 10.5 cents (3.8%) to $2.839 on a 22.9 cent range. Price Outlook:
Delivering Supply Options LDC Forum June 1, 2008, Boston. Tim Stringer Manager, U.S. Northeast Markets
 Delivering Supply Options LDC Forum June 1, 2008, Boston Tim Stringer Manager, U.S. Northeast Markets Forward-Looking Information 2 This presentation may contain certain information that is forward looking
PHOTOS: SHUTTERSTOCK. Editor s note: The Arkansas Energy Report is Sponsored by MISO & Arkansas State Chamber of Commerce.
 PHOTOS: SHUTTERSTOCK Editor s note: The Arkansas Energy Report is Sponsored by MISO & Arkansas State Chamber of Commerce. Arkansas energy picture in recent months is one of low pump prices, a significant
Wyoming Pipeline Authority Public Meeting. Anne Swedberg, Manager, North American Power and Gas Content
 Wyoming Pipeline Authority Public Meeting Anne Swedberg, Manager, North American Power and Gas Content 2015 2014 Platts, McGraw Hill Financial. All rights reserved. Benposium 2015. Key Take-Aways US production
Oil & Gas Update. December 2014 Oil & Gas Update
 1 Oil & Gas Update 1 Trending 1 News Oil Companies Seen Cutting Spending 25% in 2015 Due to Falling Crude Prices Bakken E&P Slashes Budget for the Second Time in Two Months; 2015 Rig Count and Well Costs
EPIC MOVE IN THE ENERGY SPACE
 110 100 90 80 70 60 50 40 EPIC MOVE IN THE ENERGY SPACE HEDGEYE QUANTITATIVE SET-UP WTI Crude Oil ($/Spot) TREND Resistance ($57.64) TAIL Resistance ($71.38) As always, we rely on our topdown, datadriven
What s Going on With Energy? How Unconventional Oil & Gas Development is Impacting Renewables, Efficiency, Power Markets and All That Other Stuff
 What s Going on With Energy? How Unconventional Oil & Gas Development is Impacting Renewables, Efficiency, Power Markets and All That Other Stuff Atlanta Economics Club Monthly Meeting December 10, 2012
An INDEPENDENT energy consulting company since 1996 No affiliation with any marketer, broker, agent, utility, pipeline or producer.
 An INDEPENDENT energy consulting company since 1996 No affiliation with any marketer, broker, agent, utility, pipeline or producer. More than two decades of experience in the natural gas and electric industries
Oil. Gas. Market Notes. North American Natural Gas Market Outlook Year-End 2014: A View to Contents
 Oil Gas Market Notes Contents 1 North American Natural Gas Market Outlook Year-End 214: A View to 235 9 Natural Gas Market Charts 12 Oil Market Charts 16 Legislative and Regulatory Highlights 17 About
Energizing America: Facts for Addressing Energy Policy. Rayola Dougher API Senior Economic Advisor,
 Energizing America: Facts for Addressing Energy Policy Rayola Dougher API Senior Economic Advisor, dougherr@api.org 1970 1975 1980 1985 1990 1995 2000 2005 2010 2015 1970 1975 1980 1985 1990 1995 2000
SHALE DEVELOPMENT TRENDS AND IMPLICATIONS ON VALVE NEEDS JOHN D. SELDENRUST, VICE PRESIDENT-ENGINEERING & CONSTRUCTION
 SHALE DEVELOPMENT TRENDS AND IMPLICATIONS ON VALVE NEEDS JOHN D. SELDENRUST, VICE PRESIDENT-ENGINEERING & CONSTRUCTION WHAT IS UNCONVENTIONAL GAS? Gas that is more difficult or less economical to extract
North American Natural Gas Market Outlook
 North American Natural Gas Market Outlook Energy Trends & Impacts On Gas Infrastructure Prepared For: Gas/Electric Partnership, Conference XVIII Darryl Rogers February 10, 2010 Agenda Introduction to Purvin
GLOBAL OIL MARKET TRENDS
 GLOBAL OIL MARKET TRENDS Brent timeline and latest forward curve: Prompt prices recovering, back-end more stable ICE Brent crude, historical front month contract price and latest forward curve Our view
U.S. Natural Gas and the Potential for LNG Export Growth
 U.S. Natural Gas and the Potential for LNG Export Growth Presentation to: 2018 Wyoming Oil & Gas Fair By: John Harpole September 12, 2018 It is not a scarce resource anymore 2 US RIG COUNTS: Aug 2018
Global Supply and Shale in 2019 and Beyond
 Global Supply and Shale in 219 and Beyond Stephen G. Beck Senior Director, Upstream Gulf Downstream Association December 1, 218 www.stratasadvisors.com UPSTREAM MIDSTREAM DOWNSTREAM FUEL & TRANSPORT Crude
North American Natural Gas: A Crisis Ahead Or Is Chicken Little Running Around Again?
 North American Natural Gas: A Crisis Ahead Or Is Chicken Little Running Around Again? Ron Denhardt Vice President, Natural Gas Services February 2003 Strategic Energy & Economic Research Inc. 781 756 0550
Forward Looking Statements This presentation contains certain statements that are, or may be deemed to be, forward looking statements within the meani
 Outlook for U.S. LNG Exports METI, Japan LNG Producer Consumer Conference Charif Souki CEO, Cheniere Energy Inc. Forward Looking Statements This presentation contains certain statements that are, or may
Energy Markets. U.S. Energy Information Administration. for. October 29, 2015 Golden, Colorado. by Adam Sieminski, Administrator
 Energy Markets for The Payne Institute for Earth Resources at the Colorado School of Mines Golden, Colorado by Adam Sieminski, Administrator U.S. Energy Information Administration U.S. Energy Information
The Shifting Sands of Natural Gas Abundance
 August 17, 2016 The Shifting Sands of Natural Gas Abundance Richard Meyer Manager, Energy Analysis & Standards Here s how global energy changed between 2014 and 2015. Winners were oil, natural gas, renewables.
CERI Commodity Report Natural Gas
 September 1 CERI Commodity Report Natural Gas Natural Gas Prices Paul Kralovic The Commodity Report Natural Gas article, Turm-oil in the Natural Gas Markets, released in February 1, explored the low natural
U.S. Natural Gas and the Poten3al for LNG Export Growth
 U.S. Natural Gas and the Poten3al for LNG Export Growth Presentation to: 2018 Wyoming Oil & Gas Fair By: John Harpole September 12, 2018 It is not a scarce resource anymore 2 US RIG COUNTS: Aug 2018 vs
Oil. Gas. Market Notes. Marcellus Supplies Strike Again. Contents
 Oil Gas Market Notes Contents 1 Marcellus Supplies Strike Again Recent Trends in Northeast Gas Displacement 12 Natural Gas Market Charts 15 Oil Market Charts 19 Legislative and Regulatory Highlights 2
EIA Short-Term Energy and Winter Fuels Outlook
 EIA Short-Term Energy and Winter Fuels Outlook NASEO 2015 Winter Energy Outlook Conference Washington, DC by Howard Gruenspecht, Deputy Administrator U.S. Energy Information Administration Independent
Unconventional Oil & Gas: Reshaping Energy Markets
 Unconventional Oil & Gas: Reshaping Energy Markets Guy Caruso Senior Advisor JOGMEC Seminar 7 February 2013 Landscape is Changing Even as We Sit Here Today - US Projected to reach 90% Energy Self-Sufficiency
Wood Mackenzie Gas Market Outlook
 Wood Mackenzie Gas Market Outlook Southern Gas Association April 20, 2009 Amber McCullagh Short-Term Outlook 2008 markets were volatile as underlying fundamentals shifted rapidly Three primary phases:
Energy Markets. U.S. Energy Information Administration. for Center on Global Energy Policy, Columbia University November 20, 2015 New York, New York
 Energy Markets for Center on Global Energy Policy, Columbia University New York, New York by Adam Sieminski, Administrator U.S. Energy Information Administration U.S. Energy Information Administration
Outlook for the Upstream Sector of the Oil and Gas Industry
 Outlook for the Upstream Sector of the Oil and Gas Industry VMA Market Outlook Workshop Chicago, IL Spears & Associates Tulsa, OK August 2015 Million bbls/day 3.5 World Oil Demand Growth/US Oil Supply
Western Oklahoma Residue Takeaway Impact of Growing SCOOP/STACK Supply
 Western Oklahoma Residue Takeaway Impact of Growing SCOOP/STACK Supply Craig Harris Executive Vice President & Chief Commercial Officer October 28, 2016 Forward-looking Statements This presentation and
Energy Market Outlook
 Kyle Cooper, (713) 248-3009, Kyle.Cooper@iafadvisors.com Week Ending September 21, 2018 Please contact me to review a joint RBN Energy daily publication detailing natural gas fundamentals. Price Action:
Energy Market Outlook
 Kyle Cooper, (713) 248-3009, Kyle.Cooper@iafadvisors.com Week Ending September 7, 2018 Please contact me to review a joint RBN Energy daily publication detailing natural gas fundamentals. Price Action:
Short Term Energy Outlook March 2011 March 8, 2011 Release
 Short Term Energy Outlook March 2011 March 8, 2011 Release Highlights West Texas Intermediate (WTI) and other crude oil spot prices have risen about $15 per barrel since mid February partly in response
Energy Market Outlook
 Kyle Cooper, (713) 248-3009, Kyle.Cooper@iafadvisors.com Week Ending September 14, 2018 Please contact me to review a joint RBN Energy daily publication detailing natural gas fundamentals. Price Action:
Gas Shales Drive the Unconventional Gas Revolution
 Gas Shales Drive the Unconventional Gas Revolution Prepared By: Vello A. Kuuskraa, President ADVANCED RESOURCES INTERNATIONAL, INC. Arlington, VA Prepared for: Washington Energy Policy Conference The Unconventional
Navigating the Uncertainties in the North American Gas Market
 Interesting Times: Navigating the Uncertainties in the North American Gas Market Ed Kelly Vice President North American Gas and Power Wood Mackenzie Risks and Uncertainties On the Supply Side The Resource
Energy Market Outlook
 Kyle Cooper, (713) 248-3009, Kyle.Cooper@iafadvisors.com Week Ending August 3, 2018 Please contact me to review a joint RBN Energy daily publication detailing natural gas fundamentals. Price Action: The
Center for Energy Studies. David E. Dismukes Center for Energy Studies
 David E. Dismukes Center for Energy Studies GOM Offshore Oil and Gas Economic Overview In 2008, over 420 MMBbls of oil and 2.4 Tcf of natural gas were produced in the Gulf of Mexico OCS. Employs over 200,000
October U.S. Energy Information Administration Winter Fuels Outlook October
 October 2017 Winter Fuels Outlook EIA forecasts that average household expenditures for all major home heating fuels will rise this winter because of expected colder weather and higher energy costs. Average
North American Gas: A dynamic environment. Josh McCall BP North American Gas and Power November 16, 2011
 North American Gas: A dynamic environment Josh McCall BP North American Gas and Power November 16, 2011 Disclaimer Copyright BP Energy Company. All rights reserved. Contents of this presentation do not
Shale Gas and U.S. LNG Exports. Vienna, January 29, 2013 Jean Abiteboul President, Cheniere Supply & Marketing
 Shale Gas and U.S. LNG Exports Vienna, January 29, 2013 Jean Abiteboul President, Cheniere Supply & Marketing Forward Looking Statements This presentation contains certain statements that are, or may be
Recent Developments in Global Crude Oil and Natural Gas Markets
 Recent Developments in Global Crude Oil and Natural Gas Markets Kenneth B Medlock III, PhD James A Baker III and Susan G Baker Fellow in Energy and Resource Economics, and Senior Director, Center for Energy
North American Gas: The New Big Picture. Jen Snyder North America Gas Research Wood Mackenzie 2010 Summer Seminar August 2, 2010
 North American Gas: The New Big Picture Jen Snyder North America Gas Research Wood Mackenzie 20 Summer Seminar August 2, 20 Cost Advances Continue to Redraw the Big Picture Improving Economics for Southwestern
Energy Prospectus Group
 Energy Prospectus Group Founded in 2001 Current Membership is 530 We have members in 38 states and eight countries ~ 60% of our members live in Texas Mission is to help our members make money Luncheons
Energy and commodity price benchmarking and market insights
 Energy and commodity price benchmarking and market insights London, Houston, Washington, New York, Portland, Calgary, Santiago, Bogota, Rio de Janeiro, Singapore, Beijing, Tokyo, Sydney, Dubai, Moscow,
Energy Macro Review. 3 rd Quarter 2013
 Energy Macro Review 3 rd Quarter 2013 Oil Fundamentals 2 $/bbl WTI Oil Prices are Up in 2013 $115 $110 $105 Front Month WTI Prices WTI crude prices are up +11.1% year-to-date. Three factors have driven