Monitoring and Modeling Valley Creek Watershed: 5. Groundwater Hydrology and Flow Model. Final Project Report to the LCMR
|
|
|
- Harold Higgins
- 5 years ago
- Views:
Transcription

1 Monitoring and Modeling Valley Creek Watershed: 5. Groundwater Hydrology and Flow Model Final Project Report to the LCMR Legislative Commission on Minnesota Resources 30 June 1999 St. Croix Watershed Research Station SCIENCE MUSEUM OF MINNESOTA VALLEY BRANCH WATERSHED DISTRICT Valley Creek
2 TABLE OF CONTENTS Monitoring and Modeling Valley Creek Watershed: 5. Groundwater Hydrology and Flow Model... 1 Extended Abstract... 1 INTRODUCTION... 3 BACKGROUND CONCEPTS AND METHODS... 4 Local Stream-Groundwater Interactions... 4 Regional Groundwater Flow: Hydrogeologic Setting and Conceptual Model... 6 Analytic Element Groundwater Modeling... 9 LOCAL STREAM-GROUNDWATER INTERACTIONS REGIONAL GROUNDWATER FLOW ANALYTIC ELEMENT GROUNDWATER MODEL Model Construction General Domain Layers Aquifer Properties Inhomogeneities Reference Elevation Rainfall Infiltration and Superblocks Lakes, Ponds, and Wetlands Rivers and Streams Model Calibration Baseflow Calibration Head Calibration Model Application Groundwatershed Travel Times SUMMARY AND CONCLUSIONS CREDITS ACKNOWLEDGMENTS REFERENCES TABLES FIGURES i
3 Monitoring and Modeling Valley Creek Watershed: 5. Groundwater Hydrology and Flow Model By JAMES E. ALMENDINGER 1 STUART E. GRUBB 2 1 St. Croix Watershed Research Station, Science Museum of Minnesota 2 Emmons and Olivier Resources Extended Abstract Valley Creek in southeastern Washington County, Minnesota, is one of the finest trout streams remaining in the Minneapolis-St. Paul metropolitan area. The two perennial branches, the North Branch (about 2.22 km long) and the South Branch (3.15 km), combine to form the main stem (2.45 km), which is tributary to the St. Croix River. The watershed is presently mostly rural but faces potential urbanization in the coming decades. Trout streams are sensitive to land-use practices such as urbanization and agriculture that can degrade water quality. Urbanization can increase runoff from impervious surfaces and reduce groundwater discharge, thereby altering the temperature regime of streams. In particular, midwestern trout streams depend on strong groundwater discharge to provide relatively clean water that remains cool enough in summer to support trout. The purpose of this study was to describe the groundwater hydrology of Valley Creek and to model the regional groundwater-flow system that delivers water to the creek. The groundwater hydrology of Valley Creek comprised local stream-groundwater interactions and regional groundwater flow. Local stream-groundwater interactions were investigated by documenting the occurrence of springs, by measuring heads in shallow piezometers driven through the stream bed, and by measuring baseflow at selected points along the stream channel. Approximately 85% of the baseflow of South Branch Valley Creek was fed by springs and seeps in the upper 0.75-km headwaters reach, assuming baseflow measurements taken in spring 1999 were representative. All piezometers in this area had positive (upward) head gradients, indicating groundwater discharge into the stream channel. Nearly all the baseflow of North Branch Valley Creek appeared to derive from the outflow from Lake Edith, which was itself presumably fed by groundwater discharge. Piezometers along this branch had negative (downward) head gradients, indicating seepage of stream water out of the channel. One piezometer was dry, indicating perched conditions. Apparently, little groundwater discharge occurred in the North Branch below the lake outlet. In the main stem of Valley Creek, below the confluence of the North and South branches, a few springs and wetland seeps contributed groundwater, constituting about 11% of the baseflow at the mouth. Regional groundwater flow was inferred from contour maps of potentiometric surfaces (well-water levels) for the major aquifers in Washington County. The aquifers that may influence groundwater discharge to Valley Creek are the Quaternary (glacial 1
4 drift) aquifer, the St. Peter aquifer, the Prairie-du-Chien/Jordan (PdC/J) aquifer, and the Franconia-Ironton-Galesville (FIG) aquifer. Groundwater divides were drawn for each aquifer layer by tracing groundwater highs (analogous to drawing a surficial watershed boundary by tracing topographic highs), beginning near the mouth of Valley Creek. The area enclosed by the groundwater divide in each aquifer is, in this report, referred to as the groundwatershed for that aquifer. As the channel of Valley Creek lies mostly within the elevation of the PdC/J aquifer, the groundwatershed for this aquifer was considered the most important contributor of groundwater to the creek and occupied an area of about km 2 (23 30 mi 2 ). This area was significantly larger than the surficial watershed (about 44 km 2, or 17 mi 2 ), which could help account for the abundant baseflow of Valley Creek. In addition, the FIG aquifer may also be an important source of groundwater to the creek, although data were too sparse to construct a groundwatershed for that aquifer. A regional analytic-element groundwater-flow model was constructed for the Valley Creek area with the MLAEM modeling program, based on regional template models developed by the Minnesota Pollution Control Agency and the South Washington Watershed District. The model had three layers, approximately representing the Quaternary (layer 1), the St. Peter (layer 2), and the PdC/J (layer 3) aquifers. The model was calibrated to measured baseflows in selected reaches of Valley Creek and to measured groundwater levels as generalized by the maps of potentiometric surfaces. Model results indicated that the layer 3 groundwatershed covered about 60 km 2 and corresponded closely in size, shape, and position to that mapped for the Prairie du Chien aquifer. Groundwater travel times (the time it takes groundwater to reach the creek) over most of the groundwatershed were about years, but ranged from about 10 years within 2 6 km of the creek to about years at the farthest boundaries of the groundwatershed. Because most of the groundwater reaching Valley Creek is apparently relatively young, perhaps less than years since the time of infiltration, it may contain anthropogenic tracers and pollutants, such as nitrates. Valley Creek has remained a fine trout stream probably because of its large baseflow component, which is derived over a relatively large groundwatershed. A large baseflow seems critical in giving the creek resilience to short-term disturbances, such as extreme floods or siltation events. Strong baseflow can promote recovery of the stream to pre-disturbance conditions by helping to wash away the dissolved and particulate inputs from such disturbances. Urbanization has been documented to reduce baseflows. Because the groundwatershed of Valley Creek extends to the north and west into rapidly urbanizing areas, care should be taken to minimize practices that reduce infiltration in these areas. In short, maintaining the quantity of groundwater discharge to Valley Creek will be a key factor in keeping it a healthy trout stream and allowing it to recover from potential impacts, should they occur. 2
5 INTRODUCTION Trout streams are highly-valued natural resources that are sensitive to land-use practices that can degrade water quality (Hicks and others, 1991; Kemp and Spotila, 1997). Agriculture and urbanization are land uses that can increase the input of nutrients and suspended sediment to streams (Waters, 1995; Booth and Jackson, 1997; Spahr and Wynn, 1997; Wahl and others, 1997). Such increases can alter aquatic ecosystems by spurring the growth of algae and aquatic macrophytes and by siltation that can reduce or otherwise change the aquatic insect community that form the food base of desired fish species (Richards and Host, 1994; Waters, 1995). Trout are particularly sensitive to changes in water temperature, and summer runoff from urban impervious surfaces can raise stream water temperature above that required for survival of trout (Schueler, 1994). Valley Creek in southeastern Washington County near the village of Afton (Figure 1) is perhaps the finest trout stream in the Minneapolis-St. Paul metropolitan area, with all three species of stream trout (brown, rainbow, and native brook) reproducing successfully in the creek (Waters, 1983). The two perennial branches, the North Branch (about 2.22 km long) and the South Branch (3.15 km), combine to form the main stem (2.45 km), which is tributary to the St. Croix River. The watershed is presently largely agricultural, with scattered rural-residential developments (Pitt and Whited, 1999). However, the watershed is at the margin of the rapidly-developing fringe of the metropolitan area and faces potential urbanization in the coming decades. The watershed soils are dominated by glacial outwash with high infiltration capacity, and direct overland runoff rarely contributes significantly to stream flow, about once or twice per year during extreme rainfall or snowmelt events. Consequently, stream flow is typically at baseflow, when groundwater discharge is the primary source of water to the creek (Almendinger and others, 1999). For midwestern streams, strong groundwater discharge is essential for maintaining equable stream-water temperatures within the range required by trout. Groundwater discharge keeps streams cool enough in the summer to sustain juvenile and adult trout, and warm enough in the winter and spring to allow proper development of eggs deposited by fall-spawning trout. Nonetheless, groundwater flow is rarely studied comprehensively in trout stream studies, perhaps because of the difficulty of obtaining data, the mathematical complexities of groundwater flow, and the difficulty of coordinating interdisciplinary research among biologists and hydrologists. Little is known about how urbanization affects stream-groundwater interactions. Simmons and Reynolds (1982) demonstrated that stream baseflows decreased with urbanization, but there is question regarding the mechanism (Schueler, 1994). Reduced groundwater recharge and lower water tables because of limitation of infiltration by urban impervious surfaces is a reasonable hypothesis. However, further work needs to be done to corroborate the relationship and to determine if baseflows decrease because of reduced groundwater recharge and lower water tables, loss of diffuse inputs of water other than groundwater discharge to baseflow, reduction of the recharge area of the creek, or some combination of these causes. Because of the present high quality of Valley Creek and the potential for urbanization in its watershed, in 1997 the St. Croix Watershed Research Station began a project to monitor the stream for base-line data and to model the stream hydrology in 3
6 order to better understand how urbanization and other land uses could impact the stream. Five long-term stream gauging and sampling stations were established on the creek to monitor stream flow and chemistry (Figure 1). Groundwater discharge to the creek is the dominant source of water in much of the creek and of fundamental importance in maintaining suitable habitat for trout (Almendinger and others, 1999). Given the importance of groundwater discharge to the hydrology of the creek, the purpose of this report is to present known local and regional groundwater-stream interactions in Valley Creek and to document a regional groundwater flow model of the area. Shallow piezometers were driven through the streambed at or near these stations to assess local stream-groundwater interaction, and existing hydrogeological data were compiled to assess regional groundwater flow patterns and to delineate an approximate groundwatershed (that is, the area of aquifer that contributes to groundwater discharge in the creek) for each major aquifer. The flow model was also used to identify a groundwatershed, as well as to estimate travel times of groundwater flow. The scope of the study was limited to data collected during in Valley Creek watershed plus those data in existing hydrogeologic data bases for Washington County. The most significant result of the study was that the primary groundwatershed for the creek covered about km 2, significantly larger than the area of the surficial watershed, and extended northwesterly through a sandplain area with large infiltration capacity. Groundwater travel times (the time it takes groundwater to reach the creek) over most of the groundwatershed were about years, but ranged from about 10 years within 2 6 km of the creek to about years at the farthest boundaries of the groundwatershed. The reader is cautioned that these estimates of groundwatershed area and groundwater travel times could be significantly in error, as with all regional data interpretations and models. BACKGROUND CONCEPTS AND METHODS Local Stream-Groundwater Interactions In this report, local stream-groundwater interactions refer to the exchange of water between the stream and surficial aquifer through the streambed or adjacent riparian zone. Such interactions include springs evident along the stream channel as well as more diffuse groundwater discharge through the stream bed. A spring is simply a very localized area (essentially a point at the watershed scale) of groundwater discharge, typically with flow evident to the eye. Most springs are identified along stream banks by little rivulets that trickle into the stream. Springs that discharge through the streambed are identified by visible, turbulent disturbances to the stream sediment or water surface and are called bubbling or boiling springs, even though such springs typically are not thermal. Excluding inputs from tributaries, a stream reach with increasing flow downstream during baseflow conditions is called a gaining reach, because there is a net gain of flow due to groundwater seeping into the channel (influent groundwater) from the adjacent aquifer where the water table is higher than the stream level (Figure 2a). Conversely, a stream reach with decreasing flow downstream is called a losing reach, because there is a net loss of flow due to stream water seeping out of the channel 4
7 (effluent stream water) into the adjacent aquifer where the water table is below the stream level (Figure 2b). At the watershed scale over the full length of a stream, virtually all perennial streams are gaining (except perhaps those in very arid climates), meaning that the gains from gaining reaches exceeds the losses from losing reaches. At the very local scale the pattern can become more complex, and groundwater may be influent on one side of the channel and stream water effluent on the other side. Conditions can change rapidly during storm events with high flows, and some reaches that were formerly gaining can temporarily become losing reaches as water levels in the creek rise above the surrounding water table. The amount of water that enters the adjacent aquifer from the stream during such flood events is commonly called bank storage, from which water returns to the stream when its levels subside after the flood event. In theory, gaining and losing reaches can be identified by careful stream flow measurements along the course of a stream. However, in practice, it is difficult to measure flow precisely enough over short reaches (for example, hundreds of meters) to identify clear gains or losses. Over longer reaches (for example, kilometers) most streams are gaining; hence losing reaches are rarely clearly identified. Because gaining or losing reaches depend on the relative elevations of the stream and adjacent water table, and because the water-table elevation is partially dependent on unknown heterogeneities in aquifer permeability, it is difficult to predict the location of gaining and losing reaches. One generality is that losing reaches can be found near increasing breaks in stream gradient (where the stream becomes suddenly steeper, such as at the head of a falls, rapids, or even a riffle; Figure 2c). Conversely, gaining reaches can be found near decreasing breaks in stream gradient (where the stream suddenly becomes less steep, such as at the base of a rapids or riffle). Wetlands can form in similar topographic positions at the base of steep slopes (Winter, 1988) where groundwater discharge is enough to inundate the valley floor. Ultimately this discharging groundwater can migrate laterally to the adjacent stream and contribute to stream flow. Besides numerous streamflow measurements taken along the stream, piezometers are another tool that can be used to identify areas of influent groundwater or effluent stream water. A piezometer is constructed the same as a well, that is, a pipe with a screened (perforated) section near the bottom, except that a piezometer is used primarily for measuring head (water level), and a well is used primarily for extracting water. In this study, small piezometers ( cm diameter galvanized pipe, with a 15-cm long screen) were driven into the channel so that the middle of the screen was 1.5 m below the streambed. Influent groundwater is indicated by the piezometer water level being above stream water level (Figure 2a). Effluent stream water is indicated by the piezometer water level being below the stream water level (Figure 2b). If the piezometer is dry, then the stream is not only effluent (losing) but also likely perched over an unsaturated zone, with the water table somewhere below the bottom of the piezometer (Figure 2d). However, truly perched conditions are generally considered to be rare. Piezometer measurements can only indicate influent groundwater or effluent stream water at a very small area (virtually a point), and cannot demonstrate with certainty that a selected stream reach has a net gain or loss of flow. Furthermore, trying to use piezometer measurements in Darcy s Law calculations (head gradient times permeability) to estimate flow into or out of the creek bottom is dubious because of unknown variability in permeability and head gradient along the creek. 5
8 On a watershed scale, groundwater discharging into the stream tends to be younger in the upper stream reaches and older near the stream mouth (Modica and others, 1998). (The age of groundwater refers to the time of travel from its infiltration in the recharge area to its discharge into the stream channel.) However, in local detail at the point of discharge, the age of groundwater varies across the stream-channel cross section, generally with younger groundwater entering near the edges of the stream, and older groundwater entering near the middle of the stream (Figure 2a). Regional flow patterns can distort this general scheme significantly, and in practice it is difficult to predict the location of where the oldest groundwater enters the stream channel (Modica and others, 1998). Regional Groundwater Flow: Hydrogeologic Setting and Conceptual Model In this report, regional groundwater flow refers to watershed-scale flow patterns, from the area of recharge to the points of discharge, specifically creeks or rivers. The hydrogeologic setting is a description of the various unconsolidated and bedrock units the groundwater passes through as it moves from the recharge area to the creek. A conceptual model of this system is a qualitative assessment of regional groundwater flow based on available information about the regional geology and hydrology. This qualitative model is useful for guiding the construction and evaluation of the more rigorous computer model to be presented later in the paper. Here we introduce the geologic framework, basic groundwater flow concepts, and the likely hydrogeologic boundaries of the flow system. The discussion must range beyond the watershed of Valley Creek to include the entire southern half of Washington County, because the groundwater flow system that contributes to Valley Creek can only be defined within the context of the surrounding regional groundwater flow system. Aquifers in the Twin Cities metropolitan area include unconsolidated surficial materials overlying lower bedrock units, separated by variably leaky confining units (Kanivetsky and Cleland, 1990; Mossler and Bloomgren, 1990). These aquifers are, from youngest to oldest, the surficial Quaternary aquifer, the St. Peter aquifer (Ordovician sandstone), the Prairie du Chien aquifer (fractured Ordovician dolostone), the Jordan aquifer (Cambrian sandstone), the Franconia aquifer (Cambrian dolostone), the Ironton- Galesville aquifer (Cambrian sandstone), and the Mount Simon aquifer (Cambrian sandstone) (Figure 3). The bedrock units dip to the west and so rise progressively in elevation from west to east across the county. The rise steepens near the mouth of Valley Creek, where the bedrock forms the Hudson-Afton anticline (an upward fold), which brings the deeper bedrock units to some of their highest elevations in the county. In southern Washington County, the uppermost bedrock aquifer, the St. Peter, has patchy distribution across the county, as portions were evidently eroded away in earlier times. The lower bedrock aquifers are generally extensive across southern Washington County, except in bedrock valleys cut in pre-glacial times that are now commonly filled with glacial drift of sometimes high permeability. Quaternary drift covers most of the county, except in the southeastern part which was beyond the extent of the last glacial advance and includes the southernmost part of the Valley Creek watershed. This area has only a thin layer of unconsolidated materials overlying bedrock (Meyer and others, 1990). 6
9 Groundwater flows from areas of higher hydraulic head to areas of lower hydraulic head. Head is the elevation of water in a well; for a surficial aquifer, the head at the water table is simply the water-table elevation. The water table can be mapped and its elevations contoured; this map represents a potentiometric surface, and each contour line (called an equipotential) is a line along which the head is the same. For a surficial aquifer, the water table and potentiometric surface are synonymous. Groundwater in the surficial aquifer simply moves from areas with a high water table to those with a lower water table. The difference in hydraulic head per unit distance traveled is called the hydraulic head gradient, which is the slope of the potentiometric surface. The head in deeper aquifers can likewise be determined by measuring the elevation of water in wells that are screened in that aquifer. With enough wells, the heads of a deeper aquifer can also be mapped and contoured, and the resulting map represents the potentiometric surface for that aquifer. As in a surficial aquifer, water in deeper aquifers moves from areas with higher heads to those with lower heads. Flow in aquifers is predominantly horizontal. In a system of stacked aquifers such as in Washington County, different aquifers may have different heads, and flow may be induced between aquifers by leaking through the confining units that separate them. Flow in these confining units is predominantly vertical, and, as before, occurs in the direction from the aquifer with higher head to the one with lower head. Ridges in the potentiometric surface are called groundwater divides, because groundwater flows away from such a ridge in opposite directions. Groundwater divides delineate areas of aquifers that discharge to different points. For example, the area of aquifer that contributes groundwater to Valley Creek can be delimited by tracing the groundwater divide that begins at one side of the creek mouth, encircles the contributing area, and ends at the other side of the creek mouth. In this report, we call this area the groundwatershed of the creek for a given aquifer, analogous in concept to a watershed boundary. Technically, each aquifer has its own groundwatershed that contributes to the creek, because each aquifer has its own potentiometric surface. Furthermore, a groundwatershed constructed by tracing groundwater divides on a potentiometric-surface map should conservatively be called a possible groundwatershed, because not all the water within a groundwatershed will necessarily reach the creek. This is because leakage may occur into another aquifer layer where flow directions may not lead to the creek. In this study, potentiometric surfaces were mapped from several data sources. For the Quaternary aquifer, the potentiometric map was developed from the elevations of surface-water bodies (perennial lakes, wetlands, and streams) as depicted on 1:24,000 topographic maps of the area. The implicit assumption is that these water bodies are contiguous with the water table, and that the heads indicated by this inferred water-table surface are representative of those deeper in the Quaternary deposits. That is, we assumed that most perennial water bodies are not perched and that vertical head gradients are small compared to horizontal gradients. For each of the underlying bedrock aquifers, static water levels of wells were used to determine the potentiometric surface. A file of well locations in Universal Transverse Mercator coordinates was merged with a file of static water level readings for each well by matching unique well identification codes (Minnesota Geological Survey, personal communication, 1999). The resultant file was sorted according to the aquifer in which the well was screened. Base maps for Washington County were produced with ArcView geographic information system (GIS) 7
10 software. For each aquifer, data points were plotted on this base map and labeled with their water levels. Water elevations in each aquifer were contoured by hand, as opposed to using electronic contouring programs. On the resulting contour maps of potentiometric surfaces, groundwatersheds were delineated for each aquifer by handtracing groundwater divides as indicated by the contour lines. The reader is cautioned that the maps of potentiometric surfaces and the groundwatersheds so constructed are interpretations of point data, the quality and spatial distribution of which are variable. Static water levels of wells were taken from drillers logs collected over many years and subject to prevailing conditions in the aquifer at that time, artifacts due to drilling, and the judgment of the driller. Determination of the overlying stratigraphy and screened aquifer is subject to interpretation of well logs by Minnesota Geological Survey personnel. In particular, the mapped groundwater divides must be understood to be only generalized two-dimensional indicators of true groundwater divides, which are actually three-dimensional surfaces that separate volumes of aquifers contributing groundwater to different points of discharge. The mapped locations of groundwater divides are especially less certain near their upper regions, where flattened potentiometric surfaces make identifying the location of the divide difficult. Potentiometric surfaces and geology for each of the relevant aquifers in the Valley Creek area will be discussed in greater detail in a later section of this report. Groundwater recharge derives from precipitation (including snowmelt) that is in excess of losses to evapotranspiration and overland runoff. Recharge can occur over the entire landscape but is especially prone to occur on relatively level areas with coarse soils and closed drainages, such as the glacial outwash plains that are extensive in Washington County. The infiltrated water percolates vertically through the unsaturated Quaternary (or other surficial) deposits to the water table, where it begins to flow via hydraulic head gradients mostly horizontally through the aquifers (and perhaps vertically through some of the confining units) to the points of discharge. The major points of discharge are rivers and streams; wells are also points of discharge and can influence groundwater flow patterns if pumping rates are high. In Washington County, the St. Croix River to the east and the Mississippi River to the south and west are the major points of discharge for regional groundwater flow, although tributary streams such as Valley Creek can also be significant. Discharge to these streams and rivers essentially drains water from the aquifers, thereby lowering the water table and potentiometric surfaces of deeper aquifers in the vicinity of streams and rivers. Consequently, the water table and potentiometric surfaces of deeper aquifers are mounded in the central part of the county and slope toward the streams and rivers. As a result, groundwater in central and southern Washington County generally flows from the central part of the county outward toward the major rivers to the east, south, and west. The depth of groundwater flow is not well known, but water from the central part of the county may penetrate to the deeper bedrock aquifers before moving toward the St. Croix or Mississippi rivers, where it must migrate vertically back upward to discharge. Water that recharges closer to the rivers may only penetrate to the uppermost aquifers before reaching the discharge point. 8
11 Analytic Element Groundwater Modeling Analytic element groundwater modeling (Strack, 1989) is a method to mathematically simulate groundwater heads (elevations) and flow on a computer. Input to the model consists of geologic and hydrologic data. The basic geologic data consists of the elevations and permeabilities the various aquifers and confining units. The hydrologic data includes the recharge rate (for example, the amount of water that percolates down to the water table each year) and the elevations of known points of discharge, namely the major rivers and creeks. Other features such as wells with known pumping rates and lakes with estimated water balances can be added. The model then calculates the potentiometric surface for each aquifer, the amount of discharge reaching the creeks and rivers, and the groundwater flow paths and travel times. The analytic element method works by creating mathematical functions that simulate the geometry and hydrology of various hydrological features that occur in aquifers or at their boundaries. Each of these features becomes an analytic element in the model. Each element has a geometry appropriate to the type of feature being simulated: wells are represented by points; small streams are represented by linked line segments; and larger water bodies, areas of recharge, areas of different aquifer permeability, and areas of leakage between aquifers are represented by polygons. One advantage of analytic element models over other types of groundwater models is that very detailed information for an area of interest can be easily added to a regional model that serves as a starting template. Groundwater flow systems interact over very large areas, and model of a local area must mesh with the regional flow pattern to be realistic. One disadvantage (at present) is that the analytic element method is limited to steady-state conditions, that is, conditions that do not change over time. For example, if the recharge rate suddenly decreased because of a change in climate, an analytic element model could not simulate the rate of change as the water table dropped; it could, however, estimate the final position of the new water table in response to the drier climate. Errors in groundwater models occur for several reasons. First, the subsurface geometry and hydraulic variables of subsurface geologic strata are difficult to determine and must be estimated from well logs. Even if the geometry and hydraulics of various aquifers and confining beds were known perfectly, the model could never replicate the complexity that exists in the real world. Thus, the model must necessarily simplify the geologic framework, which is probably the largest source of error in groundwater models. Second, the equations cannot perfectly simulate all types features in the aquifer. Simplifying assumptions must be made in order for the groundwater-flow equations to be solvable. These errors can become apparent near the edges of some analytic elements but are generally not significant in affecting the regional pattern of groundwater flow. Third, the actual amounts of groundwater flowing through the system can be difficult to estimate, namely, how much water recharges the aquifer system each year? Recharge is an episodic event that is difficult to measure at any one point on the landscape and is extremely variable over an area. In fact, one of the best ways to obtain a spatially averaged estimate of recharge is by calibrating a groundwater model to known baseflows of creeks, such as was done in this study for Valley Creek. Measurement of stream baseflow, even if errors approach percent, is still one of the most accurate 9
12 measurements hydrologists can make that can help constrain groundwater models and estimates of recharge. LOCAL STREAM-GROUNDWATER INTERACTIONS Springs and head readings in piezometers driven through the stream bed provided evidence of local stream-groundwater interactions at Valley Creek (Figure 1). Groundwater discharge was most evident in the headwaters of the perennial reach of South Branch Valley Creek), where spring discharge was vigorous and emanated from several fractures in the exposed bedrock, tentatively identified as Prairie du Chien dolostone. A short (75 cm long) piezometer driven into a fracture had a positive head of 6.5 cm, giving a head gradient of (6.5 cm divided by 75 cm). These springs were immediately downstream from a 5-m tall concrete dam completed in 1956 by the landowner to help protect the stream from siltation resulting from intermittent runoff in the southernmost subbasin of Valley Creek. Head in the reservoir behind the dam was approximately 3 m above the stream below the dam, and hence some of the spring discharge below the dam could have been a consequence of this local head gradient. However, the spring water was different in quality from the reservoir water: the spring water had lower dissolved oxygen, higher specific conductance, and the same temperature as ambient groundwater (about 9.5 to 10.5 C), suggesting a more regional groundwater source than local percolation from the adjacent reservoir. Mats of oxidized iron floc in the spring area attested to the reduced (low oxygen content) nature of the emerging groundwater. Downstream from these springs were at least two small ponds, both fed by springs, that discharged to the creek and further increased stream flow. A low terrace between the creek and adjacent valley wall was occupied by wetland that gave further evidence of groundwater discharge that fed stream baseflow. Most baseflow in South Branch Valley Creek apparently originated from these springs and other groundwater discharge along this reach. A baseflow measurement in late spring 1999 just upstream of the confluence with the West Branch was 0.23 cms (cubic meters per second), which, if representative, indicated that this reach supplied about 85% of the median flow measured for the entire South Branch at gauging station 1 (Table 1; Figure 1). Other sources of groundwater discharge contributed to the remaining 15% of baseflow in South Branch Valley Creek. A small seep in the channel at the headwaters of West Branch Valley Creek contributed some flow, and the piezometer driven under this seep (1.5 m long) had a positive head of 14 cm, giving an upward gradient of Further downstream, just above the confluence with South Branch, was a small boiling spring. Unfortunately, baseflow in West Branch Valley Creek was too low to measure with conventional methods, but may have been a significant part of the remaining 15% of the baseflow of South Branch Valley Creek. Just downstream of the West Branch South Branch confluence was a spring-fed pond that also may have contributed significantly to the baseflow of South Branch Valley Creek. Farther downstream were a few small springs (marked by a single symbol on Figure 1) that also fed the South Branch, and the piezometer at gauging station 1 had a slightly positive head (3 cm, giving a gradient of ). Just downstream from the gauging station was a another small boiling spring. Nonetheless, while the lower reach of the South Branch received some groundwater from 10
13 a few springs and other groundwater discharge, by far most of the groundwater that fed this branch originated in the uppermost 0.75-km headwater reach. As discussed below, this discharge apparently was proximally from the Prairie-du-Chien/Jordan aquifer system. Groundwater interactions with North Branch Valley Creek were less evident and more spatially variable. The North Branch had a steady baseflow of about 0.22 cms at gauging station 2 (Table 1; Figure 1) and must have received groundwater discharge at some point upstream. Flow from the adjacent marsh (Metcalf Marsh) into Lake Edith was perennial, as was the outlet of Lake Edith into the North Branch, and groundwater discharge into these surface water bodies was the only reasonable source of this water. However, the only piezometer reading from this area had a slightly negative head (a centimeter or less), indicating outseepage of stream water. This piezometer was placed at the outlet of the marsh, just above where the stream gradient steepens, and so a negative head was not unexpected (see Figure 2c) and was not likely representative of other groundwater interactions around the marsh and lake margins. Access to the creek from the outlet of Lake Edith downstream to station 2 was not allowed by landowners, and so little is known of this reach. The topographic map indicated that a small tributary on the west side of the North Branch was also be perennial and therefore likely contributed to baseflow. However, this and other inputs to baseflow along this reach appeared to be very small. The piezometer at station 2 was dry, meaning that the stream was perched at that point and that the water table was at least 1.5 m below the stream bed. In the summer of 1998, the flow at the outlet of Lake Edith was calculated with a culvert-flow formula to be about 0.21 cms (John Hanson, Barr Engineering, Minneapolis, MN, personal communication, 1998), within five percent of the typical baseflow at station 2 (Table 1). In short, baseflow in the North Branch upstream of station 2 was largely derived from the outflow from Lake Edith. Downstream from station 2 and above the confluence with the South Branch was a marshy area and breached beaver pond; groundwater may have discharged there but the amount is unknown. The main stem of Valley Creek at station 5 had a baseflow of about 0.55 cms in , about 0.06 cms greater than the sum of the baseflows of the North and South branches (Table 1; Figure 1). As noted, some of this flow originated from boiling springs below station 1. However, wetlands upstream from station 5 indicated groundwater discharge at the base of the valley wall and contributed several small rivulets to the creek, which appeared to be the largest source that increased baseflow in the main stem below the confluence. Iron staining along the stream banks adjacent to these wetlands was further evidence of groundwater discharge along this reach. The piezometer at station 5 had a very slightly negative head reading (less than a centimeter), indicating loss of stream water into the aquifer. This negative head might be explained because the piezometer was placed at the head of a slight riffle, or because the St. Croix River was 5 m lower in head and only a kilometer away. More generally, it demonstrated minimal stream-groundwater interaction at that point and was further evidence of the spatially variable nature of stream-groundwater interaction. 11
14 REGIONAL GROUNDWATER FLOW Aquifer geology lays the framework for understanding groundwater flow within and between aquifers. Potentiometric surfaces provide hydrologic evidence for the regional extent and direction of that flow. In the section that follows, the geology of each aquifer and its basal confining unit (if present) will be discussed first, followed by an interpretation of the potentiometric surface for that aquifer, starting with the surficial Quaternary aquifer and progressing downward. Drift-filled bedrock valleys are important hydrogeologic features that will be discussed as part of the Quaternary aquifer. Several of the vertically-adjacent bedrock aquifers in the region are commonly lumped by hydrogeologists into single aquifer units, because the confining unit that separates the aquifers may be absent in most areas or too discontinuous to significantly hinder flow between aquifers. That is, commonly the Prairie du Chien and Jordan aquifers are considered to operate as a single aquifer (abbreviated PdC/J here), and the Franconia and Ironton-Galesville aquifers also seem to function as a single aquifer (abbreviated FIG here), especially in the eastern part of the county. Nonetheless, in the interest of completeness, the potentiometric surface for each separate aquifer was mapped individually in this report. Quaternary deposits of till or outwash form the surficial aquifer over most of the watershed (Meyer and others, 1990). Most of these deposits are sand-plain outwash deposits with high infiltration capacity and high permeability. Shallow tills tend to be sandy, and therefore reasonably permeable. We assumed that interbedded till units within the outwash do not permit significant vertical head gradients, at least at the watershed scale, and that consequently these unconsolidated deposits function as a single aquifer. While some lower till units can be quite dense and form a partially confining unit at the base of the Quaternary deposits, the location and spatial extent of such lowpermeability till patches is not well known. Thus in general, where the Quaternary aquifer directly overlies a bedrock aquifer, the hydraulic connection is considered to be good with little impedance of vertical flow. In particular, Quaternary deposits overly directly overlie the St. Peter and the PdC/J aquifers over much of Washington County, especially just west and north of Valley Creek. In the south-central and western parts of Washington County, the Platteville-Glenwood unit (Ordovician limestone and shale) does form a significant aquitard at the base of the Quaternary deposits, but the extent of this unit is limited. Drift-filled bedrock valleys are important features in east-central Minnesota that influence the hydrogeology of both surficial and bedrock aquifers. Pre-glacial rivers cut deep channels in the bedrock, commonly down to the Jordan aquifer and sometimes as deep as the FIG aquifer. These channels were subsequently filled with glacial drift, which often is of high permeability with large capacity to transmit groundwater. Moreover, the channels tend to lead directly to either the St. Croix or Mississippi rivers, having been cut by former courses of these rivers or by smaller rivers tributary to them. Consequently, when filled with high-permeability drift the channels are direct conduits of groundwater to the major regional points of discharge, namely the St. Croix and Mississippi rivers. The channels are drains of the groundwater system, lowering potentiometric surfaces in the vicinity and conducting groundwater toward the rivers. Sometimes these bedrock valley have no obvious surficial expression; one such valley extends from Lake Elmo in central Washington County southward to the Mississippi 12
15 River. More commonly, however, present watercourses or lake chains lie in these driftfilled valleys. Both the north and south branches of Valley Creek lie in remnant bedrock valleys cut to the depth of the FIG aquifer but now filled deeply with drift. By definition, the surficial aquifer is that which comprises the water table, and for most of Washington County, Quaternary deposits constitute the surficial aquifer. However, near the St. Croix and Mississippi rivers and in the southeast part of the county where Quaternary drift is thin or absent, the water table can be in the uppermost bedrock aquifer, such as the Prairie du Chien aquifer near Valley Creek. In the surficial aquifer, the flow direction toward Valley Creek is largely southeastward, starting just south of a water-table high near White Bear Lake. (Figure 4). Flow directions appear to be influenced by buried bedrock valleys, principally flow toward the Valley Creek area and flow south along the axis of a buried valley toward the Mississippi River. The area encompassed by the water-table divide for the surficial aquifer is referred to here as the Quaternary groundwatershed, because Quaternary deposits dominate the surficial aquifer. Its area is large, about 150 km 2 (about 58 mi 2 ), and encompasses an area nearly congruent with that of the Valley Branch Watershed District. This is because the elevations of surface-water bodies correspond in a general way to the topography of the landscape, and the watershed district boundary was based approximately on topographic divides. Water infiltrating over this groundwatershed and recharging the surficial aquifer has the potential to move to Valley Creek. However, it is important to note that water leaking into deeper aquifers from within this area, especially near the boundary, may be diverted to other points of discharge, namely, the St. Croix or Mississippi rivers. Consequently, the actual contiguous area of surficial Quaternary aquifer that contributes groundwater to Valley Creek is likely to be smaller than the groundwatershed as shown in Figure 4. Because the perennial reaches of Valley Creek lie in a bedrock gorge below the base of most of the Quaternary aquifer, this aquifer can deliver only a limited amount of groundwater directly to the creek from a restricted area where sloping beds of drift mantle the eroded edges of bedrock aquifer units. Most of the water that originates in the surficial aquifer and eventually reaches the creek likely first passes through deeper bedrock aquifers, which are hydraulically well-connected with the surficial aquifer, as noted above. The St. Peter aquifer (Ordovician sandstone) is the uppermost bedrock aquifer in the county (Mossler and Bloomgren, 1990) (Figure 3). It is highly permeable and confined at its top by the Platteville-Glenwood unit (where present) and at its base by a layer of siltstones and shales that are considered part of the St. Peter unit. It exists in only discontinuous patches, having been eroded away from most of the eastern half of the county and where pre-glacial rivers eroded bedrock valleys. While several substantial patches of the St. Peter do exist just north and west of Valley Creek, there are no well water-level data for those patches and a potentiometric surface cannot be constructed for those areas. Data do exist farther west in the county, and there the potentiometric map for the St. Peter aquifer (Figure 5) indicates a generally south to southeastward flow. The potential for downward leakage from the Quaternary aquifer is indicated by higher hydraulic heads in the Quaternary relative to those in the St. Peter (compare Figures 4 and 5). Quaternary heads can be 100 ft above St. Peter heads where the top of the St. Peter is confined by patches of the Platteville-Glenwood unit in the western part of the county. Where the Platteville-Glenwood is absent, however, Quaternary heads are 13
16 generally less than 25 ft higher than St. Peter heads, implying good hydraulic connection and relatively unimpeded leakage of water downward from the Quaternary into the St. Peter. Construction of a groundwater divide for the St. Peter aquifer was not feasible because of the lack of data and discontinuous nature of the aquifer The Prairie du Chien aquifer is composed of fractured dolostone and is confined at its top by the denser base of the St. Peter (Mossler and Bloomgren, 1990) (Figure 3). It is commonly considered to not be confined at its base and to function as a single aquifer with the underlying Jordan unit. The Prairie du Chien is areally extensive in Washington County, being absent only in the northwest part of the county and where pre-glacial bedrock valleys were cut. The potentiometric surface (Figure 6) indicates a southward sloping ridge of high heads along the central axis of the county; groundwater flows both southward along this ridge and away from it toward the St. Croix and Mississippi rivers. The Prairie du Chien is eroded away in the gorge of Valley Creek itself and data are sparse in adjacent areas. Still, the 825-ft contour is concave towards the creek, indicating flow towards, and discharging at, Valley Creek. Kanivetsky and Cleland (1990) estimate that the eastward-dipping potentiometric surface drops below the top of the Prairie du Chien about a mile or two west of the headwaters of the perennial reaches of Valley Creek. In other words, the overlying aquifers (mostly the Quaternary but possibly a small area of St. Peter as well) are dry, and the water table is in the Prairie du Chien. To the northwest of Valley Creek, where highly permeable outwash directly overlies the Prairie du Chien, the heads in the Quaternary aquifer are generally less than 25 ft above those in the Prairie du Chien, indicating excellent hydraulic connection and leakage from the Quaternary aquifer into the Prairie du Chien. Where the Quaternary aquifer overlies the St. Peter or Platteville-Glenwood, Quaternary heads can be 100 ft higher than Prairie du Chien heads, but downward leakage is limited by intervening confining units. The area enclosed by the groundwater divide, termed here the Prairiedu-Chien groundwatershed for Valley Creek, covers about 60 km 2 (about 23 mi 2 ). This area is much smaller than that of the Quaternary groundwatershed and demonstrates the strong influence of discharge to the St. Croix and Mississippi rivers on groundwater flow in the bedrock aquifers. Thus, much of the water infiltrating within the upper part of the Quaternary groundwatershed for Valley Creek may never reach the creek but instead penetrates to the Prairie du Chien and deeper aquifers and is diverted toward either the St. Croix or Mississippi rivers. Within the Prairie du Chien groundwatershed, flow toward Valley Creek is largely from the northwest. However, some flow is from the southwest and the groundwatershed there borders a depression in the potentiometric surface. The cause of this depression is not clear; it may be caused by pumped wells, by leakage to lower aquifers, by drainage toward the narrow drift-filled bedrock valley just a few kilometers to the west, or some combination of these factors. Nonetheless, this depression evidently captures a small portion of groundwater that may have otherwise contributed to Valley Creek. The Jordan aquifer is a highly permeable sandstone, generally not significantly confined at its top by the overlying Prairie du Chien unit but well-confined at its base by the dense St. Lawrence unit, composed of dolomitic shale and siltstone (Mossler and Bloomgren, 1990) (Figure 3). As with the Prairie du Chien, the Jordan aquifer is extensive across Washington County, absent only in the far northwest and where eroded by deep bedrock valleys, principally along the St. Croix trench. Groundwater heads in 14
17 the Jordan (Figure 7) are generally similar to those in the overlying Prairie du Chien, as expected because of the excellent hydraulic connection between the two units and their assumed functioning as a single aquifer unit. Consequently, regional groundwater flow directions are similar, with flow southward along a southward-sloping core of higher heads in the central part of the county, and flow away from this potentiometric ridge eastward to the St. Croix River and southward and westward to the Mississippi. Data points (wells) near Valley Creek give strong evidence of discharge to Valley Creek, as the contour lines are concave toward the creek. Vertical head differences between the Jordan and overlying Prairie du Chien are generally small. Close comparison of Figures 6 and 7 indicates some area where the heads of the Prairie du Chien are higher, and other areas where heads are lower, than those in the Jordan. It seems likely that these differences are due mostly to errors in the original data (variability or inaccuracy in determining the static water levels of wells) and errors in interpretation (incorrectly estimating contour lines in areas where few data points exist). The Jordan groundwatershed for Valley Creek covers about 80 km 2 (about 30 mi 2 ) and is of generally similar shape to that in the overlying Prairie du Chien, but appears narrower and extends farther to the north. Again we caution that the size and shape of such groundwatersheds are only approximate, especially at their upgradient margins. In particular, much of the area of this groundwatershed is within the northward-extending tail, which may be considerably in error because of the few available data points. Because of the generally good hydraulic connection between the Prairie du Chien and Jordan aquifers, their groundwatersheds should be similar, and any large apparent difference between them may be simply due to data and mapping errors as discussed above. As in the Prairie du Chien, flow toward Valley Creek from within the Jordan groundwatershed is generally from the northwest to the southeast. Also as in the Prairie du Chien, a depression in the potentiometric surface adjacent to the southwest border of the groundwatershed evidently captures some groundwater that otherwise might contribute to Valley Creek. The Franconia aquifer is composed of fine-grained sandstone with evidently high enough permeability to be extensively used for residential wells in the Valley Creek area (Mossler and Bloomgren, 1990) (Figure 3). The aquifer is well-confined above by the St. Lawrence, and partially confined below by thin shale beds in the lower parts of the Franconia. Data are limited to wells serving communities along the St. Croix River, as the Franconia commonly becomes the uppermost bedrock aquifer there, where the Prairie du Chien and Jordan have been eroded away. Regional flow is presumably similar to that in the overlying aquifers, namely, outward from the central axis of the county, south and west toward the Mississippi and east to the St. Croix (Kanivetsky and Cleland, 1990). However, the data available here are too sparse to construct a closed groundwatershed for this aquifer for Valley Creek. The contour lines show a clear concavity around the Valley Creek area, indicating that the aquifer may discharge there (Figure 8). The closely-spaced contours indicates a rapid change in head over a small horizontal distance, that is, a steep slope to the potentiometric surface. This steepness is probably caused by discharge from the aquifer through a very narrow zone where the overlying confining unit (the St. Lawrence) is absent and the aquifer subcrops along the St. Croix trench and under Valley Creek, even though this zone is now filled deeply by unconsolidated material. West of this discharge zone, heads in the Franconia appear to be higher than those in the Jordan, but the St. Lawrence is too dense to permit significant upward flow. 15
18 The Ironton-Galesville aquifer is composed of sandstone, generally not wellconfined at its top by the overlying Franconia but well-confined at its base by the thick and dense siltstones and shales of the underlying Eau Claire formation (Mossler and Bloomgren, 1990) (Figure 3). Regional flow is likely similar to that in the overlying Franconia aquifer, but head data are too sparse in the Valley Creek area to define a meaningful groundwatershed. The potentiometric surface as mapped (Figure 9) gives no indication of groundwater discharge to Valley Creek and instead indicates discharge simply to the St. Croix River. However, the data set may just be too sparse to show local details at the scale of Valley Creek. Because of the generally good hydraulic connection between the Ironton-Galesville and the overlying Franconia, and because the Ironton- Galesville subcrops beneath Valley Creek, it is possible that discharge from the Ironton- Galesville is influenced by Valley Creek. The Mount Simon aquifer is a thick sandstone, well-confined at its top by the Eau Claire unit and apparently well-confined at its base by older shales of the Solor Church formation (Mossler and Bloomgren, 1990) (Figure 3). Only a very thin band of Mount Simon subcrops under Valley Creek and the edge of the St. Croix trench. The available data are too sparse to map potentiometric contours in the Valley Creek area (Figure 10). Because of its depth, the limited area of subcrop, and the proximity of the St. Croix to those subcrops, discharge from the Mount Simon probably has little influence on Valley Creek and instead moves directly to the St. Croix River. To summarize aquifer interactions with Valley Creek, little groundwater from the surficial Quaternary groundwatershed reaches the creek directly. Instead, most percolates to the underlying bedrock aquifers with little resistance, and from there moves to Valley Creek. Most of the baseflow of Valley Creek appears to derive from the Prairie du Chien and Jordan units, that is, the PdC/J aquifer. This aquifer outcrops and subcrops under the headwaters of the South Branch of Valley Creek; flow in this uppermost reach less than a kilometer downstream from these headwater springs can constitute about 85% of the baseflow in the entire South Branch. The PdC/J aquifer borders Lake Edith and the North Branch of Valley Creek and likely also discharges there, as indicated by the maps of the potentiometric surfaces. Potentiometric surface maps also indicate that FIG aquifer (Franconia and Ironton-Galesville units) may discharge to the middle or lower reaches of Valley Creek. Nonetheless, for purposes of simplification, we discounted the influence of the FIG aquifer in our modeling effort. We recognize that adding the FIG aquifer in future, more detailed groundwater models might be useful. We further assumed that the Mount Simon aquifer has a negligible influence on Valley Creek and consequently was also not included in the groundwater model. ANALYTIC ELEMENT GROUNDWATER MODEL Modeling groundwater flow for the Valley Creek area consisted of three steps: model construction, model calibration, and model application. The model was based upon known geologic and hydrologic data for the area. The geologic data were used to construct the basic model geometry of stacked aquifers and confining beds. The hydrologic data were used for calibration of the model. That is, the known potentiometric surfaces and baseflows of creeks in the vicinity of Valley Creek were the targets that the model tried to simulate. The hydraulic properties of these geologic units 16
19 were then adjusted to obtain a good fit to the hydrologic calibration data. Once the model was calibrated to these data, the model was applied to simulate the recharge area (groundwatershed) contributing to Valley Creek and the groundwater travel times from selected points in the aquifer system to the creek. Model Construction General The Minnesota Pollution Control Agency (MPCA) has constructed a regional groundwater flow model for the Twin Cities Metropolitan Area (the Metro Model ; MPCA, 1997), including the Valley Creek watershed. Their model uses coarse analytic elements to simulate regional groundwater flow patterns. The Valley Creek Groundwater Model used the Metro Model as a template. Additional analytic elements were added to the template to refine the model to fit local hydrogeologic features and observed data. The computer code used for the Metro Model and the Valley Creek Groundwater Model was MLAEM v.5.02 (Strack Consulting, 1997). Domain The MLAEM model has an infinite areal domain. That is, boundary conditions do not need to be imposed at the edges of the model. For practical purposes, inputs to the model have been limited to a domain bounded by the Phalen Channel and Mississippi River to the west, the Mississippi River to the south, the St. Croix River to the east, and the approximate extent of the St. Peter Sandstone to the north. The boundaries are shown, along with the bedrock geology, on Figure 11. The Mississippi and St. Croix Rivers represent no-flow boundaries, but the other boundaries are more arbitrary. Layers The Metro Model consists of five horizontal layers representing major aquifers in the area. The layers are numbered 1 to 5 from the top down. The layers are separated by four leaky layers that represent confining layers or leaky confining layers between the aquifers. The Metro Model is more completely described in the Metro Model Interim Progress Report (MPCA, 1997). The Valley Creek Groundwater Model uses only layers 1, 2, and 3 of the Metro Model. The layers and leaky layers are as follows (descriptions include excerpts from MPCA, 1997): Layer 1 represents an aquifer of unconsolidated glacial materials throughout the model domain. Groundwater recharge occurs at the top of this layer through infiltration. Water losses from this aquifer are primarily to surface-water streams and to the underlying aquifer via leakage. Leaky Layer 1 represents the basal unit(s) with vertical hydraulic resistance underlying the lower-most glacial drift aquifer. This leaky layer represents the effects of one or more of the following: glacial till, Decorah Shale, Platteville Limestone, 17
20 and the Glenwood Shale. Therefore, its properties are dependent on the areal distribution of these units. Layer 2 represents groundwater flow through the St. Peter Sandstone. Most recharge to the St. Peter Sandstone aquifer is expected to come from overlying drift materials in areas where intervening bedrock layers are absent. Discharge of groundwater from this layer occurs through leakage to underlying units and discharge to surface waters. Where the land-surface elevation drops near the rivers and the St. Peter Sandstone is not present, Layer 2 represents the unconsolidated glacial materials at the surface. Leaky Layer 2 represents the base of the St. Peter Sandstone, which provides significant vertical hydraulic resistance. Where the St. Peter Sandstone is not present, Leaky Layer 2 represents the basal drift unit(s) with vertical hydraulic resistance underlying the lower-most glacial drift aquifer. Layer 3 represents groundwater flow in the Prairie du Chien-Jordan Aquifer, and includes both formations as one hydrostratigraphic unit. Recharge to this aquifer occurs as leakage from overlying bedrock units and also from the glacial drift where the formation subcrops beneath it. The Mississippi and St. Croix rivers serve as major discharge zones for this aquifer. Leaky Layer 3 represents the St. Lawrence Formation. This formation serves as an impermeable aquiclude everywhere in the Valley Creek Groundwater Model domain, except in the area of the St. Croix anticline described below. The glacial and bedrock units are represented by simplified polygons in the model, especially where the units are not present everywhere in the model domain. Figure 12 shows the polygons that represent the bedrock units. Figure 12 can be compared to Figure 11 to see the relationship between the model elements and the mapped bedrock units. Figure 13 shows an idealized cross section through the southern part of Washington County. Figure 13 illustrates the relationship of the model layers to the topography and the bedrock valley (discussed below). Aquifer Properties The aquifer properties that can be varied throughout the model domain are the permeability (or hydraulic conductivity), thickness, base elevation, porosity, and vertical leakage. Figure 13 shows some of the values that were used and how they relate to the model elements. The permeability values were taken from the Washington County Geologic Atlas and the Metro Model. Values did not vary significantly within individual formations except in a few areas where data such as well discharges or stream baseflow were known. The thickness and base elevation of each geologic formation (and model layer) were taken from the Washington County Geologic Atlas. Adjustments were made in key areas near the South Washington Bedrock Valley (discussed below) where recent drilling had provided new data on the elevation of the Prairie du Chien bedrock. Very little data regarding the porosity of aquifer materials is available. A default value of 0.3 was used everywhere. The model simulated vertical leakage into and out of each layer by assigning resistance values to the bordering leaky layers. Polygons were created to represent different geologic formations within the leaky layers, as shown on Figure 12. Resistance varels were assigned to each polygon. The amount of water moving into or 18
21 out of the model is dependent on the resistance value and the difference in head between the layers. Very little data are available on resistance values because they are virtually unmeasurable in the field. A broad range of values has been compiled as a result of developing the Metro Model. Consequently, the resistance values vary significantly in different parts of the model. Inhomogeneities Inhomogeneities (also called heterogeneities) are areas within a model layer where the permeability, base elevation, thickness, and/or porosity differs from the rest of the layer. Four inhomogeneities have been added to the model: The Phalen Channel is a bedrock valley filled with relatively high-permeability glacial deposits. It trends north-south through St. Paul on the west edge of the model domain. The South Washington Bedrock Valley is another bedrock valley filled with relatively high-permeability glacial deposits. It trends north-south through Woodbury and Cottage Grove. The St. Croix Anticline (sometimes called the Hudson-Afton Anticline) is a structural feature that underlies Valley Creek on the east edge of the model domain. In this area the older sedimentary formations are at a relatively high elevation and subcrop below the glacial deposits. Figures 14, 15a, and 15b show cross sections through the Valley Creek areas. Two inhomogeneities have been defined: The Franconia inhomogeneity extends from the edge of the Jordan Sandstone to the edge of the Franconia formation. This area is characterized by groundwater flow through the Franconia formation and the relatively thick overlying glacial deposits. The Mt. Simon inhomogeneity extends from the edge of the Franconia formation to the St. Croix River. This area is characterized by groundwater flow through very thick glacial deposits. Several bedrock units including the Mt. Simon Sandstone subcrop below these glacial deposits and are locally important sources of groundwater. The bedrock units lie mostly below the bottom elevation of Model Layer 3. Because the model in this area is primarily concerned with shallow groundwater flow to Valley Creek, the deeper bedrock units were not incorporated into the model. Reference Elevation The reference elevation is necessary to complete the mathematical equations in the Analytic Element Model. The Valley Creek model uses the reference elevation established for the MPCA Metro Model. The reference point is located in Iowa, far away from other elements in the model, and has negligible influence on the model solutions. 19
22 Rainfall Infiltration and Superblocks Rainfall infiltration is the precipitation that eventually reaches the saturated aquifers. A rainfall infiltration value of 6 in/yr ( m/d) was used throughout the model area. The model layers are at the same elevation throughout the model domain except in the South Washington Bedrock Valley inhomogeneity. Changes in surface elevation result in areas where one or more of the upper model layers is above the ground surface. Figure 16 shows where the top and bottom of the model layers intersects the ground surface. Rainfall infiltration was input into the model via polygons and constant strength elements at the top of the model layer that contained the ground surface. Figure 17 shows the location of these rainfall polygons. For purposes of calibration, it is useful to have the model simulate groundwater flowing to the St. Croix and Mississippi Rivers from all directions. Similarly, the model should simulate regional groundwater flow beyond the model domain to the north and northwest. To accomplish this, infiltration was added to model layers 2 and 3 via large scale superblocks shown on Figure 16. The superblocks very crudely simulate precipitation and groundwater flow in these outer regions, and they help to create an accurate simulation of conditions near the domain boundaries. Lakes, Ponds, and Wetlands The need for computational efficiency dictates that only the largest lakes, ponds, and wetlands are added to the model. These surface water bodies were added as polygons to the top of the appropriate model layer, depending on their elevations. The polygons are shown on Figure 18. Resistance varels were added to the surface water polygons. The varels specified a head and bed resistance within each polygon. A relatively low resistance of 5000 days was used as the default value. Elevation data were obtained from USGS topographic maps or more recent measurements by the Minnesota DNR and others, if available. The effect of the varels is to allow water in the model to flow freely into or out of the polygons depending on the head in the underlying aquifer, similar to a fixed head model element. Perched conditions could be created in the surface water bodies by increasing the resistance value. Rivers and Streams Rivers and streams in the model, including Valley Creek and the Mississippi and St. Croix rivers, were simulated using curvilinear elements. The elements were assigned head values at known locations. Locations of the curvilinear elements are shown on Figure 18. Model Calibration The groundwater model represents a complex water balance based on many input parameters including infiltration rates, elevations of discharge points, well pumping rates, aquifer hydraulic conductivity, and resistance to flow between aquifer layers. Model calibration is the process by which these input parameters are systematically adjusted so 20
23 that modeled groundwater discharges and heads (elevations) reproduce measured discharges and heads as closely as possible. The calibration process is not an exact science and is never entirely complete, because the model will never perfectly reproduce all of the geologic and hydrologic complexities of a watershed. The goal is to produce a model that captures the essential functioning of the regional groundwater flow system, while minimizing errors in the local flow systems. Oftentimes, parameters are adjusted so that errors in local flow systems are compensating. That is, in a selected locality some heads and discharges may be overestimated, and other underestimated, but the averages over a larger region will be similar to measured values. Calibration of the Valley Creek groundwater model was conducted in two ways: by comparing modeled groundwater discharges to streams with measured baseflows, and by comparing modeled hydraulic heads with measured heads as mapped in Figures 4 9. Baseflow Calibration Baseflows were estimated from selected segments of Valley Creek as well as from selected tributary streams along the St. Croix River (Table 1). Because Valley Creek is usually at baseflow, most flow measurements were taken under baseflow conditions. Consequently, for most reaches of Valley Creek, median values of flow measurements taken during were used as estimates of baseflow; use of another measure, such as the 25th percentile of flow measurements, would not give appreciably different results. For Browns Creek, a representative baseflow was estimated from flow data. For the outlet from Little Carnelian Lake, manual hydrograph separation was used to estimate baseflow from 1998 flow data (see Table 1 for credits to data sources). For the other streams, winter flow measurements taken on 25 February 1999 were assumed representative of baseflow. Not all of these baseflows were used in calibrating the Valley Creek groundwater model, but they are included here to benefit continued modeling efforts in Washington County. Valley Creek is represented by curvilinear elements in the model. The model calculates the amount of groundwater discharged to each segment of these elements. The sum of discharge for a selected number of these segments is the modeled discharge for the stream reach represented by these segments. Lake Edith was represented as a givenhead areal element (varel) in the model. The calculated discharge from this varel represents the calculated discharge through the outlet of Lake Edith to the north branch of Valley Creek. Model calibration focused on selected stream reaches of Valley Creek. Table 2 compares measured baseflows and modeled groundwater discharges for these specific stream reaches. In the South Branch Valley Creek, the model underestimated the amount of discharge in the headwaters area by about 39%. One hypothesis to explain this error is that perhaps the Prairie du Chien aquifer is highly fractured in this area and has a much higher hydraulic conductivity than expected. In contrast, the model overestimated discharge to the remaining part of the South Branch by nearly 250%. The high percentage error is caused by the measured baseflow being rather low, so that even a small absolute errors are magnified to large percentage errors. However, these errors counterbalance each other, so that the error for the entire South Branch is only 3%. Likewise, the model underestimated discharge out of Lake Edith by 17%, and 21
24 overestimated the discharge to the rest of the North Branch by about 16%, with the result that the baseflow for the entire North Branch was underestimated by 15%. The model overestimated discharge to the main stem of the creek by 143%. For the creek as a whole, however, the total error was only 11%. These errors demonstrate the difficulty of calibrating a regional model to local conditions along specific reaches of the creek, and that local errors can counterbalance each other so that the creek as a whole, and its effect on regional flow in the contributing aquifers, can be modeled with reasonable accuracy. Head Calibration Modeled groundwater heads (elevations) can be plotted and contoured for each model layer, and compared to the previously described potentiometric surfaces determined for each aquifer. Unfortunately, because of topography, sloping bedrock units, and erosional loss of parts of some bedrock units, there is not an exact one-to-one correspondence between model layers and aquifers, especially near the edge of the aquifers along the St. Croix River and Valley Creek. Consequently, different areas of each model layer must be interpreted according to the relevant aquifer. Model layer 1 represented the Quaternary aquifer above an elevation of about 900 ft, which was the base elevation of this layer over most of the model domain. The exception occurs in a narrow inhomogeneity representing a north-south trending bedrock valley in the western part of the figure, where the aquifer base was lowered to an elevation of about 850 ft, and modeled heads can drop below 900 ft in that area. Modeled heads (Figure 19) show contours similar to the plotted water table (Figure 4; compare contours above 900 ft) at these elevations. Because the land-surface elevation drops below 900 feet near Valley Creek and the St. Croix River, there is no physical aquifer corresponding to model layer 1 in these areas. The model correctly predicted that layer 1 was dry in these areas, and that the water table was in one of the underlying layers. Model layer 2 represented the St. Peter aquifer in the west (where this aquifer exists), and otherwise to the east represented the Quaternary aquifer below 900 ft elevation and where the St. Peter is absent. The base of most of model layer 2 was at an elevation of about 790 ft, and heads generally were not modeled below this elevation in layer 2. Again, the exception is the north-south trending inhomogeneity in the western part of the figure, where the aquifer base was dropped to an elevation of about 720 ft. Modeled heads (Figure 20) show a similar northwest-to-southeast flow direction (that is, flow from higher head contours to lower head contours) as indicated by the potentiometric surfaces for the St. Peter aquifer (Figure 5) and the Quaternary aquifer (Figure 4; compare contours below 900 ft). Model layer 3 represented the combined Prairie-du-Chien/Jordan (PdC/J) aquifer over most of model domain, except where these bedrock units were eroded away in the deep bedrock valleys of Valley Creek and the St. Croix River. Modeled contours (Figure 21) reproduce the major features of the potentiometric surfaces for the Prairie du Chien and Jordan aquifers (Figures 6 and 7). This model layer was considered to be most critical for Valley Creek because the PdC/J aquifer is the likely source of most of the groundwater discharging to the creek. 22
25 Model Application The calibrated model was applied to simulate the groundwatershed that contributes discharge to Valley Creek, and to calculate travel times of groundwater flow from the recharge area to the creek. To accomplish these tasks, the model was used to trace flow lines backwards (upgradient) from the base of layer 3 under Valley Creek to their points of origin. These are the deepest flow lines in layer 3 that discharge into Valley Creek, and they consequently originate farthest away and have the longest travel times. Groundwatershed Because the elevation of Valley Creek is primarily within model layer 3, primarily representing the joint PdC/J aquifer, only the groundwatershed for that layer was modeled. The estimated groundwatershed for model layer 3 (Figure 22) corresponded closely to the mapped groundwatershed for the Prairie du Chien aquifer (Figure 6). The size (about 60 km 2 ), shape, and location of the two groundwatersheds were very similar, indicating that the model simulated the main properties of the regional groundwater flow. Even though the same data set was used to create the mapped groundwatershed (Figure 6) and to constrain the model (Figure 22), there was no guarantee that the model results would match the data so well, at least for this layer. Because the Prairie du Chien and Jordan units tend to function as a single aquifer (the PdC/J), they should have similar groundwatersheds. However, the mapped groundwatershed for the Jordan aquifer (Figure 7) had a larger area (about 80 km 2 ) than that of the Prairie du Chien because of a longer, wider tail extending far to the north. In fact, Figure 7 shows that this tail was poorly constrained by just a few data points and consequently could be significantly in error. The close correspondence between the modeled layer 3 and mapped Prairie du Chien groundwatersheds implied that these were better representations of the actual groundwatershed for the PdC/J aquifer contributing to Valley Creek. Groundwatersheds were not modeled explicitly for the overlying layers 1 and 2. Because of horizontal flow within each layer, the groundwatersheds for these layers could be assumed to be similar in shape, but elongated in the upgradient direction. Travel Times The model simulated groundwater travel times in layer 3 by tracing flow lines upgradient from the creek, placing tic marks for every 10 years passage (Figure 22). The results indicated that groundwater in layer 3 within about 2 6 km (about mi) of the creek reached the creek within 10 years. Most of the groundwatershed comprised groundwater travel times of less than about years, and only the farthest tips of the groundwatershed had travel times approaching years. As these flow lines were traced along the bottom of the aquifer, they represented the deepest flow paths and originated at the farthest edges of the groundwatershed. Traces of shallower flow paths that originated (that is, infiltrated) closer to the creek generally had shorter flow paths and travel times. Although more work could be done to characterize infiltration and flow in shallower layers, these results implied that much of the groundwater reaching Valley Creek is less than about years old, and consequently could contain anthropogenic 23
26 tracers, such as nitrate and tritium. This conclusion was corroborated by findings that the creek receives nitrate-contaminated groundwater, especially in the South Branch (Almendinger and others, 1999), and by regional data bases that show nitrate in groundwater in the Valley Creek area (Washington County and Minnesota Dept. of Health, electronic communications, 1999). Samples of groundwater and stream water were collected in autumn 1999 for tritium analysis, and results will be discussed in a future report. SUMMARY AND CONCLUSIONS Valley Creek in southeastern Washington County, Minnesota, is one of the finest trout streams remaining in the Minneapolis-St. Paul metropolitan area. The watershed is presently mostly rural but faces potential urbanization in the coming decades. Trout streams are sensitive to land-use practices such as urbanization and agriculture that can degrade water quality. Urbanization can increase runoff from impervious surfaces and reduce groundwater discharge, thereby altering the temperature regime of streams. In particular, midwestern trout streams depend on strong groundwater discharge to provide relatively clean water that remains cool enough in summer to support trout. The purpose of this study was to describe the groundwater hydrology and to model the regional groundwater-flow system that delivers water to the creek. The groundwater hydrology of Valley Creek comprised local stream-groundwater interactions and regional groundwater flow. Local investigations indicated that approximately 85% of the baseflow of South Branch Valley Creek was fed by springs and seeps in the upper 0.75-km headwaters reach. All piezometers in this area had positive (upward) head gradients, indicating groundwater discharge into the stream channel. Nearly all the baseflow of North Branch Valley Creek appeared to derive from the outflow from Lake Edith, which was itself presumably fed by groundwater discharge. Piezometers along this branch had negative (downward) head gradients, indicating seepage of stream water out of the channel. Apparently, little groundwater discharge occurred in the North Branch below the lake outlet. In the main stem of Valley Creek, below the confluence of the North and South branches, a few springs and wetland seeps contributed groundwater, constituting about 11% of the baseflow at the mouth. Regional groundwater flow was inferred from contour maps of potentiometric surfaces (well-water levels) for the major aquifers in Washington County. The aquifers that may influence groundwater discharge to Valley Creek are the Quaternary (glacial drift) aquifer, the St. Peter aquifer, the Prairie-du-Chien/Jordan (PdC/J) aquifer, and the Franconia-Ironton-Galesville (FIG) aquifer. The mapped Quaternary groundwatershed was large, with an area of about 150 km 2 (58 mi 2 ) and nearly congruent with the boundary of the Valley Branch Watershed District, which extends to the north and west of Valley Creek. However, not all the water infiltrating within this area reaches the creek. Most apparently percolates into deeper bedrock aquifers, principally the PdC/J aquifer which directly underlies large portions of permeable glacial drift. Once in the PdC/J, some of this groundwater moves directly to either the St. Croix or Mississippi rivers, thereby circumventing Valley Creek. As the channel of Valley Creek lies mostly within the elevation of the PdC/J aquifer, the groundwatershed for this aquifer was considered the most important contributor of groundwater to the creek and occupied an 24
27 area of about km 2 (23 30 mi 2 ). This area was significantly larger than the surficial watershed (about 44 km 2, or 17 mi 2 ), which could help account for the abundant baseflow of Valley Creek. In addition, the FIG aquifer may also be an important source of groundwater to the creek, although data were too sparse to construct a groundwatershed for that aquifer. A regional analytic-element groundwater-flow model was constructed for the Valley Creek area with the MLAEM modeling program, based on regional template models developed by the Minnesota Pollution Control Agency and the South Washington Watershed District. The model had three layers, approximately representing the Quaternary (layer 1), the St. Peter (layer 2), and the PdC/J (layer 3) aquifers. The model was calibrated to measured baseflows in selected reaches of Valley Creek and to measured groundwater levels as generalized by the maps of potentiometric surfaces discussed above. Model results indicated that the layer 3 groundwatershed covered about 60 km 2 and corresponded closely in size, shape, and position to that mapped for the Prairie du Chien aquifer. Groundwater travel times (the time it takes groundwater to reach the creek) over most of the groundwatershed were about years, but ranged from about 10 years within 2 6 km of the creek to about years at the farthest boundaries of the groundwatershed. Because the groundwater reaching Valley Creek is apparently relatively young, perhaps only years old since the time of infiltration, it may contain anthropogenic tracers and pollutants, such as nitrates. Indeed, other work has confirmed the discharge of nitrate-contaminated groundwater into Valley Creek, particularly the South Branch (Almendinger and others, 1999). While these nitrates may not apparently directly harm trout, they do increase nutrient loading to the St. Croix River, a designated National Scenic Riverway. In addition, because the creek is already well-fertilized with nitrates, any addition of other nutrients, particularly phosphorus, could spur detrimental growth of algae and other aquatic vegetation. Phosphorus is commonly adsorbed to fine particles which can be eroded from the landscape and carried to the creek by overland runoff. Subsequent sedimentation (siltation) of these particles can furthermore physically degrade spawning habitat for trout and reduce their macroinvertebrate food source. For these reasons, erosion should be minimized to the extent possible. Valley Creek has remained a fine trout stream probably because of its large baseflow component, which is derived over a relatively large groundwatershed. A large baseflow seems critical in giving the creek resilience to short-term disturbances. Extreme floods or siltation events can degrade habitat and reduce trout populations (Elwood and Waters, 1969). However, a strong baseflow can promote recovery of the stream to predisturbance conditions by helping to wash away the dissolved and particulate inputs from such disturbances. Urbanization has been documented to reduce baseflows (Simmons and Reynolds, 1982). Because the groundwatershed of Valley Creek extends to the north and west beyond the City of Afton into rapidly urbanizing areas, care should be taken to minimize practices that reduce infiltration in these areas. In short, maintaining the quantity of groundwater discharge to Valley Creek will be a key factor in keeping it a healthy trout stream and allowing it to recover from potential impacts, should they occur. 25
28 CREDITS SEG compiled the available regional groundwater data, mapped the potentiometric surfaces, and constructed the groundwater model; he produced all the figures pertaining to these topics and wrote the sections on Model Construction and Model Calibration. JEA compiled the local stream-groundwater interaction data and baseflow data, produced the figures and tables pertaining to these topics, synthesized the report data, and wrote all other sections of the report. ACKNOWLEDGMENTS Major funding for this project was approved by the Minnesota Legislature, ML 1997, Chapter 216, Sec. 15, Subd. 13(b) as recommended by the Legislative Commission on Minnesota Resources from the Minnesota Future Resources Fund. The City of Afton provided additional funding for mapping the potentiometric surfaces in the Valley Creek area. The regional framework for the groundwater model was developed at the Minnesota Pollution Control Agency with major funding approved by the Minnesota Legislature, ML 1997, Chapter 216, Sec. 15, Subd. 10 (b) as recommended by the Legislative Commission on Minnesota Resources from the Minnesota Environment and Natural Resources Trust Fund. Information from Steve Robertson at the Minnesota Department of Health was useful in summarizing the conceptual model of groundwater flow. REFERENCES Almendinger, J.E., Schottler, S.P., and Thommes, K.E., 1999, Monitoring and Modeling Valley Creek Watershed: 3. Surface-Water Hydrology. Report to the Legislative Commission on Minnesota Resources: St. Croix Watershed Research Station, Science Museum of Minnesota. Booth, D.B., and Jackson, C.R., 1997, Urbanization of aquatic systems: degradation thresholds, stormwater detection, and the limits of mitigation: Journal of the American Water Resources Association, v. 33, no. 6, p Elwood, J.W., and Waters, T.F., 1969, Effects of floods on food consumption and production rates of a stream brook trout population: Transactions of the American Fisheries Society, v. 98, p As cited in Waters Hicks, B.J., Hall, J.D., Bisson, P.A., and Sedell, J.R., 1991, Responses of salmonids to habitat changes: American Fisheries Society Special Publication, v. 19, p Kanivetsky, R., and Cleland, J.M., 1990, Hydrogeology. Plate 5 of Swanson, L., and Meyer, G. N. (eds) Geologic Atlas of Washington County. Atlas C-5, County Atlas Series, scale 1:100,000. Kemp, S.J., and Spotila, J.R., 1997, Effects of urbanization on brown trout Salmo trutta, other fishes and macroinvertebrates in Valley Creek, Valley Forge, Pennsylvania: American Midland Naturalist, v. 138, no. 1, p
29 Meyer, G.N., Baker, R.W., and Patterson, C.J., 1990, Surficial Geology. Plate 3 of Swanson, L., and Meyer, G. N., eds., Geologic Atlas of Washington County. Atlas C-5, County Atlas Series, scale 1:100,000. Modica, E., Buxton, H.T., and Plummer, L.N., 1998, Evaluating the source and residence times of groundwater seepage to streams, New Jersey Coastal Plain: Water Resources Research, v. 34, no. 11, p Mossler, J.H., and Bloomgren, B.A., 1990, Bedrock Geology. Plate 2 of Swanson, L., and Meyer, G. N., eds., Geologic Atlas of Washington County. Atlas C-5, County Atlas Series, scale 1:100,000. MPCA (Minnesota Pollution Control Agency), 1997, Interim Progress Report--Twin Cities Metropolitan Groundwater Model: Minnesota Pollution Control Agency, St. Paul, MN, 47 p. Pitt, D.G., and Whited, D.C., 1999, Monitoring and Modeling Valley Creek Watershed: 4. Atlas of Physiography, Hydrology, and Land Use. Report to the Legislative Commission on Minnesota Resources: University of Minnesota Dept. of Landscape Architecture, for the St. Croix Watershed Research Station, Science Museum of Minnesota, 62 p. Richards, C., and Host, G., 1994, Examining land use influences on stream habitats and macroinvertebrates: a GIS approach: Water Resources Bulletin, v. 30, no. 4, p Schueler, T., 1994, The importance of imperviousness: Watershed Protection Techniques, v. 1, no. 3, p Simmons, D., and Reynolds, R., 1982, Effects of urbanization on baseflow of selected south-shore streams, Long island, NY: Water Resources Bulletin, v. 18, no. 5, p Spahr, N.E., and Wynn, K.H., 1997, Nitrogen and phosphorus in surface waters of the upper Colorado River Basin: Journal of the American Water Resources Association, v. 33, no. 3, p Strack Consulting, I., 1997, MLAEM-Multilayer Analytic Element Model (5.02 ed.): North Oaks, MN, Strack Consulting, Inc. Strack, O.D.L., 1989, Groundwater Mechanics: Englewood Cliffs, NJ, Prentice Hall, 732 p. Wahl, M.H., McKellar, H.N., and Williams, T.M., 1997, Patterns of nutrient loading in forested and urbanized coastal streams: Journal of Experimental Marine Biology and Ecology, v. 213, no. 1, p Waters, T.F., 1983, Replacement of brook trout by brown trout over 15 years in a Minnesota stream: production and abundance: Transactions of the American Fisheries Society, v. 112, no. 2A, p Waters, T.F., 1995, Sediment in Streams: Sources, Biological Effects, and Control. American Fisheries Society Monograph 7: Bethesda, Maryland, American Fisheries Society, 251 p. 27
30 Winter, T.C., 1988, A conceptual framework for assessing cumulative impacts on the hydrology of nontidal wetlands: Environmental Management, v. 12, no. 5, p
31 TABLES Table 1 Table 2 Baseflow estimates for selected reaches of Valley Creek and other small streams tributary to the west side of the lower St. Croix River, Measured baseflow and calculated groundwater discharges in selected stream reaches along Valley Creek 29
32 Table 1. Baseflow estimates for selected reaches of Valley Creek and other small streams tributary to the west side of the lower St. Croix River, Stream a Location Year Flow (m 3 s -1 ) Method Little Carnelian Lake outlet hydrograph separation outlet b Silver Creek outlet single measurement, February 1999 Browns Creek c outlet judgment based on measurements at site Second St. Park, Stillwater Headwaters, North Branch Valley Creek d North Branch Valley Creek Headwaters, South Branch Valley Creek South Branch Valley Creek Valley Creek main stem Creek in Kells Coulier, Afton near mouth single measurement, February 1999 outlet from Lake Edith above confluence with South Branch above confluence with West Branch above confluence with North Branch single culvert-flow calculation, Oct median (n = 22) single measurement, June near mouth near mouth 1999 about median (n = 24) 0.55 median (n = 23) visual estimate, February 1999 Trout Brook mouth single measurement, February 1999 Notes: a Streams arranged approximately from north to south. All measurements by St. Croix Watershed Research Station, except as noted below. b Data from Metropolitan Council and Carnelian-Marine Watershed District (Dan Fabian, TKDA Associates, personal communication). c Estimate from Metropolitan Council and Browns Creek Watershed District (Mark Doneux, Washington County Soil and Water Conservation District, personal communication). d Culvert-flow estimate from Valley Branch Watershed District (John Hansen, Barr Engineering, personal communication). 30
33 Table 2. Measured baseflow and calculated groundwater discharges in selected stream reaches along Valley Creek Stream Reach (length) Headwaters (first 0.75 km) Headwaters to confluence (next 2.4 km) Measured Baseflow (cms) Measured Baseflow (cmd) SOUTH BRANCH VALLEY CREEK Modeled Groundwater Discharge (cmd) Percent Error ,872 12,024-39% ,456 11, % Total (3.15 km) ,328 23,996 +3% Headwaters (Lake Edith outlet) Headwaters to confluence (next 2.22 km) NORTH BRANCH VALLEY CREEK Approx ,144 15,127-17% Approx , % Total (2.22 km) Approx ,008 16,128-15% Confluence to mouth (2.45 km) Headwaters to mouth (7.82 km) MAIN STEM VALLEY CREEK ,184 12, % VALLEY CREEK (ENTIRE) ,520 52, % Notes: Lengths are approximate valley lengths, measured along axis of valley and not along stream channel. See Table 1 for data sources of measured baseflows. Positive errors mean that the model overestimated baseflow, and negative errors mean that the model underestimated baseflow. Because errors are calculated as a percentage of measured baseflow, small measured baseflows magnify percentage errors. 31
34 FIGURES Figure 1 Figure 2 Figure 3 Figure 4 Figure 5 Figure 6 Figure 7 Figure 8 Figure 9 Figure 10 Figure 11 Figure 12 Figure 13 Figure 14 Figure 15 Valley Creek Watershed, stream gauging stations, and points of local stream-groundwater interaction Local stream-groundwater interactions Generalized hydrogeologic column of regional aquifers and confining units in Washington County Observed groundwater elevations: Water-table wells and surface water Observed groundwater elevations: St. Peter aquifer Observed groundwater elevations: Prairie du Chien aquifer Observed groundwater elevations: Jordan aquifer Observed groundwater elevations: Franconia aquifer Observed groundwater elevations: Ironton-Galesville aquifer Observed groundwater elevations: Mount Simon aquifer Bedrock geology and model domain Bedrock and inhomogeneity polygons Model layers and generalized geologic cross-section through southern Washington County Cross section locations (a) Cross section A A along Valley Creek channel; (b) Cross section B B across Valley Creek channel Figure 16 Intersection of model layers and surface topography Figure 17 Rainfall polygons Figure 18 Surface-water polygons and curvilinear elements Figure 19 Model groundwater elevations, Layer 1 Figure 20 Model groundwater elevations, Layer 2 Figure 21 Model groundwater elevations, Layer 3 Figure 22 Modeled groundwater flow paths, travel times, and groundwatershed, Layer 3 32
35 marsh - Lake Edith Nor th Branch - 2 West Branch 3 s s + s s + s 4 South Branch reservoir 1 s + s Valley Creek Main Stem s - 5 N Anoka Washington Hennepin Ramsey Carver MILE Scott Dakota KILOMETER EXPLANATION Approximate location of Valley Creek watershed in Twin Cities metropolitan area Stream gauging stations on Valley Creek s Spring + Piezometer with positive head (groundwater seeping into stream) - Piezometer with negative head (water seeping out of stream) Figure 1. Valley Creek Watershed, stream gauging stations, and points of local stream-groundwater interaction
36 (a) Influent groundwater: piezometer water level above stream level (b) Effluent stream water: piezometer water level below stream level water table younger water water table Cross section older water Cross section (c) Influence of change in stream gradient on gaining and losing reaches (d) Perched stream: piezometer dry gaining losing gaining water table in adjacent aquifer Longitudinal section stream profile Cross section leakage water table Figure 2. Local stream-groundwater interactions
37 GEOLOGIC TIME LITHOLOGY THICK- NESS HYDROGEOLOGY NAME AND DESCRIPTION CENEZOIC QUATER- NARY 0 to 100 m AQUIFER PARTIALLY CONFINING PATCHES GLACIAL DRIFT Mosaic of sand and gravel outwash and sandy till, often interbedded. Occasional dense clayey till patches at depth. Present throughout county, except in southeast. ORDOVICIAN 10 m 45 to 50 m 40 to 60 m CONFINING UNIT AQUIFER PARTIALLY CONFINING AQUIFER PLATTEVILLE-GLENWOOD FORMATION Limestone over shale. Mostly absent in county; patchy distribution. ST. PETER SANDSTONE Sandstone, with basal siltstone and shale in places. Patchy distribution. PRAIRIE DU CHIEN GROUP Dolostone. Generally present throughout county, except in far northwest and bedrock valleys. P A L E O Z O I C CAMBRIAN 20 to 30 m 10 to 20 m 50 m 15 m 20 to 35 m AQUIFER CONFINING UNIT AQUIFER PARTIALLY CONFINING AQUIFER CONFINING UNIT JORDAN SANDSTONE Sandstone. Generally present throughout county, except in far northwest and bedrock valleys. ST. LAWRENCE FORMATION Shale and siltstone. Generally present throughout county, except in deep bedrock valleys FRANCONIA FORMATION Glaconitic sandstone; shaley at base. Generally present throughout county, except in deep bedrock valleys IRONTON-GALESVILLE SANDSTONES Sandstone. Generally present throughout county. EAU CLAIRE FORMATION Shale and siltstone. Generally present throughout county. 50 to 80 m AQUIFER MOUNT SIMON SANDSTONE Sandstone. Generally present throughout county. PROTER- OZOIC CONFINING UNIT UNDIFFERENTIATED UNITS Shales of Solor Church formation and older igneous rocks. Present throughout county. Figure 3. Generalized hydrogeologic column of regional aquifers and confining units in Washington County (modified from Mossler and Bloomgren 1990; thickness rounded to nearest 5 m)

38
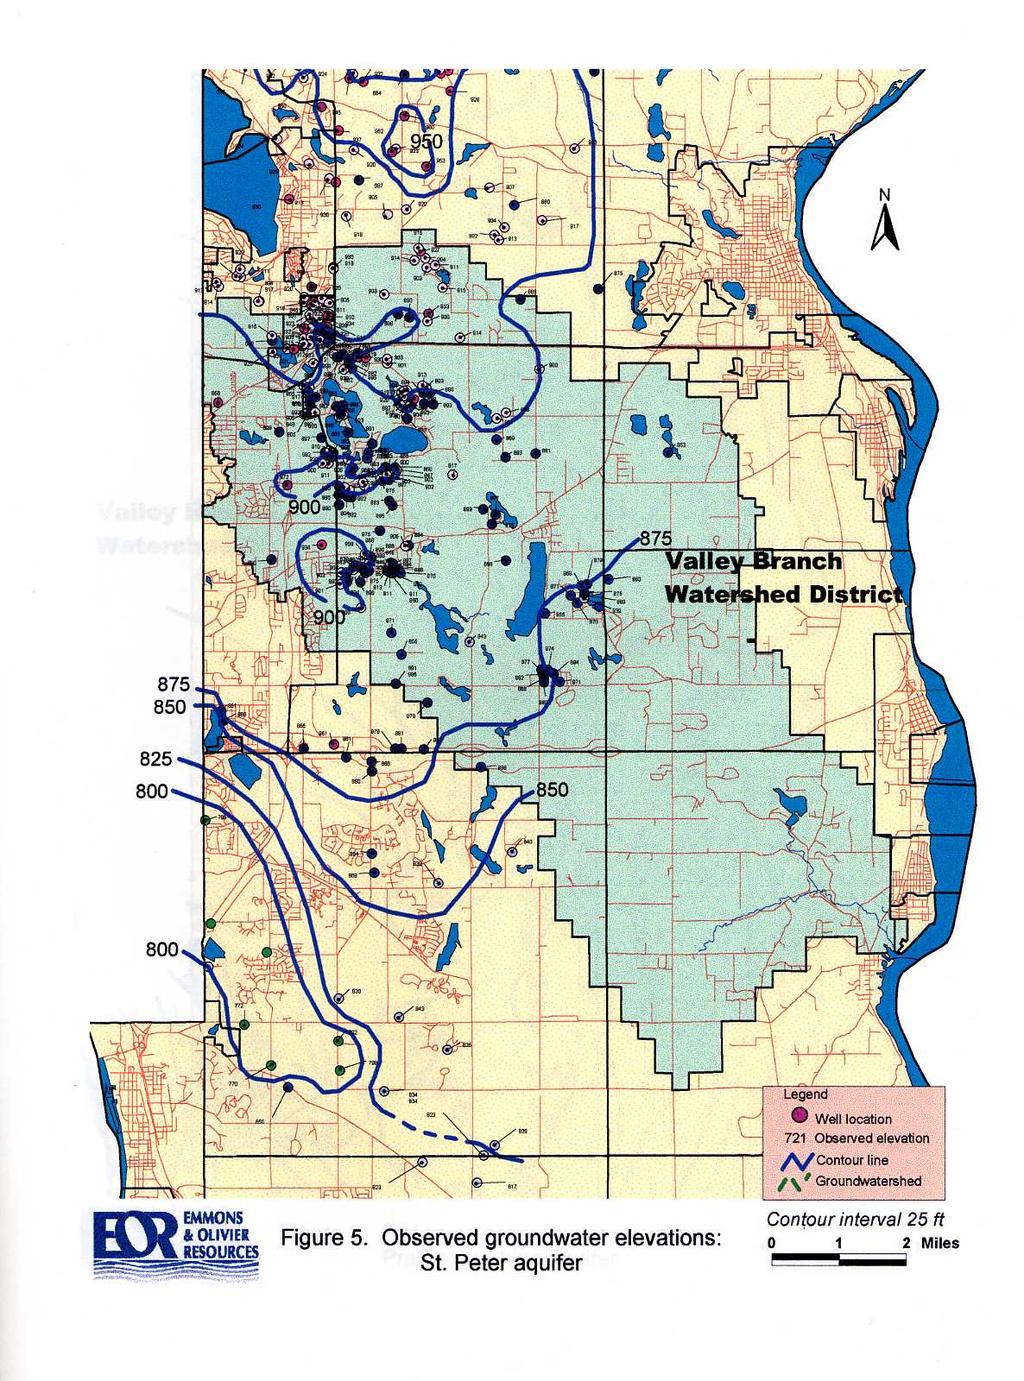
39
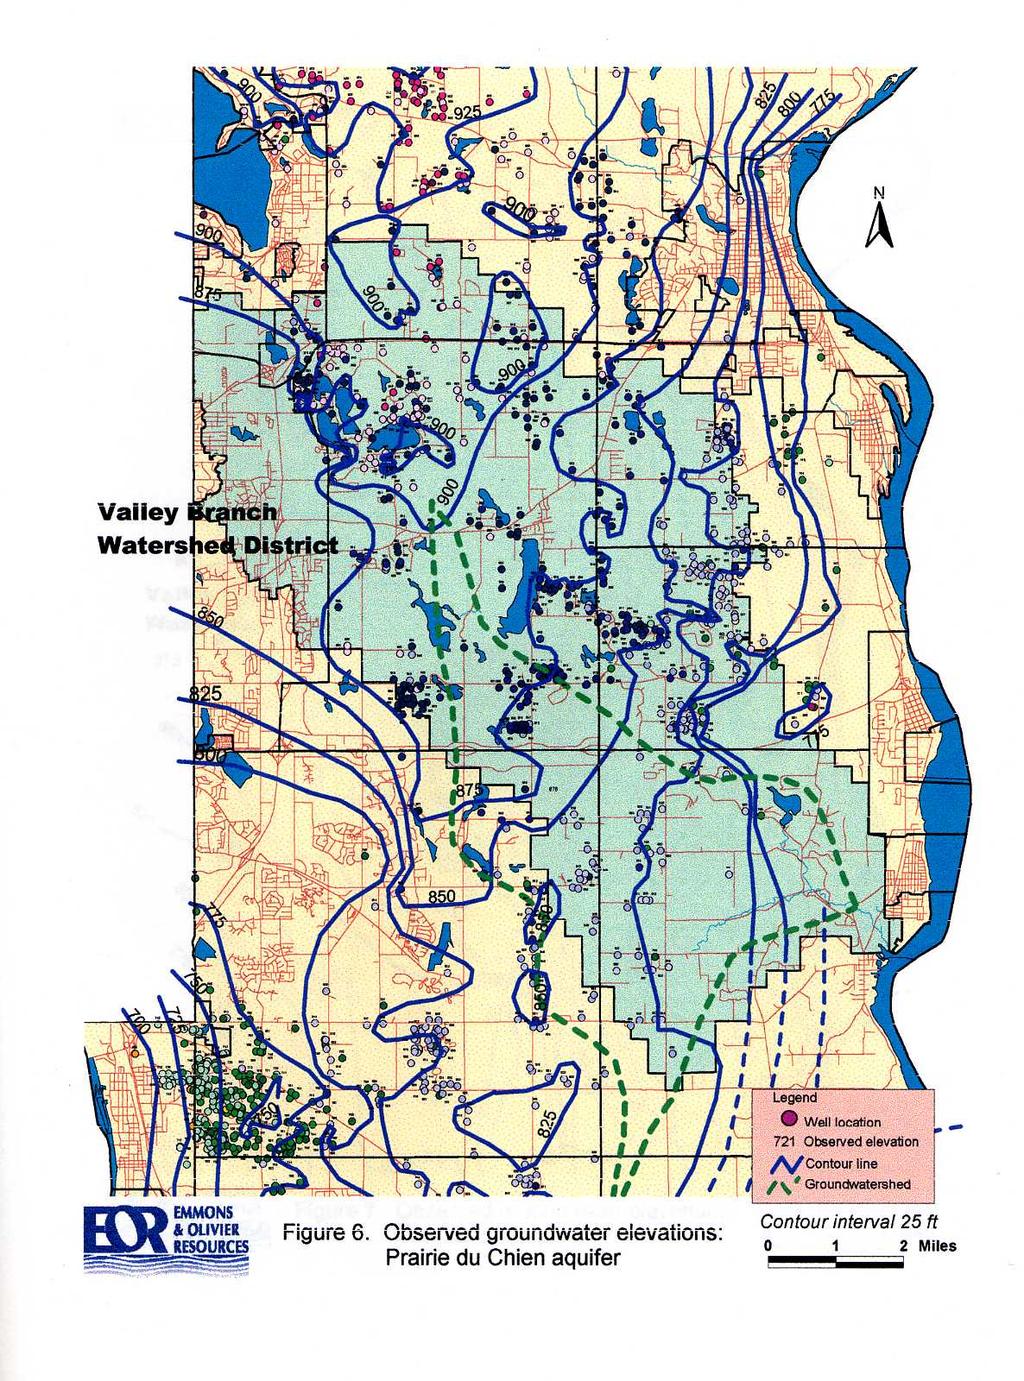
40
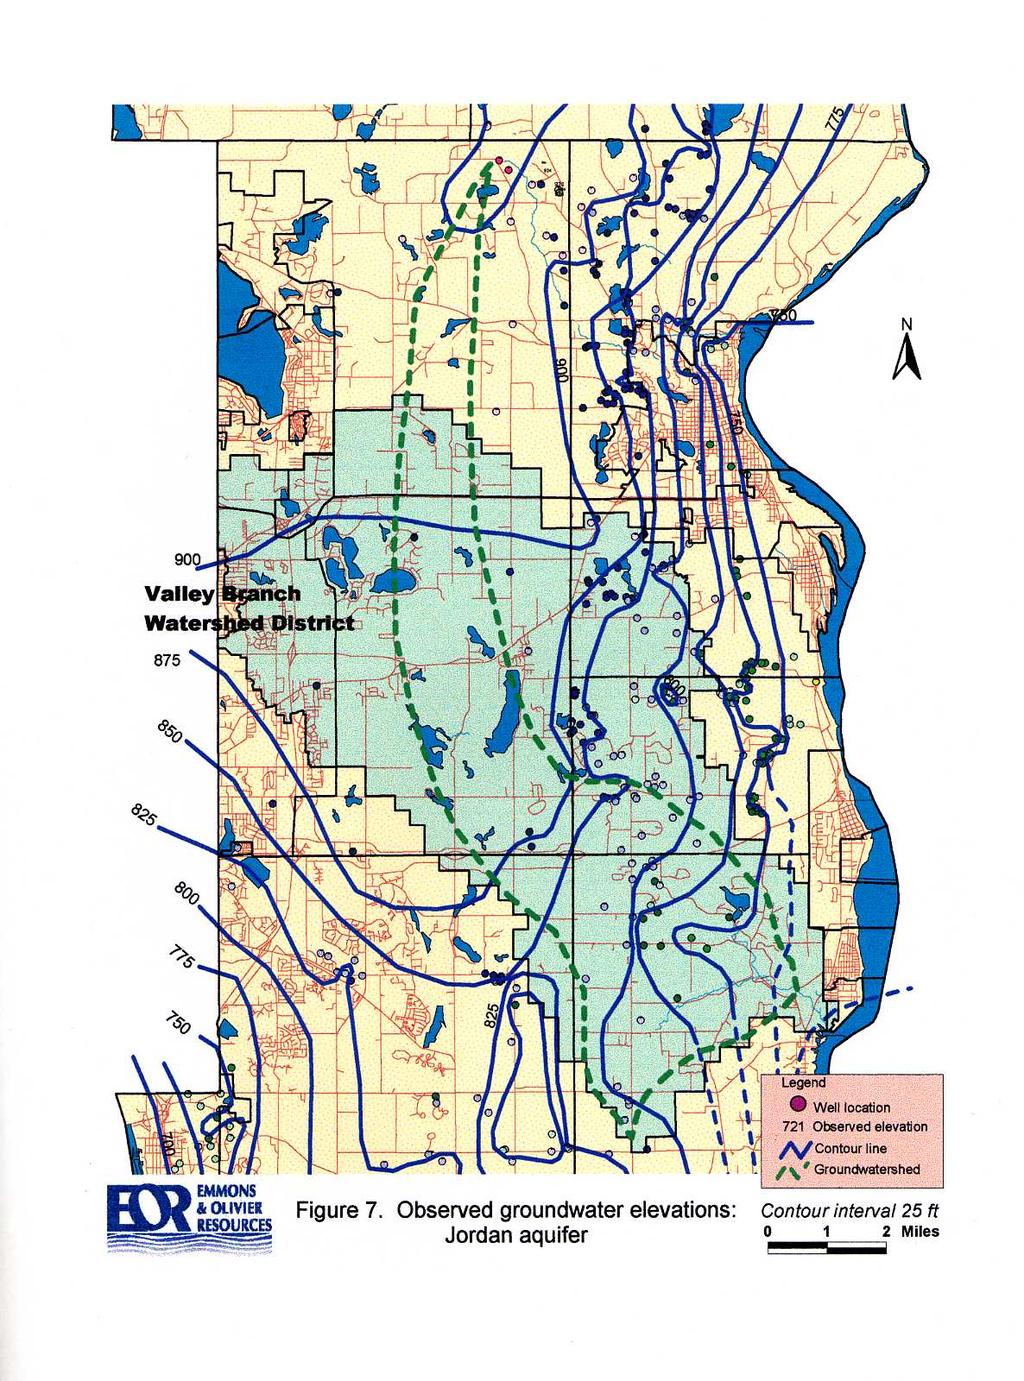
41
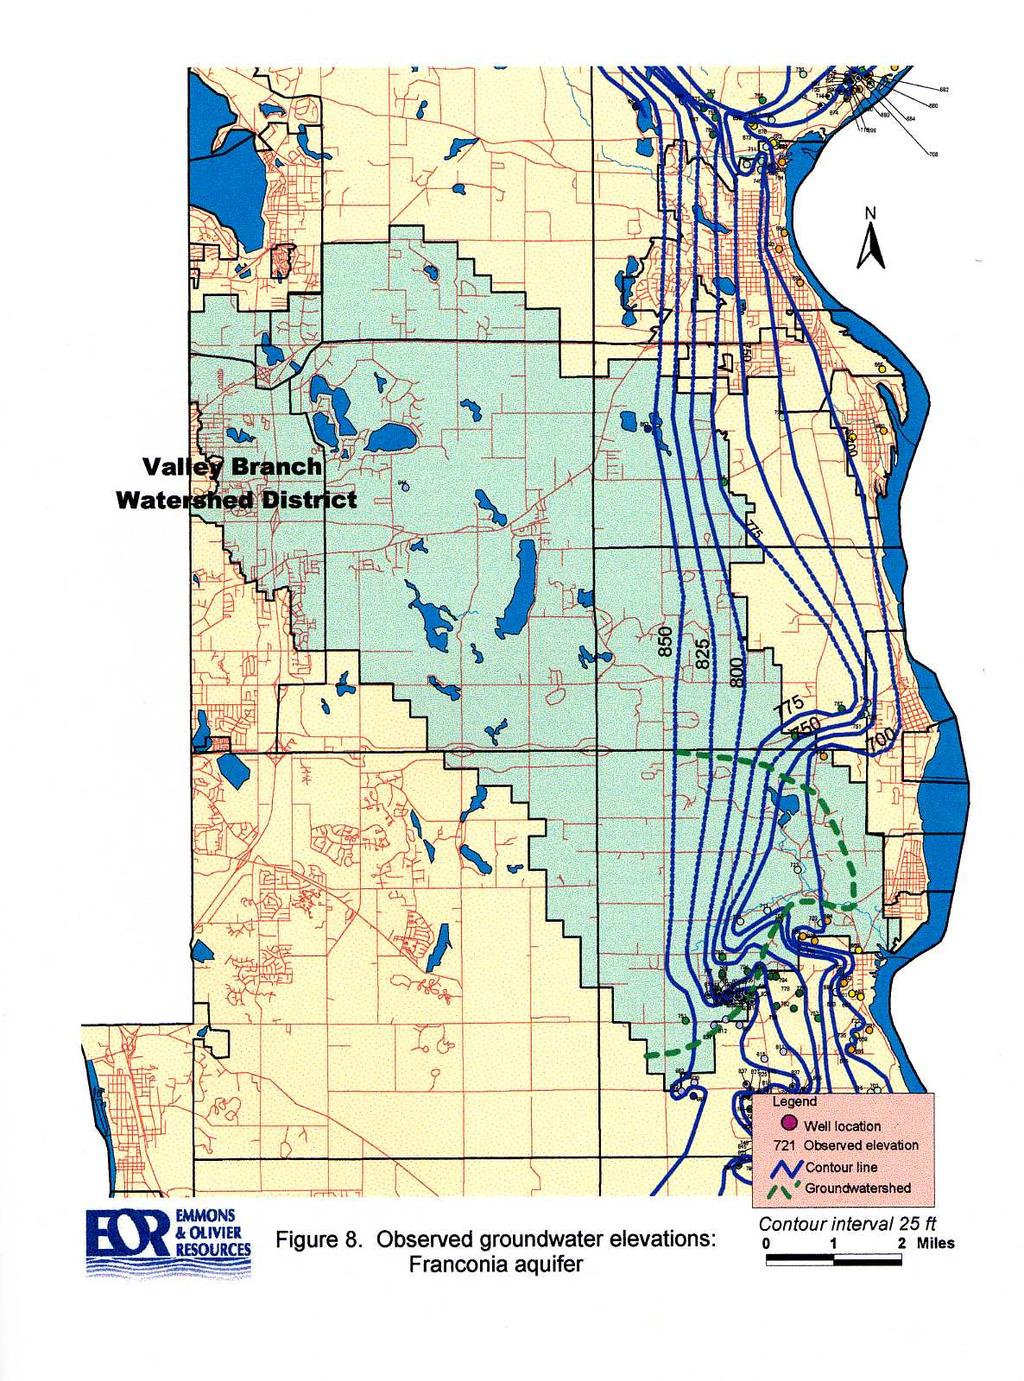
42
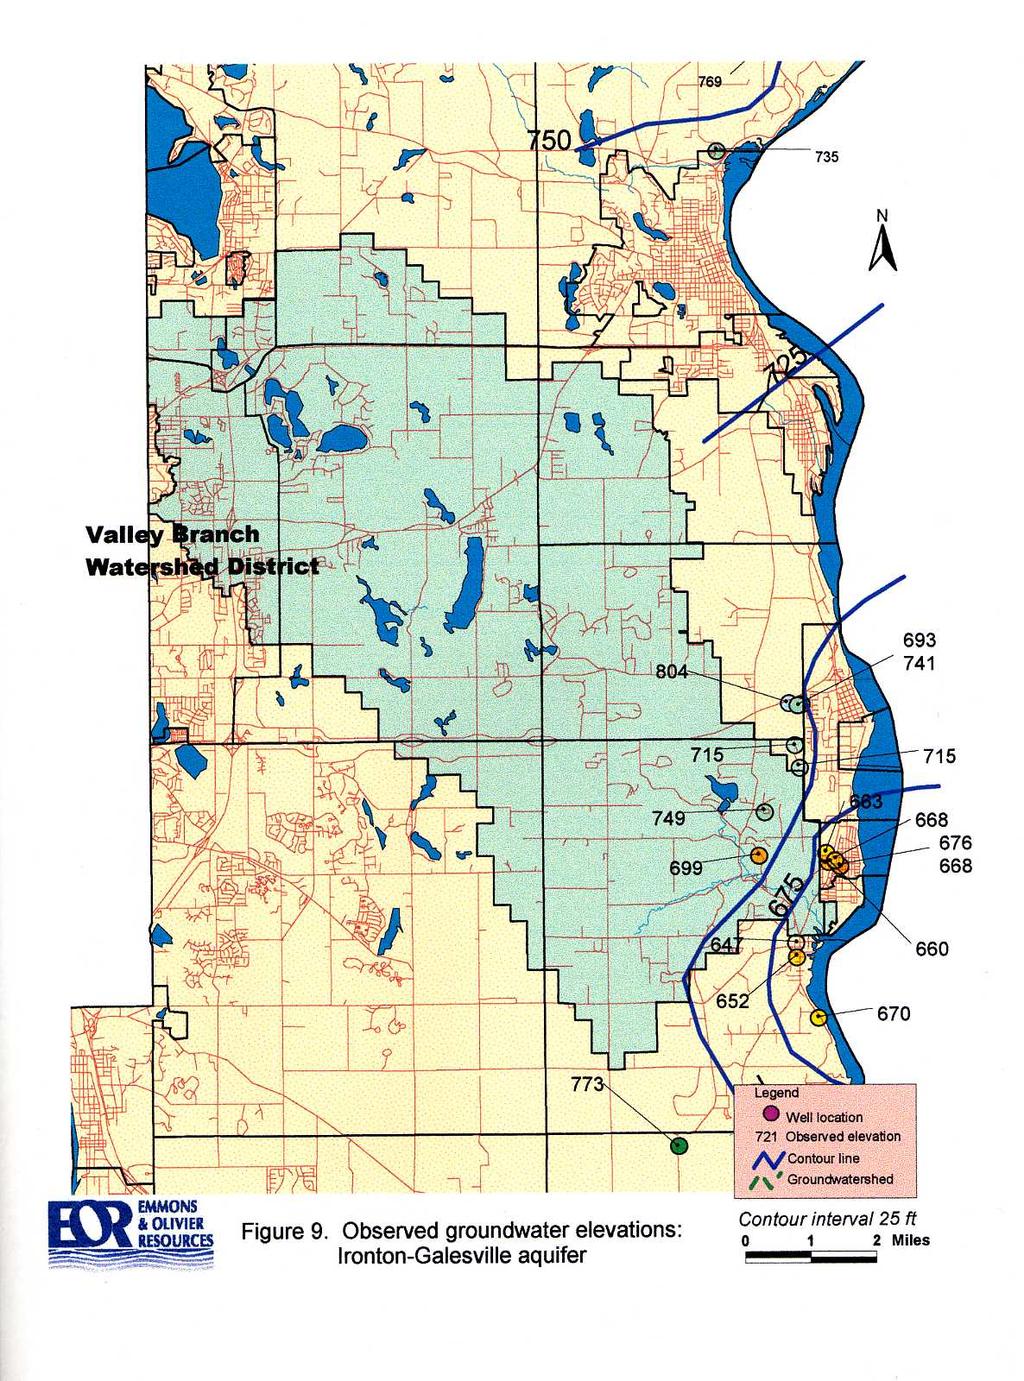
43
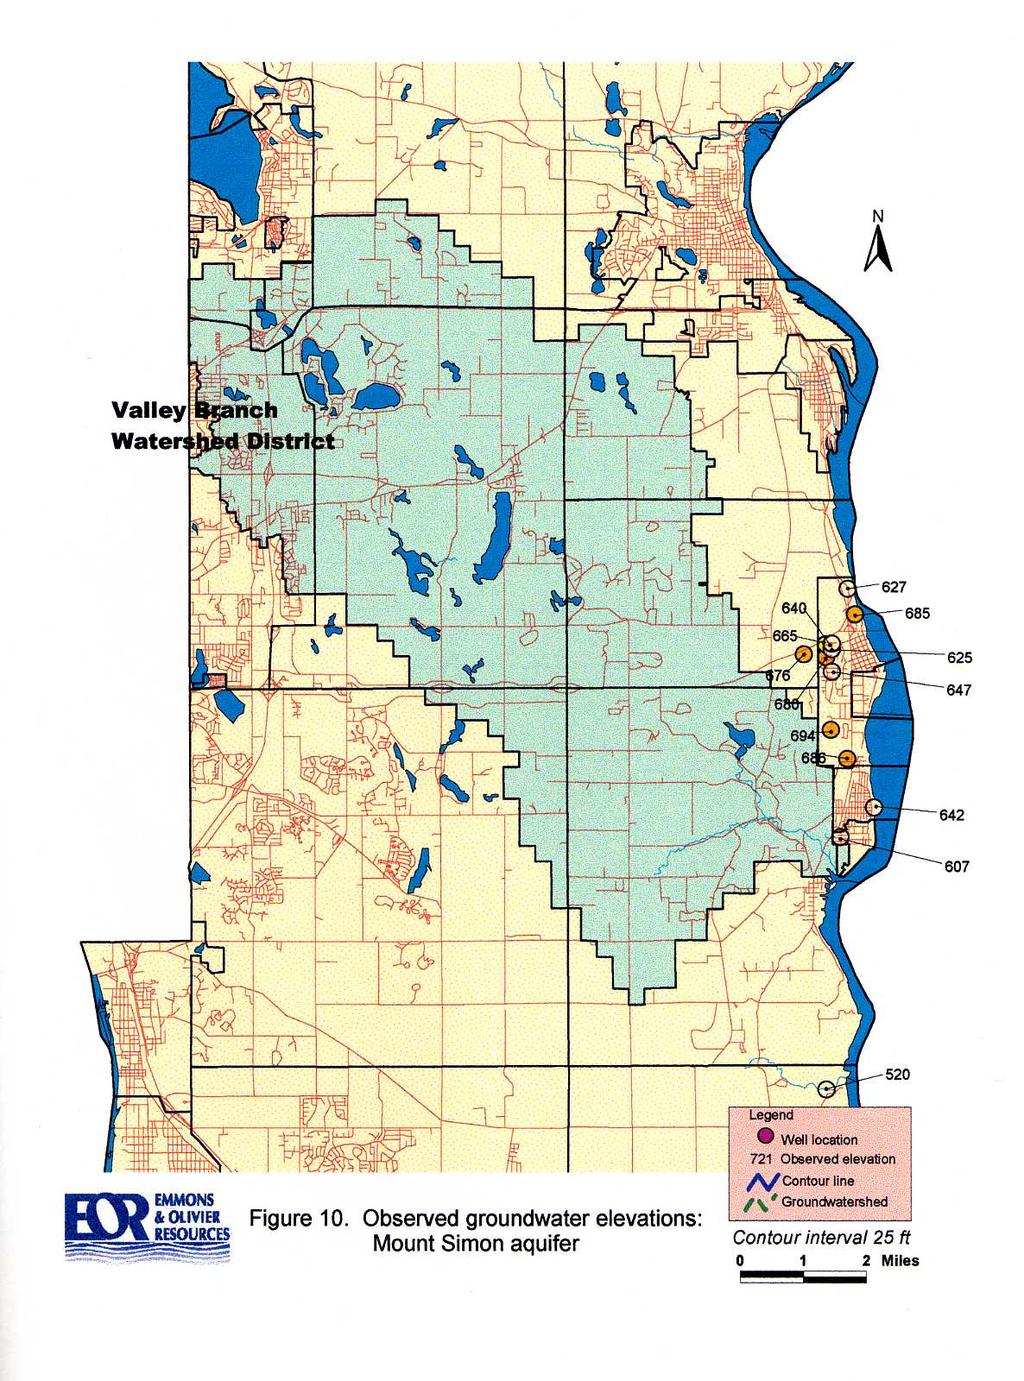
44
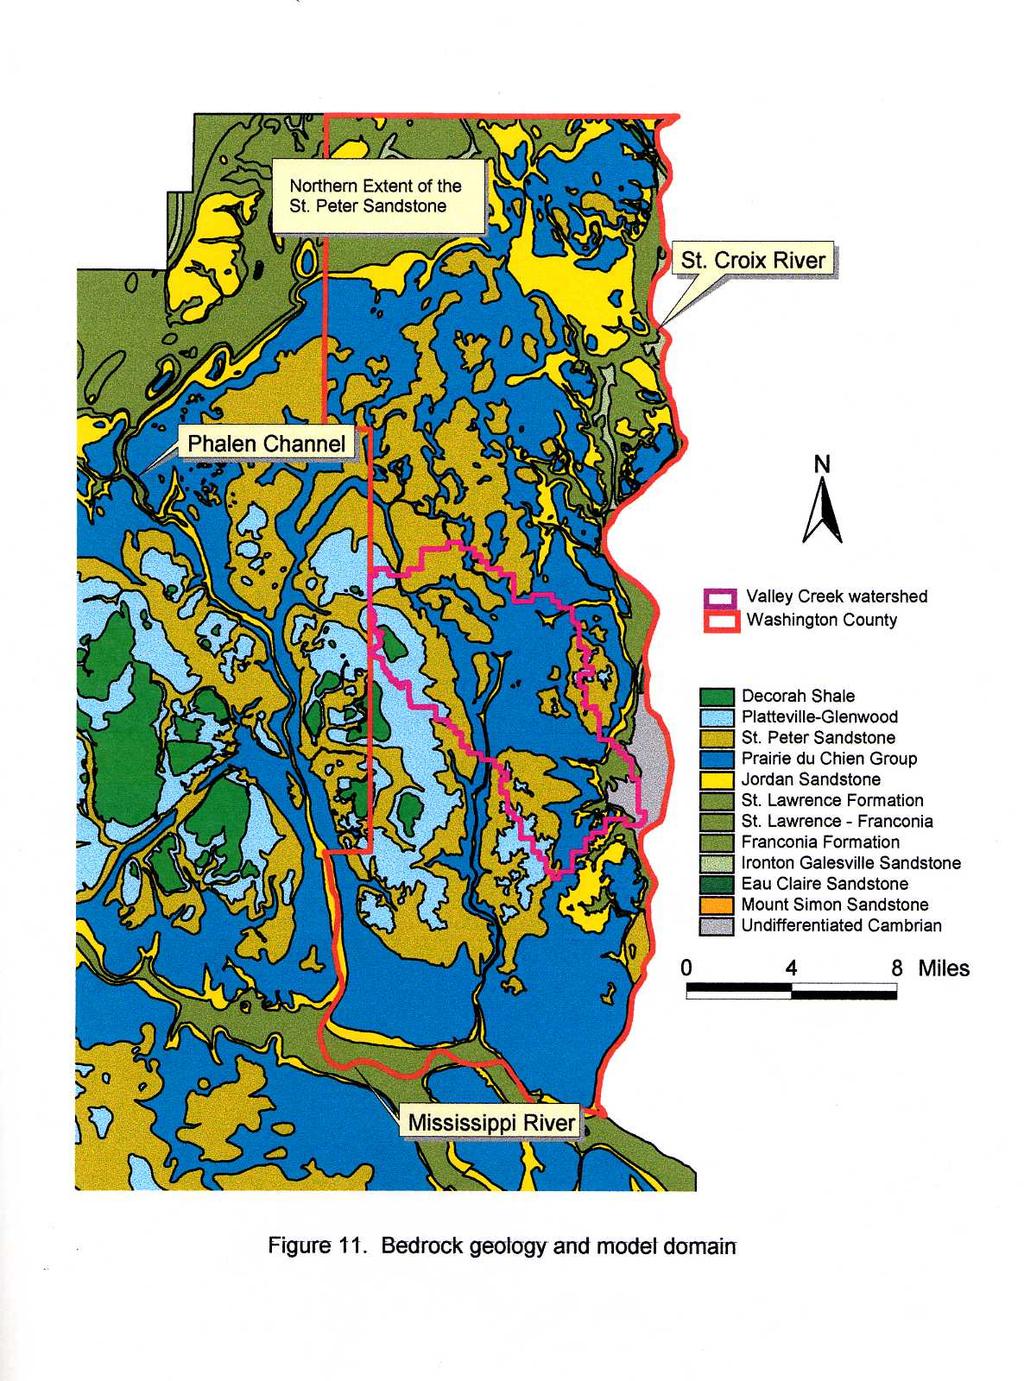
45
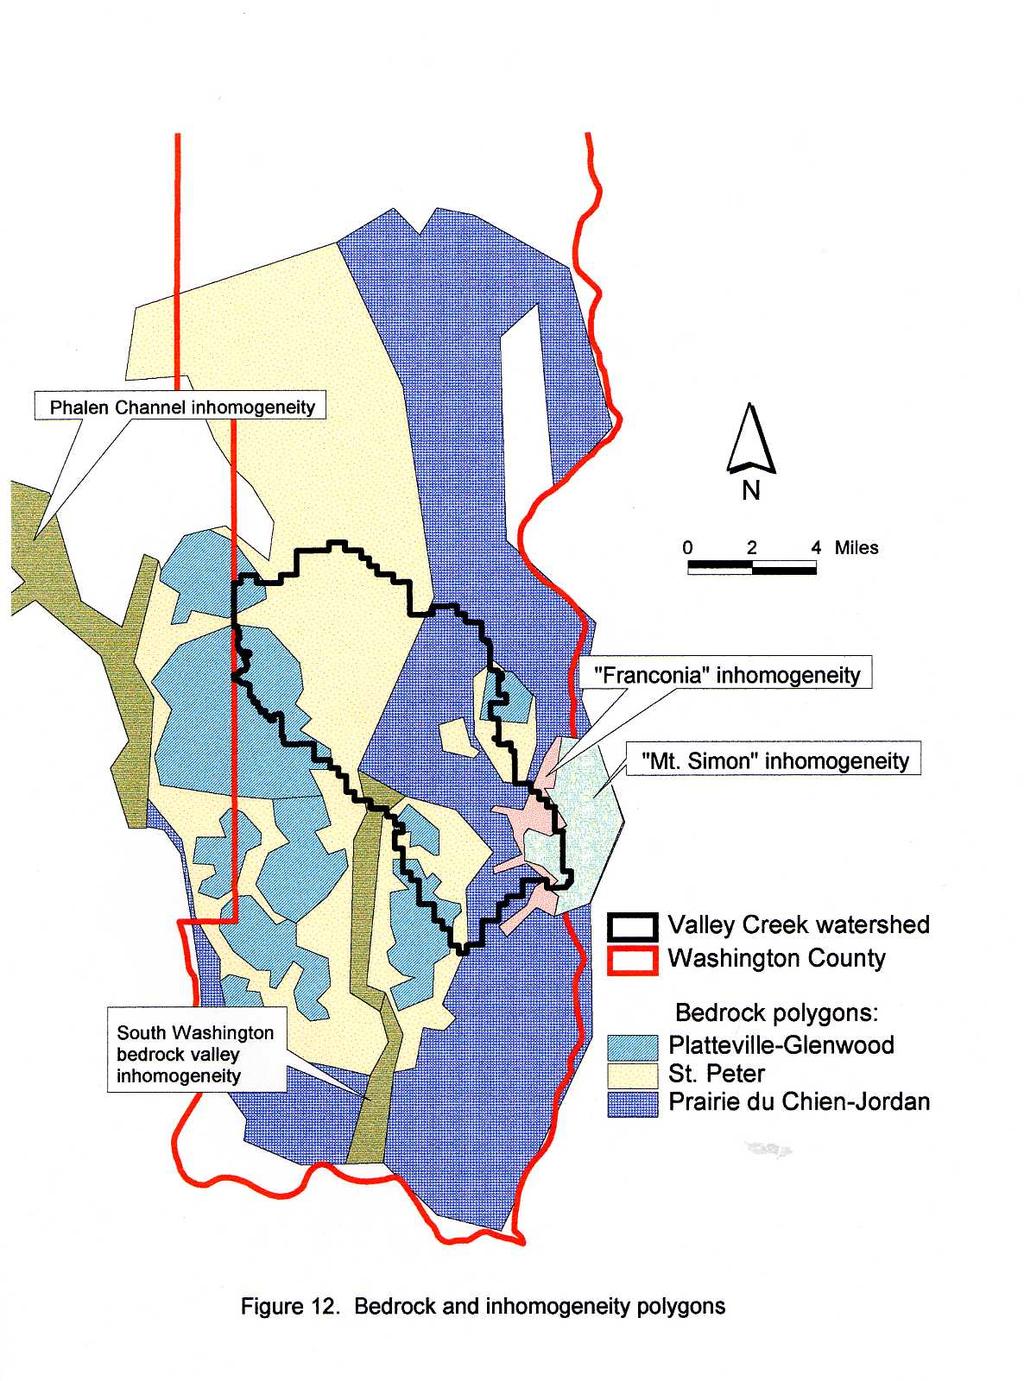
46
47 1,148 AQUIFER (approximate) MODEL LAYER 350 Quaternary K 1 = 30 M/DAY K 1 = 30 M/DAY Layer 1 K 1 = 30 M/DAY 984 ALTITUDE (FT) St. Peter 791 Prairie du Chien 722 Jordan Land Surface Water Table C 110,000 DAY K 2 = 3.3 M/DAY C 20,000 DAY K 3 = 12 M/DAY BEDROCK VALLEY C 5,000 DAY K 1 = 30 M/DAY C 20,000 DAY C 110,000 DAY K 2 = 3.3 M/DAY C 20,000 DAY K 3 = 12 M/DAY Layer 2 Layer ALTITUDE (M) Mississippi River K C K 3 = 12 M/DAY EXPLANATION Model layer dry Model layer saturated Hydraulic conductivity, in m/day Hydraulic resistance, in days St. Croix River 200 Figure 13. Model layers and generalized geologic cross-section through southern Washington County
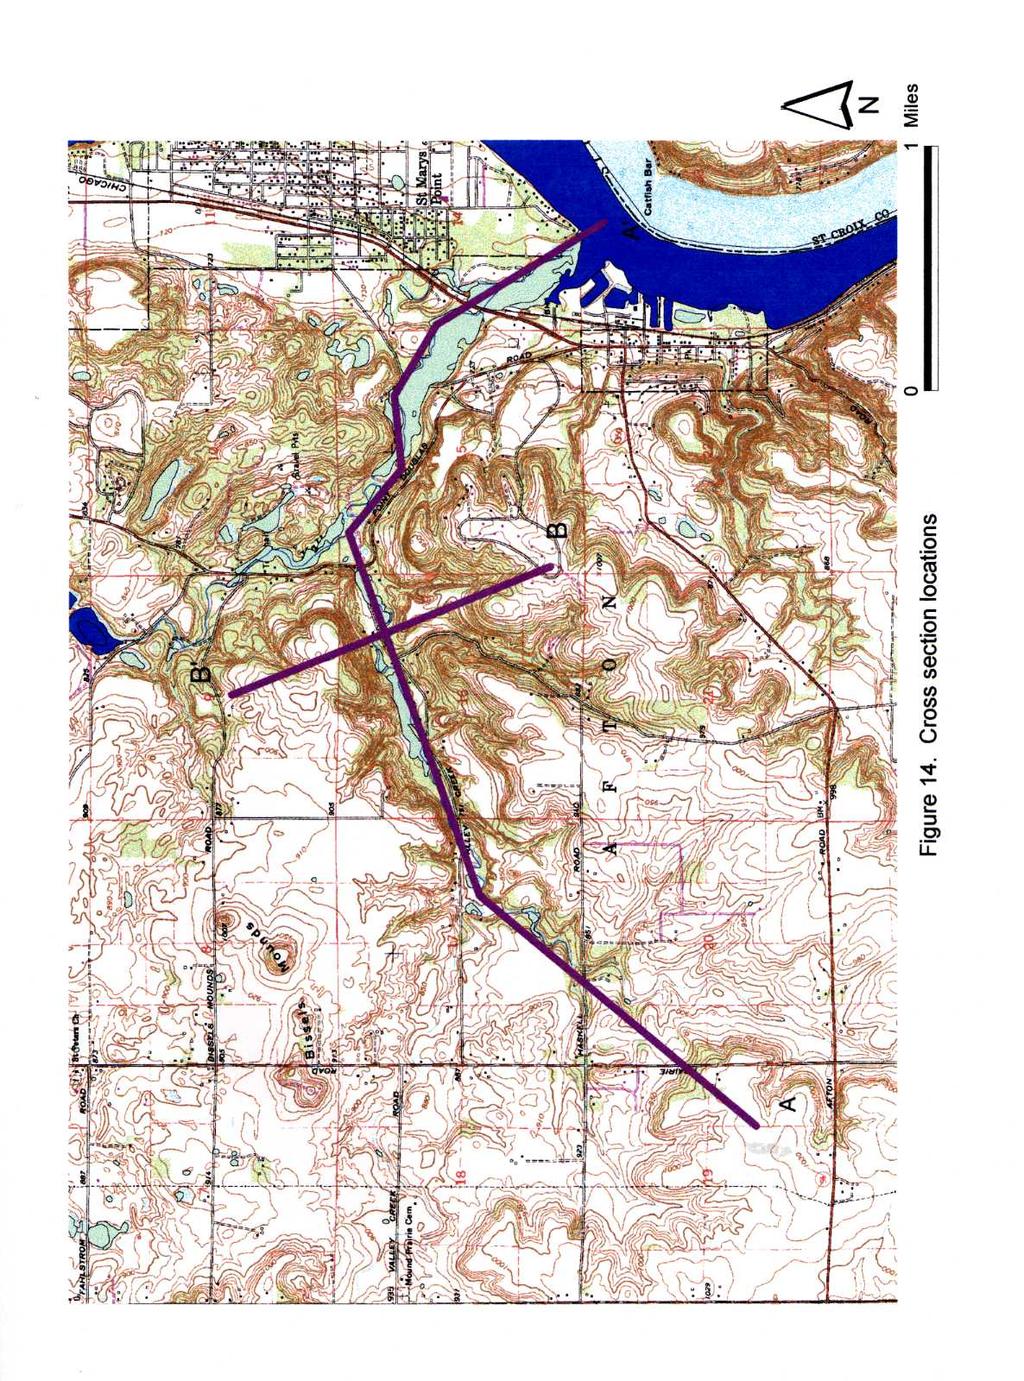
48
49 ALTITUDE (FT) 600 A A' B B' (a) St. Peter Sandstone OSTP Platteville-Glenwood Formation OPGW Prairie du Chien Group OPDC Jordan Sandstone CJDN Start of perennial stream 1 2 EXPLANATION 1 MODEL LAYER 1 2 MODEL LAYER 2 3 MODEL LAYER 3 4 INHOMOGENEITY "FRANCONIA" 5 INHOMOGENEITY "MT SIMON" Quaternary Deposits (glacial drift) St. Croix River ALTITUDE (M) 183 (b) OPDC CJDN CSF (St. L) 1 2 Valley Creek CSF (Fran) Q OPDC CJDN ALTITUDE (FT) St. Lawrence and Franconia Formations CSF Ironton-Galesville Sandstones CIGL 152 CIGL CECF 400 Eau Claire Formation CECF DISTANCE (M) DISTANCE (M) Figure 15. (a) Cross section A-A' along Valley Creek channel; (b) Cross section B-B' across Valley Creek channel (see Figure 14 for cross-section locations) 300
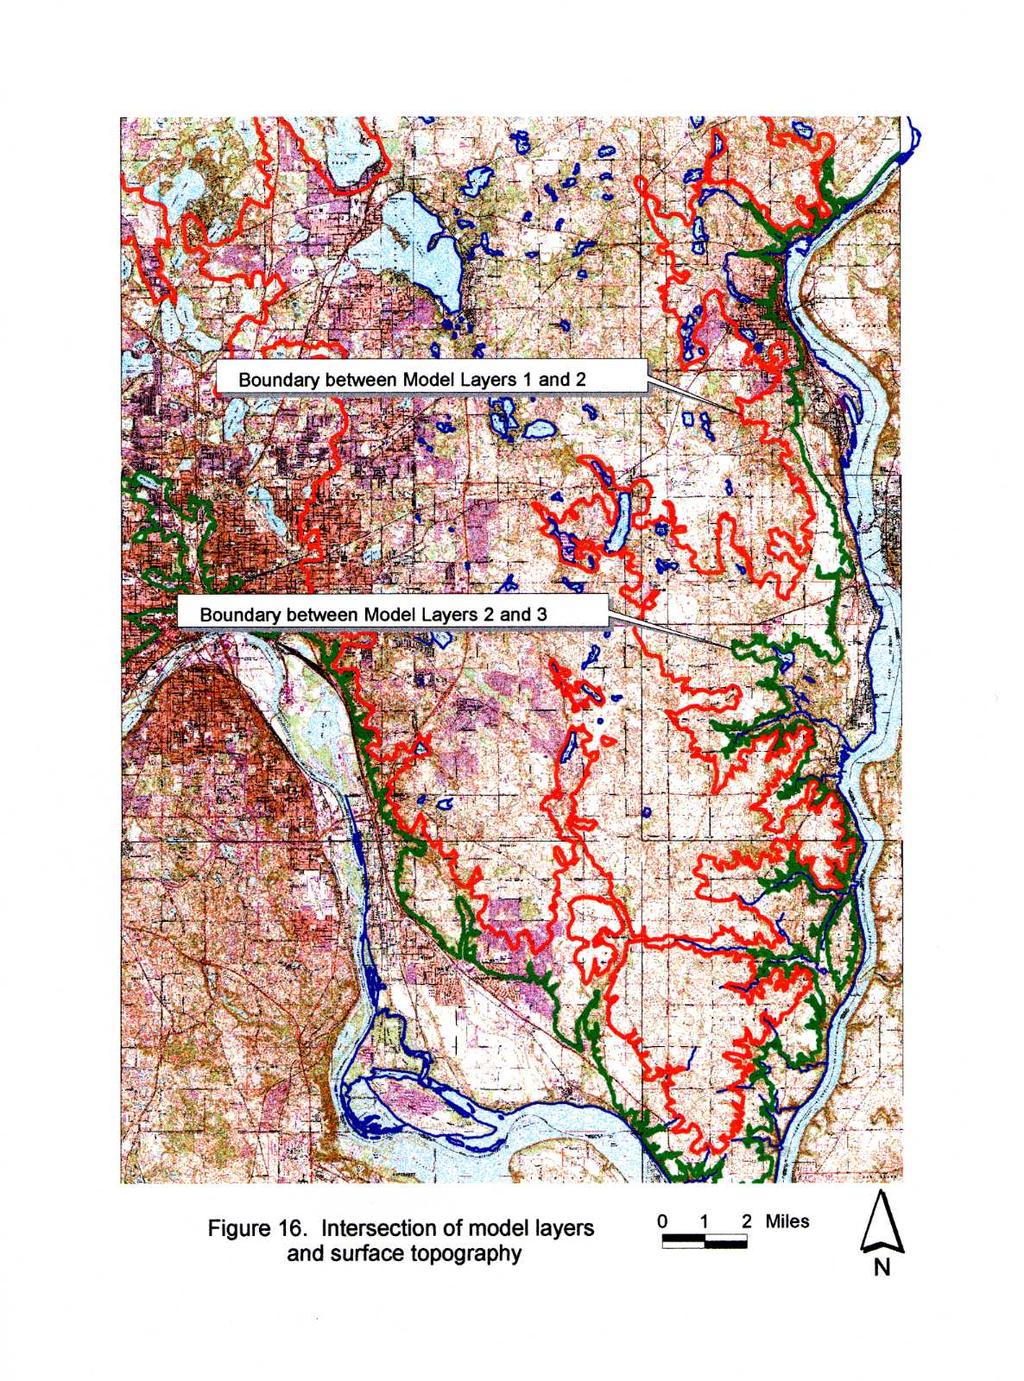
50
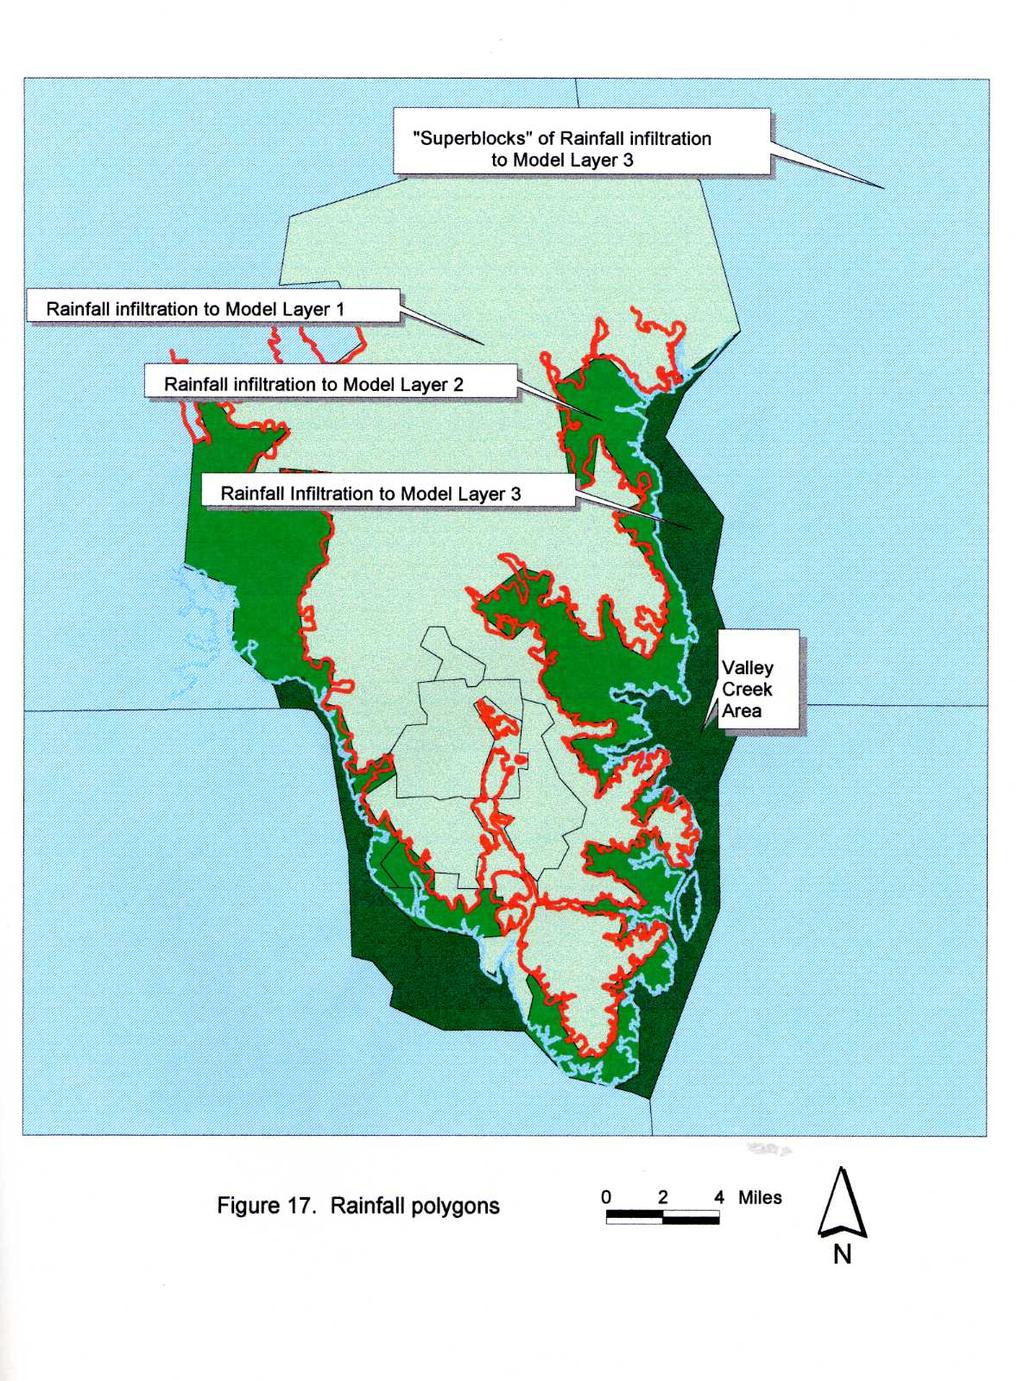
51
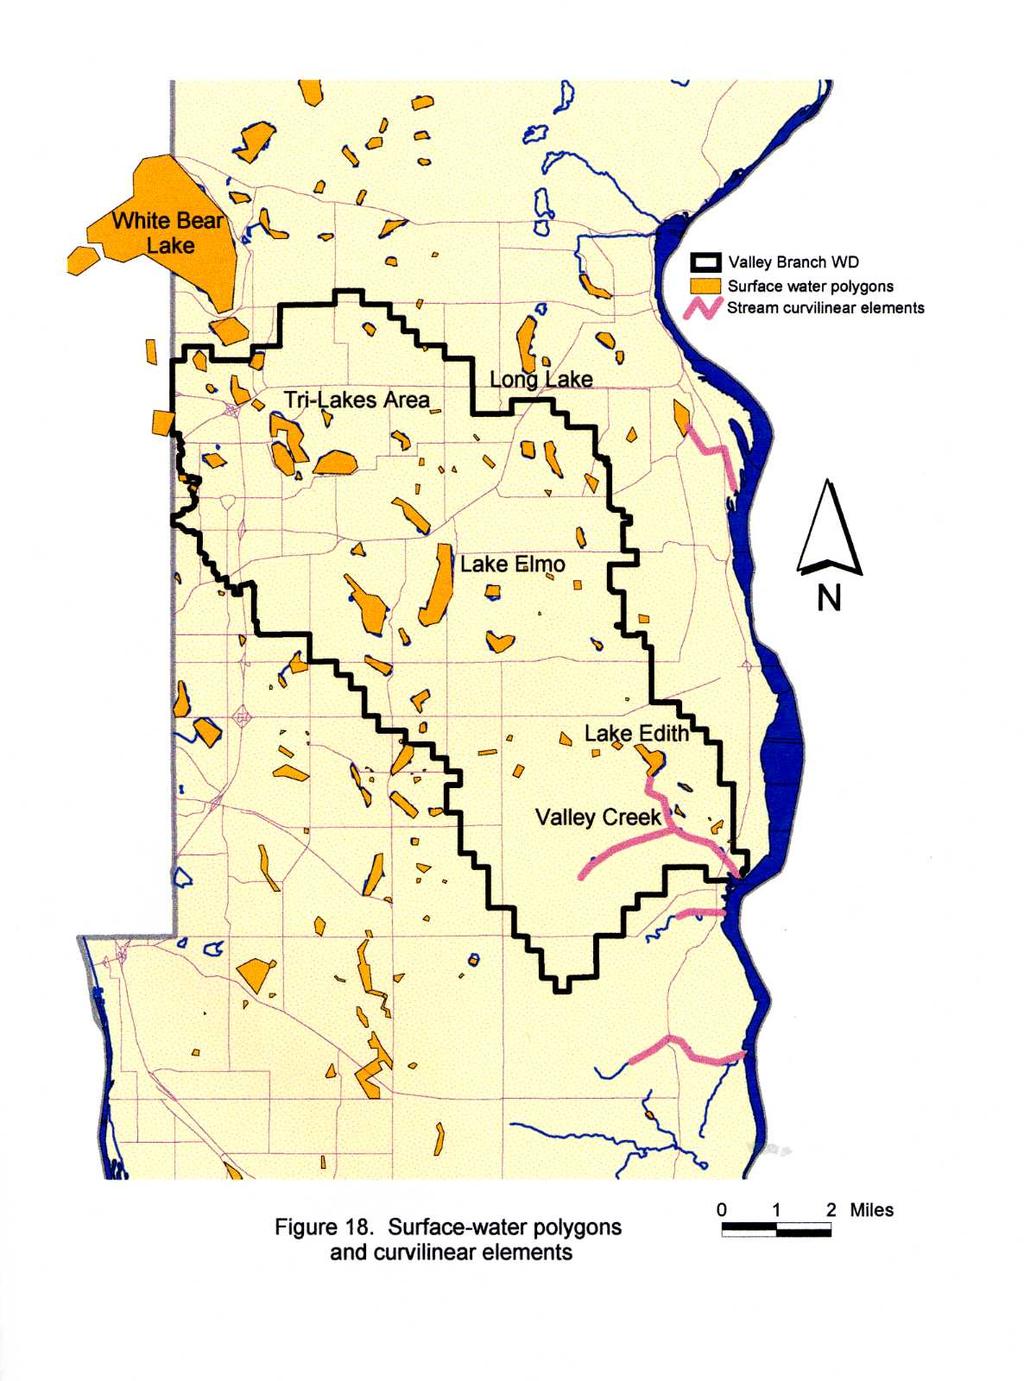
52
53
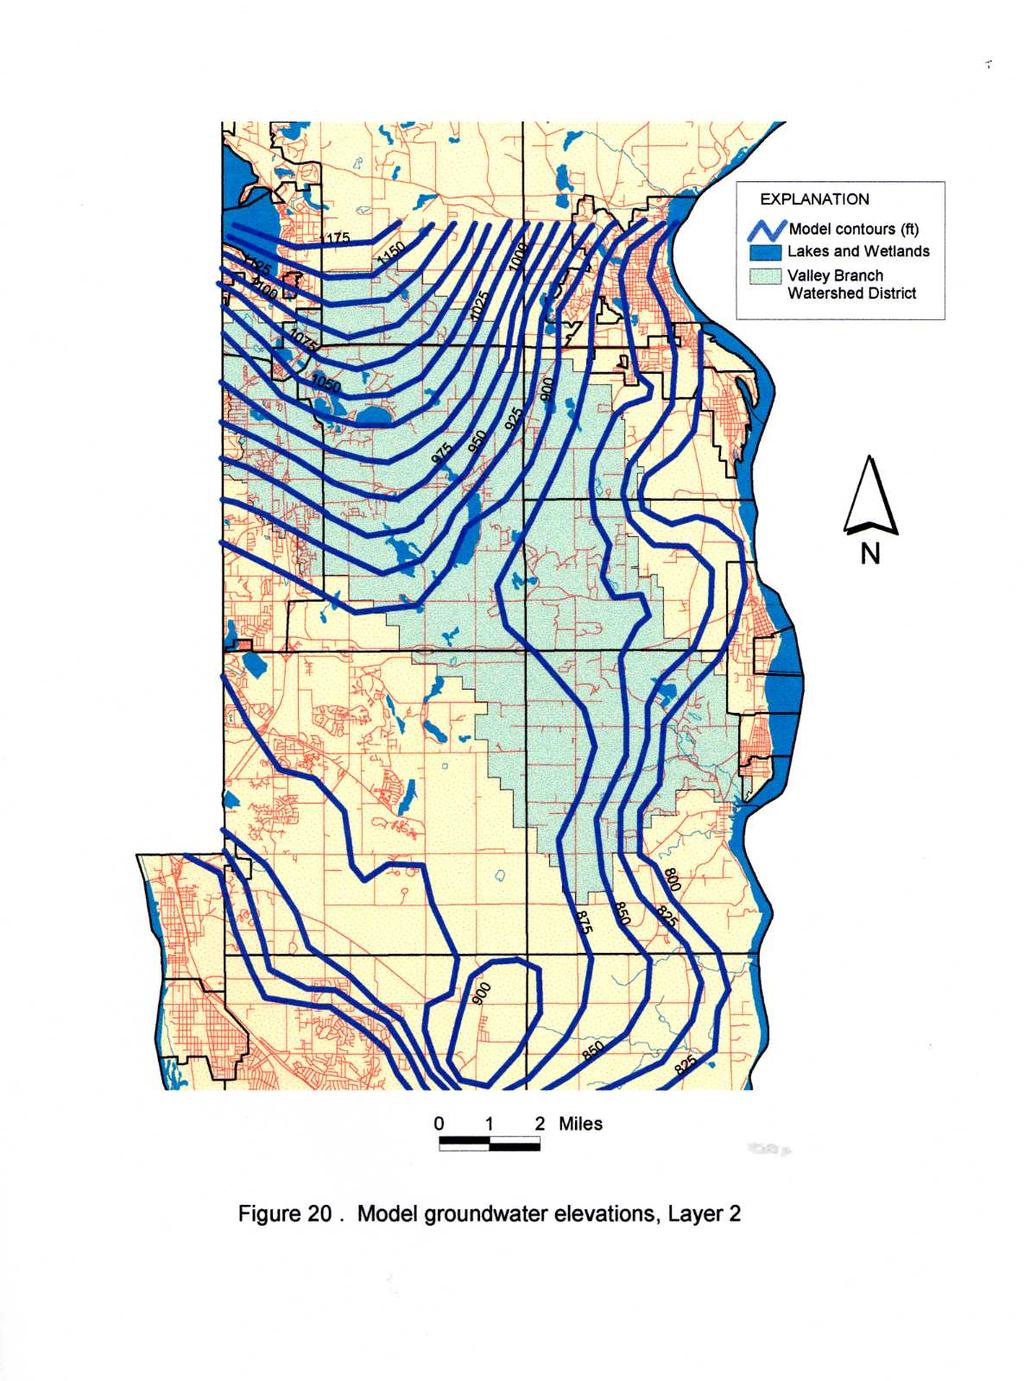
54
Vermillion River Headwaters Groundwater Recharge Area Inventory and Protection Plan
 Vermillion River Headwaters Groundwater Recharge Area Inventory and Protection Plan A project funded through a Metro Environmental Partnership grant from the Metropolitan Council with technical analysis
Karst Spring: Generalized Monitoring Strategy
 General Hydrologic Characteristics of Karst Springs Karst spring means a location of concentrated groundwater discharge from conduits in bedrock (predominantly solution enhanced conduits or zones in carbonate
STRAWMAN OUTLINE March 21, 2008 ISWS/ISGS REPORT ON THE OPPORTUNITIES AND CHALLENGES OF MEETING WATER DEMAND IN NORTH-EAST ILLINOIS
 STRAWMAN OUTLINE March 21, 2008 ISWS/ISGS REPORT ON THE OPPORTUNITIES AND CHALLENGES OF MEETING WATER DEMAND IN NORTH-EAST ILLINOIS REPORT TO BE DELIVERED TO THE RWSPG BY SEPTEMBER 30, 2008 Table of Contents
General Groundwater Concepts
 General Groundwater Concepts Hydrologic Cycle All water on the surface of the earth and underground are part of the hydrologic cycle (Figure 1), driven by natural processes that constantly transform water
Groundwater basics. Groundwater and surface water: a single resource. Pore Spaces. Simplified View
 Groundwater and surface water: a single resource Santa Cruz River, Tucson Groundwater basics Groundwater is water found within the pore spaces of geologic material beneath the surface of the Earth. It
Supplemental Guide II-Delineations
 Supplemental Guide II-Delineations Contents Source Water Protection Area Delineation... 1 Delineation Criteria for Systems Using Groundwater Sources... 2 Time of Travel... 4 Flow Boundaries... 4 Delineation
Groundwater and surface water: a single resource. Santa Cruz River, Tucson
 Groundwater and surface water: a single resource Santa Cruz River, Tucson 1942 1989 1 Groundwater basics Groundwater is water found within the pore spaces of geologic material beneath the surface of the
GROUNDWATER DISCHARGE
 GROUNDWATER DISCHARGE C O N N E C T I O N F A C T S H E E T S E R I E S D I S C H A R G E : The movement of groundwater from the subsurface to the surface P E R M E A B I L I T Y : The ability of a material
DEVELOPMENT OF AQUIFER TESTING PLANS. Brent Bauman, P.G. / Erin Lynam, Aquatic Biologist
 DEVELOPMENT OF AQUIFER TESTING PLANS Brent Bauman, P.G. / Erin Lynam, Aquatic Biologist DEVELOPMENT OF AQUIFER TESTING PLANS Goals of Aquifer Testing What questions are we trying to answer Staff review
groundwater/surface-water interactions Evan Christianson, PG Barr Engineering Company
 groundwater/surface-water interactions Evan Christianson, PG Barr Engineering Company Discussion of. Groundwater/Surface-Water Interactions Groundwater Recharge Impacts from Pumping Potential effect on
Groundwater in the Santa Rosa Plain
 . Groundwater in the Santa Rosa Plain Marcus Trotta, PG, CHg Principal Hydrogeologist Sonoma County Water Agency Santa Rosa Plain Groundwater Sustainability Agency October 12, 2017 www.sonomacountywater.org
Predicting Groundwater Sustainability: What Tools, Models and Data are Available?
 Predicting Groundwater Sustainability: What Tools, Models and Data are Available? Ray Wuolo Barr Engineering Company Assessing Sustainability is All About: Predicting (or describing) how potentiometric
Flow-Through Lake/Wetland: Generalized Monitoring Strategy
 General Hydrologic Characteristics of Flow-Through Lakes & Wetlands Flow-through lakes are surface expressions of the water table and are in direct hydraulic connection with the water-table aquifer. They
CHAPTER 13 OUTLINE The Hydrologic Cycle and Groundwater. Hydrologic cycle. Hydrologic cycle cont.
 CHAPTER 13 OUTLINE The Hydrologic Cycle and Groundwater Does not contain complete lecture notes. To be used to help organize lecture notes and home/test studies. Hydrologic cycle The hydrologic cycle is
SOUTH BRANCH SUBWATERSHED
 SOUTH BRANCH SOUTH BRANCH SUBWATERSHED The South Branch Subwatershed includes the South Branch drainage area plus all the drainage area along the main stream to the south from the mouth of Surrena Run
Category 1 Waste Rock Stockpile Groundwater Containment System
 Memorandum To: Jennifer Saran, Poly Met Mining Inc. Project: 23690862.00-042-008 1.0 Introduction The Co-Lead Agencies have requested a summary of the four containment systems that are planned for the
Gaining Stream: Generalized Monitoring Strategy
 General Hydrologic Characteristics of Gaining Streams Most stream reaches in the metro area are gaining reaches (i.e. the stream flow increases in the downstream direction due to inflow of groundwater).
8. Regional groundwater system
 8. Regional groundwater system 8-1 We have learned basic principles governing the flow and storage of groundwater. We will now use these principles to understand groundwater in the regional context. Flow
APPENDIX 5: SAMPLE MODEL RESULTS
 APPENDIX 5: SAMPLE MODEL RESULTS A. Evaluation of Groundwater Sustainability in the Ramsey Area B. Evaluation of Groundwater Sustainability in the Woodbury Area C. Evaluation of Future Drawdown Conditions
B-7. Predictive Assessment Model of Quaternary Alluvium Hydrogeology. J:\scopes\04w018\10000\FVD reports\final EIA\r-EIA app.doc
 B-7 Model of Quaternary Alluvium Hydrogeology J:\scopes\04w018\10000\FVD reports\final EIA\r-EIA app.doc PREDICTIVE ASSESSMENT MODELING OF THE QUATERNARY ALLUVIUM HYDROGEOLOGY EAGLE PROJECT MARQUETTE COUNTY,
2.0 Land and Water Resource Inventory
 2.0 Land and Water Resource Inventory 2.1 Climate and Precipitation Data The Twin Cities metropolitan area climate is a humid continental climate, with moderate precipitation, wide daily temperature variations,
HYDROGEOLOGY OF THE HUMBOLDT RIVER BASIN, IMPACTS OF OPEN-PIT MINE DEWATERING AND PIT LAKE FORMATION
 HYDROGEOLOGY OF THE HUMBOLDT RIVER BASIN, IMPACTS OF OPEN-PIT MINE DEWATERING AND PIT LAKE FORMATION June, 2015 Tom Myers, Ph.D., Hydrologic Consultant, Reno NV tom_myers@charter.net Prepared for: Progressive
4. Groundwater Resources
 4. Groundwater Resources 4-1 Majority (97 %) of unfrozen fresh water on earth exists as groundwater. In comparison to surface water, - groundwater is available all year around - groundwater is mostly invisible
WELLHEAD PROTECTION DELINEATION REPORT FOR THE VILLAGE OF BEAR LAKE DECEMBER 2002
 WELLHEAD PROTECTION DELINEATION REPORT FOR THE VILLAGE OF BEAR LAKE DECEMBER 2002 Prepared by: Gosling Czubak Engineering Sciences, Inc. 1280 Business Park Drive Traverse City, Michigan 48686 Telephone:
DYNFLOW accepts various types of boundary conditions on the groundwater flow system including:
 Section 6 Groundwater Flow Model A groundwater flow model was developed to evaluate groundwater flow patterns in the site area and to provide a basis for contaminant transport modeling. 6.1 Model Code
Irrigation. Branch. Groundwater Quality in the Battersea Drainage Basin
 AGRICULTURE, FOOD AND RURAL DEVELOPMENT Irrigation Branch Groundwater Quality in the Battersea Drainage Basin Groundwater quality in the Battersea drainage basin was monitored between 1995 and 21 to characterize
Hydrology Attribute 1/15/2016. California Rapid Assessment Method for Wetlands. Hydrology. Precipitation Increases the Extent of Wetlands
 California Rapid Assessment Method for Wetlands Hydrology Attribute Hydrology Determines existence of wetlands, drives primary physical and ecological processes: Establishment of reducing conditions Nutrient
East Maui Watershed Partnership Adapted from Utah State University and University of Wisconsin Ground Water Project Ages 7 th -Adult
 INTRODUCTION What is groundwater? Water contained in saturated soil and rock materials below the surface of the earth. It is not NEW water, but is recycled water through the hydraulic cycle. The source
Black River Watershed Management Plan Plan
 Black River Watershed Management Plan Plan Final Report Part II: Appendices May 2010 This watershed management plan was prepared for the New York State Department of State Division of Coastal Resources
Definitions 3/16/2010. GG22A: GEOSPHERE & HYDROSPHERE Hydrology
 GG22A: GEOSPHERE & HYDROSPHERE Hydrology Definitions Streamflow volume of water in a river passing a defined point over a specific time period = VxA discharge m 3 s -1 Runoff excess precipitation - precipitation
Recharge Lake/Wetland: Generalized Monitoring Strategy
 General Hydrologic Characteristics of Recharge Lakes & Wetlands The primary sources of water for recharge lakes and wetlands are direct precipitation and surface runoff. The lake stage of a recharge lake
Discharge Lake/Wetland: Generalized Monitoring Strategy
 Discharge Lake/Wetland: Generalized Monitoring Strategy General Hydrologic Characteristics of Discharge Lakes & Wetlands Discharge lakes and wetlands are in direct hydraulic connection with the water-table
CENTRAL COAST POST-CONSTRUCTION REQUIREMENTS IMPLEMENTATION GUIDANCE SERIES 1
 CENTRAL COAST POST-CONSTRUCTION REQUIREMENTS IMPLEMENTATION GUIDANCE SERIES 1 SERIES ISSUE #2: DECENTRALIZED STORMWATER MANAGEMENT TO COMPLY WITH RUNOFF RETENTION POST-CONSTRUCTION STORMWATER CONTROL REQUIREMENTS
The Corning Primary Aquifer -One of 18. NYSDEC Primary Aquifers in New York
 The Corning Primary Aquifer -One of 18 NYSDEC Primary Aquifers in New York NYSDEC Primary and Principal Aquifers PRIMARY AQUIFERS (18) Highly productive aquifers presently being utilized by major municipal
AQUIFER STORAGE AND RECOVERY EVALUATION REPORT
 AQUIFER STORAGE AND RECOVERY EVALUATION REPORT Prepared for: CLALLAM COUNTY 228 East 4 th Street, Port Angeles, WA 98362 Prepared by: 12100 NE 195 th Street, Suite 200, Bothell, WA 99011 July 2003 TABLE
Background Information on the. Peace River Basin
 Background Information on the Peace River Basin Resource Conservation & Development Department August 24 Background Physiography The Peace River drainage basin occupies large parts of Polk, Hardee, DeSoto,
Characterizing Groundwater and Surface- Water Interactions in Selected Northeast Twin Cities Lakes
 Characterizing Groundwater and Surface- Water Interactions in Selected Northeast Twin Cities Lakes Chapter A: Statistical Analysis and Field Study Chapter B: Groundwater-Flow Simulation Perry M. Jones,
Deep River-Portage Burns Waterway Watershed 2015
 2.4 Soils Soil development is the product of the interaction of parent material, topography, climate, organisms and time. Understanding the types of soils that exist within a watershed and their characteristics
Calcareous Fen: Generalized Monitoring Strategy
 Calcareous Fen: Generalized Monitoring Strategy General Hydrologic Characteristics of Trout Streams Fens are wetlands fed by groundwater. Calcareous fens are wetlands fed by groundwater containing high
Science Olympiad. Mentor Invitational Hydrogeology ANSWER KEY. Name(s): School Name: Point Totals
: School Name: Point Totals") Science Olympiad Mentor Invitational Hydrogeology ANSWER KEY Team Number: Raw Score: Rank: Name(s): School Name: Point Totals Possible Part 1: Groundwater Concepts and Vocabulary 30 Part 2: The Hydrogeology
Science Olympiad Mentor Invitational Hydrogeology ANSWER KEY Team Number: Raw Score: Rank: Name(s): School Name: Point Totals Possible Part 1: Groundwater Concepts and Vocabulary 30 Part 2: The Hydrogeology
Hydrogeology 101 3/7/2011
 Hydrogeology 101 W. Richard Laton, Ph.D., PG, CPG Associate Professor of Hydrogeology California State University, Fullerton Department of Geological Sciences 1 Hydrogeology 101 The objective is to obtain
Mapping and Understanding YOUR LAKE S WATERSHED By: Tony Groves, Pam Tyning, and Tory Meyers Water Resources Group, Progressive AE
 By: Tony roves, Pam Tyning, and Tory Meyers Water Resources roup, Progressive A What is a Watershed? A watershed is the land area surrounding a lake from which water drains to the lake. The imaginary line
Rainwater Harvesting for Enhanced Groundwater Recharge Through Capture of Increased Runoff from Site Development
 Southern Illinois University Carbondale OpenSIUC 2006 Conference Proceedings 7-18-2006 Rainwater Harvesting for Enhanced Groundwater Recharge Through Capture of Increased Runoff from Site Development Mark
1.0 Introduction. 1.1 The Stream Depletion Issue. 1.2 Purpose of the Guidelines
 Guidelines for the Assessment of Groundwater Abstraction Effects on 1.0 Introduction 1.1 The Stream Depletion Issue The management of water resources has often focussed on groundwater and surface water
Freight Street Development Strategy
 Freight Street Development Strategy Appendix B: Naugatuck River Floodplain Analysis Freight Street Development Strategy DECEMBER 2017 Page B-1 1.0 NAUGATUCK RIVER FLOODPLAIN AT FREIGHT STREET 1.1 Watershed
Groundwater 3/16/2010. GG22A: GEOSPHERE & HYDROSPHERE Hydrology
 GG22A: GEOSPHERE & HYDROSPHERE Hydrology Definitions Groundwater Subsurface water in soil or rock that is fully saturated. Aquifer Contains enough saturated material to yield significant quantities of
Potential effects evaluation of dewatering an underground mine on surface water and groundwater located in a rural area
 Potential effects evaluation of dewatering an underground mine on surface water and groundwater located in a rural area ITRODUCTIO Michel Mailloux* Eng. M.Sc, Vincent Boisvert, M.Sc, Denis Millette, Eng.,
Groundwater Level and Movement
 Groundwater Level and Movement Infiltration and Recharge Infiltration Entry of rain water into the ground. Recharge Addition of infiltrated water to the aquifer. Two types of Recharge- 1. Natural 2. Artificial
Office of Land and Water Evaluations of Groundwater Resources of Southern Mississippi
 Office of Land and Water Evaluations of Groundwater Resources of Southern Mississippi Virtually all of the water used for public and domestic drinking water supplies in southern Mississippi is derived
Water Resources on PEI: an overview and brief discussion of challenges
 Water Resources on PEI: an overview and brief discussion of challenges Components: Components and links Atmospheric water Surface water (including glacial water) Groundwater Links: Precipitation (atm(
Hydrogeology and Simulation of Ground- Water Flow in a Glacial-Aquifer System at Cortland County, New York
 In Cooperation with Cortland County Soil and Water Conservation District Hydrogeology and Simulation of Ground- Water Flow in a Glacial-Aquifer System at Cortland County, New York The City of Cortland
S.S. Papadopulos & Associates, Inc. Environmental and Water Resource Consultants
 S.S. Papadopulos & Associates, Inc. Environmental and Water Resource Consultants Development of a Transient Version of the Northeast Metro Lakes Groundwater-flow (NMLG) Model - with Simulation and Calibration
MEMORANDUM. Kathy Yager USEPA OSRTI Dick Goehlert USEPA Region 1 Darryl Luce USEPA Region 1 Mindy Vanderford, GSI Environmental, Inc.
 MEMORANDUM To: From: Kathy Yager USEPA OSRTI Dick Goehlert USEPA Region 1 Darryl Luce USEPA Region 1 Mindy Vanderford, GSI Environmental, Inc. (GSI) Doug Sutton, GeoTrans, Inc. Rob Greenwald, GeoTrans,
BAEN 673 / February 18, 2016 Hydrologic Processes
 BAEN 673 / February 18, 2016 Hydrologic Processes Assignment: HW#7 Next class lecture in AEPM 104 Today s topics SWAT exercise #2 The SWAT model review paper Hydrologic processes The Hydrologic Processes
Memorandum. Introduction. Carl Einberger Joe Morrice. Figures 1 through 7
 Memorandum TO: Michelle Halley, NWF DATE: October 9, 2007 FROM: Carl Einberger Joe Morrice PROJ. NO.: 9885.000 CC: Project File PROJ. NAME: National Wildlife Federation ATTACHMENTS: Tables 1 through 6
Geology, groundwater, soils and septic design. Carrie Jennings for Eureka Township Citizens Advisory Committee June 27, 2007
 Geology, groundwater, soils and septic design Carrie Jennings for Eureka Township Citizens Advisory Committee June 27, 2007 Source: Dakota County Ambient Groundwater Study 1999-2003, published in 2006
Feasibility Study for Groundwater Availability for Spring Creek Creation at Squalicum Creek Park
 Feasibility Study for Groundwater Availability for Spring Creek Creation at Squalicum Creek Park Prepared for: City of Bellingham Public Works Department Environmental Resource Division 210 Lottie St.
2.0 DESCRIPTION OF WATER SUPPLY DELINEATION OF THE WELLHEAD PROTECTION AREA METHODOLOGY UNCERTAINTY ANALYSIS...
 TABLE OF CONTENTS PAGE 1.0 INTRODUCTION...1 2.0 DESCRIPTION OF WATER SUPPLY...2 3.0 PHYSICAL SETTING...2 3.1 GEOLOGY...3 3.2 HYDROGEOLOGY...3 4.0 DELINEATION OF THE WELLHEAD PROTECTION AREA...4 4.1 METHODOLOGY...6
NATURAL FEATURES, LAND SUITABILITY FOR DEVELOPMENT AND DEVELOPMENT CONCERNS
 East Central Wayne County Comprehensive Plan - Natural Features, Land Suitability Page 170 NATURAL FEATURES, LAND SUITABILITY FOR DEVELOPMENT AND DEVELOPMENT CONCERNS Introduction The residents of East
River Talk Patterns. Student Copy Page PART I (1 of 1) 3. Human nervous system. Waters and drainage patterns. Road system.
 3. Human nervous system. Waters and drainage patterns. Road system.") River Talk Patterns Student Copy Page PART I (1 of 1) 3 Human nervous system photo credit: Hemera Thinkstock Photos Waters and drainage patterns photo credit: Comstock Getty Images Road system photo credit:
River Talk Patterns Student Copy Page PART I (1 of 1) 3 Human nervous system photo credit: Hemera Thinkstock Photos Waters and drainage patterns photo credit: Comstock Getty Images Road system photo credit:
SECTION III: WATERSHED TECHNICAL ANALYSIS
 Trout Creek Watershed Stormwater Management Plan SECTION III: WATERSHED TECHNICAL ANALYSIS A. Watershed Modeling An initial step this study of the Trout Creek watershed was the selection of a stormwater
Song Lake Water Budget
 Song Lake Water Budget Song Lake is located in northern Cortland County. It is a relatively small lake, with a surface area of about 115 acres, and an average depth of about 14 feet. Its maximum depth
Occurrence of Iron in Surface Waters of the Upper St. Johns River Basin
 Occurrence of Iron in Surface Waters of the Upper St. Johns River Basin Prepared by Florida Department of Environmental Protection Bureau of Watershed Management Ground Water Protection Section December
Numerical Modeling of Groundwater Flow in the Navajo Sandstone Aquifer at the Tuba City, Arizona, Disposal Site 15167
 Numerical Modeling of Groundwater Flow in the Navajo Sandstone Aquifer at the Tuba City, Arizona, Disposal Site 15167 ABSTRACT Richard Bush*, Timothy Bartlett** *US DOE, Office of Legacy Management **Stoller
RUNNING WATER AND GROUNDWATER
 NAME RUNNING WATER AND GROUNDWATER I. Introduction In this exercise we will investigate various features associated with streams and groundwater. Our drinking water ultimately comes from either streams
Integrating Groundwater & Surface Water Management Southern Washington County. August 2005
 Integrating Groundwater & Surface Water Management Southern Washington County August 2005 Barr Engineering Company Washington County Washington Conservation District Table of Contents 1. Introduction and
Characteristics of Land Resources
 Chapter Chapter 1 Characteristics of Land Resources The geology, soils and topography of Woodford County T he geology, soils and topography of an area are important to the community planning process for
Predicting seasonal variation and mounding of groundwater in shallow groundwater systems
 Predicting seasonal variation and mounding of groundwater in shallow groundwater systems Mr Kelly Norris Senior Engineer, Essential Environmental, Perth, Australia E-mail: kelly@essentialenvironmental.com.au
Groundwater Earth 9th Edition Chapter 17 Mass wasting: summary in haiku form Importance of groundwater Importance of groundwater
 1 2 3 4 5 6 7 8 9 10 11 Groundwater Earth 9 th Edition Chapter 17 Geology 100 Mass wasting: summary in haiku form The grass is greener over the septic system said Erma Bombeck. Importance of groundwater
The DNR is charged with managing waters resources to assure an adequate and sustainable supply for multiple uses.
 The DNR is charged with managing waters resources to assure an adequate and sustainable supply for multiple uses. Minnesota Laws 2015, chapter 4, article 4, directed the Department of Natural Resources
EFFECTS OF WATERSHED TOPOGRAPHY, SOILS, LAND USE, AND CLIMATE ON BASEFLOW HYDROLOGY IN HUMID REGIONS: A REVIEW
 PROGRESS IN PHYSICAL GEOGRAPHY EFFECTS OF WATERSHED TOPOGRAPHY, SOILS, LAND USE, AND CLIMATE ON BASEFLOW HYDROLOGY IN HUMID REGIONS: A REVIEW KATIE PRICE 2011 Presented by: Jordan Martin Article Overview
22 Tubewell Drainage Systems
 22 Tubewell Drainage Systems WK Boehmer' and J Boonstra2 221 Introduction ' Tubewell drainage is a technique of controlling the watertable and salinity in agricultural areas It consists of pumping, from
Chapter 2: Aquifers and groundwater
 Chapter 2: Aquifers and groundwater Groundwater movement through aquifers is driven by differences in groundwater levels or pressure and is controlled by how porous the material is that it passes through.
13 Water: A Limited Resource
 13 Water: A Limited Resource Overview of Chapter 13 Importance of Water Water Use and Resource Problems Water Problems in U.S. and Canada Global Water Problems Water Management Water Conservation Water
ICELANDIC RIVER / WASHOW BAY CREEK INTEGRATED WATERSHED MANAGEMENT PLAN STATE OF THE WATERSHED REPORT CONTRIBUTION SURFACE WATER HYDROLOGY REPORT
 ICELANDIC RIVER / WASHOW BAY CREEK INTEGRATED WATERSHED MANAGEMENT PLAN STATE OF THE WATERSHED REPORT CONTRIBUTION SURFACE WATER HYDROLOGY REPORT Disclaimer: The hydrologic conditions presented in this
Timing Key Narrative Snapshots a) 00:44 How does groundwater recharge occur? How do streams form?
 00:44 How does groundwater recharge occur? How do streams form?") Module 4 Narration: Runoff and Recharge Timing Key Narrative Snapshots a) 00:44 How does groundwater recharge occur? How do streams form? These processes are closely linked. Lets first investigate how
Module 4 Narration: Runoff and Recharge Timing Key Narrative Snapshots a) 00:44 How does groundwater recharge occur? How do streams form? These processes are closely linked. Lets first investigate how
Groundwater Modeling Guidance
 Groundwater Modeling Guidance Richard J. Mandle Groundwater Modeling Program Michigan Department of Environmental Quality Draft 1.0 10/16/02 Executive Summary The use of groundwater models is prevalent
WASA Quiz Review. Chapter 2
 WASA Quiz Review Chapter 2 Question#1 What is surface runoff? part of the water cycle that flows over land as surface water instead of being absorbed into groundwater or evaporating Question #2 What are
TNC Fisher Slough Final Design and Permitting Subject: Internal Memorandum for Levee Design Groundwater Mounding
 TNC Fisher Slough Final Design and Permitting Subject: Internal Memorandum for Levee Design Groundwater Mounding To: From: Internal Memo for Record David Cline (Tetra Tech) Date: Dec. 16, 2009 Introduction
Draft Fact Sheet Butte County Stable Isotope Recharge Study
 Agenda Item #4 Draft Fact Sheet Butte County Stable Isotope Recharge Study Purpose of the Study: To develop a better understanding of how various water sources contribute to recharge of Butte County groundwater.
GY 111 Lecture Note Series Groundwater and Hydrogeology
 GY 111 Lecture Notes D. Haywick (2008-09) 1 GY 111 Lecture Note Series Groundwater and Hydrogeology Lecture Goals A) The hydrologic cycle B) Groundwater dynamics C) Mapping groundwater (done in class not
Surface Water Management
 Surface Water Management Figure 7: Examples of Nonpoint Source Pollution The water quality leaving the metropolitan area is as good as the water quality entering the metropolitan area, and in compliance
Report. Environmental Water Demands. Butte County Department of Water and Resource Conservation Integrated Water Resources Plan.
 Report Butte County Department of Water and Resource Conservation Integrated Water Resources Plan s June 2004 s Section 1 - Introduction 1.1 Project Description This project is a preliminary investigation
Metropolitan Council Environmental Services Twin Cities Water Quality Initiative (TCQI) Program
 Program") An Examination of the Relationship Between Watershed Structure and Water Quality in the Valley Creek and Browns Creek Watersheds by D.G. Pitt, J.E. Almendinger, R. Bell, and S. Roos Final Project Report
An Examination of the Relationship Between Watershed Structure and Water Quality in the Valley Creek and Browns Creek Watersheds by D.G. Pitt, J.E. Almendinger, R. Bell, and S. Roos Final Project Report
THE ABATEMENT PLAN. beneficial abatement plan. For the purpose of defining the pollution potential of surface waters
 THE ABATEMENT PLAN GENERAL PLAN Preventing surface waters from entering deep mine workings apparently offers the most beneficial abatement plan. For the purpose of defining the pollution potential of surface
Hydrogeology of East Anglia An Introduction
 East Land Quality Forum Hydrogeology of East Anglia An Introduction Richard Fry Ely Golf Club November 6 th 2012 1 2 Groundwater systems are complex and difficult to assess; they are based on aquifer systems
CHAPTER 7 PHYSICAL INVENTORY OF THE CITY
 CHAPTER 7 PHYSICAL INVENTORY OF THE CITY Chapter 7: Physical Inventory of the City 39 This page intentionally left blank. Chapter 7: Physical Inventory of the City 40 SECTION 1 PHYSICAL SETTING While communities
BLOCKING AND FILLING SURFACE DRAINAGE DITCHES
 MINNESOTA WETLAND RESTORATION GUIDE BLOCKING AND FILLING SURFACE DRAINAGE DITCHES TECHNICAL GUIDANCE DOCUMENT Document No.: WRG 4A-1 Publication Date: 10/14/2015 Table of Contents Introduction Application
FISHER RIVER INTEGRATED WATERSHED MANAGEMENT PLAN STATE OF THE WATERSHED REPORT CONTRIBUTION SURFACE WATER HYDROLOGY REPORT
 FISHER RIVER INTEGRATED WATERSHED MANAGEMENT PLAN STATE OF THE WATERSHED REPORT CONTRIBUTION SURFACE WATER HYDROLOGY REPORT Disclaimer: The hydrologic conditions presented in this report are estimates
5. Basin Evaluation Salt and Nitrate Balance
 SNMP Attachment B, Section B.2.1.3 (originally Section 5 in CV-SALTS Phase 2 Conceptual Model Task 5 deliverables) 5. As part of the evaluation of water quality the SNMP requires loading estimates and
Groundwater in Bayfield County. Madeline Gotkowitz Hydrogeologist April 23, 2015
 Groundwater in Bayfield County Madeline Gotowitz Hydrogeologist April 23, 2015 Groundwater in Bayfield County Groundwater basics Hydrogeology across Wisconsin Hydrogeology in Bayfield County Mapping groundwater
CHRISTCHURCH CITY GROUNDWATER MODEL
 CHRISTCHURCH CITY GROUNDWATER MODEL Mike Thorley 1, Peter Callander 1, Howard Williams 1, Hilary Lough 1, Mike Kininmonth 2, Bruce Henderson 2 1 Pattle Delamore Partners Ltd Level 2, Radio New Zealand
A WEAP Model of the Kinneret Basin
 A WEAP Model of the Kinneret Basin Illy Sivan 1, Yigal Salingar 1 and Alon Rimmer 2 This is an English translation of the article that originally appeared in Sivan, I., Y. Salingar, and A. Rimmer, A WEAP
DRAINAGE & DESIGN OF DRAINAGE SYSTEM
 Drainage on Highways DRAINAGE & DESIGN OF DRAINAGE SYSTEM P. R.D. Fernando Chartered Engineer B.Sc.(Hons), M.Eng. C.Eng., MIE(SL) Drainage Requirement of Highway Drainage System Introduction Drainage means
Lecture 14. Water: A Limited Resource. Lecture 14
 Lecture 14 Water: A Limited Resource Lecture 14 1. Importance of Water 2. Water Use and Resource Problems 3. Water Problems in U.S. and Canada 4. Global Water Problems 5. Water Management 6. Water Conservation
MEMORANDUM. FROM: Jordan Kear, P.G., C.Hg. KG
 MEMORANDUM TO: Mr. Robert Elliott Little Baldy Water Company PO Box 313 Llano, California 93544 FROM: Jordan Kear, P.G., C.Hg. KG12-0100 DATE: July 20, 2012 SUBJECT: Reconnaissance Level Hydrogeologic
Watershed Health and Water Management in the Porcupine Hills
 Watershed Health and Water Management in the Porcupine Hills In Alberta, our quality of life is tied to healthy and sustainable water supplies for the environment, for our communities, and for our economic
A Hydrologic Study of the North Hills, Helena, Montana
 A Hydrologic Study of the North Hills, Helena, Montana Andrew Bobst, Kirk Waren, James Swierc, and Jane Madison MBMG Groundwater Investigations Program 10/6/11 MT AWRA Background Groundwater Steering Committee
Hydrogeology of Prince Edward Island
 Hydrogeology of Prince Edward Island General Characteristics and Groundwater on Prince Edward Island General Characteristics and Key Issues Issues PEI Dept. of Environment, Energy and Forestry 9/29/2009
Groundwater Levels and Pumpage in the East St. Louis Area, Illinois,
 Circular 112 STATE OF ILLINOIS DEPARTMENT OF REGISTRATION AND EDUCATION Groundwater Levels and Pumpage in the East St. Louis Area, Illinois, 1967-1971 by W. H. BAKER, JR. ILLINOIS STATE WATER SURVEY URBANA