Nutrient Cycling and Water Quality on California Rangelands
|
|
|
- Regina Neal
- 5 years ago
- Views:
Transcription
1 Nutrient Cycling and Water Quality on California Rangelands Randy Dahlgren Department of Land, Air and Water Resources University of California - Davis Core Research Team Barbara Allen-Diaz Rob Atwill Randy Dahlgren John Harper David Lewis Toby O Geen Mike Singer Ken Tate
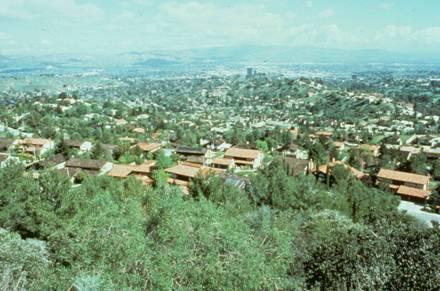
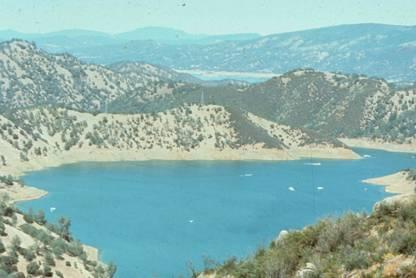
2 Urban-Wildland-Agricultural Interface 80% of Reservoirs


3 Nutrient impaired waterbodies with possible grazing impacts
4 Nutrient Pollution Nitrogen - organic forms - ammonium (NH 3 /NH 4+ ) - nitrate (NO 3- ) Harmful Algal Blooms Organic N = Nitrogen = Hydrogen = Oxygen
 3- Organic")
5 Nutrient Pollution Phosphorus - organic forms - adsorbed to particles - dissolved phosphate (PO 3-4 ) 3- Organic P


6 Harmful Algal Blooms Nitrate in drinking water Water Quality Standard = 10 mg N/L Blue-baby syndrome (methemoglobinemia)
7 Ammonia (NH 3 ) Toxicity Aquatic Ecosystems Criterion Duration Acute (1-hr average) Chronic (30-d rolling average) 2013 Final Criteria TAN at ph = 7 & 20 o C 17 mg N/L 1.9 mg N/L TAN = NH 3 + NH 4 + Acute Toxicity at NH 3 ph 8.5 & 30 o C TAN = 0.33 mg N/L ph 7 = 0.5%
 NH")

8 Nutrients (N/P) NH 3 /NH 4 /PO 4 Runoff

9 Nitrogen kg/ha/yr Atmospheric Nitrogen Deposition in California Atmospheric N deposition on California rangelands is often in the range: 5 10 kg/ha/yr
10 Mineral N (kg/ha/yr) Sierra Nevada Foothills Watershed Annual N Export Load Most rangelands are sinks rather than sources for nitrogen Mean Water Year

11 Natural Sources of Nitrogen Photo courtesy of Carson Jeffries Big Springs Shasta Valley Spring discharge = 90 cfs NO 3 -N = 0.48 mg/l PO 4 -P = 0.15 amorahquanyin.com mg/l

12 Northern California Volcanic Springs
13 0.4 Spring Water Nitrate and Phosphate 0.3 NO 3 -N (mg/l) Up Sac Trout Up Sac Bridge Up Sac Moss Fall Lodge Fall Rainbow Crystal Big Lake Lava Crk Ja-she Trapral Casis PO 4 -P (mg/l) Up Sac Trout Up Sac Bridge Up Sac Moss Fall Lodge Fall Rainbow Crystal Big Lake Lava Crk Ja-she Trapral Casis

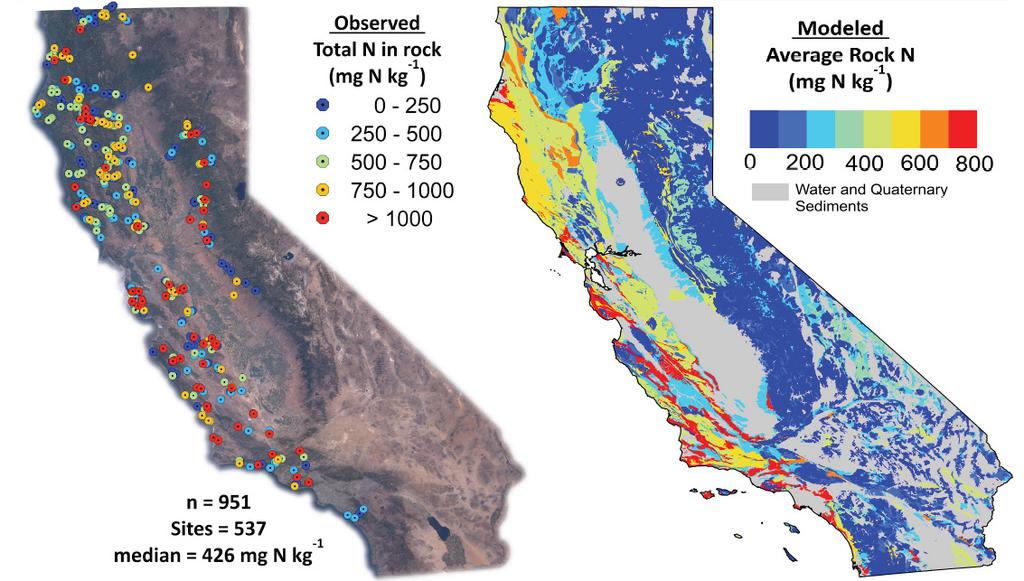
14 Scott Morford
 Eutrophication Concern")
 0.30 TP 0.009 0.032 (0.15) 0.10 PO 4 -P (0.")
15 Background nutrient levels are not zero Nutrient Background Level (mg/l) Eutrophication Concern (mg/l) TN NO 3 -N (0.50) 0.30 TP (0.15) 0.10 PO 4 -P (0.15) 0.05
16 Seasonal Pattern in Streamwater Nitrate in Non-grazed California Oak Woodlands 6 5 NO 3 (mg L-1) J A J O J A J O J A J O J A J


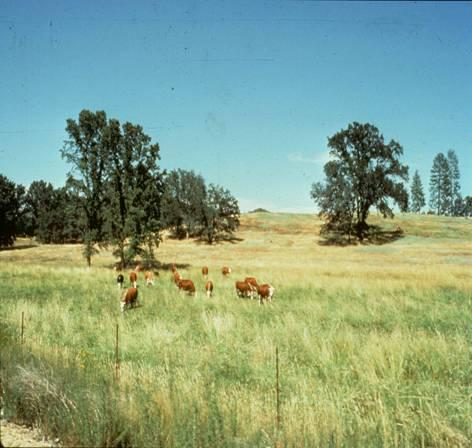
17 Low Nutrient Demand High Nutrient Demand California oak woodlands annual grasslands are naturally susceptible to seasonal nitrate leaching

18 Assimilative Capacity Self-Purification Capacity removal of pollutants during downstream transport
19 Assimilative Capacity
20 Yuba River - Nitrate ~ 0.5 to 5 mg/l in oak woodland streams NO 3 -N (mg/l) 0.15 Nutrient assimilative capacity reduces nutrient concentrations to downstream 0.10 aquatic ecosystems Oct Apr Oct Apr Oct Apr Oct Apr Oct


21 State-wide Survey 24 streams 2000 and 2001 water years
22 5 4 Nutrient Concentrations n = 947 N / P mg/l (mg/l) th 75 th 50 th 25 th 10 th * Eutrophication concern level * Total N NO 3 NH 4 Total P PO 4 * *


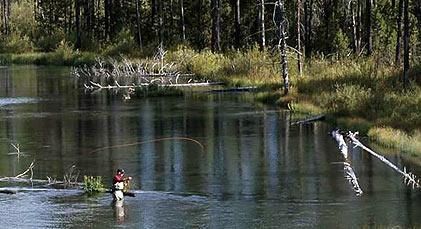
23 Grazing Treatments No grazing 1500 lb/ac RDM 1000 lb/ac RDM 500 lb/ac RDM
24 12 10 n = Nitrate - Grazing NO 3 -N (mg/l) NO 3 (mg/l) No Graze Eutrophication concern level
25 9 Nitrate lbs/acre RDM Streamflow (cfs) NO Streamflow (cfs) NO NO 3 -N 3 (mg/l) 3 0 Nov Dec Jan Feb Mar Apr May 0
26 Coastal Creek Ammonia Ammonia and Flow for Site 1 during New Years Flood 400 Flow Site 1, NH3 Site 1, Flow (cfs) chronic level 2 1 NH 3 /NH 4 N (mg/l) Un-Ionized NH3 (mg/l) /25/05 12/26/05 12/27/05 12/28/05 12/29/05 12/30/05 12/31/05 1/1/06 1/2/06 1/3/06 Date Slide courtesy of David Lewis
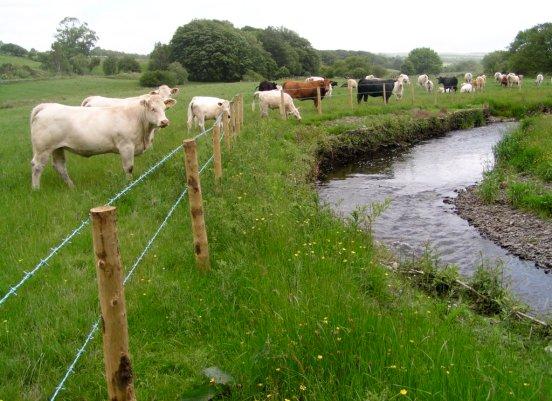
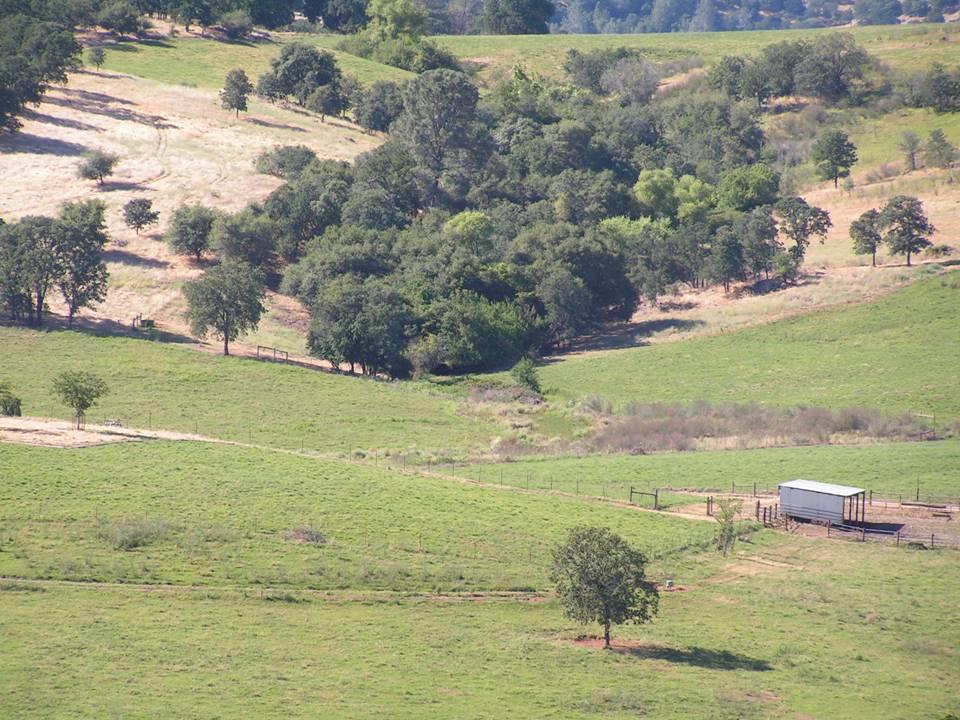
27 Grazing Management Buffer/Filter Strip
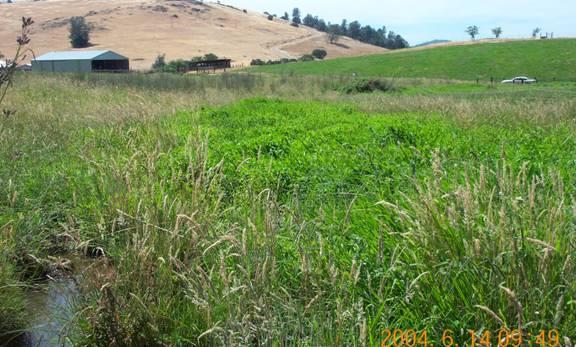
28 Flow-Through Wetlands Wetland
29 Wetland Treatment of Irrigation Tailwaters 100 Percent Reduction E. coli Sediment Total N NO3-N Total P PO4-P
30 Conclusions Most California rangelands are sinks rather than sources for nutrients Background nutrient levels are not zero California oak woodlands annual grasslands are naturally susceptible to seasonal nitrate leaching Nutrient assimilative capacity reduces nutrient concentrations to downstream aquatic ecosystems Rangeland streams rarely exceed nutrient thresholds for eutrophication, except during large storm events Accurate nutrient monitoring of rangelands is extremely challenging given temporal variability
31 Questions?