EXECUTIVE SUMMARY LEGISLATIVE REPORT 2011
|
|
|
- Scott Copeland
- 5 years ago
- Views:
Transcription

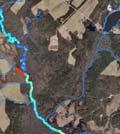
1 EXECUTIVE SUMMARY LEGISLATIVE REPORT 2011 January, RiverNet Program RIVERNET: Continuous Monitoring of Water Quality in the Neuse River Basin Dr. William J. Showers Dept. of Marine, Earth & Atmospheric Sciences, North Carolina State University PURPOSE OF PROGRAM Agricultural and urban land use has increased the fluxes of nutrients, sediments and different organic/inorganic chemicals into surface water and ground waters. As a consequence, many estuaries and wetlands are under various levels of environmental pressure as a result of diminished water quality (e.g., high nutrient concentrations, sediment loading, low levels of dissolved oxygen). The increased nitrogen flux to estuaries and coastal waters has affected water quality by enhancing phytoplankton blooms as part of the overall eutrophication process. This enhanced production modifies coastal food webs, reduces commercial species abundance, and in extreme cases produces zones of hypoxia and anoxia. Although extensive research has been done to understand nitrate contamination and attenuation processes in ground water, discharge rates of nitrate in streams are commonly not matched to different types of land use or to field application rates. To promote the long-term sustainability of natural and managed watersheds and to develop successful remediation strategies, fundamental processes that control water quality on a watershed scale must be investigated. RiverNet is a program that is designed to understand nitrogen fluxes in watersheds with different land uses. BACKGROUND The 2001 Session of the General Assembly appropriated $300,000 to the Department of Environment and Natural Resources (DENR) for transfer to North Carolina State University (NCSU) for the continued operation of the RiverNet Program. RiverNet expanded into the Cape Fear Basin in 2009, and $286,500 was allocated to the program for the period. The RiverNet Monitoring network has been operated over the past 11 years. During this past year we have employed novel river nutrient mapping techniques in water supply lakes. This year we continue monitoring in the Neuse basin, and continuously operated 2 stations in the Cape Fear River Basin in a concentrated swine CAFO area. Five stations are operating in the basin from Raleigh to Fort Barnwell, with one station in the Contentnea watershed, and four are along the Neuse main stem (Figure 1). Two stations are operating in the Great Coharie and Black River watersheds in Sampson County (Figure 1). Physical water quality property measurements with nitrate concentrations are made every 15 minutes. The data is transferred to a server at the NCSU Raleigh campus via a digital cell network, and mounted on a web site for public access ( This monitoring will continue for the next year with nutrient watershed mapping in the Neuse and Cape Fear Watersheds. The nutrient mapping technology spatially quantifies nitrate, ph, Eh, temperature, conductivity, Chl a, and CDOM in surface waters. During 1
.")
2 the past year nutrient maps were made of the Great Coharie, Little Coharie and the Black River in the Cape Fear River Basin. We also mapped nutrient in Lake Jordan and Falls Lake which are drinking water sources for Cary and Raleigh, NC (Figure 7, 11, 12). Three stations were severely damaged by Hurricane Irene last year and are in the process of being repaired (Figure 1). Figure 1. The RiverNet monitoring network with stations located in the Neuse and the Cape Fear River Basins. Stations will monitor water quality in the nutrient sensitive Neuse River Basin and on the major rivers in sub-basin #19 in the Cape Fear River Basin. Three stations were damaged by Hurricane Irene in August 2011 and are under repair. RiverNet: Results 2011 Previous year s results have shown that there are very rapid nitrate concentration changes in the Neuse River in the upper, middle and lower basin. In 2006 an El Nino began to build in the equatorial Pacific that peaked in fall of In 2006 to 2007, the N flux in the Neuse Basin increased with discharge levels similar to the fluxes observed in 2003 which followed another large El Nino event (Figure 2). In 2007 the El Nino transitioned in late spring to the La Nina cold phase and fluxes dramatically decreased. The cold phase in the summer of 2007 resulted in a drought over the entire SE United States. Rainfall decreased, and river discharge, groundwater levels, and N flux fell in the second half of In 2010 another significant La Nina cold phase developed with a low NAO index, and precipitation and river discharge has been low with decreased N flux (Figure 2). The cold phase weakened in the summer of 2011, and then became cold again at the end of 2011 resulting in low nitrate fluxes in the Neuse Basin over the past one and one half years. The average nitrate concentrations in the basin have increased over the past decade (Figure 3). Concentrations were low prior to 2005, increased from 2005 to 2009, and then have increased 2
.")
3 again in the 2010 to 2012 period. This resulted in the largest nitrate flux observed in the Neuse Basin in the winter of 2010 and the Spring of 2011 (Figure 3 & 4). Also, the current cold phase has higher nitrate fluxes than previous cold phases (Figure 4 & 5). The two large scale climate oscillations that affect North Carolina precipitation and hydrology are El Nino and the North Atlantic Oscillation. Nitrate flux increases with positive El Nino oscillations. Warmer waters in the equatorial Pacific intensify the southern jet stream, which brings Gulf of Mexico moisture to North Carolina. This causes increased precipitation, higher groundwater elevations, and increased N flux in watersheds. North Carolina precipitation is also affected by the North Atlantic Oscillation. The North Atlantic oscillation (NAO) is a climatic phenomenon in the Atlantic Ocean where conditions are controlled by the difference of sea-level pressure between the Icelandic Low and the Azores high. This difference controls the strength and direction of westerly Figure 2. Daily discharge and Monthly N flux at Fort Barnwell North Carolina at the bottom of the Neuse River Basin. This graph represents over 213,000 individual measurements at this one station. 3

4 Figure 3. Monthly N flux at Fort Barnwell North Carolina versus nitrate concentration. Nitrate concentration is a poor predictor of water quality trends, during high flux periods concentrations tend to be lower that during low flux intervals. winds and storm tracks across the North Atlantic. When the North Atlantic Oscillation Index is positive, the westerly flow across the North Atlantic and western Europe is enhanced. In this NAO phase, warm ocean waters occur off the eastern US, and rainfall is enhanced in our region. During the negative phase storm tracks are forced further south and northern Europe and the east coast of the US is dry. The climate oscillation effects are well illustrated by comparing the discharge, nitrate flux, and JMA El Nino Index (Figures 4). When nitrate flux per year is plotted, there is no apparent 4

5 Figure 4. Monthly N flux at Fort Barnwell North Carolina versus Discharge and the El Nino climate index plotted versus warm, neutral and cold years. Highest fluxes are observed during the warm years. N Fluxes for the El Nino events is greater than the 2006 event, N fluxes in the cold phases are increasing as well. trend, but when the nitrate flux is plotted for the warm, neutral and cold phases, increase nitrate flux occurs during the warm phases (Figure 4). Along with the average concentration increase over the past decade, the highest nitrate fluxes to the Neuse River Estuary have occurred in the recent warm phase of The recent Cold Phase of has the greatest nitrate flux of the cold phases over the past decade (Figure 5). The trend of increasing nitrate flux with increasing average river nitrate concentrations suggests that environmental impacts and problems in the Neuse which were prevalent in the 1990 s may reappear in the next decade. 5
6 Figure 5. Monthly N flux at Fort Barnwell North Carolina versus Discharge plotted against warm, neutral and cold years with the pre- and post-2006 warm phases separated. Highest fluxes occur in the 2010 El Nino event indicating that when like climate phase fluxes are examined, water quality is changing in the Neuse River Basin. MONITORING IN THE CAPE FEAR RIVER BASIN River Nutrient Mapping Four RiverNet Stations have been operated in the Cape Fear #19 sub-basin for the past 18 months (Figure 6). Two stations were damaged by Hurricane Irene and are under repair. Watershed nutrient mapping has also been completed in the Little Coharie Creek, Great Coharie Creek, Six Runs Creek, and the Black River near Tomahawk (Figure 6). Increases in river nitrate in the Little and Great Coharie Creek are found near artificial tile drain systems (Figures 7 & 8). Increases in river nitrate concentration are also associated with cattle operations that do not have hydric buffers. Swine operations in this watershed have hydric buffers and do not appear to affect the river at low flow conditions. Monitoring during high flow conditions found similar results, but debris dams were less effective at attenuating nitrate concentrations during high flow conditions Stable isotope results of riverine nitrate indicate that waste nitrogen dominate the sources of nutrients to the Cape Fear sub-basin #19 (Figure 9). There are several municipal waste water treatment plants in the basin, but concentrations increase downstream so additional inputs are indicated. Land Cover Land Use spatial analysis of the stream buffer areas (Figure 10), show a weak correlation between stream nitrate concentration and % agricultural land in the buffer, and an 6


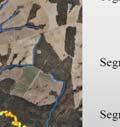

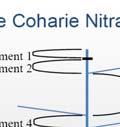
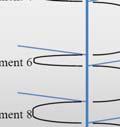
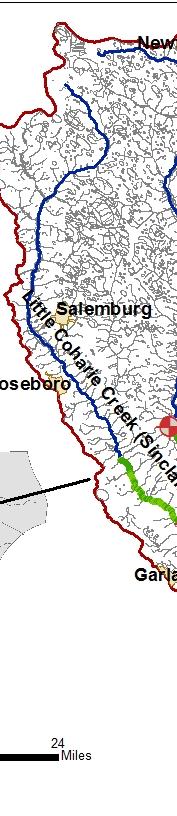


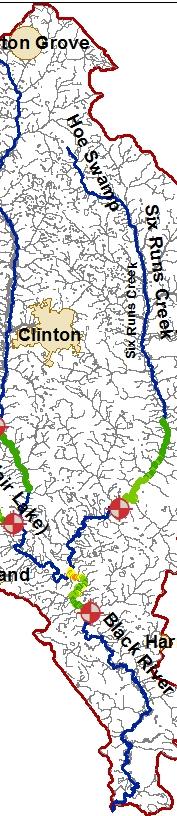

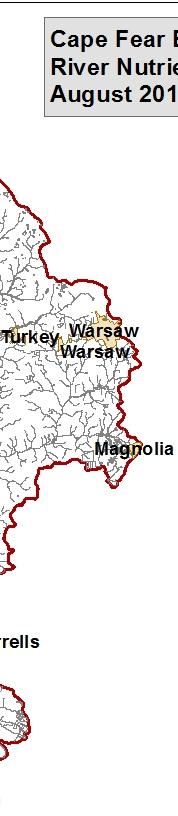
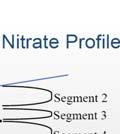


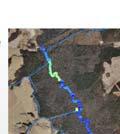
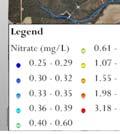
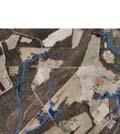
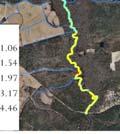
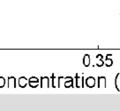
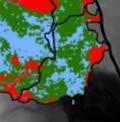
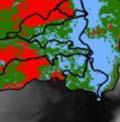
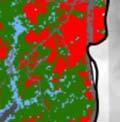
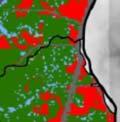
7 Figure 6. Nutrientt watershed mapping sites in the Cape Fear sub-basin #19 during low flow conditions. Figure 7. Nitrate concentration s in the Little and Great Coharie Creek during low flow conditions. Increases in river nitrate are associated with tile drain systems and cattle operations that do not have hydric buffers. Swine operations that have hydric buffers do not increasee nitrate concentrations during low flow conditions. 7


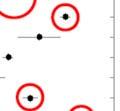
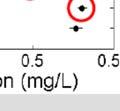
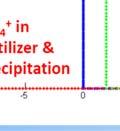


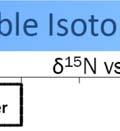
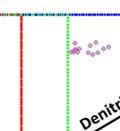
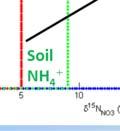

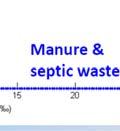

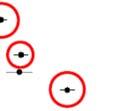

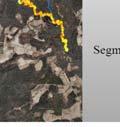
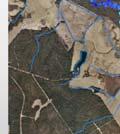
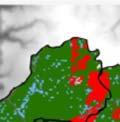
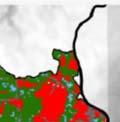
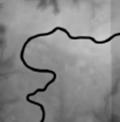
8 Figure 8. Nitrate concentration s of the river water in the Cape Fear #19 river basin. Blue circles represents areas of debris dams where denitrification decreases concentrations, red circles are tile drain systems. Figure 9. Stable Isotopic Results from water samples from the Cape Fear #19 Basin indicates a waste source for the nitrate. 8


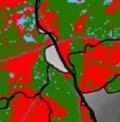

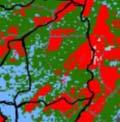


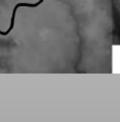
9 Figure 10. Land Cover Land Use Buffer analysis. Nitratee concentrations in streams are related to % agricultural land in the buffer and inversely proportional too the amount of wetlands, but tile drain systems bypass the buffer system and have a direct impact on stream nitrate concentrations. negative correlation between % wetland in the bufferr and stream nitrate concentrations. Tile drain systems bypass the buffer and directly impact river nitrate concentrations. The buffer land cover land use may be a good predictor of stream nitrate concentrationn by controlling the tile drain drainage that is directly discharged into the stream. Lake/Reservoir Nutrient Mapping We had adapted the nutrient mapping technology to a high speed boat to efficiently map nutrients in lakes that serve as drinking water reservoirs for Raleigh/Cary and the surrounding area. Nitrate is elevated in the upper portions of Falls Lake in the spring and summer months, which stimulates Chl a blooms in the upper portion of the lake (Figure 11). Dissolved organic matter is also high in the upper portion of the lake s surface waters (which we measure as CDOM, the optically measured portion of dissolved organic matter - DOM). DOM accumulates in the deeper portion of the lower lake and is a problem for treatment of lake waters for drinking. Nutrient inputs are found in the upper portion of Falls Lake coming from sources in Durham (Figure 12). In the winter months there are nitrate inputs in the center or the lake from Barton s Creek which comes from the middle of the lake in Raleigh (Figure 12). Jordan Lake has nutrient inputs from the upper 9

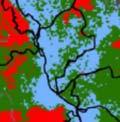
10 Figure 11 Nitrate and Chl a in Falls Lake, March 2011, nitrate inputs from Elerbe Creek and Knapp of Reeds are apparent, Chl a is high in the upper portion of the lake above Hwy 85 as is CDOM which becomes a problem at the water intake for the Drinking Water Plant for Raleigh during the Fall Overturn period because CDOM accumulates at depth in the deeper lower part of the lake. 10

.")
11 Figure 12. Fall Lake has winter nitrate inputs from Barton Creek in the middle portion of the lake. Jordan Lake has nitrate inputs from the Haw River as well as from the upper portion of the lake N i 3.5 t 3 e r 2.5 a 2 t e ChlA ug/l Figure 13. Chl a and nitrate concentrations in Falls Lake are not well correlated indicating that spatial mapping is important to understand lake nutrient inputs and lake biogeochemistry that results from eutrophication. portions of the lake and from the Haw River near the dam (Figure 12). To understand lake dynamics, monthly maps of nutrients, DO, Chl a, dissolved organic matter, and temperature are very useful because the different water quality 11


12 parameters are not directly correlated in space and time, and change as the water migrates down the reservoir and out of the dam (Figure 13). Summary: RiverNet is a river water quality monitoring system that has significantly evolved and given researchers, policy makers, and water quality regulators a new understanding of fundamental processess affecting water quality on a watershed scale. At the present time we are combining RiverNet monitoring efforts with the USGS to look at nutrient inputs in the upper part of Falls Lake from the Eno River. The newly redesigned web pages makes this data available to university and government researchers, students, the general public, and policy makers in real time (Figure 14). These efforts have so far proven too be very successful in understanding nitrogen transport across landscapes and will aid in efforts to design treatment wetlands and flood buffers to remediate contaminated surface and groundwater nitrate entering our river basins in orderr to better protect our water resources and water quality. Figure 14. The redesigned web page allows easy access to the data generated by this project. 12
13 Major findings of the program to date include: Nitrate and sediment concentrations in the Neuse River Basin change rapidly with and without stage changes. These variations are correlated to discharge and precipitation variations that are controlled by large scale climate cycles. These climate cycles are the El Nino/La Nina oscillation, which has a 5-7 years time period, modulated by the NAO (North Atlantic Oscillation) which has a 1-2 year cycle. These climate cycles must be considered when planning for water quality and water availability. Nitrate concentrations are increasing in the Neuse River Basin over the past decade and fluxes during the comparable different warm and cold phases are getting larger. 15 minute RiverNet flux measurements are significantly more accurate than flux estimates made from daily concentration measurements because they take into account the natural nitrate concentration and discharge variations of hydrographic storm events and wastewater treatment plant conditions. Daily flux estimates have a 10 to 40% error depending upon the location in the river basin. Measurement of surface and groundwater nitrate fluxes with the RiverNet technology has shown that groundwater N additions are episodic with time and space and cannot be understood or mapped without high resolution spatial and temporal data. Because of this project, remediation wetlands have been installed at the City of Raleigh Neuse River Waste Water Treatment plant, and can reduce about one half of the flux to the Neuse River via surface streams. On-going monitoring will assess the full effect of this engineering step to fix a problem that was unknown before the RiverNet Program. New optical measurement techniques are less expensive than the chemical measurement techniques and will allow the RiverNet program to map nitrate, Chl a and CDOM on a basin or reservoir scale. Nutrient mapping on a watershed scale can identify where contaminated surface and groundwater enters the river. The groundwater quality in these groundwater discharge zones has a direct effect upon surface water quality downstream from these regions. Nutrient mapping in lakes and drinking water reservoirs can identify sources and location of nutrient inputs and lake dynamics as the biological cascade stimulates biological productivity and biomass production. Identification of the nutrient inputs and subsequent impact on lake chemistry is crucial to remediation of contamination sources. Identification of the location and processes that discharge contaminated groundwater into the river is the crucial first step towards remediation of contaminated surface and ground waters. New optical technology can make Chl a and CDOM mapping possible with nitrate concentrations to define reach and reservoir characteristics that can be related to pollution source. These sources are dynamic and change with space and time, so high resolution data is required to identify and remediate these problems. 13
14 The progress towards watershed N flux and N mapping that the RiverNet program made this year is an important next step in evaluating and designing remediation strategies to protect our surface, estuarine and coastal water quality. By wisely using state and national resources and by emphasizing results focused on the systematic application of research based knowledge, we can expedite the timely resolution of our water quality problems and protect our invaluable water resources without economic impairment. By combining research efforts with educational outreach programs, we can train the scientists, regulators and policy makers of the future. In the end we will improve the public s understanding of water resource issues and the essential social, economic, and environmental value of local water resources for all persons and sectors of society. 14