APPENDIX A: RESOURCE PLANNING ANALYSIS
|
|
|
- Aleesha Flowers
- 5 years ago
- Views:
Transcription
1 PUBLIC DOCUMENT TRADE SECRET DATA EXCISED APPENDIX A: RESOURCE PLANNING ANALYSIS Minnesota Power has studied many options for meeting environmental regulations on Boswell Energy Center Unit 4 ( BEC4 ) and its other units including those for mercury ( Hg ), oxides of nitrogen ( NO x ), sulfur dioxide ( SO 2 ) and particulate matter ( PM ). Most recently as part of the analysis completed for the Baseload Diversification Study (Docket No. E015/RP ) Minnesota Power identified that adding environmental equipment to BEC4 to address mercury and other air toxics indicated that an investment into BEC4 would provide economic benefit for customers over the alternatives of retirement and replacement with other power supply resources. The analysis described in this Appendix will confirm how BEC4 is needed for serving Minnesota Power customers over the long term and how the BEC4 Environmental Retrofit Project ( BEC4 Project ) is the most reasonable and least-cost supply option for customers to meet the upcoming compliance requirements for the Mercury and Air Toxics Standard ( MATS ) and Minnesota s Mercury Emission Reduction Act ( MERA ) regulations. A. The BEC4 Project is Needed Minnesota Power s long-term outlook for energy and capacity needs supports Minnesota Power s decision to move forward with the BEC4 Project and to continue operating BEC4. Minnesota Power is projecting growth in both energy and demand over the next decade. Combining the projected growth with a unique mix of energy intensive customers, representing more than 50 percent of regulated sales, rely heavily on energy supply 24 hours a day to ensure their electrical needs are met, Minnesota Power has a high requirement for energy. The growing need for energy produces and maintains one of the highest utility load factors in the nation, an important consideration when evaluating alternatives to the BEC4 Project. Minnesota Power customers gain benefit from resources that are available and generating energy around the clock. Minnesota Power s largely baseload generation fleet, which includes BEC4, was put into place specifically to accommodate its energy intense customer mix and large load factors. BEC4 is and will remain a low cost and reliable generation asset capable of meeting the demands of the system safely and reliably. 1. Forecast for Demand and Energy Minnesota Power s needs analysis for the BEC4 Plan Petition is based on the Company s available published forecast of demand and energy consumption at the time of this evaluation, which was prepared in June 2012 as part of Minnesota Power s Annual Electric Utility Forecast Report 1 ( AFR ) submittal. The AFR contained several long-term scenarios for Minnesota Power s energy and demand requirements. The Wholesale and Industrial Customer Addition Forecast Scenario, which contains the addition of the Essar taconite pellet facility in Nashwauk, Minnesota, 2 was utilized as the expected outlook for the analysis. 1 Minnesota Power s Annual Electric Utility Forecast Report is submitted annually by July 1 st to the Department of Commerce Division of Energy Resources ( Department ). 2 Minnesota Power entered into a wholesale customer electric service agreement with the City of Nashwauk in large part to supply a taconite pellet making facility for Essar in the 2014 timeframe. 1
2 PUBLIC DOCUMENT TRADE SECRET DATA EXCISED APPENDIX A RESOURCE PLANNING ANALYSIS In order to capture other potential customer expansion in northeast Minnesota out into the 2020 timeframe, the Moderate Industrial Expansion forecast Scenario from the AFR 2012 was considered in the analysis as a high outlook. To gain insight to a lower load outlook, the Low Economical and Industrial Forecast Scenario from the AFR 2012 was considered. Figure 1. Summer Peak Demand Forecast Scenarios Utilized for Plan Petition illustrates the range of demand outlooks utilized in Minnesota Power s BEC4 Plan Petition and identifies Minnesota Power s expectations for customer load requirements for study period ( ). 3 Figure 1. Summer Peak Demand Forecast Scenarios Utilized for Plan Petition Minnesota Power has seen a dramatic cycle in its load requirements over the past five years. The impact of the economic downturn had significant impact on Minnesota Power s large industrial customer class. This decline was followed by a swift rebound to nearfull capability in late Planned additions by large retail customers and wholesale contract extensions out through 2019 keep Minnesota Power s long-term load growth projections at approximately 1.5 percent in the Wholesale and Industrial Customer Addition Forecast Scenario outlook. This incorporates a projection that Minnesota Power continues to achieve its 1.5 percent energy conservation obligation. Minnesota Power s Wholesale and Industrial Customer Addition Forecast Scenario system load forecast, utilized for this evaluation, has a projected 3 The econometric demand value for the Wholesale and Industrial Customer Addition Forecast Scenario plus the expected new customer from page 58 of Minnesota Power s 2012 Advanced Forecast Report was utilized as the expected demand outlook for this petition. 2
3 PUBLIC DOCUMENT TRADE SECRET DATA EXCISED APPENDIX A RESOURCE PLANNING ANALYSIS (summer) peak demand of 1,837 MW by 2020 and 1,904 MW by 2025 with the more typical 1 percent system growth rate utilized to extend the outlook to Energy requirements continue to drive Minnesota Power s supply picture, as its dominant industrial load contributes to the majority of growth being projected. The outlook for energy in the Wholesale and Industrial Customer Addition Forecast Scenario (expected outlook) reaches approximately 13,900GWh by 2020 as shown in Figure 2 Annual Energy Forecast Scenarios Utilized for the BEC4 Plan Petition. Figure 2. Annual Energy Forecast Scenarios Utilized for the BEC4 Plan Petition 2. Resources Expected to Meet Long-term Requirements Minnesota Power uses the MISO Module E Load and Capability ( L&C ) calculation 4 as one measure to assess future resource need and overall resource adequacy. The MISO L&C calculation takes into consideration Minnesota Power s load forecast, expected demand side resources, firm and participation purchases and sales, accredited generating capability and MISO s required 12 percent planning reserves. The result of the L&C calculation is a capacity surplus (or deficit) projection for each planning season. Minnesota Power is expecting a need for 4 The MISO Resource Adequacy Program identifies how capacity resources are tested to determine their installed capacity values. These values are then utilized to estimate what capacity is available to serve load on an annual basis. Minnesota Power does not utilize the Unforced Capacity (UCAP) method for long term planning as this method does not properly account for long term operational characteristics of generating resources. 3

4 PUBLIC DOCUMENT TRADE SECRET DATA EXCISED APPENDIX A RESOURCE PLANNING ANALYSIS capacity in the 2020 timeframe which is when the currently executed 250 MW Manitoba Hydro Power Purchase Agreement is implemented, helping to meet the majority of that need. Although Minnesota Power is a winter peaking utility, the Company bases its long term planning on its resource needs for the summer season L&C balance since most other regional utilities are summer peaking and, accordingly, have large winter capacity surpluses that are available for Minnesota Power to purchase at moderate prices. The resources identified to meet the summer peak season demand requirements for Minnesota Power customers in the Wholesale and Industrial Customer Addition Forecast Scenario are illustrated in Figure 3. Demand Requirements under the Wholesale and Industrial Customer Addition Forecast Scenario. The important contribution of BEC4 in meeting future demand requirements of Minnesota Power s customers 5 is clearly shown in Figure 3. Figure 3. Demand Requirements under the Wholesale and Industrial Customer Addition Forecast Scenario As outlined in the Company s most recently accepted Integrated Resource Plan (Docket No. E015/RP ) current company power supply initiatives impacting the projected capacity positions in the long-term outlook scenarios are a) the implementation of Minnesota Power s renewable plan, which incorporates 100 MW of additional wind resources in North Dakota above the current Bison 1, 2 and 3 Wind Projects 6 by 2025, b) the gradual phase-out of 5 The 100 MW increase in capacity at BEC4 in 2020 is due to the expiration of the 100 MW power sale to Basin Electric Power Cooperative. 6 The Bison 1 Wind Project was approved through Docket No. E015/M and was fully commercially operational in June 2012, the Bison 2 Wind Project was approved through Docket No. E015/M , and the 4
 lignite coal generating station in North Dakota by 2026, c) implementation of 250 MW Manitoba Hydro Power Purchase Agreement in 2020 through 2034, and the utilization of the")
5 PUBLIC DOCUMENT TRADE SECRET DATA EXCISED APPENDIX A RESOURCE PLANNING ANALYSIS 227 MW of coal-based generation from Square Butte s Milton R. Young 2 ( Young 2 ) lignite coal generating station in North Dakota by 2026, c) implementation of 250 MW Manitoba Hydro Power Purchase Agreement in 2020 through 2034, and the utilization of the wholesale market. As previously discussed, Minnesota Power also has considerable energy needs throughout the study period due to its customer load requirements creating significant load factors on its system. Figure 4. Energy Outlook Wholesale and Industrial Customer Addition Forecast Scenario is Minnesota Power s energy need outlook, which also shows the critical part BEC4 has in meeting the future energy requirements of customers. Figure 4. Energy Outlook Wholesale and Industrial Customer Addition Forecast Scenario B. Analysis Approach For the BEC4 Plan Petition, Minnesota Power used planning analysis to quantify the impact and benefit to customers of the BEC4 Project. This section contains an overview of the methods utilized to show that the BEC4 Project is the lowest cost plan when compared to other alternatives and is in the best interest of Minnesota Power customers. For purposes of discussion, the analysis is broken into three parts: Bison 3 Wind Project was recently approved through Docket No. E015/M Both Bison 2 and Bison 3 projects are planned to be operational by the end of
6 PUBLIC DOCUMENT TRADE SECRET DATA EXCISED APPENDIX A RESOURCE PLANNING ANALYSIS 1. Alternative plans considered for meeting environmental compliance requirements other than the BEC4 Project, 2. Screening of alternative resources to replace BEC4 for customers and 3. Comparative analysis between BEC4 Project and primary replacement alternatives. Minnesota Power s Baseload Diversification Report provided a rigorous system wide analysis that indicated moving forward with an air emission environmental retrofit on BEC4 would be in the best interest of customers. To ensure that the baseload diversification study results continue to be useful for comparison with the more refined BEC4 Project identified in the BEC4 Plan Petition, it is beneficial to compare the high level air emission environmental capital cost used for BEC4 in the baseload diversification study with what was used for the BEC4 Project. Minnesota Power believes the conclusions from the baseload diversification study can be referenced in the analysis for the BEC4 Project because there is little change in the capital cost used in each scenario and the air emission technology is consistent with that considered for the BEC4 Project. As a component of the three United States Environmental Protection Agency ( EPA ) Scenarios analyzed in the baseload diversification study, the capital and operating costs of the Circulating Dry Scrubber ( CDS ) technology in all three EPA Scenarios were included in the BEC4 Project analysis. The CDS capital cost assumed in the baseload diversification study scenarios is within three percent of the CDS capital cost used in the analysis for the BEC4 Project. As confirmed by the following analysis, the BEC4 Project is shown to be the lowest cost option for customers over a wide-ranging set of assumptions. A subsequent filing for cost recovery of investments and expenditures for the BEC4 Project will be submitted to the Commission for consideration and approval at a future date, but not within 60 days of submittal of the BEC4 Plan Petition (see Minn. Stat. 216B.1692). Integral to the BEC4 mercury emission reduction project, Minnesota Power will ask for cost recovery of a byproduct ash handling system ( ash system ) that poises Minnesota Power to meet future regulations on coal ash. Minnesota Power did include capital cost for ash systems to meet different levels of regulations in the three EPA Scenarios used in the baseload diversification study. The capital cost for the ash system used in the BEC4 Project analysis represents a share of the ash system capital cost used in the Stringent and More Stringent EPA Scenario from the baseload diversification study. 1. Alternatives Considered for the BEC4 Project Minnesota Power considered three alternative paths for meeting capacity and energy obligations represented by BEC4 s current production capabilities for this Plan Petition. The three paths considered were: Path a) Implement environmental retrofit for air emission control at BEC4 in 2016 the BEC4 Project, Path b) Delay BEC4 Project with temporary unit shutdown for BEC4 and build a 213 MW combustion turbine natural gas unit in the interim to help with replacement power or Path c) Shutdown BEC4 in 2016 and replace with a reasonable generation alternative(s). 6
7 PUBLIC DOCUMENT TRADE SECRET DATA EXCISED APPENDIX A RESOURCE PLANNING ANALYSIS Each of these alternatives was examined in detail through Minnesota Power s rigorous planning process, which is detailed later in this document. 2. Screening of Alternatives Resources to Replace BEC4 The analysis considered what type of alternative resources could replace the 469 MW of energy and capacity Minnesota Power receives from BEC4 to meet customer requirements under alternative path c if BEC4 were to shutdown in Minnesota Power looked at a range of alternative generating resources including renewable generation, small natural gas peaking units, and larger more efficient natural gas combined cycle generating sources. The Strategist Proview module was used to compare the alternative resources and to select the least cost replacement alternative for BEC4 in the shutdown alternative. The screening analysis demonstrated that there were two natural gas strategies that could reasonably be considered as replacement alternatives for BEC4 in Minnesota Power s generation fleet: 1) Direct Replacement: implementing a 1x1 combined cycle (408 MW) natural gas resource, a small bank of reciprocating engines and wholesale market purchases, or 2) Ownership Share Replacement: execute a strategy to procure a 469 MW share of a larger 2x1 combined cycle natural gas resource. While the smaller 1x1 combined cycle and reciprocating engine option provides a more tailored fit to Minnesota Power s shutdown option for BEC4, the share of a larger 2x1 combined cycle resource (which is typically sized around 800 MW) could provide economies of scale that Minnesota Power wanted to ensure were not overlooked as an option to replace BEC4. More details on the screening analysis conducted that resulted in these two primary replacement strategies are discussed later in this document and in Appendix A Attachment 1: Screen Results. 3. Comparative Analysis Between BEC4 and Reasonable Replacement Alternatives To verify the BEC4 Project was the best plan for Minnesota Power customers, Minnesota Power examined in greater detail alternative paths a and b to determine if they were reasonable to pursue. As will be described further in the Results section below, the delay of the BEC4 Project (alternative path b ) was deemed unreasonable to warrant continued evaluation largely due to the added cost burden and market risk it created for customers. Therefore, the remaining alternative path included the consideration of a BEC4 shutdown and determining a viable replacement alternative. The screening analysis identified two natural gas resource alternatives closest in range to the BEC4 Project, as described in item 2 above. Minnesota Power performed an economic analysis comparing cost of the BEC4 Project to the cost of each natural gas option. Minnesota Power utilized the Strategist modeling package to conduct its comparative analysis between the options. More details of the results from the comparative analysis are discussed later in the document; however, the results of the analysis indicate that the BEC4 Project provides significant benefit over the natural gas alternatives. 7

8 PUBLIC DOCUMENT TRADE SECRET DATA EXCISED APPENDIX A RESOURCE PLANNING ANALYSIS As an extension of the comparative analysis, the BEC4 Project and replacement options were then stressed under varying industry conditions to validate the robustness of the decision for Minnesota Power customers. Single variables that are critical to the electric industry were increased and decreased and the power supply costs were compared between the BEC4 Project and natural gas replacement alternatives. The stressing of variables was included in the analysis to ensure and confirm that under varying conditions the BEC4 Project was still the most reasonable and lowest cost option for customers. C. Results 1. Alternative Compliance Paths Considered for the BEC4 Project By evaluating a wide range of environmental compliance alternatives for meeting MATS and MERA regulation requirements for BEC4, Minnesota Power is helping to ensure that the most reasonable and prudent strategy is implemented for its customers. The rest of this section gives a detailed overview of the three alternative paths evaluated and provides insight in to the reasonableness of each option. a) Environmental Retrofit for BEC4 in 2016 The BEC4 Project implements environmental control technologies to meet the MATS Rule, MERA and a contemplative design for future ash regulations. The air emission technology options were narrowed down to a CDS with a fabric filter (as described in Section V). Also included as part of the BEC4 Project is the incremental cost to expand the dry ash landfill and the associated cost for handling the dry ash, which is a by-product from the CDS technology. Installation of the environmental retrofit will be complete by 2016 and the total capital cost identified for Minnesota Power s portion 7 of the BEC4 Project is $350M with $12.5M of annual O&M costs for the period ending June 30, Figure 5. Environmental Retrofit at BEC4 b) Delay BEC4 Project with a Temporary Shutdown of BEC4 and Build a 213 MW Combustion Turbine in the Interim The Delay BEC4 Project path contemplated a five year period from 2016 through 2020 in which BEC4 was not producing energy or providing capacity for Minnesota Power s system as it is shutdown awaiting an environmental retrofit after the MATS Rule deadline has passed (running the unit would put Minnesota Power out of compliance with MATS and at risk of EPA penalty until the retrofit is commissioned). 7 The cost is net of WPPI Energy s share of the BEC4 Project costs. 8


9
10 PUBLIC DOCUMENT TRADE SECRET DATA EXCISED APPENDIX A RESOURCE PLANNING ANALYSIS Figure 7. Minnesota Power Capacity Position Without BEC Five Year Shutdown A combustion turbine is a peaking resource and only provides energy during periods of high energy demand. BEC4 is a baseload type resource and provides energy 7x24 to Minnesota Power customers. Due to the difference in operation between the combustion turbine and BEC4, only a small portion of the BEC4 energy will be replaced by the combustion turbine and the remaining energy is expected to be replaced by market purchases. Figure 8 which shows the large magnitude of projected energy needed during the five year shutdown of BEC4 on average 27 percent of customer projected energy needs would be met with market purchases. 10

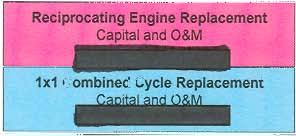
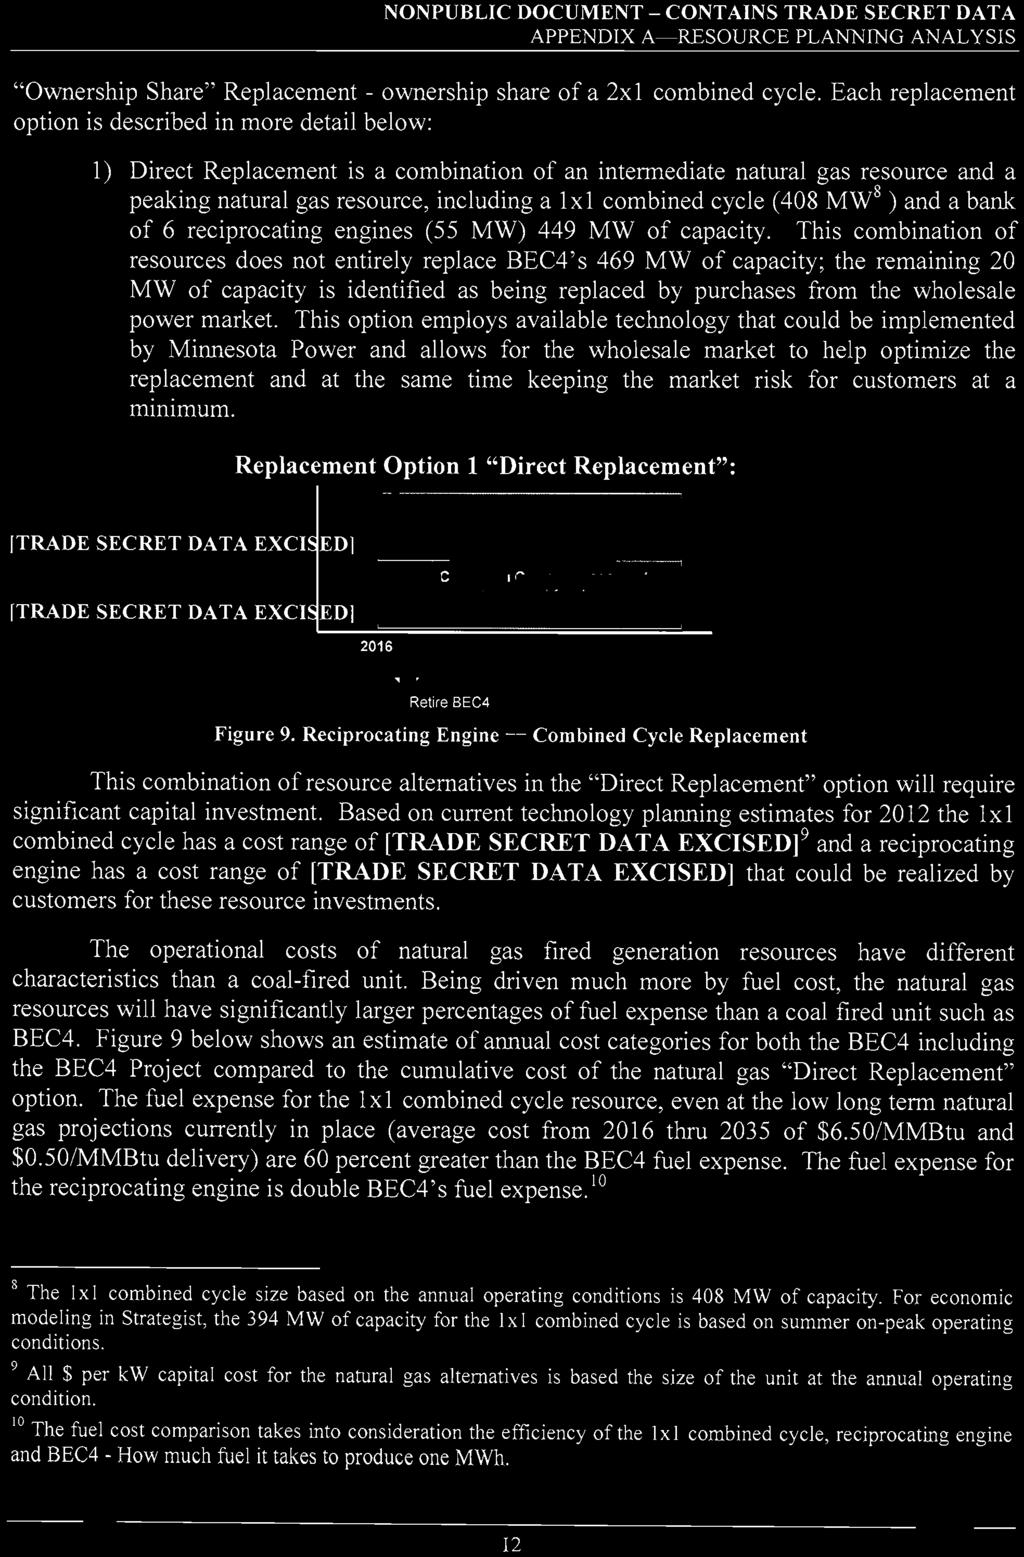
11 PUBLIC DOCUMENT TRADE SECRET DATA EXCISED APPENDIX A RESOURCE PLANNING ANALYSIS Figure 8. Minnesota Power Energy Position without BEC Five Year Shutdown The retrofit delay option shown above has significant additional costs to customers that need to be considered. The increased cost can be attributed to the continued need to meet the fixed cost obligations of BEC4 during the shutdown, the capital cost of a new combustion turbine, and the replacement power cost risk associated with procuring such a large block of energy and capacity from the market for a five year period. For these reasons, Minnesota Power did not feel it was reasonable to move forward with Delay BEC4 Project compliance path as a viable option for its customers and did not conduct further evaluation. c) Shutdown BEC4 in 2016 and Replace with Natural Gas Alternative The option to not install the emission retrofit and remove BEC4 from Minnesota Power s power supply in 2016 would require both the significant action of shutting down the largest coalfired resource in Minnesota Power s fleet and identifying a replacement resource or resources that would be able to cost effectively produce a similar energy production schedule as BEC4. A shutdown scenario for BEC4 would include decommissioning and remaining plant balance obligations and as in the baseload diversification study are considered as part of the economic analysis in this Petition. The socioeconomic costs for the host community and surrounding area would also need to be considered in the event of a temporary or permanent shutdown or repowering of BEC4. Based on the results from the screening analysis described in the Petition, there were two natural gas replacement options identified as potential reasonable alternatives: 1) Direct Replacement - 1x1 combined cycle, reciprocating engines and wholesale market purchases or 2) 11
12
 than the annual cost for the Direct")
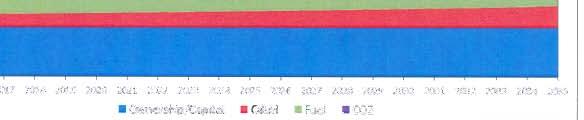
13 PUBLIC DOCUMENT TRADE SECRET DATA EXCISED APPENDIX A RESOURCE PLANNING ANALYSIS Looking at the overall annual expenditures in Figure 9, it is clear that there is an annual economic benefit of adding the BEC4 Project to BEC4 in comparison to the gas resource mix in the Direct Replacement option BEC4 s annual cost is 21 percent lower ($52 million/year) than the annual cost for the Direct Replacement option. Figure 10. Comparison of the BEC4 with the BEC4 Project to the Direct Replacement Option 11 2) Ownership Share Replacement includes implementing a replacement strategy to procure a 469 MW (or approximately 58 percent) ownership share of an 811 MW 12 2x1 natural gas combined cycle generating resource. The 58 percent ownership share represents a direct replacement of the energy and capacity retired at BEC4. The 2x1 combined cycle natural gas resource is a more efficient generating station and being a larger size can offer lower cost energy on a per megawatt basis (see Appendix A Attachment 2: Assumptions and Outlooks for more detail). However, this large generating station is a large enough resource that it is not conducive for a single entity to require the entire output. Evaluating this replacement option for the BEC4 Project assumes Minnesota Power can find a counterparty to invest in the remaining 342 MW share of the unit. By evaluating both the Direct Replacement and Ownership Share options Minnesota Power is evaluating the lowest cost natural gas resource and the next lowest natural gas option that were showing benefit in the alternative screening analysis. 11 The cost comparison assumed a baseload resource capacity factor of 80% for calculating variable O&M and fuel cost 12 The 811 MW of capacity for the 2x1 Combined Cycle is based on annual operating capability. For economic modeling in Strategist the size of the unit was derated to reflect summer on-peak operating conditions of 785 MW. 13


14
15 PUBLIC DOCUMENT TRADE SECRET DATA EXCISED APPENDIX A RESOURCE PLANNING ANALYSIS Figure 10 also identifies that the annual fixed costs for both the 2x1 combined cycle resource and BEC4 (with the BEC4 Project) are very similar; allowing the lower fuel costs of BEC4 to generate more value for the customers. There are other benefits that natural gas resources like a combined cycle or reciprocating engine can bring to Minnesota Power customers. Compared to a large baseload coal resource, like BEC4, a combined cycle or reciprocating engine has more flexible operation and can follow wind generation better than a large coal unit, especially the reciprocating engine alternative. The combined cycle is also a more efficient resource, meaning it takes less fuel than BEC4 to generate 1 MWh of energy. The greater fuel efficiency of a combined cycle equates to less fuel consumption by volume and less emissions such as mercury, SO 2, NO x and carbon when compared to a large coal unit such as BEC4. To fully evaluate the impact of integrating the replacement alternatives into Minnesota Power s system it is necessary to go to a production cost evaluation of each option that takes into consideration more of the variables that drive an implementation decision. 15 The next Comparative Analysis section will show this analysis and give additional insight on how the BEC4 Project continues to be in the best interest of customers compared to the natural gas alternatives. D. Comparative Analysis Shows BEC4 is Best Alternative The BEC4 Project provides a decisive range of benefits for Minnesota Power customers over the two natural gas replacement options; from $210 million to $373 million of savings was identified over the study period. The most significant confirmation to move forward with the BEC4 Project was to look in greater detail at the two natural gas replacement options, Direct Replacement and Ownership Share, to ensure the BEC4 Project remained the best option for Minnesota Power s customers over the long term planning horizon. Each of the natural gas alternatives were evaluated and compared against the BEC4 Project implementation at BEC4 under a range of planning sensitivities. This significant benefit along with a rigorous sensitivity analysis and validation by a third party 16 gave Minnesota Power confidence that the BEC4 Project was in the best interest of its customers. The Strategist production cost software was utilized for the study period to help quantify the expected range of impact that the BEC4 Project would bring the customer power supply costs compared with the two replacement natural gas options. 17 To ensure that only the impact of the BEC4 Project or the two replacement options were being captured in the comparative analysis, the remaining capacity and energy requirements of Minnesota Power systems over the study period were held constant in the evaluation. This 15 Minnesota Power utilized the Strategist software for its production cost evaluation of the replacement alternatives for BEC4. 16 Minnesota Power requested that PACE Global Inc, independently evaluate the BEC4 Project decision, along with the mechanics of the analysis described in this section, to ensure that moving forward was seen as prudent from a third party perspective. 17 The cost comparison was conducted under a No Energy Market and a With Energy Market condition to provide confirmation that the BEC4 Project was prudent under both resource planning assumptions. Minnesota Power utilizes a With Energy Market for its planning outlooks as the availability and flexibility that a regional market provides is an important benefit to Minnesota electric customers as resource decisions and timing are determined. For the evaluation of the BEC4 Project, both With Energy Market and No Energy Market identify that moving forward with the environmental retrofit is in the best interest of Minnesota Power s customers. 15
16 PUBLIC DOCUMENT TRADE SECRET DATA EXCISED APPENDIX A RESOURCE PLANNING ANALYSIS assumption allowed the BEC4 Project to be replaced with either natural gas replacement option interchangeably so that the Present Value of Revenue Requirements ( PVRR ) of the power supply costs could be directly compared to accurately analyze the effects of each option. 18 Typical to Minnesota Power s proactive planning process, a range of sensitivities were included in the comparative analysis to stress the BEC4 Project and its alternatives. The following is a list of the sensitivities that were stressed in both high and low conditions, and included in the comparative analysis (See Appendix A- Attachment 2: Assumptions and Outlooks for more sensitivity analysis detail): Capital cost for replacement alternatives and the BEC4 Project Delivered coal prices CO 2 regulation penalty Customer loads Market energy price Natural gas price at Henry Hub State externality values Demand side management Stringent EPA Cost for BEC4 from the Baseload Diversification Study Tables 1 and 2 provide the results of the comparative analysis for both the Direct Replacement and Ownership Share natural gas alternatives. Each demonstrate a comparison of the Strategist power supply costs, represented by the PVRR value, with the BEC4 Project and the change in those costs that occur when the two replacement options are utilized. The values are provided in the first table, Table 1 for the With Energy Market condition and then for the No Energy Market condition in Table 2. Each table includes the outcome of the series of sensitivities identified above. A negative value in the natural gas replacement option column indicates the natural gas resource alternative provides a savings to customers relative to the BEC4 Project. The sensitivities identified that there were very limited conditions where the natural gas alternatives would provide benefit to Minnesota Power s customers. When the BEC4 Project is compared to the two natural gas resource alternatives, the BEC4 Project is the lowest cost outcome for customers in a majority of the sixteen sensitivities examined in this analysis. The BEC4 Project was found to have the best performance when compared to the Direct Replacement option, including under the variety of sensitivities evaluated, providing a range of approximately $373 million in benefit to customers under the Base Case assumptions and up to $679 million in the high natural gas sensitivity. The BEC4 Project was also found to have the best performance when compared to Ownership Share replacement option, but not to the same 18 The Baseload Diversification Study indicated that BEC4, with additional air environmental retrofit technology, was in the best interest of Minnesota Power customers and part of a least cost system wide expansion plan. The comparative analysis being described gave additional merit to the findings of the Study and allowed this evaluation to concentrate on the two natural gas alternatives in comparison to the BEC4 Project. 16
17 PUBLIC DOCUMENT TRADE SECRET DATA EXCISED APPENDIX A RESOURCE PLANNING ANALYSIS magnitude of benefit as seen in the comparison to the Direct Replacement option; benefit ranged from $210 million under the Base Case assumptions and up to $530 million in a high natural gas future. This was expected as the Ownership Share replacement alternative provided Minnesota Power access to a piece/ownership share of a larger, more efficient natural gas option The difference in the benefit of the BEC4 Project when compared to the two replacement options is due to the economies of scale realized when building a large 2x1 combined cycle in Ownership Share replacement option The $ per kw capital cost of the alternatives is lower for a 2x1 combined cycle [TRADE SECRET DATA EXCISED] than the 1x1 combined cycle [TRADE SECRET DATA EXCISED] and the reciprocating engines [TRADE SECRET DATA EXCISED]. As a reminder, for the economics to work for the 2x1 combined cycle in the Ownership Share option, it is assumed Minnesota Power would be able to find a counterparty to invest in the remaining share of the large asset. Otherwise, the stranded capital and operating cost from the remaining share of the 2x1 combined cycle is the responsibility of Minnesota Power and the customers, these stranded cost were not considered in the comparative cost analysis and would identify more benefit for the BEC4 Project alternative. 17
18 PUBLIC DOCUMENT TRADE SECRET DATA EXCISED APPENDIX A RESOURCE PLANNING ANALYSIS Table 1 Strategist Scenario Cost Comparison With Energy Market Condition Strategist PVRR power supply cost comparison The BEC4 Project vs. Natural Gas Resource Alternatives With the Energy Market Outlook Table shows the increase/decrease in costs when the BEC4 Project is either replaced with the natural gas resources in Replacement Option 1 or 2 *Power Supply Costs for the BEC4 Project Alternative Change in Cost with the Direct Replacement Option Additional Cost (Less Cost) Change in Cost with the Ownership Share Replacement Option Additional Cost (Less Cost) Base $8,093,506 $373,160 $209,821 High Capital Cost $8,205,945 $406,793 $228,274 Low Capital Cost $7,981,068 $339,525 $191,371 CO2 $40 Start in 2021 $9,378,273 $89,498 ($58,624) CO2 $0 $7,501,205 $480,026 $320,155 High Coal Forecast $8,615,016 $231,830 $67,212 Low Coal Forecast $7,668,684 $513,217 $349,724 High Externality Values $8,077,939 $407,188 $246,442 Low Externality Values $7,557,853 $477,724 $315,998 Plus 50% Natural Gas Forecast $8,183,541 $679,227 $530,343 Minus 50% Natural Gas Forecast $8,046,904 ($101,094) ($292,355) High Load Forecast $8,371,828 $359,524 $197,164 Low Load Forecast $6,944,126 $369,296 $206,258 Plus 50% Wholesale Mkt Forecast $8,573,016 $355,967 $153,475 Minus 50% Wholesale Mkt Forecast $7,572,637 $291,041 $152,997 DSM Alternative 2 Combination $8,093,506 $362,640 $199,179 Stringent EPA $8,161,524 $305,142 $141,804 * Power supply costs modeled in Strategist for the study period Dollar amounts are shown in thousands and represent the present value of power supply cost is 2012 dollars over the study period As shown by the PVRR differences in Table 1, the relative cost of the BEC4 Project is highly sensitive to gas price volatility and potential future carbon regulation. Even though the low gas sensitivity indicates the potential for customer benefit with the natural gas resource alternatives when compared to the BEC4 Project, the benefit is driven by an assumption of sustained, long term low natural gas pricing that is below even the current, record low outlooks. While Minnesota Power included this sensitivity to validate this book-end condition for natural gas prices, it does not believe there is a high probability of sustained natural gas production at the levels in the Minus 50% Natural Gas sensitivity (average delivered costs of $3.50/mmbtu) to
19 PUBLIC DOCUMENT TRADE SECRET DATA EXCISED APPENDIX A RESOURCE PLANNING ANALYSIS Another key indication of the economic benefit that BEC4 brings to Minnesota Power s customers is shown above where the High (Plus 20%) Coal Forecast continued to demonstrate that the BEC4 Project was the lowest cost option compared to the two natural gas replacement options. This clarifies that if the fuel costs for BEC4 are 20 percent higher than expected, the BEC4 Project still shows a benefit for customers, relative to the replacement options. This is another strong indication of the benefit that BEC4 provides Minnesota Power s high energy consuming customers and the need for BEC4 as a baseload resource to meet ongoing energy and capacity requirements. Table 2 provides the results of the comparative evaluation under a No Energy Market condition. Similar to the comparative analysis results in the With Energy Market condition, the BEC4 Project was again found to have the best performance when compared to either the Direct Replacement or the Ownership Share natural gas replacement options. Table 2 Strategist Ccenario Cost Comparison for the With No Energy Market Condition Table shows the increase/decrease in costs when the BEC4 Project is either replaced with the natural gas resources in Replacement Option 1 or 2 Strategist PVRR Comparison The BEC4 Project vs. Natural Gas Resource Alternatives With No Energy Market Outlook *Power Supply Costs withthe BEC4 Project Change in Cost with the Direct Replacement Option Additional Cost (Less Cost) Change in Cost with the Ownership Share replacement Option Additional Cost (Less Cost) Base $8,574,928 $468,496 $172,087 High Capital Cost $8,687,366 $502,131 $190,536 Low Capital Cost $8,462,489 $434,864 $153,635 CO2 $40 Start in 2021 $10,089,566 $183,771 ($113,593) CO2 $0 $7,940,083 $595,966 $301,178 High Coal Forecast $9,175,985 $302,892 $2,566 Low Coal Forecast $8,083,382 $625,300 $329,774 High Externality Values $8,583,827 $517,044 $217,865 Low Externality Values $8,005,306 $594,312 $296,786 Plus 50% Natural Gas Forecast $8,664,963 $970,149 $670,957 Minus 50% Natural Gas Forecast $8,528,326 ($74,336) ($387,724) High Load Forecast $9,234,637 $490,920 $135,788 Low Load Forecast $7,022,990 $311,674 $165,197 Plus 50% Wholesale Mkt Forecast $8,738,524 $462,969 $166,558 Minus 50% Wholesale Mkt Forecast $8,473,738 $474,081 $177,671 DSM Alternative 2 Combination $8,574,928 $424,869 $134,039 Stringent EPA $8,642,945 $400,479 $104,069 * Power supply costs modeled in Strategist for the study period Dollar amounts are shown in thousands and represent the present value of power supply cost is 2012 dollars over the study period 19
20 PUBLIC DOCUMENT TRADE SECRET DATA EXCISED APPENDIX A RESOURCE PLANNING ANALYSIS This outcome demonstrates that under either planning assumption for the use of regional energy markets, BEC4 continues to be the superior resource for Minnesota Power s customers. While the BEC4 Project provides significant reductions of several significant air emission categories such as mercury (see Section V) Minnesota Power realizes that the BEC4 Project does not contribute to additional carbon emission reductions. However, Minnesota Power has been taking significant steps as part of its larger Integrated Resource Plan strategy and specifically its short and long term action plans over the last five years to reduce the carbon concentration on the system. Specific actions already taken include: 1) Phasing out of Minnesota Power s ownership share of Square Butte s Young 2 coalfired facility in the 2012 thru 2025 time period. 2) Adding 400 MW of wind generation to its power supply by end of 2012 including Oliver County I, II, Taconite Ridge, and Bison 1, 2, and 3 projects. 3) Purchasing 250 MW of hydro generation from Manitoba Hydro starting in ) Replacing BEC4 turbine rotors in 2010, producing 50 MW of emission and carbon free energy. Minnesota Power s resource strategy continues to identify that it will pursue additional projects like those listed that reduce the carbon concentration of its power supply. Through the BEC4 Project and continued operation of BEC4, Minnesota Power is able to balance the costs of environmental compliance and keeping a power supply that is both reasonable and reliable for its customers. 20
21 PUBLIC DOCUMENT TRADE SECRET DATA EXCISED Appendix A Attachment 1: Screening Results A. Screening of Power Generation Alternatives This appendix clarifies how Minnesota Power screened which power generation alternative(s) were included in the comparative sensitivity analysis. Both the screening and comparative sensitivity analysis were performed using Strategist. The screening was a necessary first step to reduce the comparative analysis to a direct comparison between the BEC 4 Project and one or two replacement alternatives. The replacement resource options include renewable resources, mature natural gas-fired technologies, and the developing CO 2 sequestration technology combined with mature coal-fired technology. Minnesota Power has included all committed and approved renewable projects and long-term bilateral purchases in the screening and comparative base and sensitivity cases. This includes the [TRADE SECRET DATA EXCISED]. The following list contains the set of resource technologies that were considered in the initial screening process. B. New Thermal Generation Coal-fired (with carbon capture): o Supercritical Pulverized Coal (SCPC) Natural gas-fired: o Simple Cycle Reciprocating Internal Combustion Engine (SC RICE) o Simple Cycle Combustion Turbine (SC CT) o Simple Cycle Aero Derivative (SC Aero) o Combined Cycle (CCGT) C. Renewable Generation Minnesota Power has been committed to the development of renewable resources in order to meet the RES requirements in accordance with Minnesota Statute 216B Since the filing of the 2010 Plan, Minnesota Power has committed to building 292 MW of wind generation in North Dakota by the end of 2012 (Bison 1, 2, and 3 Wind Projects). The Bison Wind Projects, along with other renewable projects Minnesota Power is committed to, have been included in the expansion plan for the analysis. A generic North Dakota wind farm (ND Wind) and new biomass technologies were included as renewable resource options in the screening process. Both have been identified as proven renewable resource options and are outlined in more detail in Appendix A Attachment 2: Assumptions and Outlooks of this report. 1
22 PUBLIC DOCUMENT TRADE SECRET DATA EXCISED Appendix A Attachment 1: Screening Results D. Demand-Side Management and Conservation (beyond current forecasts levels) Minnesota Power remains a state leader in the successful implementation of its conservation programs, and meeting and exceeding the 1.5 percent goal established by the Next Generation Energy Act. All historic and current conservation impacts that meet the 1.5 percent energy savings goal are being reflected in Minnesota Power s 2012 AFR and associated energy and demand forecasts. As part of the 2010 Resource Plan, a study was conducted to identify two additional conservation levels that create conservation opportunities above programs now in place (see Appendix B-Part 2 of the 2010 Plan). The resource option utilized in the analysis is based on the expanded conservation scenario Alternative 2 (approximately 13 MW). Minnesota Power s long-term plan identified that the 13 MW alternative was part of its least cost plan and committed to exploring additional conservation options in the future. For this screening analysis, the economic feasibility of the conservation alternative was considered as a sensitivity scenario to determine if the inclusion of additional DSM would impact the relative economic impact of the BEC4 retrofit compared to the replacement alternatives. E. Screening Analysis Results The screening analysis was performed utilizing Strategist s Proview module. For the screening, BEC4 was retired in 2016 and each replacement alternative was available for selection within Proview at a project size similar to BEC4 s summer capacity rating. For some of the alternatives, this meant more than one unit was available. Except for the already approved future bilateral purchases and renewable projects previously discussed, no other expansion plan decisions were allowed as part of the screening analysis. Each replacement alternative included the estimated capital cost, transmission, O&M (fixed and variable), fuel costs, and associated emissions. The replacement alternative selected in the least cost plan identified in Proview was a combination of a 1 x 1 CCGT and 6 x SC RICE generation resources. This combination had an approximate summer capacity of 449 MW, which is 20 MW less than BEC4 s summer capacity. Figure 1 shows the $/MWh levelized busbar cost of power at a capacity factor similar to BEC4 s typical operation for each replacement alternative considered. Note that the Wartsila unit included in Figure 1 is the manufactures name of a SC RICE technology. 2

23 PUBLIC DOCUMENT TRADE SECRET DATA EXCISED Appendix A Attachment 1: Screening Results Figure Year Option Levelized Busbar Cost Figure 1 shows that the 2 x 1 CCGT alternative has the lowest levelized busbar cost at the assumed capacity factor. However, the 2 x 1 CCGT alternative has a summer capacity rating of 785 MW which is significantly greater than the capacity of BEC4. The combination of alternatives selected in the more detailed Strategist Proview screening analysis results was closer to the output of BEC4 and represented the next lowest cost combination of resources that could provide lower cost energy. 3
24 PUBLIC DOCUMENT TRADE SECRET DATA EXCISED Appendix A Attachment 2: Assumptions and Outlooks The following section provides a summary of the key economic modeling assumptions that Minnesota Power utilized in the Strategist Proview analysis completed for the BEC4 Mercury Emission Reduction Plan Petition. A. Base Case Economic Modeling Assumptions Study Period 1. The timeframe of this analysis is 2012 thru Pricing and Wholesale Market 2. The base forecasts utilized for market energy prices, market capacity prices, CO 2 costs, and natural gas prices over the study period 1 : a. Carbon cost range: $10/tonne starting in 2021 to $25/tonne in 2035 b. NOx cost range: $632/ton starting in 2012 to $0/ton in 2035 c. SO 2 cost range: $571/ton starting in 2012 to $0/ton in 2035 d. Natural Gas at Henry Hub: $4/MMBtu in 2012 to $8/MMBtu in 2035 e. Wholesale Market Capacity: $200/MW-month in 2012 to $11,100/MW-month in 2035 f. Wholesale Market Energy: $34/MWh in 2012 to $75/MWh in The economic modeling was done in the Strategist Proview module under two broad scenarios that allowed the wholesale energy market to be turned on and off as a power supply resource. These scenarios were included to ensure the outcome of the analysis was not impacted by the availability of the regional wholesale energy market. A more detailed description of each is provided below. a. With Wholesale Energy Market ( With Market ) A conservative approach was taken when creating the wholesale energy market that would be made available as a power supply resource during the study period. To help account for the increased risk and volatility that is present when purchasing incrementally larger amounts of energy from the market, an increasing price adder was included based on the level of energy purchased. As the volume of energy purchased from the market increased, so did the price adder. This is referred to as a Tiered Energy Market and includes the following pricing assumptions: i. 0 to 150 MW at forecast price ii. 151 to 300 MW at forecast price plus $15/MWh premium adder iii. 301 to 600 MW at forecast price plus $40/MWh premium adder iv. Greater than 600 MW at emergency energy price ($250/MWh in 2012 and escalates at 2.1% annually) 1 Values are in nominal dollars 1
25 PUBLIC DOCUMENT TRADE SECRET DATA EXCISED Appendix A Attachment 2: Assumptions and Outlooks b. Without Wholesale Energy Market ( No Market ) The Tiered Energy Market was turned off starting in 2016 in this scenario and only Emergency Energy at $250/MWh was made available during the model run. As this scenario did not provide for purchasing energy from the wholesale energy market during hours of generation unit planned and forced outages, the planned outages and forced outages for Minnesota Power s generation resources were removed from the model. This scenario was included to address feedback received during Minnesota Power s 2010 Plan process and Baseload Diversification Study that identified long-term expansion plan modeling could be done with no energy procured from an energy market. 4. Wholesale market capacity was made available for the model during all modeling runs at prices identified in bullet 2e previously. Because this analysis focused on the retrofit decision at BEC4, generation expansion plans were held constant between scenarios and any capacity shortfalls were provided by short term wholesale market capacity. Generally, this amounted to approximately 200 MW of capacity by 2035 except for sensitivities around the base load forecast. Minnesota Power Resources and Power Transactions 5. [TRADE SECRET DATA EXCISED] 6. [TRADE SECRET DATA EXCISED] 7. Installation of wind capacity (Bison wind projects) is consistent across all scenarios with Minnesota Power s current renewable energy strategy. The Bison 2 and Bison 3 wind farms are installed by late 2012 and the last remaining wind farm project is included to fulfill the remaining Renewable Energy Standard requirements. 8. Natural gas supply prices reflect the projected spot market at Henry Hub with a regional delivery charge of $0.40/MMBtu for the fuel supply of all gas generation modeled in the petition. The delivery charge was escalated at 2.1% annually after The emission rates for the thermal generation units included in Strategist are modeled as tons or pounds per MMBtu of coal consumed for energy production. The level of effluents emitted per MWh generated will vary depending on the output level of a generation facility. As a generator is dispatched to a lower output level because of economic conditions the effluents emitted per MWh will increase due to the generator operating at a less optimal level when compared to running at full output. The emission rates modeled in Strategist are: a. Carbon b. Carbon Dioxide c. Lead d. Mercury e. Nitrogen Oxide f. Particulate Matter 10 g. Sodium Dioxide Minnesota Power Load and General Economic Assumptions 10. Customer energy and demand requirements are based on the Wholesale and Industrial Customer Addition Forecast Scenario in the 2012 Minnesota Power s Annual Electric utility Report. 2
26 PUBLIC DOCUMENT TRADE SECRET DATA EXCISED Appendix A Attachment 2: Assumptions and Outlooks 11. Capacity accreditation values for generators are the installed capacity (ICAP) and are based on MISO s Planning Year 4 generation performance test results per the Module E Resource Adequacy program. 12. Planning reserve margins based on MISO s required reserve margin of 11.32%. 13. The utility discount rate is the weighted average cost of capital (WACC) for Minnesota Power based on current capital structure and allowed return on equity. The utilized discount rate is 8.18%. 14. General escalation rate of 2.1% was utilized, except for capital cost and O&M for new generation which is escalated at 3% per year. B. Asset Resource Alternatives Evaluated The resource alternatives that were screened as possible replacement options for BEC4 are included below. The capital costs were based on Minnesota Power s most current planning estimates for such resources. 1. Ownership share of 200 MW natural gas 1x1 combined cycle resource a. Capital build cost plus transmission upgrade costs in 2012 dollars is [TRADE SECRET DATA EXCISED]. 2. Ownership share of 200 MW natural gas 2x1 combined cycle resource a. Capital build cost plus transmission upgrade costs in 2012 dollars is [TRADE SECRET DATA EXCISED] MW natural gas combustion turbine resource a. Capital build costs plus transmission upgrade cost in 2012 dollars is [TRADE SECRET DATA EXCISED] MW natural gas aero-derivative unit a. Capital build costs plus transmission upgrade cost in 2012 dollars is [TRADE SECRET DATA EXCISED] MW natural gas aero-derivative unit a. Capital build costs plus transmission upgrade cost in 2012 dollars is [TRADE SECRET DATA EXCISED] MW natural gas reciprocating engines (6 x 9.2 MW engines) a. Capital build costs plus transmission upgrade cost in 2012 dollars is [TRADE SECRET DATA EXCISED] MW wind farm located in North Dakota a. Capital build costs plus transmission upgrade costs in 2012 dollars is [TRADE SECRET DATA EXCISED]. 3