Institute for 21st Century Energy U.S. Chamber of Commerce
|
|
|
- Alfred Hensley
- 5 years ago
- Views:
Transcription

1 Institute for 21st Century Energy U.S. Chamber of Commerce Karen A. Harbert President and CEO Institute for 21st Century Energy U.S. Chamber of Commerce
2 What s happening in the U.S.? U. S. C h a m b e r o f C o m m e r c e Debt/Deficit Soaring Unemployment Healthcare Reform Financial Reregulation Tax Extenders/Tax Reform Trade Inaction
3 The New Energy Reality Energy Security is central to our national and economic security Demand to increase 49% by % in non-oecd countries Electricity demand to increase 76% 1.6 billion people without electricity $26 trillion of new investment by 2030 to meet rising demand 90% world s oil reserves owned by national oil companies
4 Quadrillion Btu U. S. C h a m b e r o f C o m m e r c e An Inconvenient Energy Truth Global Energy Demand To Grow 49% by Global Energy Demand by Region: 2007 &

5 What is the energy outlook in 2030? 5
6 mb/d World oil production by source U. S. C h a m b e r o f C o m m e r c e Natural gas liquids Non-conventional oil Crude oil - yet to be developed (inc. EOR) or found Crude oil - currently producing fields mb/d of gross capacity needs to be installed between 2007 & 2030 six times the current capacity of Saudi Arabia to meet demand growth & offset decline Source: IEA 2008

7 We are not running out of resources, just ACCESS to them
8 Cumulative energy-supply U. S. C investment h a m b e r o f C o m m e r c e Coal 3% $0.7 trillion Biofuels <1% $0.2 trillion Power 52% $13.6 trillion Oil 24% $6.3 trillion Gas 21% $5.5 trillion Transmission & distribution 50% Power generation 50% Shipping 4% Refining 16% Exploration and development 80% Transmission & distribution 31% LNG chain 8% Exploration & development 61% Shipping & ports 9% Mining 91% Investment of $26 trillion, or over $1 trillion/year, is needed, but the credit squeeze could delay spending, potentially setting up a supply-crunch once the economy recovers

9 America s Energy Security in Jeopardy U.S. Energy Security Risks Increasing Energy insecurity anywhere can create energy insecurity everywhere.
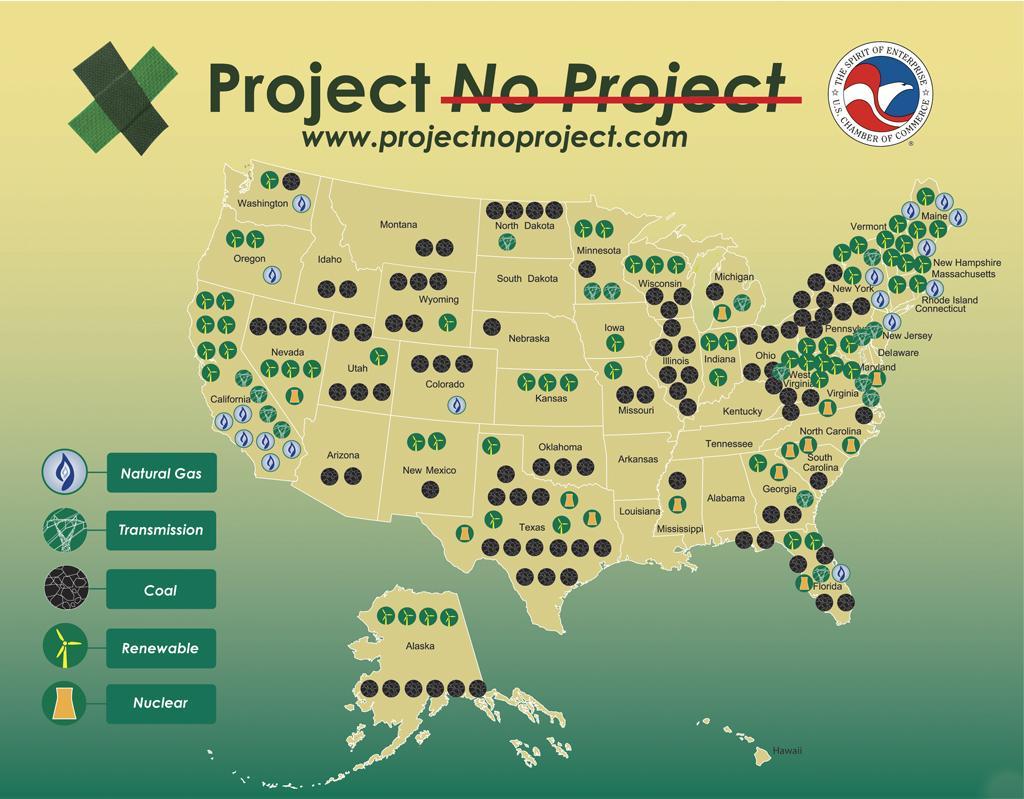
10 What s happening in the U.S.? Future of expanded oil and gas exploration? Long line of applicants at NRC New coal fired power plants stalled Impact of new natural gas finds Prospects for renewables People power? BANANA Syndrome UNPREDICTABLE INVESTMENT ENVIRONMENT
11
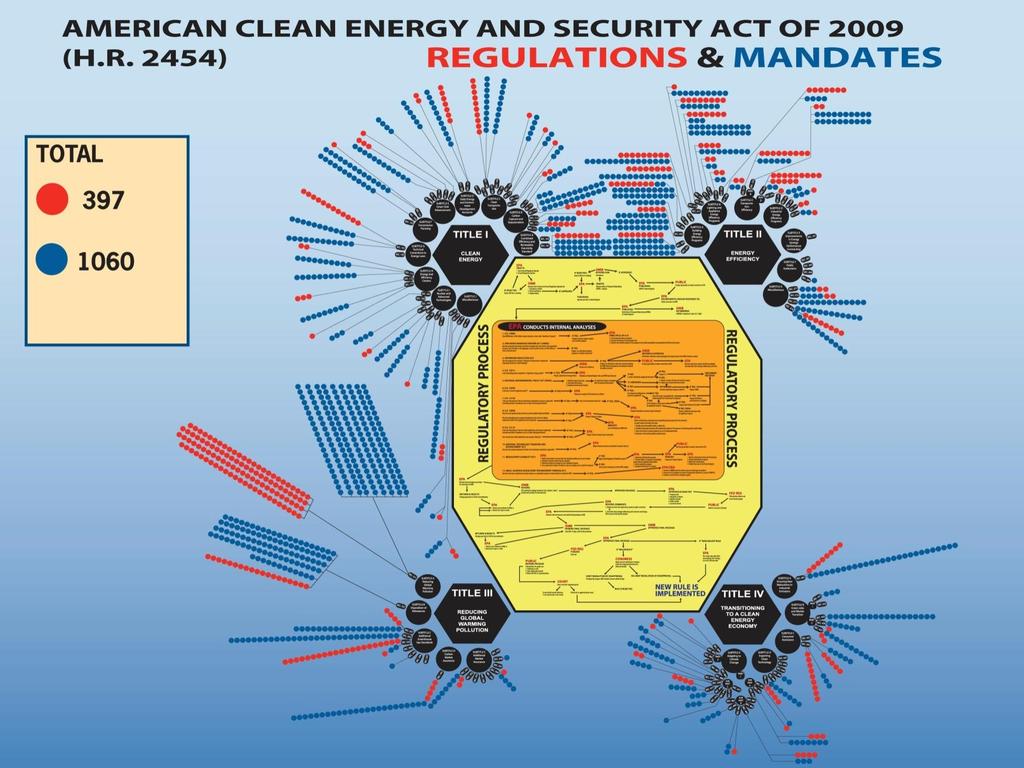
12 Changing Landscape: Climate Change Regulatory Cascade by EPA Mandatory Reporting of GHG Endangerment Finding Litigation Stampede Legislative Conundrum International Negotiation Paralysis
13 13

14 Regional Differences U. S. C h a m b e r o f C o m m e r c e As much a Regional Issue as a Partisan Issue: Regional Breakdown of Vote States whose delegations opposed H.R States whose delegations supported H.R Source: Based on roll call vote of H.R

15 Most States Lose Under H.R. 2454

16 Regional Differences: Coal U. S. C h a m b e r o f C o m m e r c e
17 Waxman-Markey s Impacts on Connecticut Increase electricity prices by up to 28% and natural gas prices by 61%. Shrink the disposable income of families by as much as $1,990 per year. Reduce gross state product by as much as $8.4 billion per year by the year Cost Connecticut as many as 23,532 jobs over the next twenty years.
 Source: Pew Research Center (January 25, 2010)")
18 Energy Action Priority for Voting Public PRIORITIES FOR CONGRESS % very important for Congress to act on The job situation America s energy needs Immigration policy Financial regulation Climate change Source: Pew Research Center & National Journal Poll (May 18, 2010) Source: Pew Research Center (January 25, 2010)
19 Scale of Changes in Global Power Sector to Achieve 50-by-50 : Capacity Additions Average Annual Power Capacity Additions to U. S. C h a m b e r o f C o m m e r c e Halve 2005 Global CO 2 Emissions by 2050: Additional Annual Investment in Electricity Sector (Compared to Baseline) to Halve Global to CO2 2050Emissions by 2050: 2010 to 2050 Coal-Fired w/ CCS Gas-Fired w/ CCS Nuclear Hydropower Biomass Wind: On-Shore Wind: Off-Shore Geothermal Photovoltaics Concentrating Solar Power MW CCS Coal-Fired Plants MW CCS Gas-Fired Plants 32 1,000-MW Nuclear Plants 1/5 Canadian Hydropower Capacity MW Biomass Plants 14,000 4-MW Turbines 3,750 4-MW Turbines MW Geothermal Units 215 million m MW CSP Plants GW/year Source: International Energy Agency, Energy Technology Perspectives 2008, Scenarios and Strategies to 2050.
20 U.S. Strategy-More Realism NO SILVER BULLET APPROACH Increase domestic oil and gas Recognize role for nuclear and clean coal New alternative transportation fuels Sustainable policy on renewables Modernize our infrastructure Exert authority to get beyond NOPE syndrome Invest in our technology solutions and our intellectual foundation for innovation Achievable Climate Approach


21 Road Ahead: Clouds on the Horizon HAVE: Growing gap between Public and Policymakers NEED: Transparent dialogue on costs and benefits of proposed policies DON T KNOW: Role of private sector vs. public sector IN JEOPARDY: America s investment climate and competitiveness ENERGYXXI.ORG JOIN US FOR A BETTER ENERGY FUTURE