Challenging Tides: Results of Delaware s Sea Level Rise Vulnerability Assessment
|
|
|
- Hope Lloyd
- 5 years ago
- Views:
Transcription

1 Challenging Tides: Results of Delaware s Sea Level Rise Vulnerability Assessment Presentation for Delaware Estuary Science Conference January, 2013

2 Potential Impacts of Sea Level Rise Permanent inundation of land and infrastructure Increased extent & severity of periodic flooding from storms Saltwater intrusion to surface water and groundwater Secondary economic, environmental & social impacts Odessa, October 16, 2009
3 Measured Sea Level Lewes, DE Global rate = 1.7 mm/yr (6.7 inches/100 years) Delaware rate (averaged) = 3.35 mm/yr (13 inches/100 years)


4 Rates of SLR are very likely to accelerate in the future

5 Delaware s Sea Level Rise Advisory Committee The goal of the Sea Level Rise Advisory Committee is to assess Delaware s vulnerability to current and future inundation problems that may be exacerbated by sea level rise and to develop a set of recommendations for state agencies, local governments, businesses and citizens to enable them to adapt programs, policies, business practices and make informed decisions.


6 A SLR Adaptation Plan for Delaware A call to Action A document that explains, informs and guides adaptation responses Guiding Principles Case Studies Build in Flexibility Outlines recommendations to to build capacity to adapt to sea level rise
.")
7 Consultation with technical experts and public Steps to an Adaptation Plan Collect Information Assess Vulnerability Develop Strategies to build capacity to adapt Adapted from NOAA (2010). Adapting to climate change: a planning guide for coastal managers
 For planning purposes")
8 Sea Level Rise Scenario Maps DNREC Planning Scenario Maps Bath-tub Model does not account for future changes in shoreline or elevation High resolution aerial photography (LiDAR) For planning purposes only

9 Vulnerability Assessment 79 resource assessments Description Exposure assessment Impact assessment Map (where possible) All resources ranked High & medium concern resources being considered for adaptation phase Potential Exposure of Underground Storage Tanks at 1.0 meter sea level rise
10 Vulnerability Assessment: Results Potentially Inundated 8-11% Total Land Area Tax assessed value $1.5 B Direct effects in all counties and 31 towns Of highest concern statewide: Industrial Areas and Port Railroads, roads and evacuation Dams and Dikes Future development areas Tourism/coastal recreation Habitats and protected lands Wells

11 Information you can use Description of potential impacts Exposure data tables Statewide exposure maps Potential secondary social, economic and environmental impacts Chris Bennett
12 Example Data Table Land Area County Total Acres Acres Inundated by SLR Scenarios Percent of Total Inundated by SLR Scenarios 0.5 m 1.0 m 1.5 m 0.5 m 1.0 m 1.5 m State 1,385, , , ,528 8% 10% 11% New Castle 278,754 25,179 29,916 33,148 9% 11% 12% Kent 510,428 50,095 57,784 63,269 6% 11% 12% Sussex 596,314 35,223 45,831 55,111 6% 8% 9% Source: USGS and Delaware Geologic Survey, State Outline (Area),

13 Example Point and Grid Maps
14 Residential 1%-5% of 346,000 addresses potentially inundated Up to 32% of manufactured homes in Sussex Up to 13% (15,000) homes in Sussex Impacts Flood damage, insurance costs, access, community Varying ability to adapt Primarily County level impact Ranked as moderate

15 Industrial Areas 16%-25% of 4,000 acres permitted by CZA potentially inundated Primary NCCo Impacts Inundation of associated structures Limited ability to relocate within state Statewide economic impact Ranked as high

16 Future Development Areas 3%-7% of 152,000 acres of Level 3 areas potentially inundated 4/5 in Sussex County Impact Reduced growth zones Challenge to redirect growth without limiting choice Statewide potential impacts for state funding, legal concerns. Ranked as high
17 Septic Systems 1% - 4% of 78,000 potentially inundated Greatest exposure found in Sussex High concentration along Inland Bays Functionality concerns before inundation Rising water tables Ranked as moderate

18 Wells Potentially inundated Domestic wells: 3% - 7% Industrial wells: 3% - 7% Irrigation wells: 1% - 2% Public wells: 2% - 10% Water supply concerns Saltwater intrusion may impact inland wells Statewide concern Ranked as high
19 Tidal & Freshwater Tidal Wetlands Tidal 97% to 99% potentially inundated Freshwater Tidal 84% to 98% statewide Highly productive systems Absorb storm surges and flooding Recreational value Future salinity changes potential issue for tidal fresh

20 Non-tidal Wetlands 8% to 12% of 163,000 acres potentially inundated Add l impacts may result from saltwater intrusion Relatively limited acreage inundated by SLR Development and Ag thought to be a more important driver of loss Ranked as low
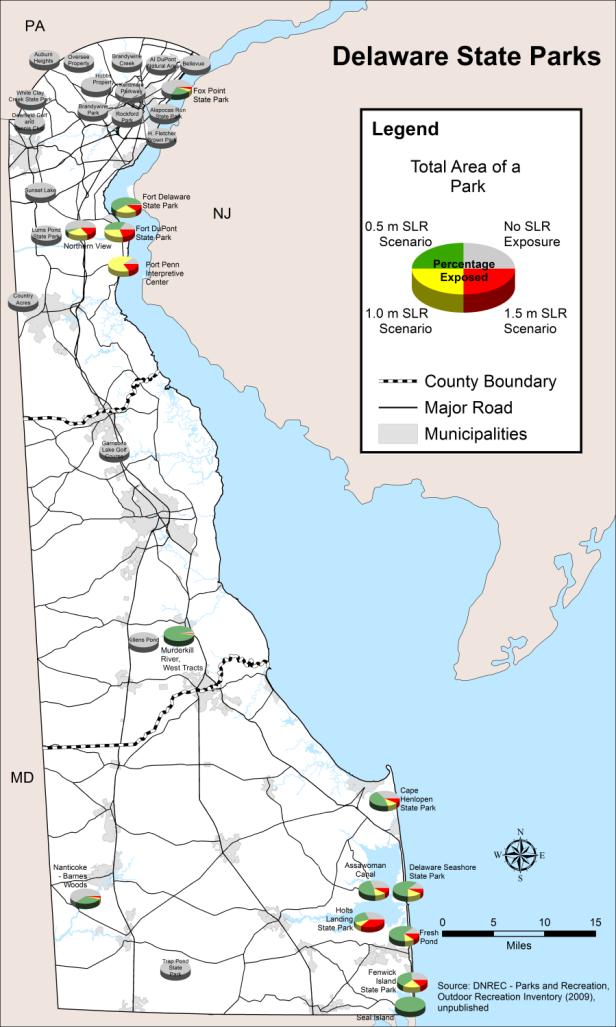
21 Protected Lands Statewide 37% to 44% statewide potentially inundated Includes State owned lands federal refuges municipal holdings public and private conservation easements Represent a variety of habitat types and outdoor recreation opportunities
22 Habitats of Conservation Concern Unique habitat types identified in the DE Wildlife Action Plan 15 of 27 HCC s exposed to SLR Of those, 55% to 65% of 31,000 acres potentially inundated HCCs have high diversity, sensitive to disturbance, harbor rare species Ranked as high
23 Intensive effort, worth the reward? Impacts from SLR can be tallied and visualized, then used to spur action Press Citizens Legislators Researchers SLRAC focusing adaptation efforts on high and moderate concern resources Can be duplicated


24 Useful Websites & Tools Statewide SLR Scenario Maps Online Viewer & GIS layers Statewide Vulnerability Assessment Digital Coast Website How tos, data downloads Grants and Technical Assistance Sign up for notices
25 Join us for Sea Level Rise Public Engagement Sessions next month! February 13 Lewes, DE February 19 New Castle, DE February 25 Dover, DE
26 Questions? Contact Info: Susan Love, Planner IV Delaware Coastal Programs