The use of Lemna minor duckweed to. remove nitrogen and phosphorous in. wastewater effluent from a decentralized treatment system (DEWATS)
|
|
|
- Candice Maxwell
- 5 years ago
- Views:
Transcription
1 IRES 2017: The use of Lemna minor duckweed to remove nitrogen and phosphorous in wastewater effluent from a decentralized treatment system (DEWATS) by Alexia Mackey California State Polytechnic University, Pomona Department of Civil Engineering In collaboration with: Chris Buckley, Natalie Mladenov, Monica Palomo, Björn Pietruschka December 21, 2017
2 ii Table of Contents page 1. ABSTRACT INTRODUCTION SETUP AND METHODS Batch experimental setup Duckweed mass measurements Batch sampling Continuous flow experimental setup Continuous flow sampling Nutrient analysis Pillow packets Accuvac AmVer-ammonia only Duckweed growth RESULTS Batch Experiment Batch Experiment Batch Experiment Batch Experiment Continuous Flow Experiment Continuous Flow Experiment DISCUSSION Batch Experiments Continuous Flow experiments CONCLUSION ACKNOWLEDGEMENTS REFERENCES. 25 APPENDICES
3 iii Table of Figures Figure 1 DEWAT system overview ( 2 Figure 2. Batch experiment setup: Triplicate tubs of Control (no duckweed), Lemna, and Mix. 3 Figure 3. Continuous flow setup: Mixed DWP, Lemna DWP, and Control pond. AF 2 influent reservoir feeds ponds using two pumps; effluent collected in buckets.. 5 Figure 4. Nutrient testing methods: cuvettes setup for testing in DR 900 colorimeter (bottom) 6 Figure 5. Pillow packet methods: timers and cuvettes setup to test nitrate, nitrite, ammonia, and phosphate. DI water and a sample are used as blanks. 7 Figure 6. Duckweed batch experiment 1 results for (a) PO 4, (b) NH 3, (c) NO 2, and (d) NO 3: natural log of nutrient concentration values graphed versus time. 9 Figure 7. Duckweed batch experiment 2 water quality results for ph, turbidity, temperature, electrical conductivity, and dissolved oxygen: values graphed over time. 10 Figure 8. Duckweed batch experiment 2 results for (a) PO4, (b) NH3, (c) NO2, and (d) NO3 : natural log of nutrient concentration values graphed versus time. 11 Figure 9. Duckweed batch experiment 3 water quality results for ph, turbidity, temperature, electrical conductivity, and dissolved oxygen: values graphed over time. 12 Figure 10. Duckweed batch experiment 3 results for (a) PO4, (b) NH3, (c) NO2, and (d) NO3: natural log of nutrient concentration values graphed versus time. 13 Figure 11. Duckweed batch experiment 4 water quality results for ph, turbidity, temperature, electrical conductivity, and dissolved oxygen: values graphed over time. 14 Figure 12. Duckweed batch experiment 4 results for (a) PO4, (b) NH3, (c) NO2, and (d) NO3: natural log of nutrient concentration values graphed versus time. 16 Figure 13. Duckweed continuous flow experiment 1 results for (a) PO4, (b) NH3, (c) NO2, and (d) NO3: natural log of nutrient concentration values graphed versus time Figure 14. Duckweed continuous flow experiment 2 water quality results for ph, turbidity, temperature, electrical conductivity, and dissolved oxygen: values graphed over time.. 19 Figure 15. Duckweed continuous flow experiment 2 results for (a) PO4, (b) NH3, (c) NO2, and (d) NO3: natural log of nutrient concentration values graphed versus time page
4 iv Table of Tables page Table 1. Duckweed batch experiment 2 biomass weight data. 10 Table 2. Duckweed batch experiment 3 biomass weight data. 12 Table 3. Duckweed batch experiment 4 biomass weight data. 15 Table 4. Duckweed continuous flow experiment 1 biomass weight data. 17 Table 5. Duckweed continuous flow experiment 2 biomass weight data. 19 Table 6 Average kinetics constants for nutrients tested during batch trials. 21 Table 7 Average kinetics constants for nutrients tested during continuous flow trials Appendices A. DR 900 TURBIDITY METHOD.. 26 B. DR 900 PILLOW PACKET AND ACCUVAC PROCEDURES.. 27 C. DR 900 AMMONIA AMVER PROCEDURE. 33 D. BATCH SYSTEM- EXPERIMENT 1 TABLES. 34 E. BATCH SYSTEM- EXPERIMENT 2 TABLES. 38 F. BATCH SYSTEM- EXPERIMENT 3 TABLES. 42 G. BATCH SYSTEM- EXPERIMENT 4 TABLES. 47 H. CONTINUOUS FLOW- EXPERIMENT 1 TABLES. 53 I. CONTINUOUS FLOW- EXPERIMENT 2 TABLES. 54
5 1 1. ABSTRACT The Decentralized Wastewater Treatment System (DEWATS) is valuable in developing countries since it allows impoverished people to handle sanitation locally. Since it is a primary treatment of wastewater, many studies have demonstrated the need to polish harmful nutrients, such as ammonia, nitrates, nitrites, and phosphates, from the effluent. Duckweed has been widely investigated for its capacity to remove these nutrients from surface water. This research investigated the effectiveness of duckweed, both Lemna minor and Wolffia arrhiza, as the polishing treatment for effluent in an operating, modularized wastewater treatment facility. Results were largely inconclusive. Ammonia removal was variable and generally ranged from 0-26% removal. Nitrate and nitrite concentrations were often below detection limits (0.3 mg/l NO3 and 2 mg/l NO2, respectively) or had very low concentrations. Phosphate concentrations in batch experiments showed an increase. While kinetics constants ranged greatly for most nutrients tested, ammonia uptake showed the most consistent uptake, ranging from to mg/l when natural logarithmic graphs were analyzed. The lack of nutrient removal over the short duration of these experiments suggests that longer residence times may be needed to determine kinetics for nutrient removal with duckweed. In addition, larger sample sizes might have yielded a trend which is absent from this study. 2. INTRODUCTION A Decentralized Wastewater Treatment System (DEWATS) rather than a centralized system could be beneficial in developing countries, as it allow locals to handle sanitation locally. This is advantageous to communities where there is a lack of action or capacity by the main governing body to construct centralized sanitation sites. Additionally, a decentralized model is less harmful to the environment and offers economic incentive to the local community, providing jobs to community members and saving them money otherwise paid to a municipal sanitation service. This research addresses a gravity driven DEWATS system constructed by BORDA (Bremen Overseas Research & Development Association) in Durban, South Africa. DEWATS (Figure 1) uses a traditional settling chamber, an anaerobic baffled reactor (ABR), and an anaerobic filter (AF) as primary treatment for wastewater. In general, eutrophication is a phenomenon involving an increased concentration of nutrients in a water body that leads to oxygen depletion. Ammonia nitrogen is one of the primary substances of the various nutrients that can lead to eutrophication (Zhang et al. 2013). Excess ammonium accelerates eutrophication in open ponds and results in nitrate formation if released into groundwater (Zhang et al. 2013; Cheng et al. 2002). These conditions can lead to a rapid deterioration of water quality, detrimental to aquatic ecology and all water bodies. Since treated wastewater discharges to surface waters and groundwater, this presents a problem for those still dependent on groundwater and downstream users.
 Unfortunately, most polishing systems, like aeration or planted gravel filters, are incredibly expensive or rely heavily on")
6 2 Figure 1 DEWAT system overview ( Unfortunately, most polishing systems, like aeration or planted gravel filters, are incredibly expensive or rely heavily on specialized technological solutions, both of which are limiting options for impoverished rural communities. While DEWATS anaerobic wastewater treatment is efficient in the removal of organic material and suspended solids, it cannot reduce nutrient concentrations in wastewater, and only partially removes pathogenic organisms (Collivignarelli et al. 1990). In Zimbabwe, algae-based waste stabilization ponds are used for wastewater treatment in most small urban areas. This is mainly because small urban centers lack the financial resources to build modern treatment systems and produce low volumes of mainly domestic wastewater (Dalu & Ndamba 2003). When faced with a similar problem in Egypt, Nasr et al. (2009) investigated the use of duckweed (Lemna minor and Wolffia arrhiza) as a polishing treatment for anaerobic baffled reactor (ABR) effluent. Duckweed has been the focus of many wastewater treatment studies due to its known ability to take up nutrients and contaminants, especially nitrogen and phosphates. This is mainly because as duckweed is harvested it removes trapped nutrients with it (Dalu & Ndamba 2003). Duckweed based WSP (Water and Sanitation Programs) are better than algae WSP due to duckweed s high nutrient removal and biological oxygen demand (BOD) reduction. Duckweed is a small, non N-fixing, angiosperm with high reproduction rates that is naturally present in nutrient rich and brackish bodies of water. Species within this plant family, Lemnaceae, are tiny and simple, and use asexual reproduction to quickly increase their numbers. This research aims to further analyze duckweed nutrient uptake kinetics (Goopy & Murray 2003). The purpose of these experiments was to construct systems in life-like conditions to

7 3 assess duckweed in a practical, applied wastewater treatment facility using simple and accessible biological methods to polish wastewater. 3. SETUP AND METHODS This chapter describes the setup and methods of the experiments conducted during this study. These include batch sampling, continuous flow sampling, and nutrient analysis Batch experimental setup Two different duckweed species were evaluated (Lemna minor and Wolffia arrhiza). Four 72 hour batch experiments were conducted in opaque plastic containers with a surface area of 0.06m 2. Final anaerobic filter (AF 2) effluent was collected from the DEWATS (Figure 1). Three containers were filled to the 3 L mark then placed in a growing tunnel at Newlands Mashu UKZN site. Figure 2 shows the batch systems for control (duckweed free, C), Lemna minor (L), and Lemna minor and Wolffia arrhiza mix (M). In the first two experiments, approximately 500g/m 2 of duckweed was added to the treated containers. In the last two batch experiments 600g/m 2 of duckweed was added to each container to achieve ideal growing conditions. Figure 2 Batch experiment setup: Triplicate tubs of Control (no duckweed), Lemna, and Mix.
8 Duckweed mass measurements In the first two experiments, duckweed was placed in a salad spinner and spun at a steady rate of 3 pumps per second for one minute. Then, approximately 30 grams were weighed on an analytical scale and added to containers with 3L of AF 2 effluent. In the last two batch and continuous flow experiments, the same process was used to measure out 36 grams of duckweed in order to achieve optimal surface density Batch sampling During the first two batch experiments, 55 ml samples were retrieved from each duckweed container at 11:00 AM using syringes. Samples were then transferred into falcon tubes for lab analysis. During the last two batch experiments, the same methods were used to retrieve samples twice per day then transferred into falcon tubes. After sampling, daily measurements of ph, electrical conductivity (EC), temperature, and turbidity were taken using handheld field probes. A handheld ph meter was used to measure ph; a YSI EC meter was used to test electrical conductivity (EC) and temperature; and method 8237 in the Hach DR900 spectrophotometer was used to determine turbidity. The specific procedure for turbidity can be found in Appendix A. In order to account for daily evapotranspiration, deionized (DI) water was added to each container with a syringe during the first three experiments. The water level was set with masking tape on the set up day. Every day evaporated water was replenished with DI water before taking the samples and measuring water quality parameters. For the final experiment, initial and final experiment volumes were recorded instead of the masking tape method Continuous flow experimental setup Two 72 hour continuous flow experiments were conducted using three 12 liter duckweed ponds (DWPs) setup in the growing tunnels of the Newlands Mashu DEWATS site (Figure 3). This model mimics the dimensions of lab-scale DWPS used in a study previously (Nasr et al. 2008). DWP 1 contained Lemna minor, DWP 2 contained a mixture of Lemna minor and Wolffia arrhiza, and DWP 3 established a control without the presence of any duckweed. To achieve ideal growing conditions 600g/m 2 of duckweed was added to DWP1 and DWP2. This surface density provided a loose coverage that prevented algal growth while providing enough space for duckweed growth. Each DWP was fed AF2 effluent from a standard pump at a flow rate of L/hr from a 25 liters influent reservoir (IR). The IR was filled with AF2 effluent twice daily, at 10:00 AM and 1:00 PM, in order to provide uninterrupted flow of effluent to continuous flow systems. A flowrate of L/hr (8L/day) was reached in order to achieve a two day hydraulic

9 5 residence time (HRT). Evapotranspiration was not accounted for in this setup due to time constraints. Figure 3. Continuous flow setup: Mixed DWP, Lemna DWP, and Control pond. AF 2 influent reservoir feeds ponds using two pumps; effluent collected in buckets Continuous flow sampling For the first two days of each experiment, 90 ml samples were retrieved from the IR twice a day, after it had been filled with fresh AF2 effluent. At the end of the two-day HRT, 90mL samples were retrieved from each DWP effluent twice a day to account for variance of effluent water quality. All bottles with sample were stored in the Newlands refrigerator to await lab analysis. Similarly to the batch reactors studies, daily measurements of ph, electrical conductivity (EC), temperature, and turbidity were taken using handheld field probes. A handheld ph meter was used to measure ph; a YSI EC meter was used to test electrical conductivity (EC) and temperature; and method 8237 in the Hach DR900 spectrophotometer was used to determine turbidity. The specific procedure for turbidity can be found in Appendix A. Measurements were done at the IR and at the DWP effluent when filled up and after sampling.
.")
10 Nutrient analysis All samples were filtered through.45 µm glass fiber filter before nutrient analysis was measured Pillow packets Nutrient analysis was conducted in the lab at Newlands Mashu UKZN site using a Hach DR 900 colorimeter/portable spectrophotometer, (Figure 4 and Figure 5). Samples were tested for concentrations of phosphate, ammonia, nitrate, and nitrite (methods 8048, 8155, 8153, and 8039, respectively). Powder pillows were used to test phosphate, ammonia, and nitrate in batch samples; nitrite was tested using this method in both batch and continuous flow systems. Figure 4. Nutrient testing methods: cuvettes setup for testing in DR 900 colorimeter (bottom). Both nitrite and nitrate tests required 20 ml of filtered sample; concentrations in undiluted samples were within the method ranges in the DR 900. In order to determine ammonia and phosphate concentrations within the ranges of the DR 900, dilutions were made in 100mL volumetric flasks pipetting 1mL of filtered sample and filling the rest with DI water. Then 10mL of that dilution were transferred to another 100mL volumetric flask and filled with DI water, making a total dilution of 1:1000. Ammonia and phosphate testing each used 20 ml of the final 1:1000 dilution.

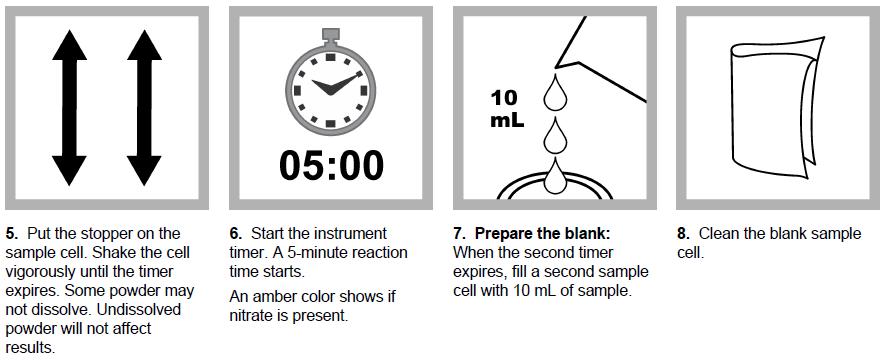
11 7 The specific procedures for each nutrient can be found in Appendix B. Figure 5. Pillow packet methods: timers and cuvettes setup to test nitrate, nitrite, ammonia, and phosphate. DI water and a sample are used as blanks AccuVac The Hach phosphate and nitrate methods using AccuVac Ampuls (methods 8048 and 8039, respectively) were used to test samples from both continuous flow experiments. In order to get phosphate concentrations within the instrument range, dilutions were made in 100mL volumetric flasks pipetting 1mL of raw, filtered sample and filling the rest with DI water, making a total dilution of 1:100. Phosphate testing used 50 ml of the final 1:100 dilution. Nitrate testing did not require dilution. The specific procedures for nitrate and phosphate can be found in Appendix B AmVer- ammonia only In order to get ammonia concentrations within the instrument range, dilutions were made in 10mL volumetric flasks pipetting 1mL of raw, filtered sample and filling the rest with DI water, making a total dilution of 1:10. Ammonia testing used 0.1mL of the final 1:10 dilution. The specific AmVer procedures for ammonia can be found in Appendix C.
12 Duckweed growth On the first day of each experiment, a majority of water was removed from the duckweed biomass using a salad spinner spun at a steady rate of 3 pumps per second for one minute. Then, approximately 30 grams were weighed on an analytical scale and added to containers with 3L of AF 2 effluent. An initial damp weight of approximately 36 grams was recorded before adding the duckweed to its respective container. On the final day of each experiment, pre-cut muslin cloth was soaked in water and then dewatered using a salad spinner. The damp weight of each muslin cloth was recorded. Duckweed was sieved from each container using a hand sieve and muslin cloth. This duckweed was then weighed using an analytical balance. The damp weight of the muslin cloth was subtracted from the total weight to compute the total damp duckweed weight. 4. RESULTS 1 Biomass weight data for batch and then continuous flow findings are presented in Tables 1-5. Figures 6, 8, 10, 12, 13, and 15 present results for (a) PO4, (b) NH3, (c) NO2, and (d) NO3: natural log of nutrient concentration values graphed versus time. Slopes of these graphs approximate kinetic constants. Figures 7, 9, 11, and 14 present results for ph, turbidity, temperature, electrical conductivity, and dissolved oxygen: values graphed over time. Although results of the first two batch trials are included here, these results are suspect and should be disregarded. Appendices D through I list the raw data for batch and continuous trials Batch Experiment 1 Batch studies were used to evaluate the change of nutrient concentration in the water due to the treatment with duckweed. Controls were used to see the water quality changes undergoing in duckweed-free conditions. This trial used 30 grams of duckweed for the experiment. Water quality was not tested for the first batch experiment. Growth rate kinetics could not be determined for the first batch experiment. Appendix D contains raw nutrient concentration tables. Figure 6 graphs the natural log of nutrient concentrations for phosphate (a), ammonia (b), nitrate (c), and nitrite (d). Phosphate (a) kinetic constants varied from /hr for control, /hr for Lemna, and /hr for mix. There is a temporary spike on the second day, an indication of non-acclimated duckweed dying and releasing phosphate before the remaining duckweed absorbed it. Ammonia (b) kinetic constants varied from /hr for control, /hr for 1 Results are plotted as first-order reactions: natural log of nutrient concentrations. Some data points are missing in the graphs because some nutrient measurements were below detection levels, and were read as zero constants.
13 9 Lemna, and /hr for mix. It seems that ammonia naturally decreased, an indication of nitrification, the biological oxidation of ammonia to nitrite. Nitrite (c) kinetic constants varied from /hr for control, /hr for Lemna, and /hr for mix. Nitrite then oxides to nitrate. Nitrate (d) kinetic constants varied from /hr for control, /hr for Lemna, and /hr for mix. Figure 6. Duckweed batch experiment 1 results for (a) PO4, (b) NH3, (c) NO2, and (d) NO3: natural log of nutrient concentration values graphed versus time Batch Experiment 2 Figure 7 displays batch experiment setup 2 results for water quality. This trial used 30 grams of duckweed for the experiment. Appendix E contains raw nutrient concentration tables. PH showed an increase over the course of the experiment, which may have been caused by an increase in temperature or carbon dioxide released from dying duckweed (see Table 1 for evidence of negative duckweed growth). Despite an initial temperature drop, over the course of the experiment, the temperature increased again. Turbidity showed a declined over the course of the experiment on its own. Based on observation, duckweed seems to have sped up the process. EC dropped the first day, a sign of duckweed effectiveness, though perhaps such a drastic initial uptake caused duckweed to die, causing EC to increase again later.
14 10 Figure 7. Duckweed batch experiment 2 water quality results for ph, turbidity, temperature, electrical conductivity, and dissolved oxygen: values graphed over time. Table 1 records biomass data for the first batch system. Negative growth was observed for the Lemna setup. Positive growth was observed for the mix setup. Table 1. Duckweed batch experiment 2 biomass weight data. Batch 2 Initial DW (g) Cloth (g) Final total (g) Final DW (g) DW growth (g) Mix Mix Mix Avg St. Dev Lemna Lemna Lemna Avg
15 11 St. Dev Figure 8 displays batch experiment setup 2 nutrient results. Phosphate (a) kinetic constants varied from /hr for control, /hr for Lemna, and /hr for mix. Ammonia (b) kinetic constants varied from /hr for control, /hr for Lemna, and /hr for mix. Nitrite (c) kinetic constants varied from /hr for control, /hr for Lemna, and /hr for mix. Not all nitrate (d) kinetic constants were analyzed, except for control with a k value of /hr and mix with a zero k value for mix. Steadier levels for duckweed setups indicate duckweed also absorbed nitrite before nitrification. Figure 8. Duckweed batch experiment 2 results for (a) PO4, (b) NH3, (c) NO2, and (d) NO3: natural log of nutrient concentration values graphed versus time Batch Experiment 3 Figure 9 displays batch experiment setup 3 water quality results. This trial used 36 grams of duckweed for the experiment. ph clearly increased over the course of the experiment when left unregulated. Literature does not explain why ph increases during duckweed growth. Turbidity clearly declined over the course of
16 12 the experiment on its own, though the duckweed seems to have sped up the process as nutrients were absorbed. Temperature could not be recorded on the third day. Temperature seems to have experienced an initial drop and recovered by the end of the experiment. EC was highest initially, due to recent agitation, followed by leveled out EC in calmer waters. Figure 9. Duckweed batch experiment 3 water quality results for ph, turbidity, temperature, electrical conductivity, and dissolved oxygen: values graphed over time. The third experiment of the batch systems did not completely weigh final duckweed biomass for the mixed duckweed species, though as seen in Table 2, Lemna lost an average of 0.4 grams. Appendix F contains raw nutrient concentration tables. Table 2 shows inconclusive results for the mix setups, and uncertain results for Lemna. Other experiments show greater indications of duckweed growth. Table 2. Duckweed batch experiment 3 biomass weight data. Batch 3 Initial DW (g) Cloth (g) Final total (g) Final DW (g) DW growth (g) Mix NA NA NA Mix NA NA NA Mix NA NA NA Avg NA NA NA
17 13 St. Dev NA NA NA Lemna Lemna NA NA NA Lemna Avg St. Dev Figure 10 displays batch experiment setup 3 nutrient results. Control batches began to grow a white, filmy, slimy growth in the water on the edges of the tubs. If this issue came from the wastewater effluent, it could explain the increase in phosphate (a) concentrations. Phosphate kinetic constants varied from /hr for control, /hr for Lemna, and /hr for mix. Duckweed continued to uptake ammonia (b), ranging from mg/l of total removal. Ammonia kinetic constants varied from /hr for control, /hr for Lemna, and /hr for mix. Negative constants indicate that the duckweed did uptake nitrite (c). Nitrite kinetic constants varied from /hr for control, /hr for Lemna, and /hr for mix. The only kinetic constant found for nitrate (d) was /hr for control. Duckweed setups had negligible concentrations since most nitrogen was absorbed by duckweed as ammonia or nitrite. Figure 10. Duckweed batch experiment 3 results for (a) PO4, (b) NH3, (c) NO2, and (d) NO3: natural log of nutrient concentration values graphed versus time.
18 Batch Experiment 4 Figure 11 displays batch experiment setup 4 water quality results. This trial used 36 grams of duckweed for the experiment. ph clearly increased over the course of the experiment when left unregulated. Literature does not explain why ph increases during duckweed growth. Turbidity clearly declined over the course of the experiment, though the duckweed seems to have sped up the process as nutrients were absorbed. There is an initial temperature decline followed by an increase. EC was highest initially, due to recent agitation, followed by leveled out EC in calmer waters. This follows a similar trend to that of the previous experiment, Batch Experiment 3. During batch experiment 3, Lemna duckweed grew an average of 8.6 grams over four days, while the mixed Lemna and Wolffia grew 1.1 grams, as seen in Table 3. Inconsistency in results are due to human error. Appendix G also contains raw nutrient concentration tables. Figure 11. Duckweed batch experiment 4 water quality results for ph, turbidity, temperature, electrical conductivity, and dissolved oxygen: values graphed over time. Table 3 shows positive average growth for both Lemna and mix setups. This indicates that duckweed is well suited for wastewater polishing in batch systems.
19 15 Table 3. Duckweed batch experiment 4 biomass weight data. Batch 4 Initial DW (g) Cloth (g) Final total (g) Final DW (g) DW growth (g) Mix Mix Mix Avg St. Dev Lemna Lemna Lemna Avg St. Dev
20 16 Figure 12 displays batch experiment setup 4 nutrient results. Control batches began to grow a white, filmy, slimy growth in the water on the edges of the tubs. If this issue came from the wastewater effluent, it could explain the strange phosphate (a) and ammonia (b) concentrations. Phosphate kinetic constants varied from /hr for control, /hr for Lemna, and /hr for mix. Ammonia kinetic constants varied from /hr for control, /hr for Lemna, and /hr for mix. Lemna had the most stable results, while mixed duckweed and control were more susceptible to change from the effluent growth. The higher concentrations of nitrite (c) indicate an excess of nitrogen as ammonia. Nitrite kinetic constants varied from /hr for control, /hr for Lemna, and /hr for mix. As duckweed is not as effective at absorbing nitrate (d), the increase in concentrations is an indication of nitrification. Nitrate kinetic constants varied from /hr for control, /hr for Lemna, and /hr for mix. Figure 12. Duckweed batch experiment 4 results for (a) PO4, (b) NH3, (c) NO2, and (d) NO3: natural log of nutrient concentration values graphed versus time.
21 Continuous Flow Experiment 1 Continuous flow experiments were conducted to mimic real life conditions in a wastewater treatment process, and should therefore be more beneficial for future use. Appendix H contains raw nutrient concentration tables. Water quality analyses for the first continuous flow experiment were not obtained. During continuous flow experiment 1, Lemna duckweed grew 20.9 grams over four days, while the mixed Lemna and Wolffia lost 13 grams, as seen in Table 4. Table 4 indicates positive growth for the Lemna setup, but negative growth for the mixed setup. This could be a result of Wolffia not adapting well to wastewater conditions. Table 4. Duckweed continuous flow experiment 1 biomass weight data. Continuous 1 Initial DW (g) Cloth (g) Final total (g) Final DW (g) DW growth (g) Mix Lemna
22 18 Figure 13 displays continuous flow experiment setup 1 nutrient results. Phosphate (a) kinetic constants varied from /hr for control, /hr for Lemna, and /hr for mix. While the control had an increase of phosphate concentration, setups with duckweed may have mitigated excess phosphate. The white filmy substance originated in this week (concurrent with Batch Experiment 3). The greater negative constants indicate that the duckweed did uptake ammonia (b). Ammonia kinetic constants varied from /hr for control, /hr for Lemna, and /hr for mix. Nitrite (c) also experienced nitrification as well as some uptake by duckweed. Nitrite kinetic constants varied from /hr for control, /hr for Lemna, and /hr for mix. Nitrate (d) kinetic constants varied from /hr for control, /hr for Lemna, and /hr for mix. Nitrate concentrations were negligible. Figure 13. Duckweed continuous flow experiment 1 results for (a) PO4, (b) NH3, (c) NO2, and (d) NO3: natural log of nutrient concentration values graphed versus time Continuous Flow Experiment 2 Figure 14 displays continuous flow experiment setup 2 results for water quality. Appendix I contains raw nutrient concentration tables. Fortunately ph remained fairly regular, indicating a more stable system that batch experiments. Influent turbidity was more variable with fresh AF 2,
23 19 but the turbidity stabilized once the water entered the system, which is consistent with the settling theory. Temperature remained fairly constant throughout the experiment as steady flow maintained a uniform temperature. EC was greatest in the first influent reservoir (IR), as it experienced the most agitation. The following two days taken from the DWPs had calmer waters, and therefore less EC. Figure 14. Duckweed continuous flow experiment 2 water quality results for ph, turbidity, temperature, electrical conductivity, and dissolved oxygen: values graphed over time. During continuous flow experiment 2, Lemna duckweed lost 29.7 grams over four days, while the mixed Lemna and Wolffia lost 16.4 grams, as seen in Table 5. As seen in Table 5, both Lemna and mix trials did not shown duckweed growth, implying that some factor killed duckweed. Table 5. Duckweed continuous flow experiment 2 biomass weight data. Continuous 2 Initial DW (g) Cloth (g) Final total (g) Final DW (g) DW growth (g) Mix Lemna Figure 15 displays continuous flow experiment setup 2 nutrient uptake results. The white filmy substance remained in the system during in this week (concurrent with Batch Experiment 4). This may explain the erratic phosphate (a) results. Phosphate kinetic constants varied from
24 /hr for control, /hr for Lemna, and /hr for mix. Ammonia (b) kinetic constants varied from /hr for control, /hr for Lemna, and /hr for mix. Once again, negative constants indicate that the duckweed did uptake ammonia (b), even as ammonia in the control setup naturally declined, indication of nitrification. Nitrite (c) kinetic constants varied from /hr for control, /hr for Lemna, and /hr for mix. Nitrite also experienced nitrification as well as some uptake by duckweed, indicated by deeper slope of duckweed setups. Nitrate (d) kinetic constants varied from /hr for control, /hr for Lemna, and /hr for mix. Figure 15. Duckweed continuous flow experiment 2 results for (a) PO4, (b) NH3, (c) NO2, and (d) NO3: natural log of nutrient concentration values graphed versus time. 5. DISCUSSION Due to inconsistent procedures and a change in the amount of duckweed in the first two batch trials, the results from these two trials are suspect and not equivalent to the last two batch trials or the continuous flow trials.
25 21 In the last two weeks of batch setup, the controls developed a white, filmy, slimy growth in the water on the edges of the tubs. This may have affected nutrient concentrations, and may have been caused by improper cleaning, or simply an abnormality within the DEWATS system. 5.1 Batch Experiments Kinetics constants shown in Table 6 were read from slopes of batch trial nutrient removal graphs. Ammonia had roughly similar kinetics constants, while all other nutrients seemed entirely random. Duckweed senescence may have contributed to higher nutrient concentrations and should be considered in future designs. Over the time intervals of experiments, decreased concentrations were only observed for ammonia. Phosphate concentrations increased in batch systems, indicating a lack of effectiveness by duckweed for removal. Table 6. Average kinetics constants for nutrients tested during batch trials. PHOSPHATE Control Lemna Mix NITRITE Control Lemna Mix Batch Batch Batch Batch Batch Batch Batch Batch AMMONIA Control Lemna Mix NITRATE Control Lemna Mix Batch Batch Batch Batch NA Batch Batch NA NA Batch Batch Continuous Flow Experiments Kinetics constants shown in Table 7 were read from slopes of nutrient removal graphs. Ammonia, nitrate, and nitrite had roughly similar kinetics constants, while phosphate seemed entirely random.
26 22 Over the time intervals of experiments, Lemna generated negative kinetic constants for phosphate, both duckweed strains generated negative kinetic constants for ammonia, and the mix generated negative kinetic constants for nitrite. The nitrification process may explain the increase in nitrate concentration for controls. Nutrient concentrations for phosphate, ammonia, nitrite, and nitrate are shown in Appendices D- I. Continuous flow systems showed little and irregular changes in nutrients concentrations. Table 7. Average kinetics constants for nutrients tested during continuous flow trials. PHOSPHATE Control Lemna Mix NITRITE Control Lemna Mix Cont Cont Cont Cont AMMONIA Control Lemna Mix NITRATE Control Lemna Mix Cont Cont Cont Cont Cedergreen and Madsen (2002) studied the nitrogen uptake by Lemna minor and found that the species grows in a source mixed with ammonium (NH4 + ) and nitrate (NO3 + ) at a 1:1 ratio. The duckweed preferentially took up NH4 +, particularly at low nitrogen availability. This may explain the relative persistence of ammonia constants. Zhang et al. (2013) also claims that duckweed preferentially absorbs ammonia rather than nitrate because nitrogen in ammonia form is transformed directly to plant protein, rather than being assimilated and subsequently reduced, as in the case of nitrate (El-Shafai et al. 2007). Results did support this hypothesis to some extent. As ammonia concentrations decreased, nitrite and nitrate concentrations increased, indicating that nitrification occurred. Changes in conditions throughout the day could explain variations, as conditions like temperature affect nitrification and denitrification processes. Electrical conductivity gives an indication of the mineral ion content of water. The parameter does not however give an indication as to which ions might be present. High levels of conductivity would indicate that there is a wide range of mineral ions in the wastewater that could be a problematic during treatment (Dalu & Ndamba 2003). In the present experiments, consistent procedures were established by batch trials 3 and 4, and those water quality measurements offer the most reliable data. EC levels between these trials are similar. However, EC tested in the second continuous flow trial had quite the opposite trend to those of batch trials. It is reasonable to conclude that a difference in system type affects EC, as one allows settlement while the other is constantly disturbed. There has been little prior research correlating EC with duckweed uptake of nutrients. Iqbal et al. (2017) conducted batch experiments correlating EC
27 23 with duckweed growth. They reported that after 25 days of retention time of duckweed on leachate, maximum removal of nutrients and COD and duckweed growth was observed at 1,000 µs/cm EC of the leachate. Growth rate and nutrient & COD removal efficiency decreased with an increase or decrease in EC, and higher EC levels yielded greater reduction in growth rates and duckweed removal efficiency. Each experiment applied an HRT of four days. This aligns with the recommendations of Körner and Vermaat (1998) based on their experiments, wherein Lemna gibba acclimated to undiluted wastewater (replaced once per week) in plastic trays ( cm) for 3 months before starting batch trials. Trials lasted for 3 days because previous experiments had shown that approximately 80% of the removal was already reached within this period in the applied systems. However, other researchers suggest that this may not have been sufficient time for duckweed to polish wastewater effluent. Nasr et al. (2009) operated duckweed ponds as post-treatment at 10 days and 15 days. They noted that a 15-day HRT gave the best results and removed 73.4% of nitrogen and 65% of phosphorus. El-Shafai et al. (2007) stated that while a duckweed treatment system is not strongly temperature dependent at high HRT, it may be affected by temperature at low HRT. It is reasonable to conclude that the scattered temperatures for the experiments in this study may have affected duckweed nutrient removal. The mixture of Lemna with Wolffia had little to no effect on the nutrient uptake. Many times the mix experiment had the same effect as the control or the pure Lemna. It seems that there was some nutrient uptake by duckweed in all experiments. The data indicate that high dilutions did not yield accurate results. Other methods with wider instrument ranges to measure nutrients are recommended for future studies. Additionally, experiments with longer hydraulic residence times (exceeding 96 hours) could yield better results, especially if more samples were consistently taken at the same time each day. Nutrient analysis of the duckweed biomass itself would also yield further insight into duckweed effectiveness. Further studies could also investigate duckweed polishing wastewater, and then being used as a fertilizer or stockfeed. Prior studies have noted the high protein content of such duckweed (Lasfar et al. 2007; Nasr et al. 2009; Zhang et al. 2013). 6. CONCLUSION Over the time intervals of these experiments, decreased nutrient concentrations were only observed for ammonia. Phosphate concentrations increased in batch systems, indicating a lack of effectiveness by duckweed for removal. Continuous flow systems showed no change in nutrients concentrations. Overall, results were inconclusive and distinct trends could not be identified. The end results for the present studies demonstrated that duckweed did minimal, if any, polishing of wastewater. There should be further studies with longer hydraulic residence times and more frequent water quality and nutrient removal readings to further prove or disprove the hypothesis that duckweed is an effective polishing treatment for DEWATS effluent. The sample size should
28 24 increase from three to at least 20 in order to capture trends. The study should also be replicated at other DEWATS sites around the world to test duckweed effectiveness in different climate conditions and DEWATS efficiencies. If these results could be obtained, it would greatly contribute to effective sanitation for impoverished communities. 7. ACKNOWLEDGEMENTS Pardon Muchaonyerwa, for the supply of duckweed and invaluable expertise. Alfred Odindo, without whose help none of this would have been possible. And team members, Kevin Clack, Siphosakhe Mdluli, Vuyisile Muthwa, and Zoluntu Ngwane, for supportive team collaboration. Special thanks to Bheki Mthembu, Lauren Steinberg, Zoë Orandle, William Musazuwa, the Pollution Research Group (PRG), Thabiso Zikalala, and Merlien Reddy for much needed assistance in the lab, moral support, and DI water.
29 25 8. REFERENCES Cedergreen, N., and Madsen, T. V Nitrogen uptake by the floating macrophyte Lemna minor. New Phytologist, 155(2), Cheng, J., Landesman, L., Bergmann, B., Classen, J., and Howard, J Nutrient removal from swine lagoon liquid by Lemna minor Transactions of the Asae Online, 45(4), Collivignarelli G, Farneti A, Bassetti A, and Barbaresi U Anaerobic aerobic treatment of municipal wastewaters with full-scale UASB and attaches biofilm reactors. Water SciTechnol 22(1/2): Dalu, J. M. and Ndamba, J Duckweed based wastewater stabilization ponds for wastewater treatment (a low cost technology for small urban areas in Zimbabwe). Physics and Chemistry of the Earth, Parts A/B/C, 28(20), El-Shafai, S. A., El-Gohary, F. A., Nasr, F. A., Van Der Steen, N. P., and Gijzen, H. J Nutrient recovery from domestic wastewater using a UASB-duckweed ponds system. Bioresource Technology, 98(4), Goopy, J.P., and Murray, P.J A review on the role of duckweed in nutrient reclamation and as a source of animal feed. Asian-Australasian Journal of Animal Sciences, 16(2), Iqbal, J., Saleem, M., and Javed, A Effect of electrical conductivity (EC) on growth performance of duckweed at dumpsite leachate. International Journal of Science, Environment and Technology, 6(3). Körner, S., and Vermaat, J. E The relative importance of Lemna gibba L., bacteria and algae for the nitrogen and phosphorus removal in duckweed-covered domestic wastewater. Water Research, 32(12), Lasfar, S., Monette, F., Millette, L., and Azzouz, A Intrinsic growth rate: a new approach to evaluate the effects of temperature, photoperiod and phosphorus nitrogen concentrations on duckweed growth under controlled eutrophication. Water research, 41(11), Nasr, F., Doma, H., and Nassar, H Treatment of domestic wastewater using an anaerobic baffled reactor followed by a duckweed pond for agricultural purposes. The Environmentalist, 29(3), Wanasen, S Upgrading conventional septic tanks by integrating in-tank baffles. Thesis. EV Zhang, K., Chen, Y., Zhang, T., Zhao, Y., and Shen, Y The logistic growth of duckweed (Lemna minor) and kinetics of ammonium uptake. Environmental Technology, 1-6.

30 26 APPENDIX A. DR 900 TURBIDITY METHOD


31 27 APPENDIX B. DR 900 PILLOW PACKET AND ACCUVAC PROCEDURES


32 28


33 29

34 30

35 31


36 32


37 33 APPENDIX C. DR 900 AMMONIA AMVER PROCEDURE
38 34 APPENDIX D. BATCH SYSTEM- EXPERIMENT 1 TABLES Table 8. Duckweed batch experiment 1 - raw nutrient concentration data. DR 900 Colorimeter- AF 2- Mladenov July 10- Day 1 Control Avg St. Dev. nd NO2 (mg/l) nd NO3 (mg/l) :1,000 NH3 (mg/l) times dilution factor NH3 (mg/l) :1,000 PO4 (mg/l) times dilution factor PO4 (mg/l) Lemna Avg St. Dev. nd NO2 (mg/l) nd NO3 (mg/l) :1,000 NH3 (mg/l) times dilution factor NH3 (mg/l) :1,000 PO4 (mg/l) times dilution factor PO4 (mg/l) Mix Avg St. Dev. nd NO2 (mg/l) nd NO3 (mg/l) :1,000 NH3 (mg/l) times dilution factor NH3 (mg/l) :1,000 PO4 (mg/l)
39 35 times dilution factor PO4 (mg/l) July 11- Day 2 Control Avg St. Dev. nd NO2 (mg/l) nd NO3 (mg/l) :1,000 NH3 (mg/l) times dilution factor NH3 (mg/l) :1,000 PO4 (mg/l) times dilution factor PO4 (mg/l) Lemna Avg St. Dev. nd NO2 (mg/l) nd NO3 (mg/l) :1,000 NH3 (mg/l) times dilution factor NH3 (mg/l) :1,000 PO4 (mg/l) times dilution factor PO4 (mg/l) Mix Avg St. Dev. nd NO2 (mg/l) nd NO3 (mg/l) :1,000 NH3 (mg/l) times dilution factor NH3 (mg/l) :1,000 PO4 (mg/l) times dilution factor PO4 (mg/l) July 12- Day 3 Control Avg St. Dev.
40 36 nd NO2 (mg/l) nd NO3 (mg/l) :1,000 NH3 (mg/l) times dilution factor NH3 (mg/l) :1,000 PO4 (mg/l) times dilution factor PO4 (mg/l) Lemna Avg St. Dev. nd NO2 (mg/l) nd NO3 (mg/l) :1,000 NH3 (mg/l) times dilution factor NH3 (mg/l) :1,000 PO4 (mg/l) times dilution factor PO4 (mg/l) Mix Avg St. Dev. nd NO2 (mg/l) nd NO3 (mg/l) :1,000 NH3 (mg/l) times dilution factor NH3 (mg/l) :1,000 PO4 (mg/l) times dilution factor PO4 (mg/l) July 13- Day 4 Control Avg St. Dev. nd NO2 (mg/l) nd NO3 (mg/l) :1,000 NH3 (mg/l)
41 37 times dilution factor NH3 (mg/l) :1,000 PO4 (mg/l) times dilution factor PO4 (mg/l) Lemna Avg St. Dev. nd NO2 (mg/l) nd NO3 (mg/l) :1,000 NH3 (mg/l) times dilution factor NH3 (mg/l) :1,000 PO4 (mg/l) times dilution factor PO4 (mg/l) Mix Avg St. Dev. nd NO2 (mg/l) nd NO3 (mg/l) :1,000 NH3 (mg/l) times dilution factor NH3 (mg/l) :1,000 PO4 (mg/l) times dilution factor PO4 (mg/l)
42 38 APPENDIX E. BATCH SYSTEM- EXPERIMENT 2 TABLES Table 9. Duckweed batch experiment 2 - raw nutrient concentration data. DR 900 Colorimeter- AF 2- Mladenov July 17- Day 1 Control Avg St. Dev. nd NO2 (mg/l) nd NO3 (mg/l) :1,000 NH3 (mg/l) times dilution factor NH3 (mg/l) :1,000 PO4 (mg/l) times dilution factor PO4 (mg/l) Lemna Avg St. Dev. nd NO2 (mg/l) nd NO3 (mg/l) :1,000 NH3 (mg/l) times dilution factor NH3 (mg/l) :1,000 PO4 (mg/l) times dilution factor PO4 (mg/l) Mix Avg St. Dev. nd NO2 (mg/l) nd NO3 (mg/l) :1,000 NH3 (mg/l) times dilution factor NH3 (mg/l) :1,000 PO4 (mg/l)
43 39 times dilution factor PO4 (mg/l) July 18- Day 2 Control Avg St. Dev. nd NO2 (mg/l) nd NO3 (mg/l) :1,000 NH3 (mg/l) times dilution factor NH3 (mg/l) :1,000 PO4 (mg/l) times dilution factor PO4 (mg/l) Lemna Avg St. Dev. nd NO2 (mg/l) nd NO3 (mg/l) :1,000 NH3 (mg/l) times dilution factor NH3 (mg/l) :1,000 PO4 (mg/l) times dilution factor PO4 (mg/l) Mix Avg St. Dev. nd NO2 (mg/l) nd NO3 (mg/l) :1,000 NH3 (mg/l) times dilution factor NH3 (mg/l) :1,000 PO4 (mg/l) times dilution factor PO4 (mg/l) July 19- Day 3 Control Avg St. Dev.
44 40 nd NO2 (mg/l) nd NO3 (mg/l) :1,000 NH3 (mg/l) times dilution factor NH3 (mg/l) :1,000 PO4 (mg/l) times dilution factor PO4 (mg/l) Lemna Avg St. Dev. nd NO2 (mg/l) nd NO3 (mg/l) :1,000 NH3 (mg/l) times dilution factor NH3 (mg/l) :1,000 PO4 (mg/l) times dilution factor PO4 (mg/l) Mix Avg St. Dev. nd NO2 (mg/l) nd NO3 (mg/l) :1,000 NH3 (mg/l) times dilution factor NH3 (mg/l) :1,000 PO4 (mg/l) times dilution factor PO4 (mg/l) July 20- Day 4 Control Avg St. Dev. nd NO2 (mg/l) nd NO3 (mg/l) :1,000 NH3 (mg/l)