LBS : quantifying the role of ecosystems for mitigating impacts
|
|
|
- Hope Briggs
- 5 years ago
- Views:
Transcription

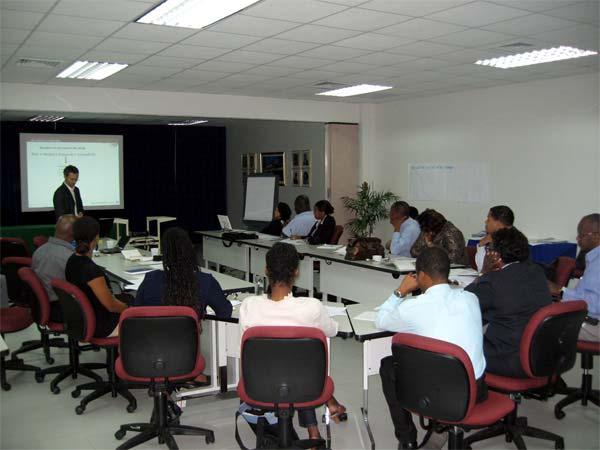
1 First LBS STAC Meeting LBS : quantifying the role of ecosystems for mitigating impacts Aruba, 5-7 June 2012 Peduzzi, PhD Global Change & Vulnerability Unit UNEP/GRID-Geneva


2 UNEP/GRID-Geneva Global Change & Vulnerability Unit Global Change & Vulnerability Unit Dr P. Peduzzi C.Herold B. Chatenoux Dr A. De Bono Dr G.Giuliani Spatial analysis (GIS) Statistical analysis Image analysis Data (SDI) Field data collection Maps & Info PREVIEW Environment impacts assessments, risk modelling, change detection Role of ecosystems & climate change.
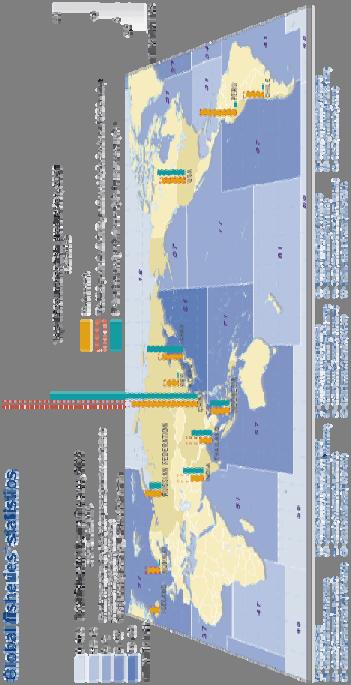
3 1. Main threats

4 Deforestation 13 million ha / year globally

5 Deforestation 13 million ha / year globally

6 Deforestation and soil erosion

7 Conversion of coastal ecosystems e.g. shrimps and fish farms in Mangroves

8 Conversion of coastal ecosystems e.g. shrimps and fish farms in Mangroves

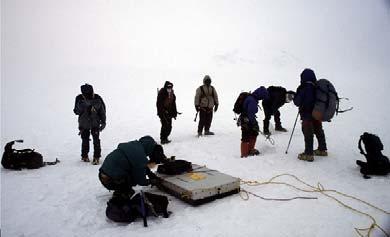
9 Climate change Global warming and related threats: e.g. Glacier retreat is contributing to sea level rise.

10 Climate change Global warming and related threats: e.g. Glacier retreat is contributing to sea level rise.

11 Polar ice is contributing to reflecting sun s rays. 1979
12 Global warming: with the reduction of arctic ice area, albedo decrease, contributing to warming up oceans temperature, thus to sea level rise through water dilatation. 2007
13 Sea level rises faster than expected Expected to reach: cm by 2100


14 Ocean acidification Increased CO 2 concentration continues to affect our atmosphere, resulting in global warming and climate change. Less well known is that this carbon dioxide is altering the chemistry of the surface oceans and causing them to become more acidic. Ocean acidification could have significant consequences on marine organisms which may alter species composition, disrupt marine food webs and ecosystems and potentially damage fishing, tourism, food security and other human activities connected to the seas.

15 Climate change: Forecasted Tropical cyclones changes in frequency and intensity as of 2030 Data sources: Knutson et al In Peduzzi et al. Nature Climate Change, 2012

16 Pressure from tourism activities


17 Significant developments on coastal areas, pressure ecosystems, reduces their services, increases sedimentation and pollutants e.g. from sewages


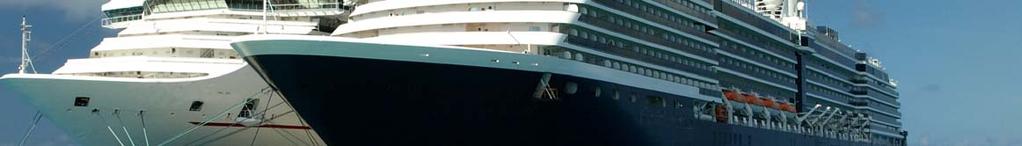
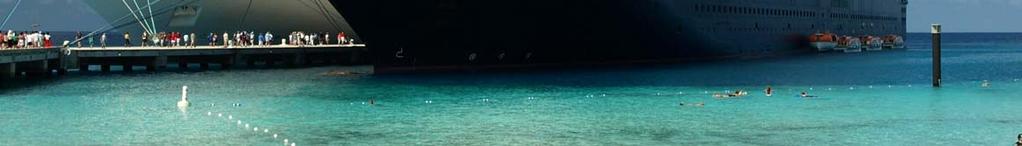
18 Digging access for cruise ships


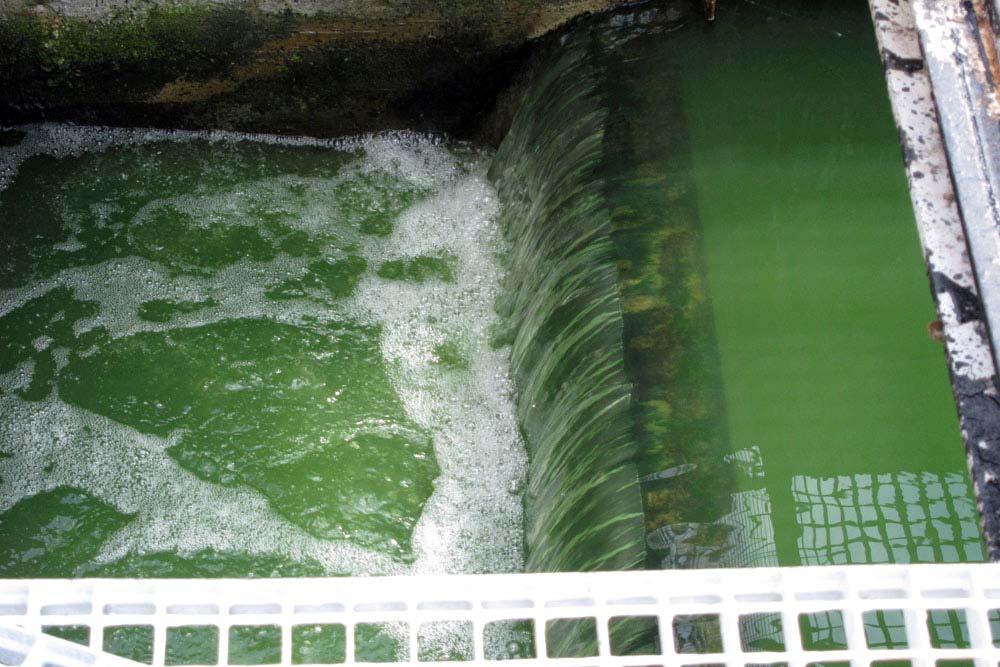
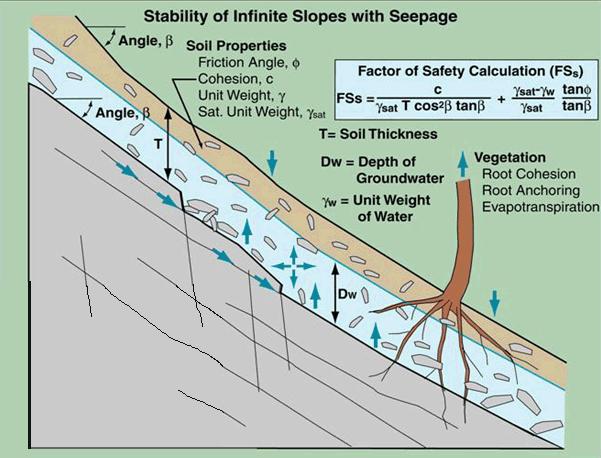
19 Pollution from inappropriate sewage


20 Agriculture : fertilizers and dead zones Algal blooms
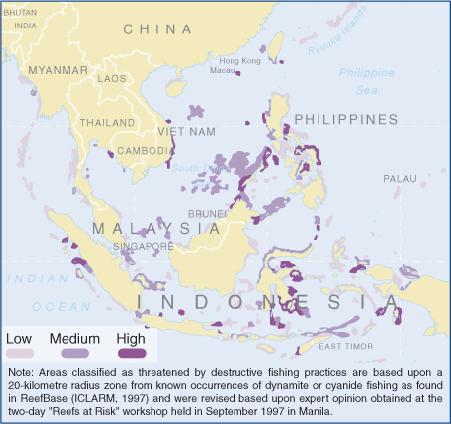
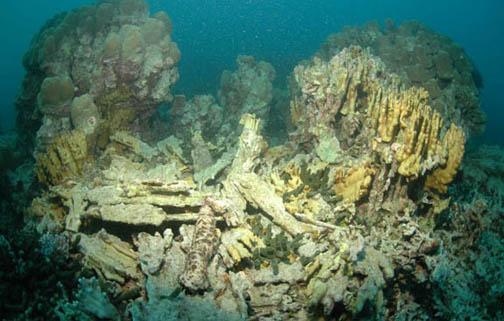
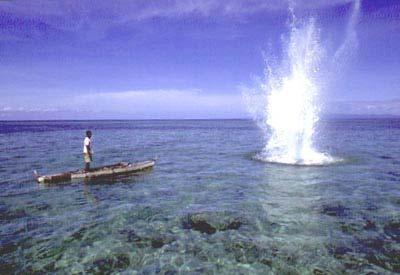
21 Unsustainable fishing practices The use of explosive fishing and reefs impacts
22 Water quality: poor water quality in coastal areas can lead to rapid degradation of habitats and biodiversity which negatively impact many economic activities and livelihoods. Soil erosion: rapid land-use changes and coastal development occurring in Caribbean countries can lead to increased runoff and erosion, with the problem of increased release of sediments into the marine environment. Chemical pollution: Unsustainable agricultural practices (excessive and/or inappropriate use of fertilizers, pesticides and other agrochemicals) add chemical compounds to the sediment load. Also from drainage, sewage, hydrologic modification, or even from marinas and boating activities.this could increase the toxicity of these sediments, making them an even greater environmental threat. Decline of ecosystems: coral reefs, coastal ecosystems, fish stocks are being depleted. Threats to food supply, tourism industry and other livelihood.
23 2. Can ecosystems help?

24 Wall for stabilizing slopes
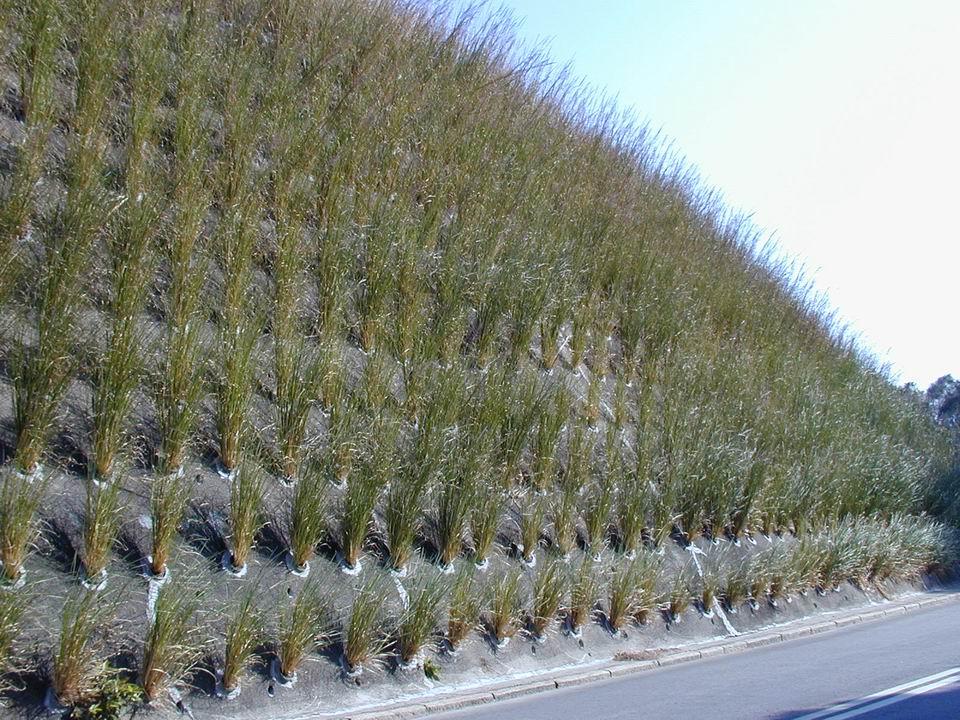
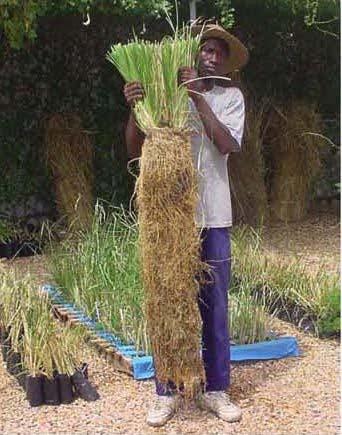
25 or using vegetation?

26 Roots stabilize the slope, remove water from the soil, increase infiltration, canopy protect from rain energy

27


28 Submerged sea wall or coral restoration? Value Beach protection Construction Costs Maintenance Biodiversity Esthetic / Touristic Carbone storage Sea wall Yes 1 year? Yes No No No Coral Yes 5 years 2.5 millions (7km) No (protection) Yes Yes, divers + snorkellers Yes
29 Ecosystems: the no regret option Natural and environmental friendly Cost effective Easy, can be done with local population. Low (if any) maintenance Esthetical value Carbon storage Support biodiversity Multiple services
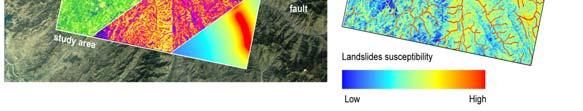
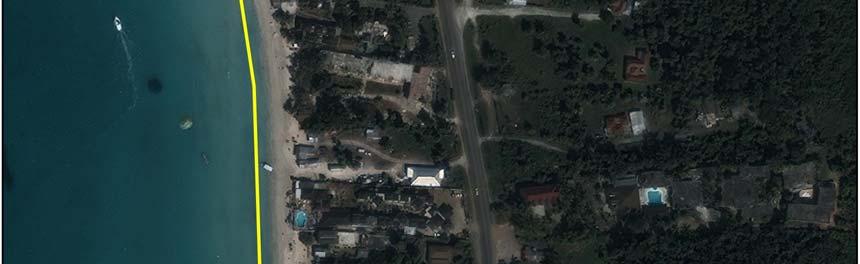
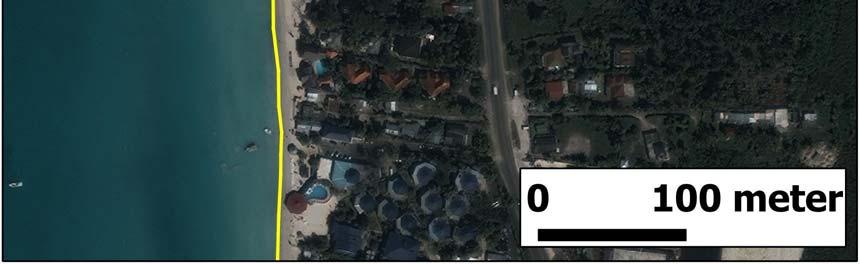
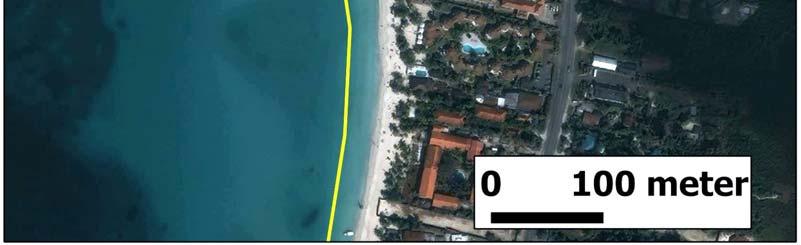
30 3. How to quantify the role of ecosystems? The example of beach erosion in Negril (Jamaica)
 Observation")
31 Negril Erosion rate between : 0.5 and 1 m/yr (large temporal and spatial variability; Smith Warner International, 2007) Observation , shows that beach erosion continues (UNEP, 2010)
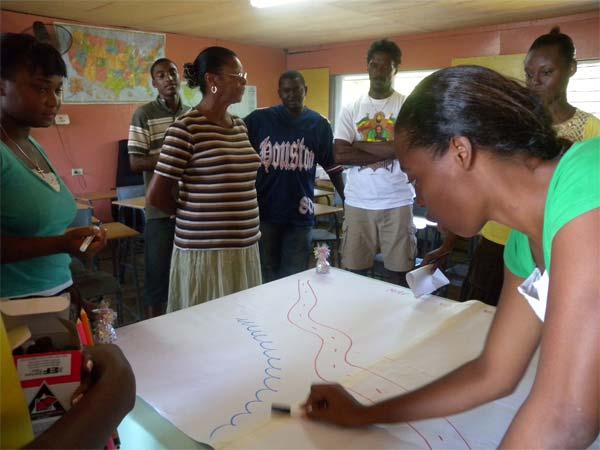
32 consultations of Jamaican Experts & Local Community
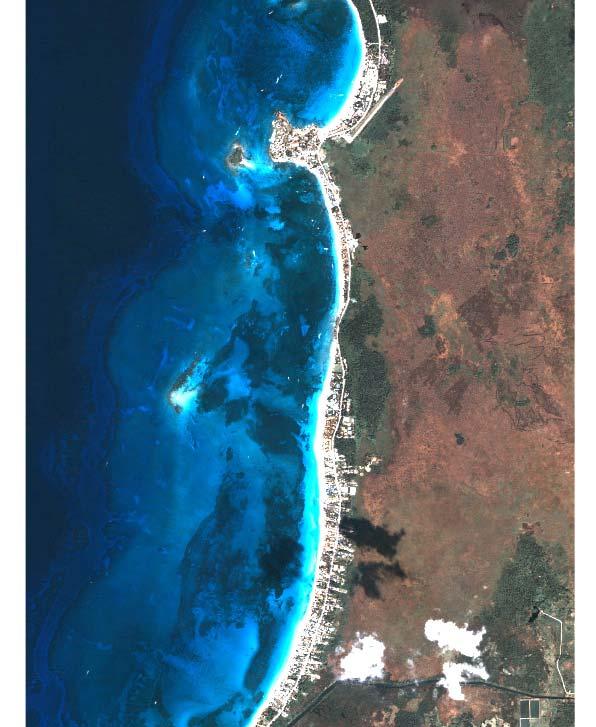
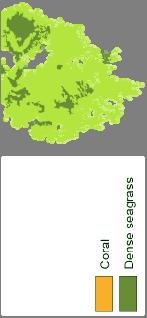

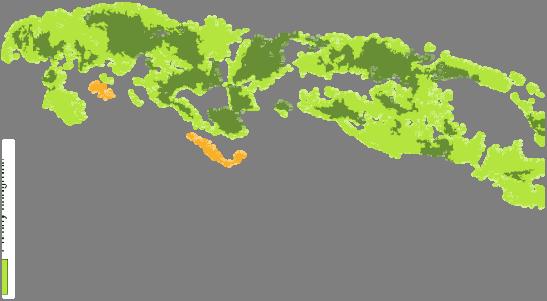
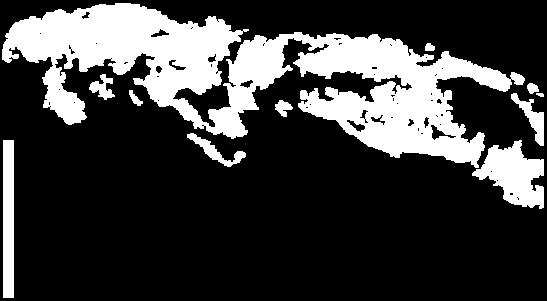

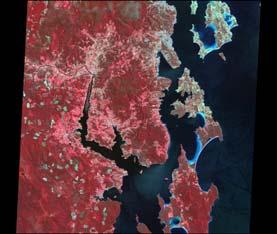
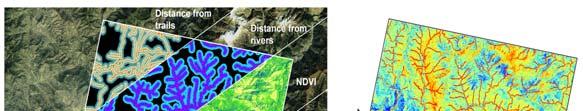
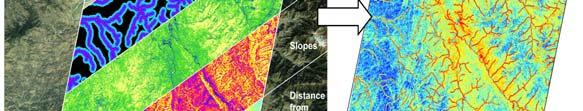
33 Data extraction Satellite imagery Profiles 6m depth Erosion To classify marine ecosystems GIS analysis Data retrieval and remote sensing to identify erosion rate
34 Multiple regression analysis Erosion rate behind sea grass The model explains 41% of the erosion (correlation r=0.64). Sea grass, slopes and waves were selected as significant parameters in the model. Sea grass plays the main role (47%): the wider the sea grass the less the erosion.
35 Multiple regression analysis Erosion rate behind coral The model explains 83% of the erosion (correlation r=0.91). Coral width and slopes were selected as significant parameters in the model. Width of coral plays the main role (59%): the wider the coral the less the erosion. Coral is 23.5 times more efficient than sea grass Global Change & at Vulnerability mitigating Unit, UNEP/GRID-Geneva, beach erosion.
36 Multiple regression analysis Erosion rate behind coral The model explains 83% of the erosion (correlation r=0.91). Coral width and slopes were selected as significant parameters in the model. Width of coral plays the main role (59%): the wider the coral the less the erosion.
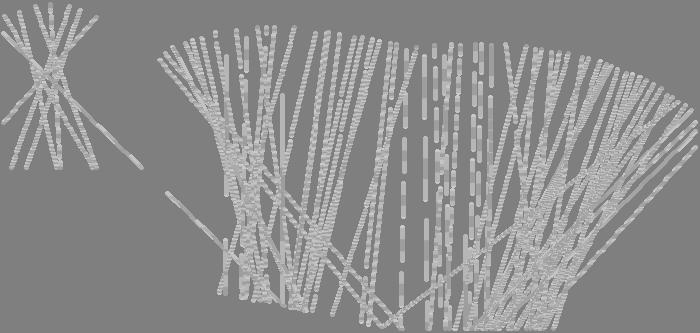
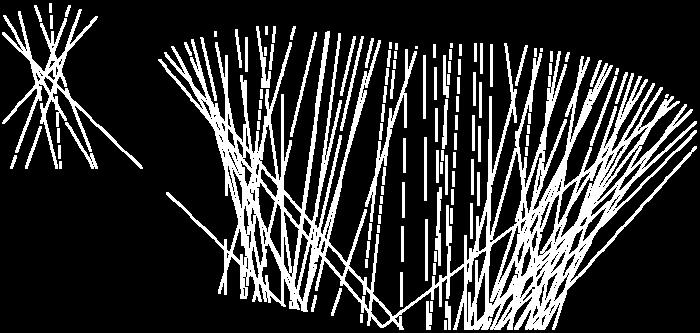
37 Coastal ecosystem importance: beach protection by seagrass meadows Without meadows Fig. 11. Modelled bed shear stress (force per unit area) (SBEACH mode (wave height 1 m, period 6s) in the Negril coastal zone With meadows The seagrass meadows spread the wave force on wider area and dissipate wave energy
38 Coastal ecosystem importance: beach protection by coral reefs Waves H=2.8 m, T= 8.7s Sea level rise 1m Fig. 9b. Modelled bed shear stress (force per unit area) (SBEACH model) induced by waves in the Negril coastal zone, showing the protection effects of inshore coral reefs
39
40
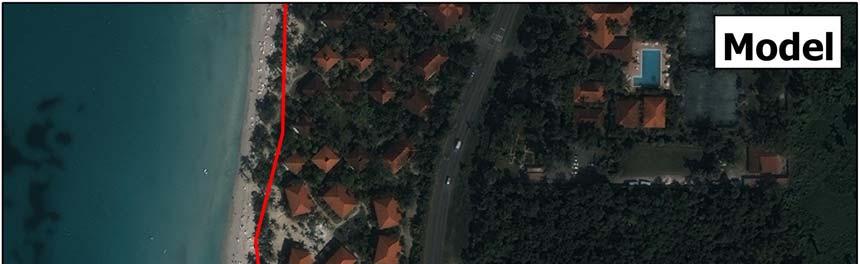
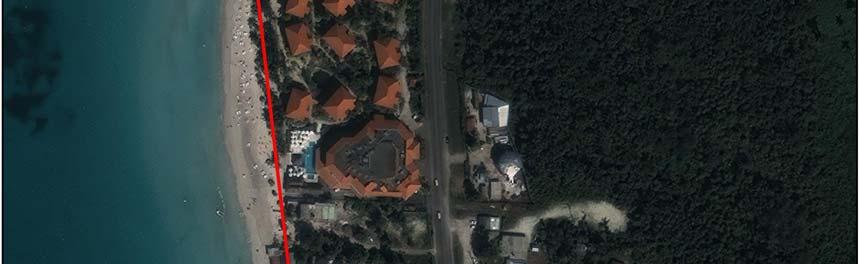
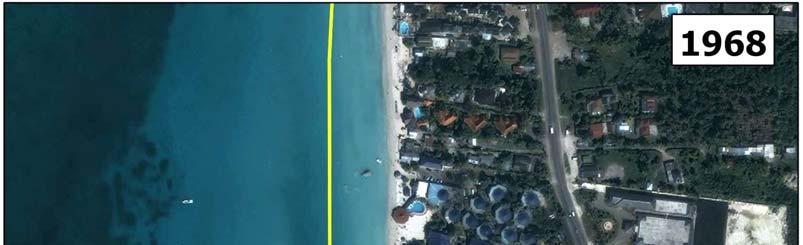
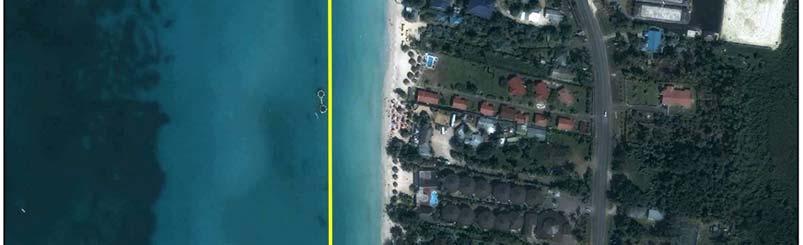
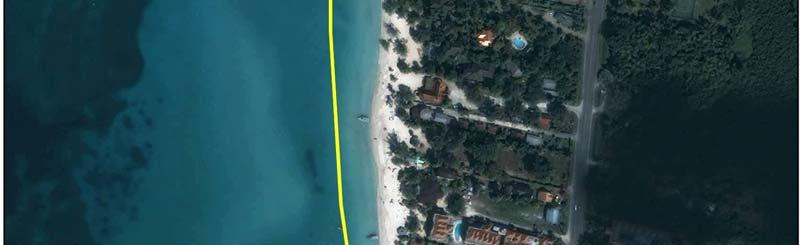
41 Different scenarios on sea grass Negril beach erosion (the role of sea grass) Current situation Beach 1968 Scenario End of beach ( )

42 Coastal ecosystems: the security belts Jamaica Coastal and marine ecosystems provide natural protection against wave energy, reduces storm surges and mitigate beach and soil erosion Seagrass Coral they also offer other services such as storing carbon, have aesthetic values, are home of biodiversity, recreational activities, production of sand, support fisheries, water filtration.
43 Coastal ecosystems: the security belts Jamaica Coastal and marine ecosystems provide natural protection against wave energy, reduces storm surges and mitigate beach and soil erosion Seagrass Coral they also offer other services such as storing carbon, have aesthetic values, are home of biodiversity, recreational activities, production of sand, support fisheries, water filtration.
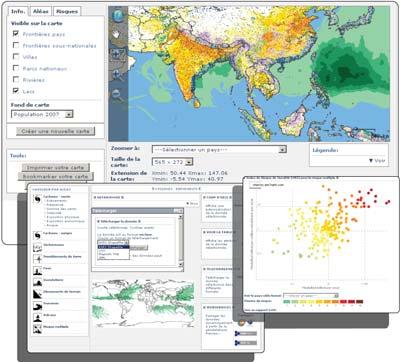
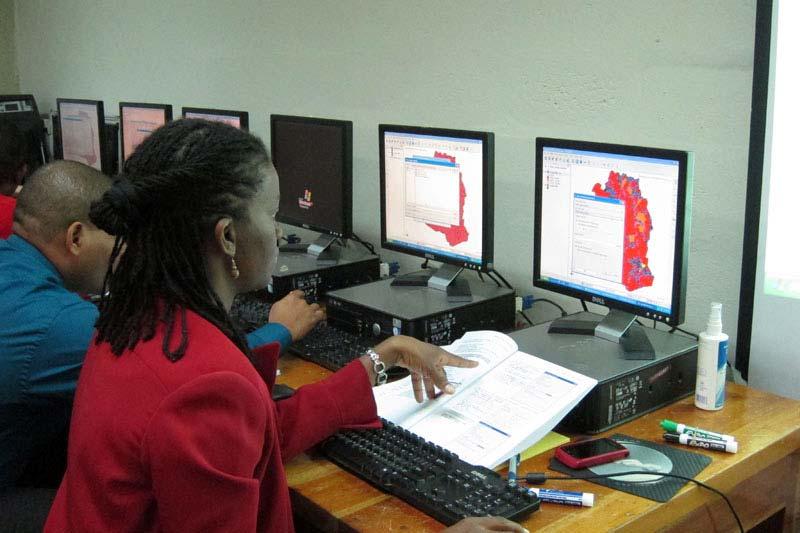
44 4. RiVAMP capacity building empowering people


45 What we provide: RiVAMP Training with 21 participants Kingston 5 8 December 2012 Online training More than 20 people trained OpenSource software Data collected and centralized Methodology in a step by step training manual What we can assist but not provide: Land based scoping mission Negril 9 11 December 2012 Political willingness Commitment to environmental governance Training material

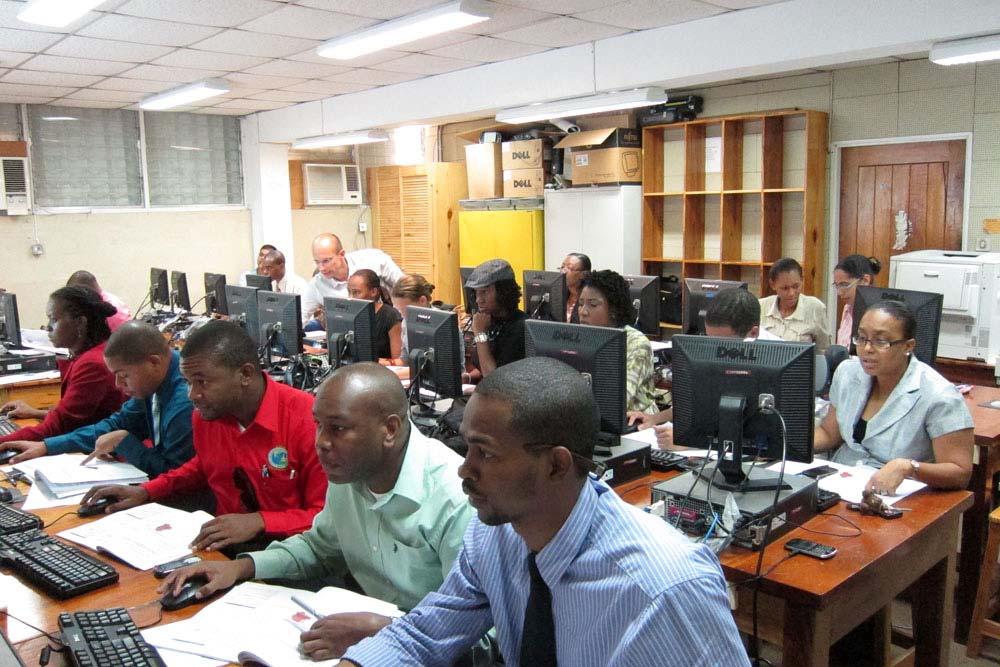
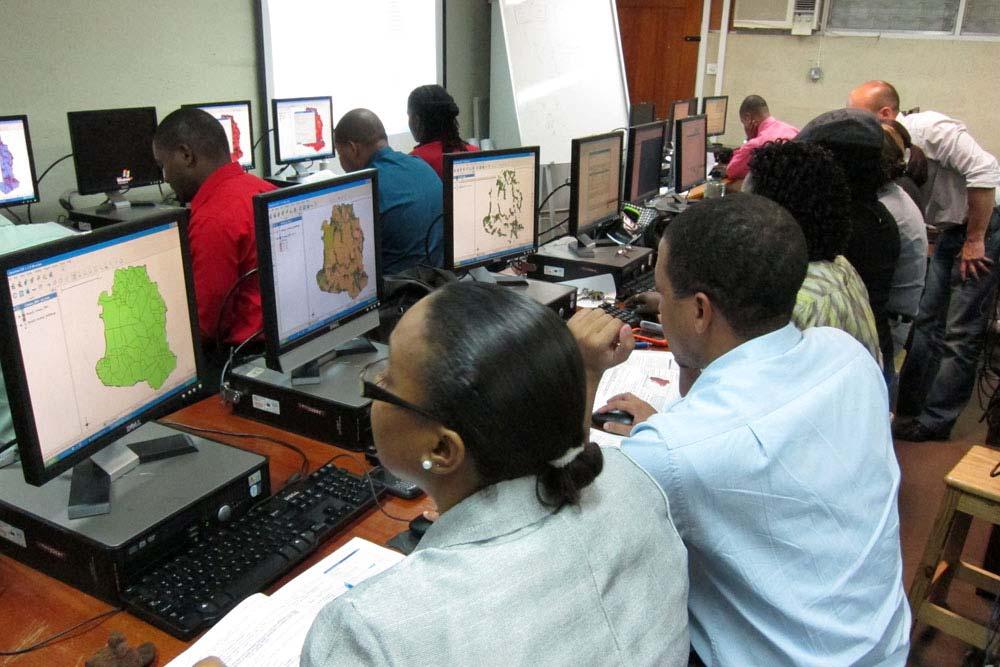
46 RiVAMP training (Kingston, 5-8 Dec. 2011)

47 RiVAMP Let s make it happened!