Minnesota Power Systems Conference Great River Energy s Distributed Generation Pilot Program. Bob Sandberg Manager of Corporate Services
|
|
|
- Clyde Lester
- 5 years ago
- Views:
Transcription
1 Minnesota Power Systems Conference Great River Energy s Distributed Generation Pilot Program Bob Sandberg Manager of Corporate Services
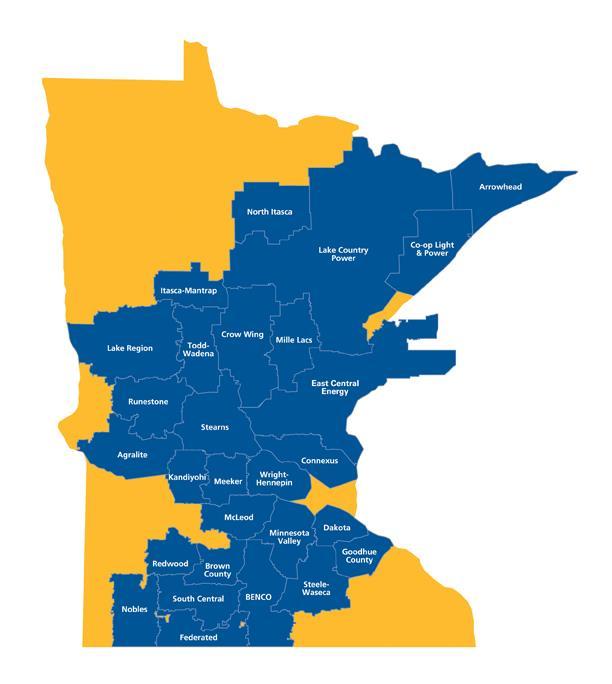
2 Great River Energy 28 member cooperatives 1.7 million people 4th largest G&T in the nation $3.7 billion total assets $2.7 billion total debt $980.4 million revenue 880+ employees (MN and ND) 3,619 MW generation 468 MW wind 4,600+ miles transmission 2

3 Great River Energy generation resources 3


 Load growth planning 3.")
4 21 st century electric utility environment Evolving & challenging Wholesale marketplace Federal & state legislation Conservation initiatives Technology savvy consumers 4 Traditional utility model 1.) Maintain assets 2.) Load growth planning 3.) Least cost supply New technologies & mandates
5 Traditional generation assets The shift is on Central station power Coal Natural gas Nuclear Grid distributed energy assets Utility scale wind Community solar Pumped hydro storage On-Site DG kw scale solar Micro CHP Battery storage Microgrids 5

6 $/kwh Present Market economics Blurred lines $ DG: Solar Future Incentives $.11 Retail Energy Cost of DG vs. average retail electricity rate $.35 $.00 Wholesale 6


7 7 What should utilities do?
8 GRE DG initiative Focus on customer side of meter Solar Community & residential Distributed combined heat & power (CHP) Micro (1 to 500 kw) Storage Battery 8
9 Phase 1 Solar initiatives Maple Grove project Research and demonstration focus Develop internal skills to execute solar projects Member cooperative projects 20 kw projects owned by GRE Focus: Standardized approached Regional/local visibility 9

10 Maple Grove solar project Completed May 30,
 = 258 kw (AC) Suniva- 95.")
11 Maple Grove solar project kw (DC) = 258 kw (AC) Suniva kw tenksolar- 123 kw Sharp- 54 kw 11

12 12 Solar output 15 minute interval data

13 13 Solar output 15 minute interval data
14 14 Solar output 1 second interval data
15 Significant power swings Real Power (kw) Power Swing Summary 99% output 36% output 12 seconds 98% output 34 seconds 12 seconds 51% output 31 seconds 98% output 15

16 16 Maple Grove solar project Energy usage
17 Maple Grove solar project Lessons learned/being learned Solar industry is very dynamic Equipment availability, regulations, company staying power Large pricing variances across suppliers and installers Many industry topics yet to be resolved Reliability/battery storage, smart inverters, power quality / harmonics, design approaches / standards, and metering requirements Life cycle costs? Ongoing O&M, panel life expectancy What are the seasonal impacts? Where do utilities participate? Large projects (1 MW+) vs. small projects (<40 kw) 17


18 18 Membership projects
19 Membership projects Objective Introduce solar throughout GRE membership Acquire small scale solar installation knowledge How and where does the utility participate? Study regional system impact Maximize efficiency & economies of scale: Template design, bulk equipment orders, & 3 rd party financing Offer a community solar option Members can bring on additional solar at incremental price 19

20 20 Completed installations to date Kandiyohi Power Cooperative

21 21 Completed installations to date Lake Country Power
22 Financing options explored Goal: monetize incentives Providers: CoBank Structure: Lease CoBank owns asset on day 1 10 year operating lease is entered into Buyout in yr 10 (20% initial cost) Tax Equity Financing Providers: NRCO Federated Structure: LLC & blocker corp. develop Assets held in Blocker corp. Asset buyout in yr 6/7 PPA from LLC to owner Providers: Self Financed Financial Institutions Structure: Financed 20 90/10 (Debt/Equity) No Monetization of incentives Investment Summary: Owner: No upfront capital CoBank: Finances 100% cost Investment summary: T.E: 55% of project cost Owner: 45% of project cost Investment summary: GRE: 100% of project costs 22

23 GRE micro CHP initiative Residential, small commercial Explore non intermittent DG technologies Reciprocating engine, microturbine, fuel cells Evaluate business models 3 rd party ownership Risk mitigation Minimal integration cost year life expectancy Minimal O&M 23


24 CHP technology options Micro turbine Honda fuel cell Ceramics fuel cell NRG Beacon 10 24
25 Pursue partnerships EPRI R&D project participation Define & analyze technical & economic case for DG Understand technology options and associated requirements, performance and relative economics Potential for future phases involving lab & pilot testing Pilot natural gas-fueled micro CHP technology 25 Market-ready technology 1 kw to 100 kw Requires minimal integration & engineering 10+ year life, minimal O&M
26 Next steps Solar: Complete membership projects Install storage technology to compliment solar Explore utility scale project for 2017/2018 CHP 1 MW plus Leverage NRECA SUNDA initiative Leverage ERPI efforts Seek partnership with vendors to pilot technology 26